NANYANG TECHNOLOGICAL UNIVERSITY School of Civil and Structural Engineering TABLE OF CONTENTS Safety in transportation laboratory ……………………………………. i Flexible pavement ……………………………………………………... ii Penetration of bituminous materials …………………………………… 1 Softening point of bitumen ……………………………………………. 6 Aggregate impact test, ten percent fines and aggregate crushing tests …. 10 Sand equivalent test …………………………………………………… 16 Abrasion of surfacing aggregates ……………………………………… 20 Skid resistance test …………………………………………………….. 23 Preparation of specimens for Marshall test ……………………………. 30 Marshall stability and flow of bituminous mix ……..……………………... 40 ********************************* SAFETY IN TRANSPORTATION LABORATORY When using bitumen at temperatures up to 200 o C, there is always a possibility of burns from splashes or even a fire. Caution and common sense will prevent any mishap but certain rules must be followed: • Stand well clear of people handling hot bitumen or taking readings • Long trousers and shoes are prescribed attire • Use the gloves provided • In the event of a burn from hot bitumen, get the affected part under a running water tap as quickly as possible (every second counts) • In the event of equipment or clothes catching fire, smother the flames with the fire blanket and switch off any electrical power source affected. Complied by: Dr Wong Yiik Diew, January 2001
Transcript
NANYANG TECHNOLOGICAL UNIVERSITY
School of Civil and Structural Engineering
TABLE OF CONTENTS
Safety in transportation laboratory ……………………………………. i
Flexible pavement ……………………………………………………... ii
Penetration of bituminous materials …………………………………… 1
Softening point of bitumen ……………………………………………. 6
Aggregate impact test, ten percent fines and aggregate crushing tests …. 10
Sand equivalent test …………………………………………………… 16
Abrasion of surfacing aggregates ……………………………………… 20
Skid resistance test …………………………………………………….. 23
Preparation of specimens for Marshall test ……………………………. 30
Marshall stability and flow of bituminous mix ……..……………………... 40
*********************************
SAFETY IN TRANSPORTATION LABORATORY
When using bitumen at temperatures up to 200oC, there is always a possibilityof burns from splashes or even a fire. Caution and common sense will preventany mishap but certain rules must be followed:
• Stand well clear of people handling hot bitumen or taking readings
• Long trousers and shoes are prescribed attire
• Use the gloves provided
• In the event of a burn from hot bitumen, get the affected part under arunning water tap as quickly as possible (every second counts)
• In the event of equipment or clothes catching fire, smother the flames withthe fire blanket and switch off any electrical power source affected.
Complied by: Dr Wong Yiik Diew, January 2001
i
Figure 1. Flexible pavement
* Optional treatment for very poor subgrades
TYPICALLAYER NAME
Surfacing –Wearing Course
Surfacing -Basecourse;Binder Course
Base; Roadbase
Sub-base(possiblymore than
one)
(Geotextile)*
Subgrade
TYPICALMATERIAL
Asphalt Concrete(LTA : W3B)
Asphalt Concrete(LTA : B1)
(Emulsion Tack-Coat)
Crushed AggregateCrusher-Run
Cement Bound BaseLean Concrete
Natural SandGravel
Crushed RockCrushed ConcreteHardcore (clean)
“Terra Firma”*
Natural SoilImported Fill
Stabilised Soil*
ii
Penetration of Bituminous Materials
1
NANYANG TECHNOLOGICAL UNIVERSITYSchool of Civil and Structural Engineering
LABORATORY - PAVEMENT MATERIALS
PENETRATION OF BITUMINOUS MATERIALS
OBJECTIVES
To examine the consistency of a sample of bitumen by determining the distancein tenths of a millimetre that a standard needle vertically penetrates the bitumenspecimen under known conditions of loading, time and temperature.
BACKGROUND
This is the most widely used method of measuring the consistency of abituminous material at a given temperature. It is a means of classification ratherthan a measure of quality. (The engineering term consistency is an empiricalmeasure of the resistance offered by a fluid to continuous deformation when it issubjected to shearing stress). The consistency is a function of the chemicalconstituents of a bitumen, viz. the relative proportions of asphaltenes (highmolecular weight, responsible for strength and stiffness), resins (responsible foradhesion and ductility) and oils (low molecular weight, responsible for viscosityand fluidity). The type and amount of these constituents are determined by thesource petroleum and the method of processing at the refinery.
Penetration is related to viscosity and empirical relationships have beendeveloped for Newtonian materials. If penetration is measured over a range oftemperatures, the temperature susceptibility of the bitumen can be established.The consistency of bitumen may be related to temperature changes by theexpression
log P = AT + K . . . (1)where
P = penetration at temperature TA = temperature susceptibility (or temperature sensitivity)K = constant
A Penetration Index (PI) has been defined for which the temperaturesusceptibility would assume a value of zero for road bitumens, as given by
PI =−
+20 1 25
1 50
( )
( )
A
A. . . (2)
Penetration of Bituminous Materials
2
The value of A (and PI) can be derived from penetration measurements at twotemperatures, T1 and T2, using the equation
21
21
T-T
)Tat (pen log)Tat (pen logA
−= . . . (3a)
Research has shown that, for conventional paving grade bitumens, the Ring-and-Ball Softening Point temperature is the same as that which would give apenetration of 800 d-mm. This, together with the penetration at 25 oC, can beused to compute A where
point softening ASTM25
800 log - C)25 at (pen logA
0
−= . . . (3b)
The nomograph as given in Figure 1 enables the PI to be deduced approximatelyfrom the penetration at 25 oC and the softening point temperature. Typicalvalues of PI are
Bitumen type PI
Blown Bitumen >2
Conventional Paving Bitumen -2 to +2
Temperature Susceptible Bitumen (Tars) <-2
PI values can be used to determine the stiffness (modulus) of a bitumen at anytemperature and loading time. It can also, to a limited extent, be used to identifya particular type of bituminous material. One drawback of the PI system is that ituses the change in bitumen properties over a relatively small range oftemperatures to characterise bitumen; extrapolations to extremes of thebehaviour can sometimes be misleading.
SUMMARY OF TEST METHOD (ASTM 1988)
The sample is melted and cooled under controlled conditions. The penetration ismeasured with a penetrometer by means of which a standard needle is applied tothe bitumen specimen under specific conditions.
Penetration of Bituminous Materials
3
Figure 1. Nomograph for the Penetration Index of bitumen (Whiteoak, 1990)
Draw a line between the softening point (line 'A')and penetration (line 'B') values. The intercept online 'C' is the PI of the bitumen
A
B
C
Penetration of Bituminous Materials
4
PROCEDURE
The penetration apparatus (Figure 2) is specified in many standards throughoutthe world but has always the same basic requirements as ASTM D5.
1. Specimens are prepared in sample containers exactly as specified (ASTMD5-97) and placed in a water bath at the prescribed temperature of test for 1to 1.5 hours before the test.
2. For normal tests the precisely dimensioned needle, loaded to 100 ± 0.05 g,is brought to the surface of the specimen at right angles, allowed topenetrate the bitumen for 5 ± 0.1 s, while the temperature of the specimenis maintained at 25 ± 0.1 oC. The penetration is measured in tenths of amillimetre (deci-millimetre, d-mm).
3. Make at least three determinations on the specimen. A clean needle is usedfor each determination. In making repeat determinations, start each with thetip of the needle at least 10 mm from the side of the container and at least10 mm apart.
Figure 2. Apparatus for the bitumen penetration test
(25 C)
100g
Asphalt Cement(25 C) Asphalt Cement
100g
Start After 5 seconds
Penetration in units of 0.1 mm
Penetration of Bituminous Materials
5
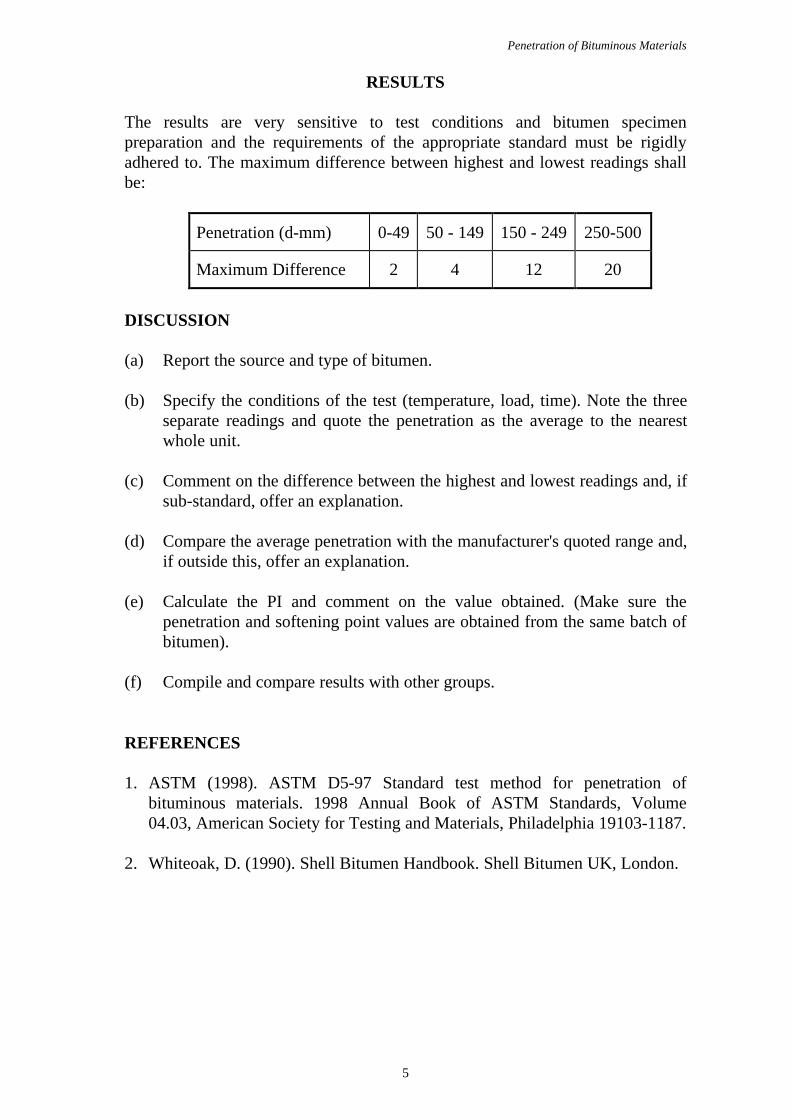
RESULTS
The results are very sensitive to test conditions and bitumen specimenpreparation and the requirements of the appropriate standard must be rigidlyadhered to. The maximum difference between highest and lowest readings shallbe:
(b) Specify the conditions of the test (temperature, load, time). Note the threeseparate readings and quote the penetration as the average to the nearestwhole unit.
(c) Comment on the difference between the highest and lowest readings and, ifsub-standard, offer an explanation.
(d) Compare the average penetration with the manufacturer's quoted range and,if outside this, offer an explanation.
(e) Calculate the PI and comment on the value obtained. (Make sure thepenetration and softening point values are obtained from the same batch ofbitumen).
(f) Compile and compare results with other groups.
REFERENCES
1. ASTM (1998). ASTM D5-97 Standard test method for penetration ofbituminous materials. 1998 Annual Book of ASTM Standards, Volume04.03, American Society for Testing and Materials, Philadelphia 19103-1187.
NANYANG TECHNOLOGICAL UNIVERSITYSchool of Civil and Structural Engineering
LABORATORY - PAVEMENT MATERIALS
SOFTENING POINT OF BITUMEN
OBJECTIVES
To determine the softening point of bitumen within the range 30 to 157 oC bymeans of the Ring-and-Ball apparatus.
BACKGROUND
Unlike some substances (e.g. water which changes from solid to liquid at 0 oC)bituminous materials do not have a definite melting point. Instead, as thetemperature rises, these materials slowly change from brittle or very thick andslow-flowing materials to softer and less viscous liquids. For this reason, thedetermination of 'softening point' must be made by a fixed, arbitrary and closelydefined method if results are to be comparable.
Being very simple in concept and equipment, the Ring-and-Ball Test hasremained a valuable consistency test for control in refining operations,particularly in the production of air-blown bitumens. It is also an indirectmeasure of viscosity or, rather, the temperature at which a given viscosity isevident. The softening point value has particular significance for materials whichare to be used as thick films, such as joint and crack fillers and roofing materials.A high softening point ensures that they will not flow in service. For a bitumenof a given penetration (determined at 25 oC), the higher the softening point thelower the temperature sensitivity
Research has shown that, for conventional paving grade bitumens, the Ring-and-Ball softening point temperature is the same as that which would give apenetration of 800 d-mm. This, together with the penetration at 25 oC, can beused to compute the Penetration Index.
Softening Point of Bitumen
7
SUMMARY OF TEST METHOD (ASTM 1988)
Two horizontal disks of bitumen, cast in shouldered brass rings, are heated at acontrolled rate in a liquid bath while each supports a steel ball. The softeningpoint is reported as the mean of the temperatures at which the two disks softenenough to allow each ball, enveloped in bitumen, to fall a distance of 25 mm.
PROCEDURE (Figure 1)
1. Specimens are prepared exactly as specified (ASTM D36-95) in preciselydimensioned brass rings and maintained at a temperature of not less than 10oC below the expected softening point for at least 30 minutes before thetest.
2. The rings and assembly, and two ball bearings, are placed in a liquid bathfilled to a depth of 105 ± 3 mm and the whole maintained at a temperatureof 5 ± 1 oC for 15 minutes. [Freshly boiled distilled water is used forbitumen with a softening point of 80 oC or below, and glycerine is used forsoftening point greater than 80 oC].
3. A 9.5 mm steel ball bearing (weighing 3.50 ± 0.05 g) is centered on eachspecimen and heat is then applied to the beaker so as to raise thetemperature by 5 ± 0.5 oC per minute.
4. The temperature at which each bitumen specimen touches the base plate isrecorded to the nearest 0.2 oC.
RESULTS
Rigid adherence to the prescribed preparation of specimens and heating isabsolutely essential for reproducibility of the results. The mean temperature ofthe two specimens (which shall not differ by more than 1 oC) is recorded as thesoftening point.
This temperature is to be used in conjunction with the penetration value to obtainthe Penetration Index (PI).
Softening Point of Bitumen
8
Figure 1. Apparatus for the bitumen Softening Point Test (Millard, 1993)
DISCUSSION
(a) Report the source and type of bitumen.
(b) Report the bath liquid used in the test and quote the mean softening point ofyour specimen. Comment on the value obtained.
(c) If the two test temperatures differ by more than 1oC, offer an explanation.
(d) Compile and compare results from other group(s).
Softening Point of Bitumen
9
REFERENCES
1. ASTM (1998). D36-95 Standard test method for softening point of bitumen(Ring-and-Ball Apparatus). 1998 Annual Books of ASTM Standards, VolumeV04.04, American Society for Testing and Materials, Philadelphia, PA19103-1187.
2. Millard, R.S. (1993). Road building in the Tropics. Transport ResearchLaboratory State-of-the-art Review 9, HMSO, London.
3. PWD (1992). PWD General Specification. Public Works Department,Singapore 1987 (with amendments, 1992).
Table 1: Requirements for 60/70 penetration grade bitumen (PWD 1992)
Property Requirement
Penetration at 25 oC, 100g, 5 s (deci-millimetre, d-mm) 60-70
Softening Point, ring and ball (oC) 47-56
Flash Point, Cleveland open cup (oC) Min. 232
Thin film oven test , 3.2 mm at 163 oC for 5 hours
• Loss on heating (% by mass)
• Penetration of residue at 25 oC (% of original penetration)
• Ductility of residue at 25 oC at 5 cm/min (cm)
Max. 0.8
Min. 54
Min. 50
Solubility in trichloroethylene (% by mass) Min. 99
Specific gravity at 25 oC 1.0-1.11
Impact, 10% Fines & Crushing Tests
10
NANYANG TECHNOLOGICAL UNIVERSITYSchool of Civil and Structural Engineering
LABORATORY - PAVEMENT MATERIALS
AGGREGATE IMPACT TEST, TEN PERCENT FINES TESTAND AGGREGATE CRUSHING TEST
OBJECTIVES
To assess the resistance of an aggregate to mechanical degradation by theAggregate Impact Test, Ten Percent Fines Test and Aggregate Crushing Test.
BACKGROUND
When a road aggregate has been manufactured to a specified grading it isstockpiled, loaded into trucks, transported, tipped, spread and compacted. If theaggregate is weak, some degradation may take place and result in a change ingrading and/or the production of excessive and undesirable fines. Thus, anaggregate complying with a specification at the quarry may fail to do so when itis in the pavement.
Granular base layers and surfacings are subjected to repeated loadings from trucktyres and the stress at the contact points of aggregate particles can be quite high.These crushing tests can reveal aggregate properties subject to mechanicaldegradation of this form. The table below indicates some requirements.
Country Material Requirements
UK Structural PC concrete 10% Fines Force > l00kN
Other PC concrete 10% Fines Force > 50kN
Road bases 10% Fines Force > 50kN
Bituminous Surfacing BSI Abrasion Test
NZ PC concrete 10% Fines Force > 130kN
Road bases 10% Fines Force > 130kN
Sealing chips 10% Fines Force > 230kN
Asphalt concrete Los Angeles Abrasion Test
US All road materials Los Angeles Abrasion Test
Impact, 10% Fines & Crushing Tests
11
Quarry plant such as crushers, screens, conveyors, etc. are all subject to wearand these crushing tests can indicate the magnitude of the problem for designpurposes.
PROCEDURE - Aggregate Impact Value (SS 1974)
1. The apparatus consists of a steel test mould with a falling hammer as shownin Figure 1. The hammer slides freely between vertical guides so arrangedthat the lower part of the hammer is above and concentric with the mould.
Figure 1. Apparatus for the aggregate impact test (Millard, 1993)
Impact, 10% Fines & Crushing Tests
12
2. The material used is aggregate passing a 12.70 mm sieve and retained on a9.52 mm sieve. It shall be clean and dry (washed if necessary) but it mustnot be dried for longer than 4 hours nor at a temperature higher than 110 oCotherwise certain aggregates may be damaged.
3. The whole of the test sample (mass A) is placed in the steel mould andcompacted by a single tamping of 25 strokes of the tamping rod.
4. The test sample is subjected to 15 blows of the hammer dropping 381 mm,each being delivered at an interval not less than one second.
5. The crushed aggregate is sieved over a 2.36 mm sieve. The fraction passing2.36 mm is weighed to the nearest 0.1 g (mass B). The fraction retained onthe sieve is also weighed (mass C). If {A-(B+C)}>1 gram, the result shall bediscarded and a fresh test made. The aggregate impact value (AIV) is
AIV = B
A × 100 (%) . . . (1)
RESULTS
An average is taken of the two tests and the result is recorded to the nearestwhole number as the Aggregate Impact Value.
The AIV is normally about 105 per cent of the Aggregate Crushing Value and itcan be used for the same purpose. For weak aggregates, the required load for thefirst ten per cent fines test can be estimated by means of the formula:
required load (kN) = 4000
AIV. . . (2)
PROCEDURE - Ten Percent Fines Value (SS 1974)
1. The apparatus (Figure 2) consists of a case hardened steel cylinder 154 mmdiameter and 125 mm high together with a plunger which just fits inside thecylinder and a base plate. Other items are a steel tamping bar 16 mmdiameter by 450-600 mm long and a metal measuring cylinder 115 mmdiameter by 180 mm deep. Also required is a compression testing machinecapable of applying a force of up to 500 kN and which can be operated togive a uniform rate of loading so that this force is reached in 10 minutes.
Impact, 10% Fines & Crushing Tests
13
Figure 2. Apparatus for the 10% fines test and aggregate crushing test (Millard, 1993)
2. The material used for both tests is aggregate passing a 12.70 mm sieve andretained on a 9.52 mm sieve. It shall be clean and dry (washed ifnecessary) but it must not be dried for longer than 4 hours nor at atemperature higher than 110 oC otherwise certain aggregates may bedamaged.
3. The required volume is obtained by filling the measuring cylinder in threelayers, each tamped 25 times with the rod and the top struck level. Thisvolume is then weighed to the nearest 0.1g (mass A).
4. The material from the measuring cylinder is placed in the test cylinder inthree layers, each tamped 25 times with the rod. The depth of the samplewill then be about 100 mm. The plunger is lowered onto the sample androtated gently to seat it and level it.
5. The cylinder, plunger and sample are placed in the compression testingmachine. Force is applied at a uniform rate so that the total penetration in10 minutes is about: 15 mm for uncrushed gravel; 20 mm for normalcrushed aggregates; 24 mm for honeycombed aggregates (e.g., some slagand volcanic rocks).
Impact, 10% Fines & Crushing Tests
14
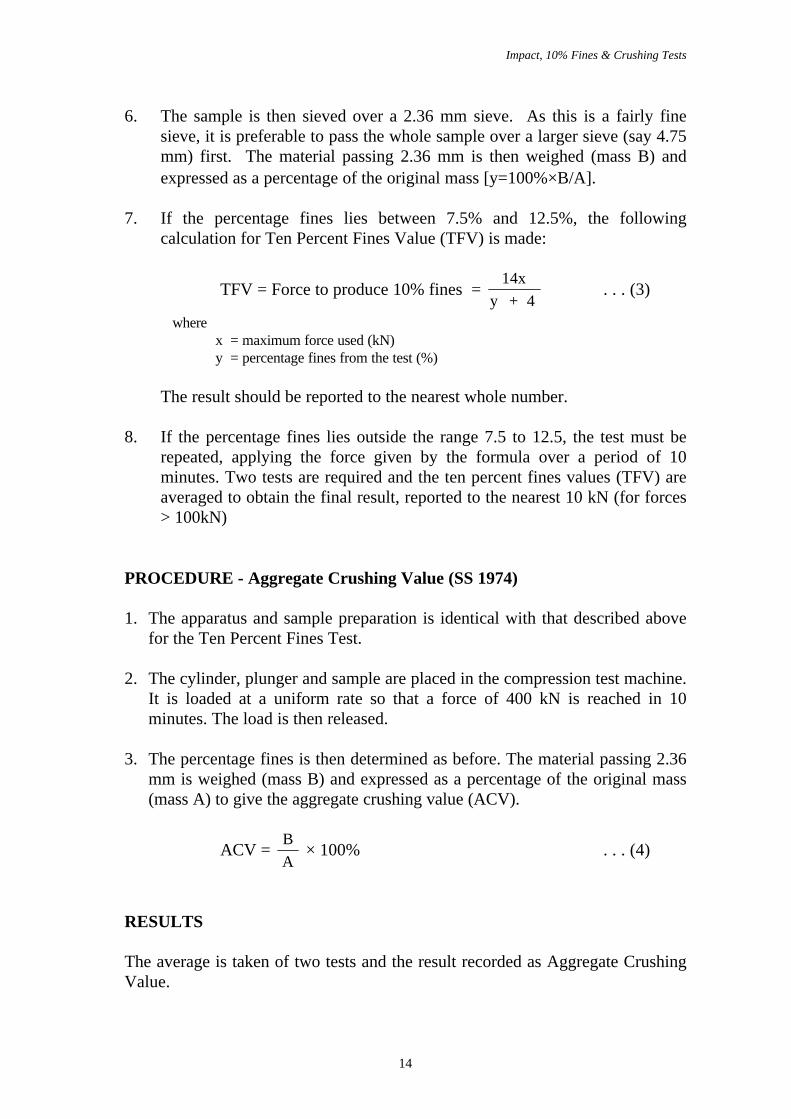
6. The sample is then sieved over a 2.36 mm sieve. As this is a fairly finesieve, it is preferable to pass the whole sample over a larger sieve (say 4.75mm) first. The material passing 2.36 mm is then weighed (mass B) andexpressed as a percentage of the original mass [y=100%×B/A].
7. If the percentage fines lies between 7.5% and 12.5%, the followingcalculation for Ten Percent Fines Value (TFV) is made:
TFV = Force to produce 10% fines = 14x
y + 4 . . . (3)
where x = maximum force used (kN) y = percentage fines from the test (%)
The result should be reported to the nearest whole number.
8. If the percentage fines lies outside the range 7.5 to 12.5, the test must berepeated, applying the force given by the formula over a period of 10minutes. Two tests are required and the ten percent fines values (TFV) areaveraged to obtain the final result, reported to the nearest 10 kN (for forces> 100kN)
PROCEDURE - Aggregate Crushing Value (SS 1974)
1. The apparatus and sample preparation is identical with that described abovefor the Ten Percent Fines Test.
2. The cylinder, plunger and sample are placed in the compression test machine.It is loaded at a uniform rate so that a force of 400 kN is reached in 10minutes. The load is then released.
3. The percentage fines is then determined as before. The material passing 2.36mm is weighed (mass B) and expressed as a percentage of the original mass(mass A) to give the aggregate crushing value (ACV).
ACV = B
A × 100% . . . (4)
RESULTS
The average is taken of two tests and the result recorded as Aggregate CrushingValue.
Impact, 10% Fines & Crushing Tests
15
If the percentage fines exceeds 30, the result may be anomalous as the brokenpieces of aggregate will tend to fill the voids and prevent further crushing. Inthis case, the Ten Percent Fines Test is more appropriate. Some countries, e.g.,Australia and New Zealand, only use the latter test.
DISCUSSION
(a) Report the geological description of the aggregate, the source quarry andparticle size.
(b) Report the applied force, the masses of material before and after sieving,the calculations, and the final result (AIV/TFV/ACV).
(c) Comment on the results.
(d) Compile results from other group(s) and compare the values obtained.
REFERENCES
1. SS (1974). SS73:1974 Specification for methods for sampling and testing ofmineral aggregates, sand and fillers - Determination of aggregate impactvalue, aggregate crushing value and ten percent fines value. SingaporeStandard, Singapore.
2. Millard, R.S. (1993). Road building in the Tropics. Transport ResearchLaboratory State-of-the-art Review 9, HMSO, London.
Sand Equivalent Test
16
NANYANG TECHNOLOGICAL UNIVERSITYSchool of Civil and Structural Engineering
LABORATORY - PAVEMENT MATERIALS
SAND EQUIVALENT TEST
OBJECTIVES
To show the relative proportion of clay-like or plastic fines and silt in granularsoils and fine aggregates by means of a rapid field test known as the SandEquivalent (SE).
BACKGROUND
Most specifications for unbound granular base have requirements concerningrock strength, weathering resistance and grading. The maximum percentagefiner than 0.075 mm usually lies between 7% and 10%. Some specifications gofurther and stipulate a requirement concerning plasticity of this fines material,for example it should be non-plastic or the Plasticity Index should be less than 6.Others have specified the Sand Equivalent, for example, California: not less than45, New Zealand: not less than 40.
The Sand Equivalent Test was devised by Hveem (1953) as a quick test todetermine the "presence of undesirable quantities of adverse clay-like materials... since an excess of clays is usually detrimental to the performance of anyaggregate". Its primary application was for concrete aggregate and sand.O'Harra (1955) applied the test to the fraction of road base aggregates finer than4.75 mm and made correlation of Sand Equivalent with Plasticity Index andpercentage of fines (less than 0.075 mm). He concluded that the quality of apavement aggregate was always satisfactory if SE > 55 and almost alwayssatisfactory if SE > 35 hence, the figures quoted in the previous paragraph forCalifornia and New Zealand.
SUMMARY OF TEST METHOD (ASTM 1998)
A measured volume of soil or fine aggregate and a small quantity of flocculationsolution are poured into a graduated plastic cylinder and are agitated to loosenthe clay-like coatings from the sand particles in the test specimen. The specimenis then ‘irrigated’ using additional flocculation solution forcing the clay-likematerial into suspension above the sand. After a prescribed sedimentation period,
Sand Equivalent Test
17
the height of the clay and sand in the cylinder is determined. The sand equivalentis the ratio of sand height to clay height times 100.
APPARATUS AND WORKING SOLUTION
The principal item of equipment is a transparent plastic cylinder with an insidediameter of 32 mm and a height of 432 mm graduated up to 390 mm by 2 mmdivisions and a rubber stopper to fit.
A weighted foot is also required consisting of a brass rod 445 mm long, having atthe lower end a 25 mm diameter foot with a flat smooth under-surface and aconical upper surface. A cylindrical brass weight 51 mm diameter is attached tothe upper end of the rod to bring the total weight to 1 kg. An irrigator tube isrequired that is made of 6 mm copper or brass tubing long enough to reach thebottom of the cylinder and one end closed by flattening the tube to a wedge-shaped point. Two 1-mm holes are drilled laterally through the flat sides of thewedge. The remainder of the equipment comprises plastic tubing, clamps andcontainers which do not need specifying.
The working flocculation solution consists, per litre of solution,• 2.67 g Anhydrous Calcium Chloride• 12.06 g (9.53 ml) BP Glycerine• 0.28 g (0.26 ml) 40% Formaldehyde Solution (as a preservative).
PROCEDURE
1. The sample must all pass through a 4.75 mm sieve and be in a slightlydamp condition. Where the sample has been separated from a coarsermaterial (such as 40 mm base course) care must be taken to collect all finesadhering to the larger stones. By quartering or preferably using a riffle box,samples are split to provide enough material to fill the measuring containerto within 10 mm of the brim. Extreme care must be taken to obtain trulyrepresentative samples.
2. Start the siphon so that solution will flow through the irrigator tube.
3. Fill 102 ± 3 mm of solution into the cylinder.
4. Pour the test sample into the cylinder and tap the base with heel of the handto release any air bubbles.
5. Leave to stand for 10 ± 1 minutes.
Sand Equivalent Test
18
6. Stopper the cylinder and loosen the material by partially inverting thecylinder.
7. Hold the cylinder horizontally and shake it vigorously from side to side 90cycles in 30 seconds with an amplitude of 23 ± 3 cm. Alternatively, amechanical shaker having a throw of 203.2 ± 1.0 mm and operating at 175± 2 cycles-per-minute may be used in which the cylinder and its contentsare shaken for 45 ± 1 s.
8. Immediately after shaking, set the cylinder upright on the bench and removethe stopper. Insert the irrigator tube and start the flow, rinsing materialfrom the sides of the cylinder above the liquid level. Push the tube to thebottom of the sample. Stab and twist the tube gently with one hand, and atthe same time rotate the cylinder slowly with the other hand. Make sure thefines are dislodged to ‘float’ above the sand column. Remove the irrigatorand allow the liquid level to rise to 380 mm.
9. Allow the cylinder to stand undisturbed and free from vibration for 20minutes ± 15 seconds. Start the timer immediately after withdrawing theirrigator tube.
10. Read and record the level of the top of the silt/clay suspension. This iscalled the "Clay Height", which represents the length of the (clay + sand)column.
11. Lower the weighted foot assembly very gently into thecylinder until it comes to rest on the sand. Read and record the level of theindicator. The level at the top of the sand column, called the "SandHeight", is determined by subtracting 254 mm from the reading of theindicator.
sand
clay
clearsoln
sandheight
h2
clayheight
h1
Sand Equivalent Test
19
12. Calculate the Sand Equivalent:
SE =)(hHeight Clay
)(hHeight Sand
1
2 ×100(%) . . .(1)
The result is quoted to the next higher whole number.
DISCUSSION
(a) Report the source of the aggregate, and any pre-treatment it has received,i.e. sieving, washing, heating, drying, etc.
(b) Report the clay and sand heights and the Sand Equivalent.
(c) Comment on the result.
(d) Compare your results with other group(s)
REFERENCES
1. ASTM (1998). ASTM D2419-95, Standard test method for sand equivalentvalue of soils and fine aggregate. 1998 Annual Book of ASTM Standards,Volume 04.03, American Society for Testing and Materials, Philadelphia19103-1187.
2. Hveem, F.N. (1953). Highway Research Board Proceedings.
3. O’Harra, W.G. (1955). Highway Research Board Proceedings.
Abrasion of Surfacing Aggregates
20
NANYANG TECHNOLOGICAL UNIVERSITYSchool of Civil and Structural Engineering
LABORATORY - PAVEMENT MATERIALS
ABRASION OF SURFACING AGGREGATES
OBJECTIVES
To assess the resistance to crushing and abrasive wear of an aggregate bymeans of the Los Angeles Abrasion Machine.
BACKGROUND
Aggregates are subjected to crushing and abrasive wear during the manufacture,placing and compaction of asphalt paving mixes. They are also subjected toabrasion under traffic loads. There does not appear to be a really satisfactorytest for measuring aggregates' resistance to abrasion but the Los Angeles Test isone of those most commonly applied. This test is both an abrasion and impacttest and appears to be more suitable for aggregates used in the wearing course /surface dressing than for asphalt concrete in other layers. Resistance toabrasion is necessary for maintaining surface macro-texture but (unfortunately)the tougher an aggregate is, the more likely it is to polish under the action ofvehicle tyres.
SUMMARY OF TEST METHOD (ASTM 1994)
A sample of chippings is loaded together with steel balls into a steel drumrevolving on a horizontal axis. The Los Angeles Abrasion Value (LAV) is thepercentage of fines passing the 1.7 mm sieve after a specified number ofrevolutions of the drum at specified speed.
PROCEDURE
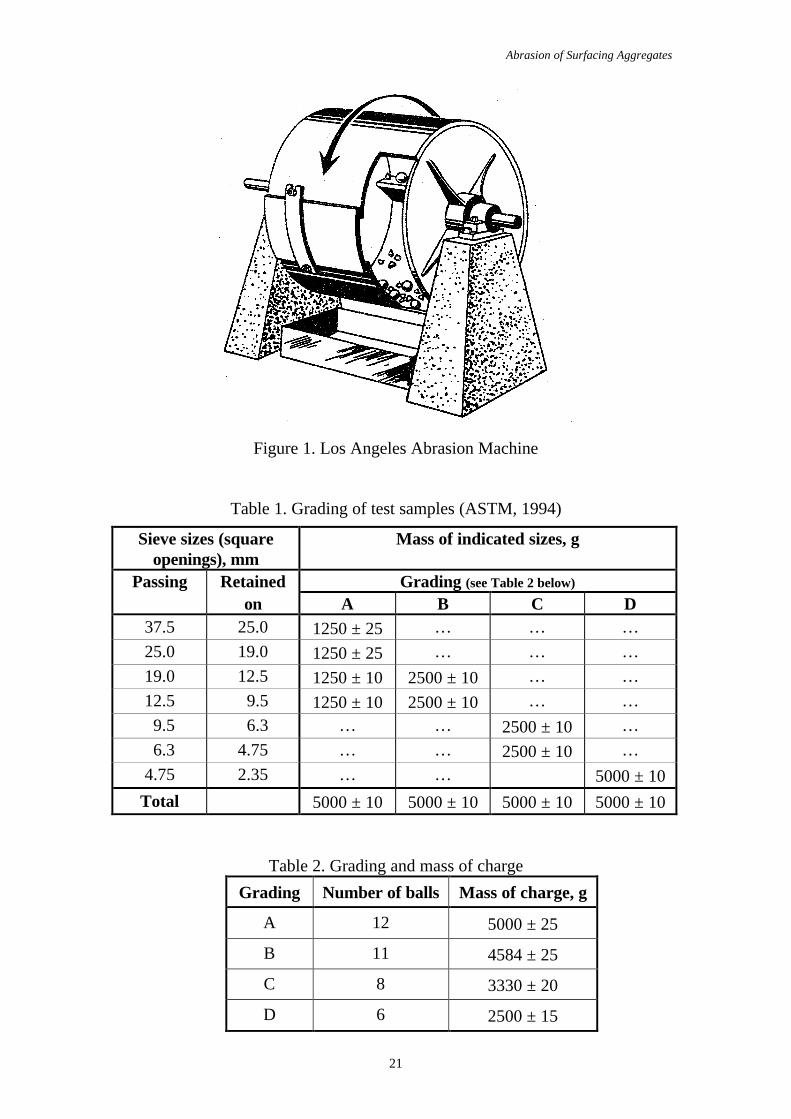
1. The Los Angeles machine (Figure 1) is constructed according to thedimensions and specification of ASTM C131. A washed and oven-driedsample of aggregate, graded according to the job application is weighed(W1) and placed in the drum with the appropriate number of steel balls(46.0 to 47.6 mm diameter, weighing 400 to 440 g each) (Tables 1 & 2).
Abrasion of Surfacing Aggregates
21
Figure 1. Los Angeles Abrasion Machine
Table 1. Grading of test samples (ASTM, 1994)
Sieve sizes (squareopenings), mm
Mass of indicated sizes, g
Passing Retained Grading (see Table 2 below)
on A B C D37.5 25.0 1250 ± 25 … … …
25.0 19.0 1250 ± 25 … … …
19.0 12.5 1250 ± 10 2500 ± 10 … …
12.5 9.5 1250 ± 10 2500 ± 10 … …
9.5 6.3 … … 2500 ± 10 …
6.3 4.75 … … 2500 ± 10 …
4.75 2.35 … … 5000 ± 10
Total 5000 ± 10 5000 ± 10 5000 ± 10 5000 ± 10
Table 2. Grading and mass of charge
Grading Number of balls Mass of charge, g
A 12 5000 ± 25
B 11 4584 ± 25
C 8 3330 ± 20
D 6 2500 ± 15
Abrasion of Surfacing Aggregates
22
2. The drum is rotated for 500 revolutions at a speed of 30 to 33 rpm.
3. After this, the sample is separated on a sieve larger than 1.7 mm (say 4.75mm), then the material passing is washed through a 1.7 mm sieve. If theaggregate is free from dust, the washing requirement may be waived.
4. The material which does not pass the 1.7 mm sieve (and any larger sieveused) is then weighed to the nearest gram (W2).
5. The difference in weight of the sample is expressed as a percentage of theoriginal and is reported as the abrasion value given by
LAV = (W W )
W x 100
1 2
1
−% . . . (1)
6. The results of two tests by the same operator on the same aggregateshould not differ from each other by more than 5.7% of their average. Fortwo different operators/laboratories the difference should not be morethan 12.7% of the average.
DISCUSSION
(a) Report the geological description of the aggregate, the source quarry andparticle size.
(b) Record the original and final weights, and the abrasion value. Commenton any loss in the sample mass in the course of the experiment.
(c) Comment on the LAV value obtained with regard to the aggregate’spotential use. [Local requirements are LAV≤35% for wearing course,LAV≤40% for binder course, and LAV≤45% for road base].
(d) Compare your result with those of other groups and comment on theprecision of the test results.
REFERENCE
1. ASTM (1994). C131-81, Standard test method for resistance todegradation of small size coarse aggregate by abrasion and impact in theLos Angeles Machine. 1994 Annual Books of ASTM Standards, Volume04.03, American Society for Testing and Materials, Philadelphia, PA19103-1187.
Skid Resistance Test
23
NANYANG TECHNOLOGICAL UNIVERSITYSchool of Civil and Structural Engineering
LABORATORY - PAVEMENT MATERIALS
SKID RESISTANCE TEST
OBJECTIVES
To measure texture depth and skid resistance of a road surface using the BSPendulum Skid Resistance Tester and to estimate the vulnerability of anaggregate to polishing under traffic by determining its Polished Stone Value(PSV).
BACKGROUND
Skidding, i.e. loss of adhesion between a vehicle's tyres and the road surface,occurs in many road accidents whether or not it is the actual cause of theaccident. Over the years, tyre manufacturers have done a lot of research intodifferent types of rubber and tread patterns to improve the safety of motorvehicles. Governments have introduced regulations concerning the tread depthand general condition of the tyres. Highway engineers have also researched waysto improve the skid resistance of road surfaces. The impetus for this researchcame from the Transport and Road Research Laboratory (TRRL) of UK. One ofthe first things they did was to devise the Pendulum Skid Tester which, beingportable, can be taken to the site or used in laboratory experiments. This devicesimulates the skid resistance offered by a road surface to a motor car travelling at50 km/h. It gives a number, being a percentage, somewhat akin to a coefficient offriction. Subsequently, they devised the Sideways Force Coefficient RoutineInvestigation Machine (SCRIM). This is a lorry with a fifth wheel set at an angleto the direction of travel and the lateral force on this wheel is measured andrecorded. The lorry travels at 50 km/h and continually monitors the SidewaysForce Coefficient (SFC). Other devices include braking force trailer and the mu-meter. These can be used at the high speeds required for testing airport runways.
With devices to measure skidding resistance, researchers then monitored changesduring the life of road pavements. It was found that skid resistance falls rapidlyafter a road is opened to traffic but the rate of deterioration slows down,eventually settling to a constant value. This latter value is dependent on thesurface texture, rock type and traffic volume. Coarse-textured surfaces offergreater resistance because rainwater drains away better, allowing rubber to stonecontact even at reasonably high speed. Sedimentary rocks (excluding mostlimestones) are better than igneous or metamorphic rocks. All mineral particles
Skid Resistance Test
24
polish but, with sandstone, the small particles get worn off exposing fresh sharpcrystals to the tyres. With igneous rocks, which are tougher, the polishedparticles remain in place. Finally, better correlation has been obtained usingcommercial traffic volumes rather than total traffic.
As highway engineers are concerned about the aggregate, TRRL devised theAccelerated Polishing Machine which simulates the polishing action of tyres, gritand water on road surfaces. Specimens are polished by a rubber tyre with coarsegrit and water for three hours, followed by another three hours using very finegrit. After that, the skid resistance is measured with the pendulum and thereading is called the Polished Stone Value (PSV). Having set target values forskid resistance of road surfaces for various sites and traffic volumes, the Britishauthorities now specify minimum values of PSV for the aggregate used in thesurfacing.
TEXTURE DEPTH (Figure 1)
Procedure (TRRL 1969)
1. Select the spot on the road to be tested, normally in the nearside wheeltrack. Ensure that the area to be tested is dry and free from loose materials.
2. A known volume of sand is spread on the road surface; the average macro-texture depth is calculated from the area of the circular patch produced.[The sand particles are those passing a No. 52 sieve and retained on a No.100 B.S. sieve].
Texture depth =volume of sand
area of patch
Figure 1. Sand-patch method of measuring texture depth
Skid Resistance Test
25
Results
Report the sand circle diameter in millimetre to the nearest 5 mm. Texturesproducing diameters in excess of 350 mm (which cannot be measured accuratelyby this procedure) are to be reported as ‘greater than 350 mm’.
Report the average texture depth to the nearest 0.1 mm. A suggestedclassification of the surface texture is:
Average TextureDepth (mm)
Texture Classification
<0.25 Fine0.25-0.50 Medium
>0.50 Open
SKID RESISTANCE TEST
Procedure (TRRL 1969)
1. Select the spot in which the texture depth has been measured.
2. Set the apparatus (Figure 2) on the road so that the slider will swing in thedirection of traffic flow and level the base screws.
3. Raise the swinging arm clear of the road and clamp in the horizontal position.Release the arm and check that the pointer reads zero.
4. With the pendulum arm free and hanging vertically, place the spacer,attached to a chain on the base of the column, under the lifting handle settingscrew to raise the slider. Lower the head of the tester so that the slider justtouches the road surface and clamp in position. Remove the spacer.
5. Check the sliding length of the rubber slider over the road surface by gentlylowering the pendulum arm until the slider just touches the surface first onone side of the vertical and then on the other. When passing the arm throughthe vertical, use the lifting handle so that the slider does not touch the road.The sliding length should be between 125 and 127 mm. If not, adjust byraising or lowering the head.
6. Place the pendulum arm in the horizontal and clamp in position.
7. Wet the road surface and slider with water.
8. Bring the pointer to its stop then release the pendulum by pressing the button.Take care to catch the arm on its return swing before it hits the ground.
9. Return the arm and pointer to the release position keeping the slider off theroad surface by means of the lifting handle. Repeat the test, wetting thesurface between swings. Record the mean of five successive readings,provided they do not differ by more than three units. If the range is greaterthan this, repeat swings until three successive readings are constant; recordthis value.
10. Record the temperature of the water on the road surface.
Results
The skid resistance value (SRV) is the mean of five readings or the constant ofthree readings as stated above.
As the stiffness of the rubber slider will vary with temperature a correction hasto be made if the temperature is not 20oC. Use the temperature curve (Figure 3)for this purpose.
Skid Resistance Test
27
Figure 3. Skid resistance/ temperature correction relationship (TRRL, 1969)
Discussion – Texture depth and SRV
(a) Describe the site and the nature of the road surface, i.e. material state ofwear, etc.
(b) Describe the average texture depth and texture classification.
(c) Report the temperature-corrected skid resistance value (SRV) and commenton suitability of this value for the current use of the road (see Table 1).Compare results obtained by other group(s).
Table 1. Suggested minimum values of ‘skid resistance’ (measured with theportable tester) (TRRL, 1969)
Category Type of siteMinimum skid
resistance(surface wet)
A
Difficult sites such as:1. Roundabouts2. Bends with radius less than 150 m on
unrestricted roads3. Gradients 1 in 20 or steeper of lengths greater
than 100 m4. Approaches to traffic lights on unrestricted
roads
65
BMotorways, trunk and class 1 roads and heavilytrafficked roads in urban areas (carrying morethan 2000 vehicles per day)
55
C All other sites 45
Skid Resistance Test
28
POLISHED STONE VALUE
Procedure (BSI 1990)
1. As the preparation of specimens and the polishing process (usingaccelerated polishing machine, as shown in Figure 4) takes many hours, thiswill have been done, in accordance with BS 812, in advance of thelaboratory session.
2. The specimen is clamped into the holder in such a way that the slider of thependulum traverses it in the same direction as it has been trafficked in thepolishing machine. The height of the suspension axis of the pendulum isthen adjusted, as described for the road test, so that the slider traverses alength of 76 ± 0.5 mm.
3. The specimen and the slider are then thoroughly wetted and five readings(F scale unit x 100) are taken as described for the road test. The specimenand slider are thoroughly wetted before each reading. The mean of the lastthree readings is then recorded.
4. The mean value as determined is reported as the PSV.
Discussion - PSV
a) Report the geological name, source quarry and description of the rock.
b) Recommend the type of road and traffic volume for which the aggregate isa suitable surfacing material (see Table 2). Use only the polished stonevalue (PSV) in your discussion.
REFERENCES
1. BSI (1990). British Standard BS 812:Part 114:1989 Testing aggregates -Method for determination of the polished-stone value. British StandardsInstitution, London.
2. Hosking, R. (1992). Road aggregate and skidding. Transport ResearchLaboratory State-of-the-art Review 4, HMSO.
3. TRRL (1969). Instructions for Using the Portable Skid Resistance Tester.Road Note 27, Transport and Road Research Laboratory HMSO.
Table 2. Min. polished-stone coefficients for bituminous roads (adapted from Hosking, 1992)
Site Definition Traffic in commercialvehicles (CV) per laneper day
Min.PSV (%)
A1(very
difficult)
(i) Approaches to traffic signals on roads with aspeed limit greater than 64 km/h
(ii) Approaches to traffic signals, pedestriancrossings and similar hazards on main urbanroads
Less than 250 cv/lane/day250 to 1000 cv/lane/day1000 to 1750 cv/lane/dayMore than 1750 cv/lane/day
60707075
A2(difficult)
(i) Approaches to major junctions on roadscarrying more than 250 commercial vehiclesper lane per day
(ii) Roundabouts and their approaches(iii) Bends with a radius less than 150 m on roads
with a speed limit greater than 64 km/h(iv) Gradients of 5% or steeper, longer than 100 m
Less than 1750 cv/lane/day1750 to 2500 cv/lane/day2500 to 3250 cv/lane/dayMore than 3250 cv/lane/day
60707075
B(average)
Generally straight sections of and largeradius curves on(i) Motorways(ii) Trunk and principal(iii) Other roads carrying more than 250
commercial vehicles per lane per day
Less than 1750 cv/lane/day1750 to 4000 cv/lane/dayMore than 4000 cv/lane/day
556065
C(easy)
(i) Generally straight sections of lightlytrafficked roads
(ii) Other roads where wet accidents are unlikelyto be a problem
… 45
Preparation of Specimens for Marshall Test
30
NANYANG TECHNOLOGICAL UNIVERSITYSchool of Civil and Structural Engineering
LABORATORY - PAVEMENT MATERIALS
PREPARATION OF SPECIMENS FOR MARSHALL TEST
OBJECTIVES
To prepare standard specimens of asphalt concrete for measurement of stabilityand flow in the Marshall apparatus and to determine density, percentage airvoids, and percentage of aggregate voids filled with binder.
BACKGROUND
The requirements of an asphalt concrete paving mix are many, viz.:• Stability• Durability• Flexibility• Fatigue Resistance: Thick Layers; Thin Layers• Fracture Strength: Overload Conditions; Thermal Conditions• Skid Resistance• Impermeability• Workability.
All these properties are governed to some extent by binder type and content,degree of compaction, aggregate gradation and shape. It is clearly impossible forone single test to cover all these factors but the Marshall Test gives the engineerconsiderable help. The complete test reveals:• Stability• Flow• Density• Voids in Total Mix (VTM)• Voids in the Mineral Aggregate (VMA)• Voids Filled with Binder (VFB)
These parameters plotted against binder content enable optima to be obtained forspecific applications of the asphalt concrete or provide guidance for a change inthe aggregate composition.
Preparation of Specimens for Marshall Test
31
PROCEDURES (ASTM 1994)
1. The aggregate, graded according to LTA (formerly PWD) W3B road mix(see Table 1 and Figure 2), is dried at 105-110 oC and sufficient amount isweighed (about 1200 g) to give a height of 63.5 + 1.3 mm when compactedin the mould.
2. The required quantity of bitumen is weighed out and heated to atemperature which will give a viscosity of 170 + 20 mm2/s (cSt).
3. The aggregate is heated in the oven to a temperature not higher than 28 oCabove the binder temperature.
4. A crater is formed in the aggregate contained in a heated mixing bowl, thebinder poured in and mixing carried out until all the aggregate is coated.The mixing temperature shall be within the limit set for the bindertemperature.
5. A thoroughly cleaned mould is heated on a hot plate or in an oven to atemperature between 93 and 149 oC. The mould is 101.6 mm diameter by76.2 mm high and provided with base plate and extension collar.
6. A piece of filter paper is fitted in the bottom of the mould and the wholemix poured in. The mix is then vigorously trowelled 15 times round theperimeter and 10 times in the centre leaving a slightly rounded surface.
7. The mould assembly is placed on the compaction pedestal and given 75blows of the 4536 g compacting hammer falling a height of 457.2 mm. Thespecimen in its mould is then reversed and given the same treatment on theother side. (The number of compaction blows could be 35, 50 or 75,depending on traffic loading condition in service; LTA specifies 75 blowseach face).
8. The specimen is then carefully extruded from the mould, transferred to asmooth flat surface and allowed to cool to room temperature.
9. Finally, the specimen is measured and weighed in air and water (for volumedetermination). If the asphalt mix has an open (porous) texture the weighingin water will lead to error in the volume and so the specimen must becoated with a measured mass of paraffin wax. The specimen is then markedand stored for stability and flow measurements.
Preparation of Specimens for Marshall Test
32
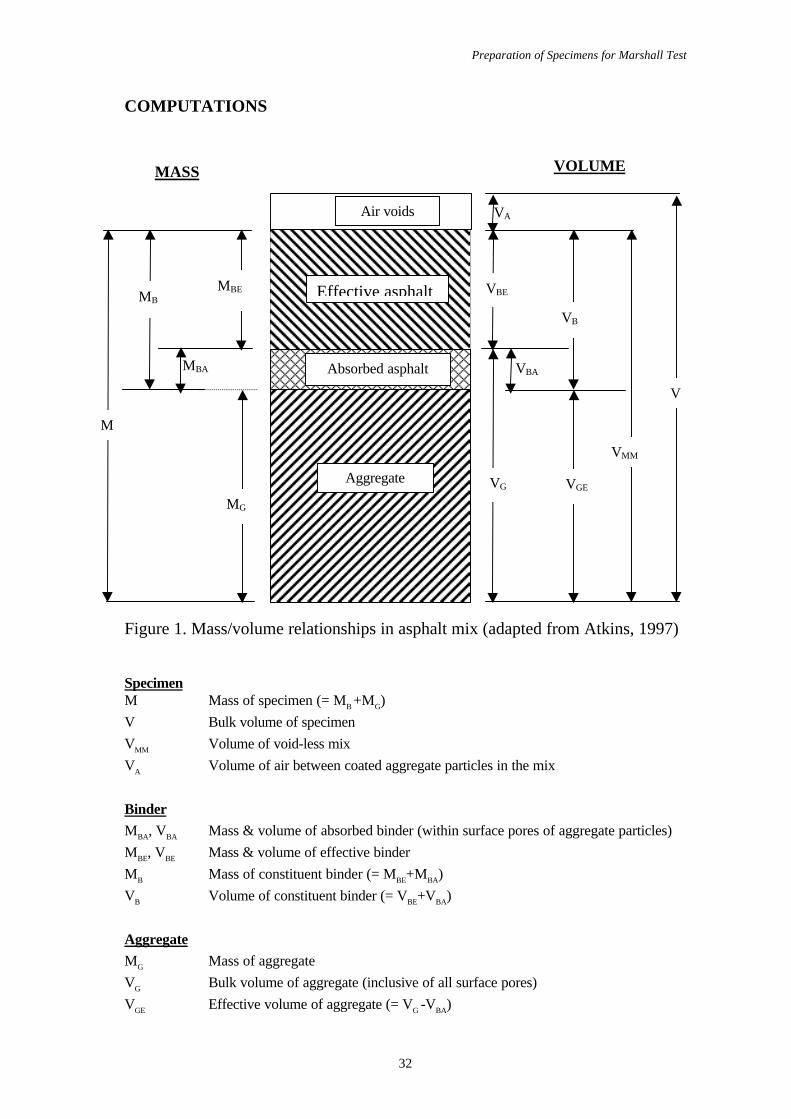
COMPUTATIONS
Figure 1. Mass/volume relationships in asphalt mix (adapted from Atkins, 1997)
SpecimenM Mass of specimen (= MB +MG)
V Bulk volume of specimen
VMM Volume of void-less mix
VA Volume of air between coated aggregate particles in the mix
Binder
MBA, VBA Mass & volume of absorbed binder (within surface pores of aggregate particles)
MBE, VBE Mass & volume of effective binder
MB Mass of constituent binder (= MBE+MBA)
VB Volume of constituent binder (= VBE+VBA)
Aggregate
MG Mass of aggregate
VG Bulk volume of aggregate (inclusive of all surface pores)
VGE Effective volume of aggregate (= VG -VBA)
Effective asphalt
Absorbed asphalt
Aggregate
Air voids
MBA
M
MG
MBMBE
MASS
VA
VBA
VGE
V
VMM
VB
VBE
VG
VOLUME
Preparation of Specimens for Marshall Test
33
(1) Mass & volume of Marshall specimen
If the specimen has a smooth compact surface, i.e. fairly impermeable, its bulkvolume V is simply determined by weighing in air and submerged in water.Then:
V = (Wa – Ww) /ρw
. . . (1a)
whereW
a = weight of specimen in air (kg)
Ww = weight of specimen in water (kg)
ρw
= density of water ( = 1000 kg/m3)
If the specimen is porous, its surface should be sealed with paraffin wax beforebeing weighed in water. Then:
V = {Wpa
-Wpw
- [(Wpa
– Wa)/G
p] } /ρ
w. . . (1b)
whereW
pa = weight of specimen and paraffin wax coating in air (kg)
Wpw
= weight of specimen and paraffin wax coating in water (kg)
Gp = relative density of paraffin wax
The mass of the specimen is given byM = W
a . . . (1c)
(2) Mass & volume of binder
MB = M××P
B /100 …(2a)
MG= M - M
B…(3a)
MBA = M
G××P
BAG /100 …(2b)
MBE = M
B - MBA…(2c)
VB = M
B / ρ
B…(2d)
VBA = M
BA / ρ
B…(2e)
Preparation of Specimens for Marshall Test
34
VBE = M
BE / ρ
B = V
B -VBA…(2f)
where
PBAG = binder absorption, % of mass of aggregate (= 100××MBA / MG)
PB = binder content, % of total mass of specimen (= 100××MB / M)
ρB = density of binder (1.01-1.11 g/cm3)
(3) Mass & volume of aggregate
MG= M - M
B…(3a)
VG = M
G / ρ
G…(3b)
VGE = V
G - V
BA…(3c)
whereρ
G = bulk density of aggregate (= M
G / V
G)
(4) Volume of air in total mix
VA = V - V
BE - VG = V - V
B -V
GE… (4)
(5) Volume of void-less mix
VMM = V – V
A = V
BE + V
G = VB
+ VGE
… (5)
(6) Binder contents
Effective binder content is given by:
PBE
= 100××MBE /M (%) . . . (6a)
Absorbed binder content is given by:
PBA
= 100××MBA /M (%) . . . (6b)
Preparation of Specimens for Marshall Test
35
(7) Bulk density, d
Bulk density of specimen is given by:
d = M/V . . . (7)
(8) Maximum theoretical density, D
Maximum theoretical density of specimen is given by:
D = M/VMM
. . . (8)
(9) Voids in total mix, VTM
Voids in total mix is given by:
VTM = 100××VA/V (%) . . . (9)
(10) Voids in mineral aggregate, VMA
Voids in mineral aggregate is given by:
VMA = 100××(VBE +V
A) /V (%) . . . (10)
(11) Voids filled with binder, VFB
Voids filled with binder is given by:
VFB = 100××VBE /(VBE +V
A) (%) . . . (11)
Preparation of Specimens for Marshall Test
36
DISCUSSION (to be included in a later report on Marshall stability & flow)
(a) Report the followings:• the source and type (including geological descriptions) of the
aggregate.• the source, type and percentage (by mass) of the binder.• the mixing temperature, and number of blows of the compaction
hammer.
(b) Calculate d, D, VTM, VMA and VFB (see Sample Calculations).
(c) Collect results for the other specimens (containing different binderpercentages), and plot graphs of d, D, VTM, VMA, VFB against bindercontent (see Figure 3).
REFERENCES
1. ASTM (1994). ASTM D1559-89, Standard test method for resistance toplastic flow of bituminous mixtures using Marshall apparatus. 1994 AnnualBook of ASTM Standards, Volume 04.03, American Society for Testingand Materials, Philadelphia 19103-1187.
2. Atkins, H.N. (1997). Highway Materials, Soils, and Concretes, 3rd ed..Prentice-Hall Inc.
3. PWD (1992). PWD General Specification. Public Works Department,Singapore 1987 (with amendments, 1992).
Preparation of Specimens for Marshall Test
37
Table 1. LTA W3B Mix Specification (see also PWD 1992)
Type of mix W3B Wearing Course
Thickness of course 45-65 mm
Sieve size (mm) % Passing Mid-value
19.0 100 100
13.2 85-95 90
6.3 58-68 63
3.15 40-50 45
1.18 21-31 26
0.3 11-17 14
0.075 4-8 6
% Soluble bitumen (60/70 penetrationgrade) (% by mass of total mix)
5 + 0.5
Figure 2. LTA W3B Gradation Envelope
Preparation of Specimens for Marshall Test
38
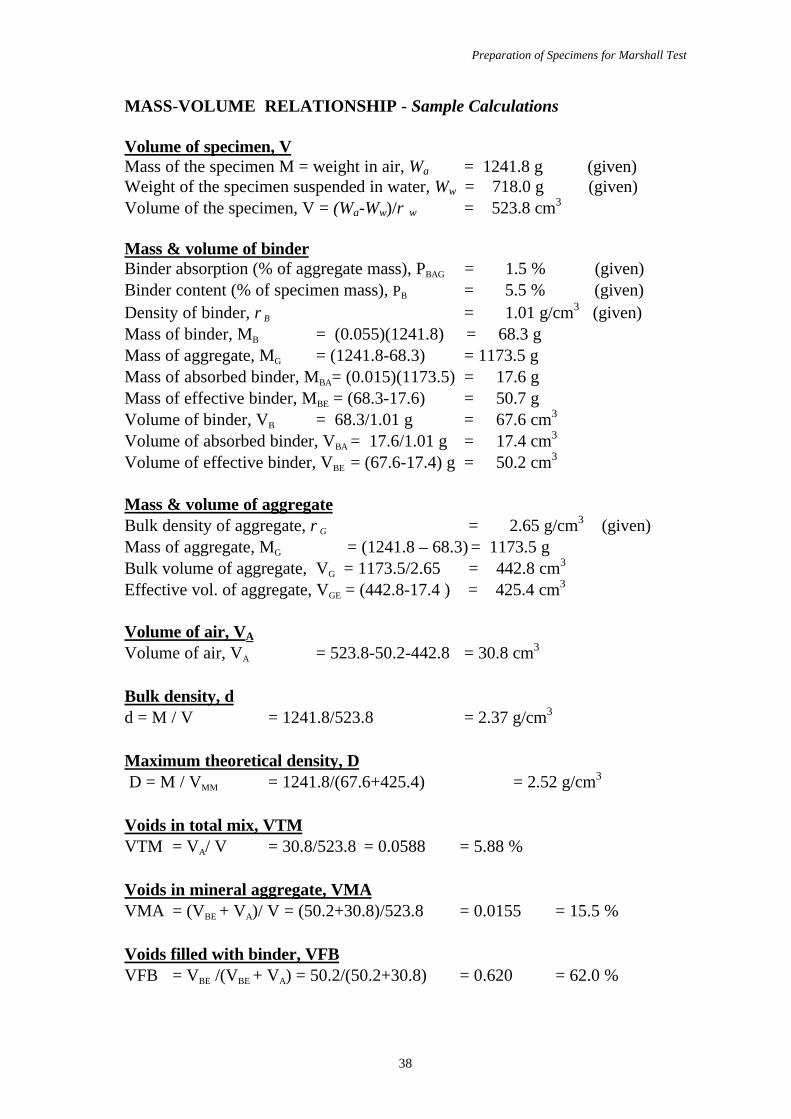
MASS-VOLUME RELATIONSHIP - Sample Calculations
Volume of specimen, VMass of the specimen M = weight in air, Wa = 1241.8 g (given)Weight of the specimen suspended in water, Ww = 718.0 g (given)Volume of the specimen, V = (Wa-Ww)/ρ w = 523.8 cm3
Mass & volume of binderBinder absorption (% of aggregate mass), PBAG = 1.5 % (given)Binder content (% of specimen mass), PB = 5.5 % (given)Density of binder, ρB = 1.01 g/cm3 (given)Mass of binder, MB = (0.055)(1241.8) = 68.3 gMass of aggregate, MG = (1241.8-68.3) = 1173.5 gMass of absorbed binder, MBA= (0.015)(1173.5) = 17.6 gMass of effective binder, MBE = (68.3-17.6) = 50.7 gVolume of binder, VB = 68.3/1.01 g = 67.6 cm3
Volume of absorbed binder, VBA = 17.6/1.01 g = 17.4 cm3
Volume of effective binder, VBE = (67.6-17.4) g = 50.2 cm3
Mass & volume of aggregateBulk density of aggregate, ρG = 2.65 g/cm3 (given)Mass of aggregate, MG = (1241.8 – 68.3) = 1173.5 gBulk volume of aggregate, VG = 1173.5/2.65 = 442.8 cm3
Figure 3. Sample test results from a Marshall mix design.
Marshall Stability and Flow of Bituminous Mix
40
NANYANG TECHNOLOGICAL UNIVERSITYSchool of Civil and Structural Engineering
LABORATORY - PAVEMENT MATERIALS
MARSHALL STABILITY AND FLOW OFBITUMINOUS MIX
OBJECTIVES
To measure the resistance to plastic flow of cylindrical specimens of abituminous paving mixture loaded on the lateral surface by means of theMarshall Apparatus. The method is suitable for mixes containing aggregate up to25 mm maximum size.
BACKGROUND
The most widely used method of bituminous mix design is the Marshall methoddeveloped by the U.S. Corps of Engineers. Stability and flow, together withdensity, voids and percentage of voids filled with binder are determined atvarying binder contents to determine an 'optimum' for stability, durability,flexibility, fatigue resistance, etc.
The mechanism of failure in the Marshall test apparatus is complex but it isessentially a type of unconfined compression test. This being so, it can only havelimited correlation with deformation in a pavement where the material isconfined by the tyre, the base and the surrounding surfacing. Wheel trackingtests have shown that resistance to plastic flow increases with reducing bindercontent whereas Marshall stability has an optimum, below which stabilitydecreases. Improvement on the assessment based on stability is possible byconsidering flow and most agencies (e.g. Asphalt Institute, Singapore LTA) setminima for stability and specified range for flow for various purposes (roads,airports, etc.).
In addition to binder content, stability and flow are also dependent on type ofbinder, grading of aggregate, the particle shape, geological nature of parent rock(most importantly, porosity), degree of compaction, etc. Temperature is also afactor but, for the test, it is standardised at 60 oC.
Marshall Stability and Flow of Bituminous Mix
41
PROCEDURE (ASTM 1994)
The dimension and specifications of the Marshall apparatus are laid down inASTM D1559. The diameter of the specimen is 101.6 mm and nominalthickness 63.5 mm. Table 1, taken from ASTM D1559, gives a correlation ratiowhereby the stability of specimens not 63.5 mm thick can be adjusted.
1. Test specimens, prepared according to the Standard, are immersed in awater bath for 30 to 40 minutes or in an oven for 2 hours at 60 ± 1.0 oC.
2. The testing heads and guide rods are thoroughly cleaned, guide rodslubricated and head maintained at a temperature between 21.1 and 37.8 oC.
3. A specimen is removed from the water bath or oven, and placed betweenthe lower jaw and the upper jaw of the specimen holder. The completeassembly is then placed in the compression testing machine and the flowmeter adjusted to zero.
4. The load is applied to the specimen at a constant strain rate of 50.8 mm/minuntil the maximum load is reached. The maximum force (called stability)and flow at that force are read and recorded. The maximum time allowedbetween removal of the specimen from the water bath and maximum load is30 s.
RESULTS
Each specimen's stability is adjusted if its thickness is not exactly 63.5 mm. Theusual practice is to test 3 specimens for each binder content, and the average of 3tests taken to be the stability (to nearest Newton) and flow (to nearest unit) ateach of the binder contents.
DISCUSSION
(a) Report the results obtained from the specimen preparation stage -seespecimen preparation experiment.
(b) Report the stability and flow of the mixes (for specimens with variousbinder contents) and produce plots of stability and flow against bindercontent.
(c) Determine the optimum binder contents for the bituminous mix withrespect to the LTA requirements (see Table 2).
(d) Comment on the applicability of your mix under Singapore conditions.
Marshall Stability and Flow of Bituminous Mix
42
REFERENCES
1. Asphalt Institute (1998). Construction of hot mix asphalt pavements. Manual SeriesNo. 22, 2nd edition. Asphalt Institute, Lexington, Kentucky 40512-4052.
2. ASTM (1994). ASTM D1559-89, Standard test method for resistance to plasticflow of bituminous mixtures using Marshall apparatus. 1994 Annual Book of ASTMStandards, Volume 04.03, American Society for Testing and Materials, Philadelphia19103-1187.
3. PWD (1992). PWD General Specification. Public Works Department, Singapore1987 (with amendments, 1992).
Table 1. Stability correlation ratio (from ASTM D1559)
Table 2. Marshall design criteria specified by LTA (PWD 1992)
Marshall stability (Number of blows =2 × 75) ≥ 9.00 kNFlow value (in 0.254-mm unit) 8-16 units (2-4 mm)Voids in total mix, VTM 3-5 %Aggregate voids filled with bitumen binder, VFB 75-82 %


![March (The Nutcracker Suite) [Lev1-Lev2] (easy notes)_0.pdf](https://static.documents.pub/doc/80x56/5695cf141a28ab9b028c7f4c/march-the-nutcracker-suite-lev1-lev2-easy-notes0pdf.jpg)


