41
!"#$"%&"’ )**+ Gina Lane College Station, Texas U.S.A. ,-."’/$0-.1-2 34" 567-7%16 0-. !76108 97/$/ 7: 58"6$’161$; <’7.=6$17- 34" >.?0-$02"/ 7: !%088@!608" A=68"0’ B"06$7’/
| Date post: | 08-Sep-2018 |
| Category: |
Documents |
| Upload: | hoangquynh |
| View: | 213 times |
| Download: | 0 times |

!"#$"%&"'()**+
Gina LaneCollege Station, Texas U.S.A.
,-."'/$0-.1-2(34"(567-7%16(0-.(!76108(97/$/(7:(58"6$'161$;(<'7.=6$17-
34"(>.?0-$02"/(7:(!%088@!608"(A=68"0'(B"06$7'/

2 !e Economic and Social Costs of Electricity Production Gina Lane
0910907
Source: Ocampo, Marcial. 2009. Global Energy News and Economics. Accessed 5 August 2009
!"#$%!&'$%(#"$%!)'%*+,%!)!-%.%!*/01+%,2132,4$%5467*+4$%+26/18-%132,4$%646/*918/15467*+4$%*+,%:7;1/1918/1:*/01+-

Gina Lane !e Economic and Social Costs of Electricity Production 3
0910907
Global fatality rates are measured as the number of immediate deaths (per GWe year) due to accidents.

!"#$"%&"'()**+
Understanding !e Economic and Social Costs of Electricity Production: !e Advantages of Small-Scale Nuclear Reactors is a literature survey conducted by Gina Lane. Copyright 2009. All rights reserved. Unauthorized duplication and/or transmission without the express written consent of the author is strictly prohibited by U.S. federal law and by international treaties.
!e trademarks contained herein are the property of their respective owners.
!is work was sponsored under a grant from Hyperion Power Generation, Inc.
!is paper is available at:
http://www.HyperionPowerGeneration.com/policy

Gina Lane !e Economic and Social Costs of Electricity Production 5
0910907
,-."'/$0-.1-2(34"(567-7%16(0-.(!76108(97/$/(7:(58"6$'161$;(<'7.=6$17-34"(>.?0-$02"/(7:(!%088@!608"(A=68"0'(B"06$7'/
30&8"(7:(97-$"-$/Introduction 7
Electricity Production: Literature Background 3
Cost and bene"t analysis of electricity production methods 6
!e Fossil Fuels 7
Coal 7
Oil 11
Natural Gas 12
!e Renewables 14
Wind 14
Hydropower 16
Solar 17
Nuclear 19
Overview and Bene"ts of Portable Nuclear Reactors 22
Conclusion 25
References Cited 26
Appendix 1: Estimated U.S. Costs & Mitigations of Alternative Production Methods 31
Appendix 2: Industry Safety Records for 2006 32
Appendix 3: Energy Cost Summaries 33
Appendix 4: Acronyms 34
Appendix 5: Overview of Portable Nuclear Reactor Designs 36

6 !e Economic and Social Costs of Electricity Production Gina Lane
0910907

Gina Lane !e Economic and Social Costs of Electricity Production 7
0910907
C-$'7.=6$17-For decades, most people have understood and accepted the fact that non-renewable resources, such as easily accessible crude oil and natural gas, are in limited global supply. Despite this realization, the consumption rate of fossil fuels has greatly expanded over the years due to increasing demands through population growth, new production and consumption technologies, and the explosive growth of products requiring fossil fuels for production, manufacturing, and/or transport. Consumption of fossil fuels is further intensi"ed by increasing demands from rapidly expanding new industrial economies such as China and India (Marcus 2008; Nikiforuk 2005; Sims et al. 2003), thus putting even more strain on limited supplies and contributing greatly to rapidly increasing fuel costs as witnessed over the past several years (see Appendix 4). To make matters worse, a large portion of the world’s fossil fuel resources lie in some of the most politically tumultuous and unstable regions, thus contributing a great deal of uncertainty to already economically stressed resources. !ese are just some of the problems that contribute greatly to price volatility of fossil fuels, which further aggravates energy insecurity, and which has a direct e#ect on the costs of fossil-fueled electricity production.
Environmental issues, social costs, externalities, and emissions abatement also have a signi"cant e#ect on the true costs of electricity production. In 2003, Sims et al. estimated that since the onset of the industrial revolution, fossil fuel combustion has contributed approximately 290 gigatons of carbon into the atmosphere. When considering that one Gt equals one billion tons, these volumes are rather staggering. However, they are believable when considering that by 2003, electricity production alone contributed annually over 7,700 million metric tons (or 2,100 Mt C/yr) of CO2, which represented 37.5% of annual global CO2 emissions. !e U.S. Energy Information Administration (EIA), which operates within the Department of Energy (DOE), reported that in 2004, the U.S. electricity industry produced 10.26 million tons of SO2, 3.75 million tons of NOx, and 47.15 tons of mercury (EIA 2007a). Although the long-term 2030 EIA projections call for drastic reductions of these pollutants, emissions abatement technologies are extremely cost intensive, and only partially mitigate the problem. In 2001 alone, despite the use of advanced cleaner-burning technologies, electricity production in the U.S. contributed 72% of the nation’s SO2, 40% of the NOx, 33% of the particulates (PM), and about 50% of the anthropogenic CO2 emissions (Sovacool 2007). By 2020, CO2 emissions from global electricity generation are expected to exceed 4,000 Mt C/yr unless alternative methods are implemented (Sims et al. 2003).
Such vast amounts of pollutants cannot be released into the environment without consequences. One study conducted by Harvard School of Public Health researchers estimates that “air pollution kills about 70,000 Americans every year” (Herman 2000). Air pollution also has measurable negative e#ects on agricultural crops, ecosystems, structures (such as buildings and monuments), infrastructures (such as transmission line degradation), and aesthetics (such as reduced visibility) (Rabl & Spadaro 2005). For example, the U.S. National Park Service (NPS) reports that pollution from distant sources (including power plants) has detrimental e#ects on the air quality of the Smoky Mountains. Neighboring states, such as Kentucky, which generates 92% of their electricity from coal (Kriz 2008), have created enough pollution to reduce visibility in the Smoky Mountains as much as 80%, produce ozone concentrations over twice as high as urban levels, and damage up to 90% of some plant species (NPS 2006).

8 !e Economic and Social Costs of Electricity Production Gina Lane
0910907
Many scientists concur that global warming, whether human induced or not, is occurring and need not be exacerbated by continued high rates of emissions (Marcus 2008). Although known greenhouse gas (GHG) emissions come from numerous sources, including motor vehicles, housing, small combustion engines, "res, and even farm animals, monitoring (or controlling) these minute and often mobile sources is logistically di$cult compared to centralized power stations. When also considering that 38% of all U.S. energy consumed in 2002 was for electric power generation (Sovacool 2007), management of power plants will maintain its importance in global emissions control e#orts. !erefore, despite the fact that future global electricity and energy demands will rapidly increase, clean electricity production methods must also be concurrently developed and employed in order to meet future environmental emissions goals. Many believe that nuclear power is the most promising technology to achieve these goals.
It is obvious that the time has come to put an end to the status quo reliance on fossil fuels and seriously revisit the bene"ts of alternative energy resource development. !e goal of this paper, therefore, is to provide an overall assessment of the economic and social costs of electricity production for the world’s current major energy resources: coal, oil, natural gas, nuclear, wind, hydro, and solar (photovoltaic). Special attention will be paid to nuclear power electricity generation, especially from versatile, portable micro-scale reactors currently being developed.

Gina Lane !e Economic and Social Costs of Electricity Production 9
0910907
58"6$'161$;(<'7.=6$17-D(E1$"'0$='"(F06G2'7=-.(!e United States demands a large amount of electricity. In fact, the U.S. alone consumes approximately 17% of the world’s electricity (Sovacool 2007), but it only represents 4.56% of the world’s population (U.S. Census Bureau, 2008). Numerically, this means that in 2002, the U.S. demanded a staggering 3,651 billion kWh, which amounted to more than the entire Western Europe and Japan combined (whose 2002 demands were 2,556 and 971 billion kWh respectively (EIA 2005b), and whose combined populations exceeded the U.S. population by almost 235 million people in 2002 (U.S. Census Bureau 2008). Consequently, in 2002, the U.S. also contributed 5,751 million t CO2/yr (1,023 more million t CO2/yr than Western Europe and Japan combined) (EIA 2005b). Although present consumption rates are already high, they are expected to continue rising 1.8% a year so that U.S. total consumption is projected to double by the year 2050 (Sovacool 2007; EIA 2005b). Most would agree that it is unacceptable to allow concurrent environmental degradation and emissions to also double over the same time period.
Overall, the EIA (2007) estimated global electricity production for 2004 at 16,424 billion kWh. In 2003, the global production break down of electricity was 38% coal-"red, 20% renewables (primarily 2222power), 17% nuclear, 16% natural gas, and the remaining 9% by oil (Sims et al. 2003). By 2030, a projected 30,364 billion kWh will be produced, with most of the growth expected to be in emerging economies (EIA 2007b). Unfortunately, the above ratio of production methods, with nearly two-thirds by fossil fuels, will not likely meet these demands while simultaneously reducing (or even controlling) emissions.
Historically, fossil fuels have been the most economical means of electricity production for most countries; however, rising prices, dwindling supplies, growing uncertainty, and environmental degradation have created an urgent need for replacement alternative production technologies. Progress has been made in the development of renewable resource technologies such as hydro, wind, and solar energy, but these methods are not pollution-free, have particular environmental issues to contend with, and are often more expensive to employ than fossil fuels. Nuclear power generation has gained attention as a viable and bene"cial alternative for fossil fuel consumption, but old technologies (still in use today in some countries), aging stationary large-scale reactors, and high initial capital costs may hinder social support for a rapid shift from fossil fuel to nuclear production (!omas 2005). However, emergent technologies such as portable micro-reactors and nuclear batteries o#er promising new alternatives, are free from some of the problems associated with large stationary reactors, and will be examined closely within this paper (Allan 2004; Flin and Pool 2005; Kozier 1992). Hopefully, with research e#orts and greater public awareness, nuclear power will gain the stronghold in future power generation that it deserves.
Although numerous viable alternative energy technologies currently exist, fossil fuels remain the primary resource for electricity production in most nations today. In response to growing global environmental problems, emergent technologies, such as clean burning facilities and CO2 capture and storage (CCS), are being developed for fossil fuel emissions abatement. Although helpful, these technologies are not an environmental panacea for continued reliance on fossil fuels, and they do not lessen the world’s dependence on fossil fuels for electricity production. In fact, researchers are reporting an alarming trend that decreasing supplies and increasing prices of oil and natural gas are prompting a renewed increase of coal consumption for electricity production (Nikiforuk 2005; Smith & Power 2008; Anonymous 2008).

10 !e Economic and Social Costs of Electricity Production Gina Lane
0910907
Coal is the one fossil fuel that is in abundant domestic supply, thus making it robust against the economic and political woes plaguing oil and natural gas supplies. According to Nikiforuk (2005), “90% of North America’s remaining hydrocarbons are coal, which is one resource the Middle East does not possess” (p.54). !e EIA estimates that the U. S. alone possesses recoverable coal reserves in excess of 267 billion tons (over 26% of known world reserves) (EIA 2007b). Other studies estimate U.S. coal reserves even higher, claiming that the U.S. possesses between 500-550 billion tons of coal (Sovacool 2007). Regardless of the actual tonnage, one thing is certain: recoverable coal is abundant in the U.S.
Regrettably, although cheap and secure, it is a dirty resource, contributing up to twice the greenhouse gas emissions of some other fossil fuels despite improved clean-burning technologies (Kriz 2008; Nikiforuk 2005), and it certainly cannot compete with the low carbon emissions of nuclear, hydro, solar, and wind generation. One study found that “…on the basis of cheap, simple, and easy disposal techniques, coal wastes are 40 times more harmful to human health than nuclear wastes… [due to] long term health e#ects of coal burning” (Cohen 1998, p. 194). Understandably, development of viable clean-burning coal technology would be greatly bene"cial. Unfortunately, promising new technologies are proving di$cult and cost-prohibitive to implement, as evidenced by the recent U.S. government abandonment of the proposed FutureGen integrated gasi"cation combined-cycle (IGCC) clean coal-burning plant (Armistead 2008; Kriz 2008; Smith & Power 2008; Wald 2008). !erefore, whether such technologies ever do become economically and technologically feasible, alternative energy sources, such as nuclear power, o#er the secure potential to simultaneously meet energy supply demands and emissions abatement necessities.
In the past, e$ciency improvements and consumer behavior modi"cations have been able to signi"cantly o#set increasing demands for per-capita electricity consumption. For example, since 1990 the U.S. population grew by approximately 20% while overall energy consumption grew by only 18% (EIA 2008). From 1973 to 2002, energy use (measured as per capita use for every Gross Domestic Product unit produced) dropped 42%, largely because of e$ciency improvements (Sovacool 2007). Future predictions to 2030 estimate that overall U.S. per capita energy consumption will actually decrease 0.1% annually despite the fact that electricity consumption is expected to rise 1.1% annually (EIA 2008). However, some researchers predict that e$ciency gains (particularly as pertains to e$ciency/conservation behavior modi"cations) have reached near exhaustion and will continue to only partially o#set increasing energy demands in the future (EIA 2005, 2008; Sovacool 2007).
!is may be especially true for emerging economies where net electricity consumption is expected to grow 149% by 2025. Per capita consumption rates in emerging economies are expected to increase from 950 kWh in 2002 to 1,807 kWh in 2025. Although these "gures greatly lag behind existing developed market consumption rates (where 2002 per capita electric consumption was 8,371 kWh), when considering that these economies represent 82% of the world’s population, they will cumulatively surpass mature economies in total annual electricity demands (EIA 2005).
Despite e$ciency improvements (both historic and future), projected energy needs will not meet future power demands and environmental goals if ‘business as usual’ production methods and concurrent emissions are permitted to persist. !erefore, stringent legislations for future reductions in environmental emissions and security improvements have been enacted, notwithstanding projected energy demand increases. In the U.S., federal mandates, such as the Clean Air Act (and subsequent amendments), have been passed which impose strict regulations for the preservation, protection, and

Gina Lane !e Economic and Social Costs of Electricity Production 11
0910907
improvement of air quality. More recently, Congress also passed the Energy Policy Act of 2005, and the Energy Independence and Security Act of 2007. In e#ect, the Energy Policy Act promotes clean electricity production methods, especially nuclear and renewables, by means of tax incentives, subsidies, and federal funds (U.S. Congress 2005). !e Energy Independence and Security Act largely seeks to promote long-term petroleum independence and energy security through alternative fuel developments and e$ciency improvements (such as improved vehicle fuel e$ciency, phasing out incandescent light bulbs, etc) (U.S. Congress 2007)
!e European Union (EU) has also approved stringent environmental legislation. In 2005, EU legislation called for overall emissions reductions (from a 1990 base level) of NOx (-48%), NH3 (-12%), SO2 (-71%) and VOC (-49%). !e abatement e#orts to accomplish the 2005 goals will cost a projected 58 billion Euros/year (or 380 Euros/year per household). Although signi"cant, these reductions do not arrive at the projected Maximum Feasible Reduction levels (MFR), which are calculated to be NOx (-79%), NH3 (-40%), SO2 (-91%) and VOC (-72%). To attain MFR emission levels, abatement costs would increase to 101 billion Euros/year (665 Euros/year per household) (Rabl & Spadaro 2005).
Although expensive, if these e#orts are successful, the environmental and human health bene"ts are immense. Reduced emissions would drastically diminish the amount of environmental damages to agricultural crops and natural ecosystems. Additionally, human mortality rates as a direct result of air pollution would also be greatly improved. For example, if PM2.5 concentrations are reduced to 15 µg/m3 (whereby 34% of counties exceeded this amount in 1996) the U.S. population will bene"t on average by $32 billion annually in reduced health costs. Each year, there would be over 7,000 fewer premature deaths, 15,600 fewer diagnoses of adult chronic bronchitis, and emergency room visits would be reduced by over 91,000 (Ostro and Chestnutt 1998).
Not surprisingly, in response to ongoing and boundless energy and environmental concerns, a vast number of entities, such as international organizations, university researchers, national governments, states, and even cities, produce countless scenarios and projections regarding the future of global energy. Although highly varied in their predictions, these scenarios have one unifying goal in common: they seek to quantify the future energy situation in order to better plan for it (Martinot et al. 2007). !e goal of this paper, therefore, is to synthesize the existing academic, professional, and popular literature regarding the real and social costs of electricity production in order to produce an objective account and suggestions for a better future. In sum, if we are to provide for future electricity demands while
simultaneously meeting the abovementioned environmental goals, alternative production methods for electricity is necessary. As part of this long-term plan, e$cient distributed systems incorporating new technologies such as portable nuclear reactors should be instrumental tools in accomplishing just that.
Impact Type 1990 Level
Current Legislation
MFR
Acidi"cation (1000 km2) (% loss of total ecosystems area)
370 64 9
24.8% 4.3% 0.6%
Agricultural Loss (billion tons of cereal & potato(% loss of total agricultural production)
13 10 6
5.2% 4.0% 2.4%
Eutrophication (1000 km2) (% loss of total ecosystems area)
667 484 194
(55%) (40%) 16%
Mortality (1000 YOLL*/yr)Month/person per lifetime exposure*Estimation of Years of Lost Life as a consequence of pollutant exposure
3,300 1,900 1,100
7.8 months 4.5 months 2.6 months
Table 1: Environmental and Health Improvements of Emissions Reduction Goals. Source: Rabl & Spadaro, 2005, p. 23.

12 !e Economic and Social Costs of Electricity Production Gina Lane
0910907
!"#$%&'(%)*'*+$%,'&-.#/#%"0%1-*2$3/2/$.%43"(52$/"'%6*$7"(#!is paper examines both real (economic) and social (environmental, health, safety, etc.) costs of the most common electricity production methods. Speci"cally, coal, oil, natural gas, nuclear, wind, hydro, and solar (photovoltaic) production methods will be examined and compared. Real "gures, such as $ per kWh, are reported as accurately as possible according to current literature and o$cial reports. However, as with most any industry, electricity production also incurs social costs in the form of environmental degradation (especially with regards to global warming) and human health impacts (Rabl & Spadaro 2005). Either these costs can be direct, such as work-related injuries, illnesses, or deaths, or they can be in the form of externalities, such as disease from ambient air pollution, greenhouse gas emissions, or damages from acid rain.
Injuries and fatalities related to the electric power generation industry are readily obtainable from the U.S. Bureau of Labor and Statistics (BLS). As far as safety records are concerned, electricity generation generally does not have a particularly dangerous history. In fact, fatal and non-fatal injuries and illnesses are less for power generation than they are for other utility sectors such as water/sewage systems or natural gas distribution (BLS 2008b, 2008e). In the U.S., latest "gures released by the Bureau of Labor and Statistics (BLS) indicate that electric power generation overall has an injury/illness rate of 3.1 (per 100 full-time workers) (see Appendix 2); however electricity generation from fossil fuels has the highest non-fatal incident rate at 3.9 (versus 2.9 for hydro and 1.0 for nuclear) (BLS 2008e). Interestingly, fossil fuel power generation witnessed only 6 fatal accidents in 2006 (of a total 19 for the year for the entire industry), which was less than the hydropower deaths of 8 (the remaining 5 deaths were unspeci"ed by industry sector).
For the purposes of this report, statistics associated with the mining of the primary generation fuel, such as coal, oil, natural gas, and uranium, will also be considered. Unfortunately, an exact monetization of some social costs, externalities in particular, is di$cult, but not inestimable (Rabl & Spadaro 2005). For example, estimating the value of environmental damages, such as damage to agricultural crops, is di$cult due to %uctuating commodity prices. Environmental damages to building structures are problematic to calculate due to %uctuations and variations in structure values. Also, it is di$cult to estimate the real cost of illness, such as chronic bronchitis, because of large variations in the severity of cases and national variations in medical care systems availability and quality. Despite these issues, ample literature exists regarding the social costs of electricity production, thus allowing for a good overview in this report. Furthermore, known cost uncertainties are present for all production methods, thus minimizing bias towards any particular fuel source.

Gina Lane !e Economic and Social Costs of Electricity Production 13
0910907
34"(H7//18(H="8/
9708Globally, coal is the most commonly used fuel for electricity production, and coal-"red plants generate 38% of the world’s electricity (Sims et al. 2003). In the U.S., coal is even more prevalent. In 2005, 501 U.S coal-"red power plants burned 1.1 billion tons of coal in order to produce 2 trillion kWh, nearly 50% of domestic electricity consumed (Bergerson & Lave 2007; Kriz 2008). Coal’s popularity is driven mainly by its abundance and cost e$ciency as a fuel source, which is estimated at 3.2-10.6 cents per kWh (depending on the technology; See Table 2) (Sims et al. 2003; Sovacool 2007; see Appendix 1). However, new coal-"red plants that meet increasingly strict environmental legislation demands are costly. !e construction costs for a coal-"red power plant with SOx and NOx controls are estimated at U.S. $1,300/kWe (Sims et al. 2003), which e#ectively raises the Levelized Cost of Electricity (LCOE) for coal production from $.044 to $.059, a 34% increase (Sovacool 2007; see Appendix 3). However, developing countries often do not impose as stringent environmental regulations, and therefore older, cheaper technologies are employed for lower construction costs at the expense of the environment (Sims et al. 2003).
Unfortunately, a#ordable electricity comes at a steep environmental price. In the U.S., electricity production accounts for 40% of U.S. greenhouse-gas (GHG) emissions, thus making coal a leading contributor, as it is known to produce twice the CO2 per kWh of natural gas (the second most common electricity generation fuel in the U.S.) (Kriz 2008). Even with pollution abatement equipment installed, a 1000-MWe coal plant will annually emit 900 tons of SO2, 4,500 tons of NOx, 1,300 tons of particulates (PM), 6.5 million tons of CO2, and up to one million tons of toxic ash (Blix 1997). Coal ash also contains toxic heavy metals such as arsenic, lead, mercury, and cadmium, as well as selenium, boron, chromium, copper, %uorine, molybdenum, nickel, plus others (Rhodes & Beller 2000). Unlike nuclear waste that will lose 99% of its toxicity within 600 years, these contaminants will remain toxic forever (Cohen 1998). Furthermore, unbeknownst to most people, the coal burning industry is also the leading source of radioactive materials emitted into the environment in the form of Uranium and thorium (37,300 metric tons annually released via coal combustion), and radon gas (released during coal mining). Researchers estimate that a 1,000 megawatt-electric (MWe) coal plant will release 100 times the radioactive elements than a comparable nuclear plant (Rhodes & Beller 2000; see also Ausubel 2007).
Coal-"red power plants also emit large volumes of particulate matter (PM), which many researchers directly link to a wide variety of human ailments. Exposure to PM has been linked to chronic bronchitis, asthma, cardiac disease, cancer, and premature death (Krewitt et al 1999; Ostro & Chestnut 1998). In 1990, European power plants released 458 kilotons of PM10, which was estimated to create damage costs of $US1995 13,000 per ton (Krewitt et al 1999). Goodarzi (2005) found that Canadian coal-"red power plants released 9.9-53.4 mg/m3 at a rate of 30-90 kg/hr, (or 0.039-0.118 kg/MWh), despite the use of advanced particulate control systems, which were found to malfunction at least part of the time. Up to 31.4% of these emissions were PM2.5, which studies have shown pose the greatest potential risk to human health.

14 !e Economic and Social Costs of Electricity Production Gina Lane
0910907
Consequently, fossil-fuel electricity results in more negative externalities than other production methods (Hirshberg & Dones). From a social perspective, costs associated with the coal-burning industry are well documented. Rabl and Spadaro (2005) estimate that externality costs from coal emissions (in the EU) equate to 1.6 to 5.8 Euro cents per kWh. Bergerson & Lave (2007) estimate that coal transportation (including all phases of the life cycle from mining onward) is responsible for 1,600 – 2,400 fatalities per year, not including deaths from emissions exposure.
!is brings up an important subject, which is perhaps the most publicized risk factor regarding coal-burning industries: the dangers associated with coal mining. In 2006, U.S. coal mining deaths rose 84% from 2005, and occurred at a rate of 49.5 per 100,000 workers, which is twelve times the rate of general private industry (BLS 2008c). Of the 192 mining deaths in 2006, 47 of them (nearly 25%) came from coal mining alone (BLS 2008b). !at same year, coal mining incident reports were 4.8 per 100 full-time workers, over twice the rate of oil and gas extraction incidents, and were the highest non-fatal incident rates in the entire mining industry (2.0 per 100) (BLS 2008e).
In addition to the human toll, coal mining also presents additional environmental issues. For example, coal mining not only releases radioactive radon gas into the atmosphere, open-pit mines can result in land-use consumption of 50 m2 per GWhe, which is higher than nuclear, combined-cycle gas production, and even hydroelectric dams (Hirschberg & Dones).
In conclusion, although coal burning is harmful to the environment (at least with current technologies), the stability and cost e#ectiveness of coal will not permit a phase-out of its continued use into the future. No serious proposals call for such drastic measures. However, without better and more cost e$cient means of pollution abatement, cleaner alternative production methods (such as nuclear power and renewables) need to be expanded to lessen the world’s dependence on coal. !is is especially true in the U.S., which is more reliant on coal than most other nations.
8*+'/$/"'#Discount Rate: the interest rate used in calculating the present value of expected annual costs. Overnight Construction Costs: the total of all costs incurred for building the plant accounted for as if they were sent instantaneously (i.e. cost of capital) Sanitary Land"ll Waste: inert materials, especially from construction & miningChemical Land"ll Waste: inorganic waste with potentially high levels of pollutants

Gina Lane !e Economic and Social Costs of Electricity Production 15
0910907
Table 2: Summary of Cost Estimates for Coal-Fired ElectricitySources
1 Sims et al 2003; Sovacool 20072 OECD 2005: Global cost estimates (plant generation costs only)3 Rabl & Spadaro 20054 Hirschberg & Dones, Western European average5 Bergerson & Lave, 2007
Cost Parameter or Technology Cost Estimate
Coal Generating Costs (U.S.), no CO2 capture 1 3.2-3.9 (c/kWh)
Coal Generating Costs (U.S.), + CO2 capture 1 5.7 -6.7 (c/kWh)
Coal Generating Costs (Global), no CO2 capture 1 3.6-6.0 (c/kWh)
Coal Generating Costs (Global), + CO2 capture 1 6.9-10.6 (c/kWh)
Cost of C reduction (U.S.) (ranges due to varied technology) 80-168 ($/t C)
Coal LCOE (40 yr lifetime), 5% discount, CO2 capture unknown
25-50 (US$/MWh) or 2.5-5.0 (c/kWh) 2
Coal LCOE (40 yr lifetime), 10% discount, CO2 capture unknown
35-60 (US$/MWh) or 3.5-6.0 (c/kWh) 2
Emissions, no CO2 capture 1 190-252 (g C/kWh)
Emissions, + CO2 capture 1 37-40 (g C/kWh)
GHG Emissions 4 1,071-1,340 (g C/kWh)
Sanitary land"ll waste 4 178,000-247,000(kg/ GWhe)
Chemical land"ll inorganic waste 4 5,800-54,000 (kg/ GWhe)
Levelized Cost of Electricity (LCOE) $2005, Scrubbed coal 1 4.4 (c /kWh)
LCOE in $2005 IGCC + CO2 capture 1 5.9 (c /kWh)
Overnight Plant Construction, + SOx and NOx 1 1,300 ($US/ kWe )
Overnight Construction, Emissions controls unknown 2 1,000-1,500 ($US/ kWe )
Overnight construction costs $US2005, basic pulverized coal 5 $1,500-$1,700 ($US/ kWe )
Overnight construction costs $US2005, basic IGCC 5 $1,600-$2,000 ($US/ kWe )
Overnight construction costs $US2005, (PC) with CCS 5 $2,400-$2,700 ($US/ kWe )
Overnight construction costs $US2005, IGCC with CCS 5 $2,100-$3,000 ($US/ kWe )
External (externality costs) of coal electricity production 3 1.8-5.8 (&/kWh)
Years of Life Lost (YOLL), cumulative per GWe year 4 1,209
Severe accidents, 1969-19964 187
Global Fatality rate (immediate fatalities/ GWe year)4 .34

16 !e Economic and Social Costs of Electricity Production Gina Lane
0910907
I18Oil production of electricity is the least common fossil-fuel method; however, it is signi"cant with a 9% global share. In 2002, only 5% of U.S. electricity was produced by oil combustion (EIA 2002). By 2006, oil-"red electricity had dropped to only 64,364 gigawatt hours, or 1.6% of U.S. net generation, with a drastic decrease of 47.5% from 2005-2006, mainly due to rapidly rising crude prices. In sum, oil electricity production is signi"cantly less than all other methods, and even falls short of other renewables (which cumulatively produced 96,423 gigawatt hours) (EIA 2007c).
Because of its limited use for electricity production, actual costs are more di$cult to obtain (See Table 3), and considering the recent volatility of crude oil market prices, this method of electricity production will likely not gain an increased stronghold in the industry overall. Volatile oil prices are a vivid example of the economic rami"cations of energy insecurity. For example, the NYMEX Crude Oil Future closed at $118.52 per barrel on 25 April 2008. !is represented a phenomenal one-year increase of 80% up from $65.84 per barrel on 25 April 2007 (EIA 2008). !e historic price spike eventually peaked at over $145 per barrel on July 3, 2008, and was immediately followed by a rapid and drastic price slump, which bottomed out at $33.87 on 19 December 2009 (see Appendix 3 for 10-year historic crude oil prices). Most research "gures do not consider the possibility of such drastic price volatility; therefore, my discussion regarding the future of oil electricity production is limited.
In conclusion, although oil combustion is already the least prevalent method of fossil fuel electricity production, it still outpaced some of the alternative methods such as wind and solar power in the recent past. !is has changed, as oil production fell because of high prices, and will likely continue to lose even more of its share in the near future. With rapidly increasing uncertainty, largely based on skyrocketing prices and uncertain future supply, oil-fueled electricity production has little room for expansion. No known projections call for the use of oil as a viable replacement for current energy production ratios. Future oil prices are too unpredictable and not favorable from the current standpoint. !erefore, it is a probable assumption that other methods, whether renewable or not, will increasingly replace oil for future electricity production.
Table 3: Summary of Cost Estimates for Oil-Fired ElectricitySources: 1 Sims et al 2003; Sovacool 2007 2 OECD 2005: Global busbar estimates (plant generation costs only) 3 Rabl & Spadaro 2005 4 Hirschberg & Dones, Western European average
Cost Parameter or Technology Cost Estimate
Oil Generating Costs, Advanced Combined Cycle (CC) 1 undetermined (c/kWh)
Oil Generating Costs, Conventional CC 1 undetermined (c/kWh)
Oil LCOE (20-30 yr lifetime) 5% discount CO2 capture unknown 2 8.31 (c/kWh)
Oil LCOE (20-30 yr lifetime), 10% discount, capture unknown 2 9.2 (c/kWh)
GHG Emissions 4 855 (g C/kWh)
Sanitary land"ll waste 4 2,300-4,000 (kg/ GWhe)
Chemical land"ll inorganic waste 4 3,100-4,000 (kg/ GWhe)
Levelized Cost of Electricity (LCOE) in $2005 Advanced CC 1 4.7 (c /kWh)
LCOE in $2005 Conventional CC 1 5.0 (c /kWh)
Overnight Construction, Emissions controls unknown 2 1,340 ($US/ kWe )
External (externality costs) of oil electricity production 3 1.6-4.8 (&/kWh)
Years of Life Lost (YOLL), cumulative per GWe year 4 3,145
Severe accidents, 1969-1996 4 334
Global Fatality rate (immediate fatalities/ GWe year) 4 .42

Gina Lane !e Economic and Social Costs of Electricity Production 17
0910907
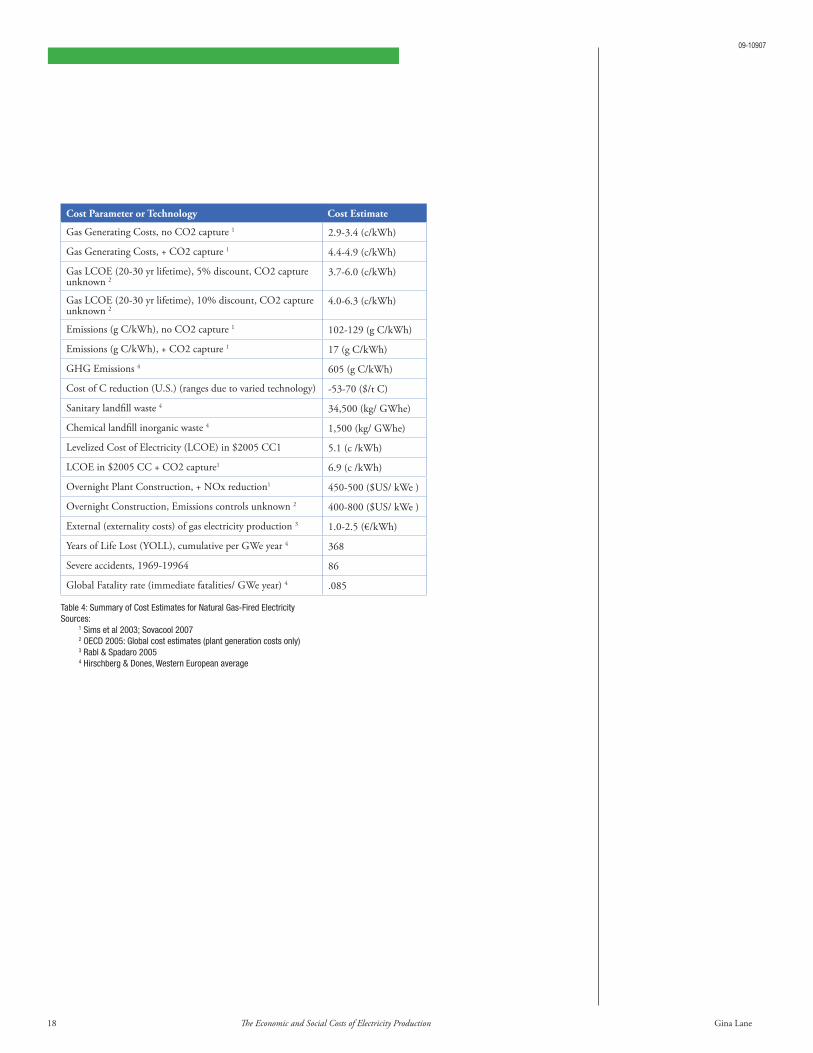
A0$='08(J0/Globally, 16% of electricity comes from natural gas-"red power plants (Sims et al 2003). Currently, natural gas fuels 20% of U.S. electricity production, up from 16% in 2001 (EIA 2007c; Sovacool 2007). In 2005 alone, the U.S. used 22 trillion cubic feet (TCF) of natural gas, 27% of which (or 5.94 TCF) was for electricity production, thus making it the second most common fossil fuel used in the U.S. electricity industry (Bergerson & Lave 2007).
Modern combined cycle gas turbines (CCGT) are considered more e$cient than other gas-burning methods. One advantage of CCGT is the fact that it is less land-use intensive than other methods, requiring only 0.6 m2 of land per GWhe, the same as nuclear power (Hirschberg & Dones). CCGT plants also have lower overnight construction costs than other production methods, since installing a 60% e$ciency CCGT with NOx reduction is estimated at only U.S. $450-500/kWe. However, these costs can be higher in regions that do not already have natural gas infrastructure already in place (Sims et al. 2003). Natural gas also has the advantage of being cleaner burning than other fossil fuels, but unfortunately it is also is plagued by %uctuating prices. For example, in 2005 disruptions from hurricanes Rita, Katrina, and Wilma drove prices to an all-time high (at that time) of $8.21 per MMBtu (EIA 2007c).
Natural gas is also is becoming increasingly import-dependent in the U.S., which could potentially add to even more price volatility in the future (Kriz 2008). !is is because the U.S. possesses only 4% of the known natural gas reserves, but it consumes almost one-third of globally produced natural gas. Furthermore, nearly 75% of the world’s known natural gas reserves are located in the Middle East, Russia, and Venezuela, places that are often on less-than-friendly terms with the U.S. (Nikiforuk 2005). It is understandable that, at least from a U.S. point of view, natural gas is particularly sensitive to energy insecurities due to international relations and price %uctuations.
One common method of natural gas importation is via lique"ed natural gas (LNG). !e process involves cooling the gas to a liquid, transporting it via ocean tanker, and warming it back to a gaseous state at the "nal destination. !e method is e#ective, but also has its drawbacks. For one, it is expensive, costing an estimated $3-$10 billion for construction of a complete system. Second, returning the LNG to a gaseous state cannibalizes 15-30% of the transported fuel. !ird, the necessary facilities are incredibly combustible, which has resulted in at least one multi-person fatal explosive accident, and has attracted the attention of terrorist activity (Nikiforuk 2005).
In conclusion, natural gas does have potential for future capacity increases and better emissions control. Since 1995, average annual production of natural gas electricity increased by 4.6%, more than coal and nuclear, which both saw annual increases of just 1.4% during the same time span. !is is largely because the majority of new power plants constructed since 1999 are natural gas "red, mostly because they are cleaner, more a#ordable, and more e$cient than coal (EIA 2007c). But increasing fossil fuel prices, increasing import dependence, and a desire for energy independence could make natural gas electricity less desirable in the future.
18 !e Economic and Social Costs of Electricity Production Gina Lane
0910907
Table 4: Summary of Cost Estimates for Natural Gas-Fired ElectricitySources: 1 Sims et al 2003; Sovacool 2007 2 OECD 2005: Global cost estimates (plant generation costs only) 3 Rabl & Spadaro 2005 4 Hirschberg & Dones, Western European average
Cost Parameter or Technology Cost Estimate
Gas Generating Costs, no CO2 capture 1 2.9-3.4 (c/kWh)
Gas Generating Costs, + CO2 capture 1 4.4-4.9 (c/kWh)
Gas LCOE (20-30 yr lifetime), 5% discount, CO2 capture unknown 2
3.7-6.0 (c/kWh)
Gas LCOE (20-30 yr lifetime), 10% discount, CO2 capture unknown 2
4.0-6.3 (c/kWh)
Emissions (g C/kWh), no CO2 capture 1 102-129 (g C/kWh)
Emissions (g C/kWh), + CO2 capture 1 17 (g C/kWh)
GHG Emissions 4 605 (g C/kWh)
Cost of C reduction (U.S.) (ranges due to varied technology) -53-70 ($/t C)
Sanitary land"ll waste 4 34,500 (kg/ GWhe)
Chemical land"ll inorganic waste 4 1,500 (kg/ GWhe)
Levelized Cost of Electricity (LCOE) in $2005 CC1 5.1 (c /kWh)
LCOE in $2005 CC + CO2 capture1 6.9 (c /kWh)
Overnight Plant Construction, + NOx reduction1 450-500 ($US/ kWe )
Overnight Construction, Emissions controls unknown 2 400-800 ($US/ kWe )
External (externality costs) of gas electricity production 3 1.0-2.5 (&/kWh)
Years of Life Lost (YOLL), cumulative per GWe year 4 368
Severe accidents, 1969-19964 86
Global Fatality rate (immediate fatalities/ GWe year) 4 .085

Gina Lane !e Economic and Social Costs of Electricity Production 19
0910907
34"(B"-"K0&8"/
L1-.Recently, signi"cant advances were made in renewable energy production in pursuit of alternatives to fossil fuels. One such development is the increasing production of wind electricity. Since 1980, the DOE has spent $1 billion on wind development, although wind power remains a small fraction of total U.S. electricity production at only 0.2% (Ausubel 2007). However, wind power generation has risen over the years. Overall, U.S. wind capacity has increased from 2,500 MW in 1999 to 11,603 MW in 2007. In 2007, $49 million was budgeted for the DOE Wind Program, and wind power is projected to reach as much as 5% of future U.S. capacity (Smith 2007).
!e popularity of wind power is largely for environmental reasons. Wind as a fuel is essentially free. It does not require mining, does not have to be transported or stored, does not need re"ning, and exists globally. Although wind does transport emissions from other sources, wind power generation itself does not contribute a great amount of emissions. A small indirect amount of emissions, however, may result from the manufacture, delivery, construction, and maintenance of the turbines. !erefore, from a green perspective, most consider wind power very promising. In fact, the NREL estimates that in 2005, wind power avoided 4.53 million metric tons of carbon equivalent emissions (NREL 2005).
Unfortunately, wind power is not free from all criticism. For example, some believe that wind turbines are ine$cient because they cannibalize the power they generate. !is is because the turbines themselves use electricity to operate. In other words, turbines produce electricity on average only 35% of the time, but they consume electricity 100% of the time, thus reducing their production capacity by nature of their own operation (Rosembloom 2006).
Many researchers also believe wind power to be more expensive than other production methods, and cost estimates can be highly varied and are somewhat troublesome to calculate. First, wind production is often sporadic. High wind areas can generate electricity at a competitive rate of $0.03-$0.05 per kWh, but lower wind sites operate less e$ciently at $0.10-$0.12 per kWh (Sims et al. 2003). Overall, wind costs have fallen over time. Smith (2007) reports that wind production costs have dropped from $.40/kWh in 1981 to $.04-.09/kWh in 2007. Unfortunately, these lower costs are being challenged by rising steel and copper prices, which may in%ate future LCOE costs.
Rising material costs may also act to increase already high initial capital requirements. In 2003, Sims et al. estimated wind construction costs at $1,000 per kWe. By 2007, the overnight construction costs were estimated to reach up to $2,500-$3,000 per kWh (Sovacool 2007). !e high construction costs are due to expensive tower installation, delivery, interconnection, metering hardware, batteries, and storage. To illustrate how these costs can add up, a wind farm in Colorado cost $212 million to install 108 1.5 MWe turbines (which averages to over $1.92 million per turbine). Furthermore, wind power is land-use intensive, and is intermittent. !e Colorado farm occupies over 4,800 hectares and produces electricity at only 1.2 watts per m2 (which is believed to be the industry average). LCOE rates of wind can be very low because a turbine cannot produce power when 1) there is not enough wind blowing; or 2) the wind exceeds maximum velocity of 90 km/hr, thus requiring manual shutdown of the turbine to avoid disintegration (Ausubel 2007).

20 !e Economic and Social Costs of Electricity Production Gina Lane
0910907
Unfortunately, high costs are not the only drawbacks for wind, as certain environmental problems also act to complicate wind production. In fact, some researchers conclude that wind power actually is not a green resource. For example, Franz (2008) claims that micro-wind turbines for domestic electricity production actually create more emissions than they save. !e processes of manufacturing, installing, and maintaining these small-scale generators may actually create more emissions than their renewable electricity production will o#set over their lifetimes.
Additionally, the large-scale wind farm turbines are dangerous for, and kill numerous birds and bats. Wind farms have been found to a#ect birds and bats directly (fatalities resulting from turbine collisions) and also indirectly (disruption of habitat, breeding grounds, foraging grounds, migration patterns, etc (Kunz et al 2007). For example, one farm in Altamount, CA kills an estimated 40-60 golden eagles every year (Ausubel 2007). Although this high rates of raptor fatalities appears to be a phenomenon speci"c to California, in other states 78% of the fatalities are protected specie songbirds. Bird fatalities vary in rates from zero to as high as 11.7 birds per MW per year (Kunz et al 2007), with national averages believed to be 2.19 bird fatalities per turbine per year (Mabey and Paul 2007, p. 23). In some areas, bats fare even worse. Wind farms built along forested ridgelines have reported particularly high bat fatalities, with one study producing bat fatality rates as high as 53.3 bats/MW/year, although other areas of the U.S. tend to report bat fatalities from 0.8 to 8.6 bats/MW/year (Kunz et al 2007).
!e turbines also create noise, can interfere with receptions, are considered unsightly by some people, and they require massive amounts of concrete and steel per MWe. Overall, Ausubel (2007) states:
[A] typical wind-energy system… requires construction inputs of 460 metric tons of steel and 870 cubic metres of concrete. For comparison, the construction of existing 1970-vintage US nuclear power plants required 40 metric tons of steel and 190 cubic metres of concrete per average megawatt of electricity generating capacity. Wind’s infrastructure takes "ve to ten times the steel and concrete as that of nuclear (p. 234).
In conclusion, wind power does have positive strong points as a renewable resource. After all, there will always be wind, and spinning turbines will not emit much pollution. However, because of costs and reliability issues, wind power is an unlikely candidate to generate signi"cant MWe for large populations, and will likely continue to ful"ll smaller-scale niche markets. In certain high-wind places, wind power may succeed, but on a national scale, wind power will not be able to meet future demands.

Gina Lane !e Economic and Social Costs of Electricity Production 21
0910907
Table 5: Summary of Cost Estimates for Wind ElectricitySources: 1 Sims et al 2003; Sovacool 2007 2 OECD 2005: Global cost estimates (plant generation costs only) 3 Rabl & Spadaro 2005 4 Hirschberg & Dones, Western European average
Cost Parameter or Technology Cost Estimate
Wind Generating Costs, high mean annual wind (9-10 m/s) 1 3.3-5.5 (c/kWh)
Wind Emissions 1 0 (g C/kWh)
GHG Emissions (indirect) 4 36 (g C/kWh)
Cost of C reduction (U.S.) (ranges due to varied technology) -16-85 ($/t C)
Sanitary land"ll waste 4 4,750 (kg/ GWhe)
Chemical land"ll inorganic waste 4 650 (kg/ GWhe)
Wind Levelized Cost of Electricity (<40 yr lifetime) in $2005 1 2.8 (c /kWh)
Wind LCOE, 5% discount 2 3.5-9.5 (c /kWh)
Wind LCOE, 10% discount 2 4.5-14.0 (c /kWh)
Wind Overnight Construction, most plants 2 1,000-2,000 ($US/ kWe )
External (externality costs) of gas electricity production 3 0.09-0.12 (&/kWh)
Years of Life Lost (YOLL), cumulative per GWe year 4 24
22 !e Economic and Social Costs of Electricity Production Gina Lane
0910907
M;.'7#7K"'Of all the renewable electricity production methods, hydropower is by far the most prevalent, producing more electricity than all the other renewables and oil combined. In 2006, U.S. hydropower production was 289.2 million mWh, while oil, other gases (non-natural gas) and other renewables cumulatively produced just 176.8 million mWh (EIA 2007c). Globally, hydropower plants produce over 2.3 trillion kWh, which is the energy equivalent of 3.6 billion barrels of oil (NREL 2005). Global hydropower production is expected to grow 60% by 2020 (mainly in Asia), but analysts doubt that true global hydropower potential will never be reached due to environmental issues, high overnight construction costs, and prohibitive transmission costs of remote locations (Sims et al. 2003). Currently, global hydropower LCOE generation are from 4-10 c/kWh, which in most cases are high when compared to fossil fuels (OECD 2005).
Much like wind power, hydropower is often recognized for its environmental bene"ts. !e NREL estimates that in 2005, U.S. hydropower generation equated to the energy capacity of 500 million barrels of oil, and avoided 56.63 million metric tons of carbon equivalent emissions (NREL 2005). However, abundant research has shown that decaying vegetation underneath dam reservoirs produce signi"cant levels of CO2 and CH4 (methane), which in e#ect can o#set the environmental gains from fossil fuel avoidance. Some studies even suggest that certain reservoirs actually produce more GHG than equivalent fossil-fueled power plants (Rosa & Santos 2000).
Aside from the GHG emissions debate, hydropower also incurs other environmental concerns. First, hydropower is land-use intensive, requiring up to 49 m2 per GWhe (Hirschberg & Dones). Second, dams disrupt river and stream equilibriums by trapping up to 98% of sediment load, which can have negative e#ects on riparian ecosystems, and over time will cannibalize the production capacity of the dam as the reservoir "ll up with sediment deposits (Martinez 2008).
In conclusion, hydropower will likely remain the primary source of renewable energy electricity production, and has great potential for future power generation. However, before understanding the true environmental bene"ts of hydropower, more research into the indirect GHG emissions is needed. Also, the rising costs of construction materials (such as copper and cement) will likely continue to in%ate already high initial construction costs, which could e#ectively increase future LCOE of hydroelectric power, or make future construction projects impractical. But, if the price of fossil fuels continues its dramatic increase, hydropower may continue to provide electricity at a competitive price, despite increasing construction costs.

Gina Lane !e Economic and Social Costs of Electricity Production 23
0910907
Table 6: Summary of Cost Estimates for Hydro ElectricitySources: 1 Sims et al 2003; Sovacool 2007 2 OECD 2005: Global cost estimates (plant generation costs only) 3 Rabl & Spadaro 2005 4 Hirschberg & Dones, Western European average
Cost Parameter or Technology Cost Estimate
Hydro Generating Costs, global small units(100 kWe -10 MWe) 1 6.0-12.0 (c/kWh)
Emissions Hydro 1 0 (g C/kWh)
GHG Emissions, (indirect) 4 4 (g C/kWh)
Sanitary land"ll waste 4 20,550 (kg/ GWhe)
Chemical land"ll inorganic waste 4 30 (kg/ GWhe)
Hydro Levelized Cost of Electricity (<40 yr lifetime) in $2005 1 6.1 (c /kWh)
Hydro LCOE, 5% discount 2 40-140 ($ /kWh)
Hydro LCOE, 10% discount 2 65-240 ($ /kWh)
Overnight Construction, 2 1,200-7,000 ($US/ kWe )
External (externality costs) of hydro electricity production 3 <0.09 (&/kWh)
Severe accidents, 1969-19964 9
Global Fatality rate (immediate fatalities/ GWe year) 4 .88

24 !e Economic and Social Costs of Electricity Production Gina Lane
0910907
!780'Solar power is a renewable resource that has many similarities with wind power. Most importantly, solar energy is free and abundant. Just like wind, solar rays do not require mining, do not have to be transported or stored (although converted electricity does require storage), do not need re"ning, and exist globally, although some latitudes do experience extended periods without it. However, there are di#erences between solar and wind power generation. For one, solar energy is more reliable, for the sun faithfully rises every day, and yet the wind does not necessarily blow.
Essentally, there are relatively few environmental concerns regarding solar PV power, although some harmful chemicals, such as cadmium, may be present in photovoltaic panels (Ausubel 2007). Like wind turbines, solar panels create virtually no emissions, except perhaps a small indirect amount from manufacture, delivery, construction, and maintenance. Although solar panels do not kill wildlife in %ight, there have been some concerns regarding the construction of solar power transmission lines through the habitats of endangered and threatened species such as the desert tortoise (AP 2009). !ere is also some mention of water concerns in the literature. Although solar PV technology alleviates much of the large quantities of water required by thermal-cooled solar power, some environmentalists still contend that the PV panels require frequent cleansing of dirt, dust, and grime, which if left to accumulate, would diminish (or destroy) the energy production of the solar panels. In arid desert environments where water scarcity is already paramount, new technology that further strains the dwindling water supply is not well received by some (Tucker 2009)
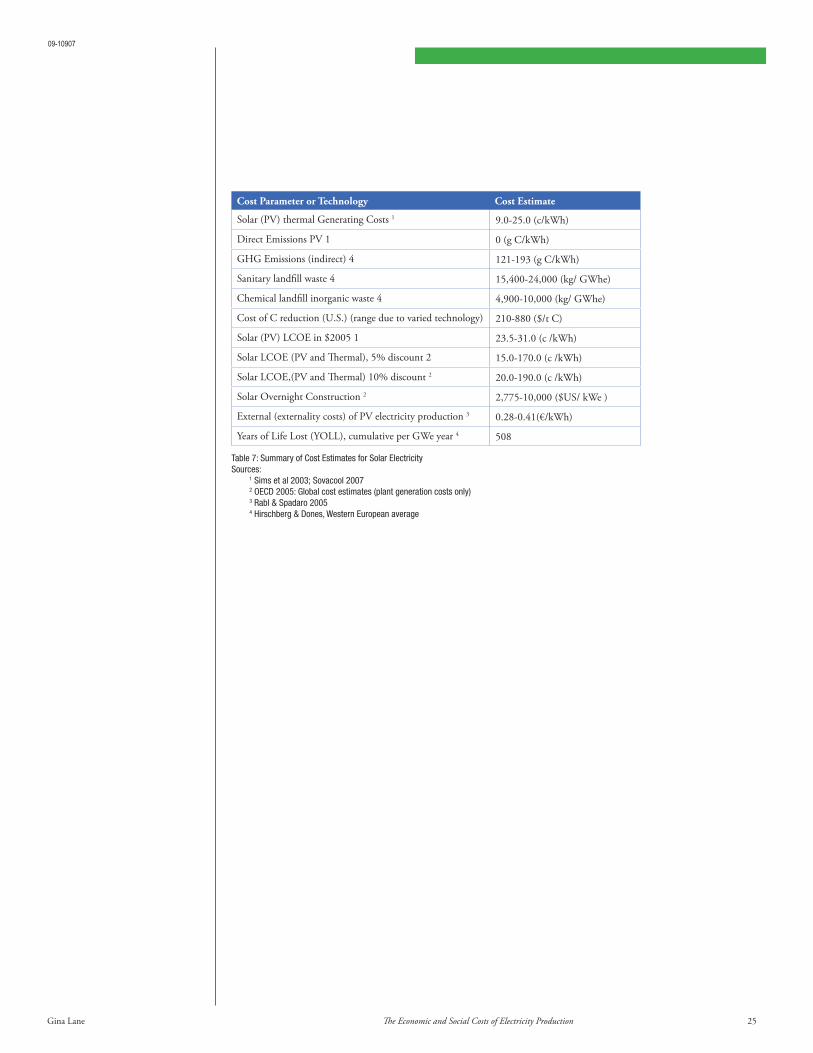
Unfortunately, although clean, current solar power technology has the dubious honor of being the most expensive method of electricity production. Generating costs are estimated at $0.20 -$0.40 cents per kWh, and overnight construction costs are estimated to be as much as $5,000 per kWe (Sims et al 2003). In fact, solar PV initial capital costs are 3-7 times more expensive than coal and natural gas facilities, and up to four times more expensive than wind turbines (Sovacool 2007). As a result, solar energy produces the smallest fraction of global electricity. In 2000, global PV electricity was just 300 MWe, and estimates at that time were that it would only grow to 1,000 MWe/yr by 2005 (Sims et al. 2003).
In addition to high production and capital costs, solar power is also the highest land-use intensive form of electricity production. To illustrate this point, a large Swiss PV plant requires 1,275 m2 per GWhe, far higher than any other method (Hirschberg & Dones). As a result, solar energy produces electricity at a low rate, perhaps as low as 5-6 watts per m2 (Ausubel 2007). Also according to Ausubel, signi"cant technological advances in solar power have not occurred for 30 years, and at only a 10% overall e$ciency, the future does not look very optimistic. Other researchers, however, do not give as grim an outlook, as they list e$ciency rates at 12%-17%, and claim that economies of scale could signi"cantly reduce generating costs. However, to achieve a generating cost of 5 cents per kWh, $100 billion would need to be invested (Sims et al. (2003).
In conclusion, much like wind power, solar electricity has the potential to be a very green, renewable, and reliable fuel for electricity production. Unfortunately, because of relatively exorbitant costs, solar power will remain an unlikely candidate to generate signi"cant MWe in the future. Rather, it will likely continue to ful"ll smaller-scale niche markets at opportune locations, and is not practical for expansion to meet future large-scale electricity demands.
Gina Lane !e Economic and Social Costs of Electricity Production 25
0910907
Table 7: Summary of Cost Estimates for Solar ElectricitySources: 1 Sims et al 2003; Sovacool 2007 2 OECD 2005: Global cost estimates (plant generation costs only) 3 Rabl & Spadaro 2005 4 Hirschberg & Dones, Western European average
Cost Parameter or Technology Cost Estimate
Solar (PV) thermal Generating Costs 1 9.0-25.0 (c/kWh)
Direct Emissions PV 1 0 (g C/kWh)
GHG Emissions (indirect) 4 121-193 (g C/kWh)
Sanitary land"ll waste 4 15,400-24,000 (kg/ GWhe)
Chemical land"ll inorganic waste 4 4,900-10,000 (kg/ GWhe)
Cost of C reduction (U.S.) (range due to varied technology) 210-880 ($/t C)
Solar (PV) LCOE in $2005 1 23.5-31.0 (c /kWh)
Solar LCOE (PV and !ermal), 5% discount 2 15.0-170.0 (c /kWh)
Solar LCOE,(PV and !ermal) 10% discount 2 20.0-190.0 (c /kWh)
Solar Overnight Construction 2 2,775-10,000 ($US/ kWe )
External (externality costs) of PV electricity production 3 0.28-0.41(&/kWh)
Years of Life Lost (YOLL), cumulative per GWe year 4 508

26 !e Economic and Social Costs of Electricity Production Gina Lane
0910907
A=68"0'Nuclear power is a mature technology that has been in operation for decades. After years of stagnation in many nations (including the U.S.) nuclear power is gaining renewed interest. Largely driven by concerns for global warming and stressed energy supplies, the worldwide social and political atmosphere is becoming increasingly ripe for consideration of nuclear power expansion (EIA 2007b; Marcus 2008). In addition, the tremendous potential of nuclear power, in regards to both emissions abatement and a#ordable electricity production, is attracting the attention of nations that have either previously rejected nuclear power (such as Turkey) or are seriously considering it for the "rst time (such as Viet Nam) (Marcus 2008). Clearly, many of the world’s nations now understand that nuclear power is a leading contender for meeting future global energy demands and pollution mitigation goals.
According to the World Nuclear Association (2008), there are currently 439 nuclear reactors, operating in 32 di#erent countries, and producing 16% of the world’s electricity. Researchers estimate that by 1999, nuclear power supplied the electricity needs for more than a billion people worldwide (Rhodes & Beller 2000). Currently, the U.S. operates 103 nuclear plants, which produce 20% of the U.S. electricity supply. !e EIA (2007) estimates that worldwide nuclear power plants produced 2,619 billion kWh of electricity in 2004, and projects that by 2030, nuclear electricity production will reach 3,619 billion kWh.
Unfortunately, traditional nuclear power plants are expensive, with construction costs estimated at U.S. $1,700-$3,100 per kWe (See Table 8). Fortunately, these costs are somewhat o#set due to the fact that many older facilities are fully depreciated, meaning that construction costs no longer a#ect electricity production cost estimates. !is drives down the lifetime costs of electricity (LCOE), which is calculated to be between $.035-6.0/ kWh for nuclear electricity (Sovacool 2007; OECD 2005; see Appendix 3). Overall, the OECD (2005) reports that in most nations, the LCOE for nuclear power is less than both coal and natural gas; but, in the U.S., nuclear is less than natural gas but not coal.
Fortunately, some researchers predict that initial capital investments of nuclear power will continue to drop as new technologies emerge. For example, development of new modular technologies, such as the pebble bed modular reactor (PMBR), o#er increased safety security as well as lower construction costs of U.S. $1,000 - $1,200 kWe (Sims et al. 2003). Realization of these new technologies could e#ectively lower the high initial capital costs of nuclear power and reduce the LCOE even further, thus making it an even more attractive production method in the future. It in this spirit that portable micro-reactors and/or nuclear batteries are particularly promising.
Despite the high initial capital costs of nuclear power, in comparison to the price tag of installing environmental retro"ts to existing coal-burning facilities, nuclear might not seem so bad after all. For example, in 2006 American Electric Power (AEP) reported spending approximately $2.3 billion since 2004 (and proposed an additional $1.3 billion through 2010) on environmental retro"ts to existing coal-"red plants to reduce SO2, NOx, and mercury emissions (AEP 2006). !ese installed scrubbers may succeed in reducing emissions, but they likely will not boost the electricity output of the plant. By contrast, the Tennessee Valley Authority (TVA) announced plans in 2007 to complete/refurbish the un"nished Watts Bar Nuclear Plant Unit 2. Construction is expected to cost $2.49 billion ($1.1 billion less than expected AEP environmental costs), and will result in a 1,200 MW nuclear production facility with zero CO2 emissions (Johnson 2007). In other words, the costs of constructing/ refurbishing

Gina Lane !e Economic and Social Costs of Electricity Production 27
0910907
nuclear facilities that will result in additional electricity production may not be particularly exorbitant when considering the costs of retro"tting existing fossil fuel facilities for emissions control.
In sum, researchers generally agree that nuclear power generation has low overall operating costs with an added bene"t of near-zero emissions. However, reported cost estimates for nuclear power per kWh are somewhat varied. For example, Rhodes and Beller (2000) estimate average U.S nuclear production costs in 2000 at just 1.9 cents per kWh with virtually zero emissions. !e March issue of Power (2008) reports that nuclear power generation costs in the U.S. reached a record low of only 1.68 cents per kWh in 2007, further illustrating the tremendously low costs of nuclear electric generation versus other production methods. Finally, Sims et al. (2003) global estimates were somewhat higher, but still competitive at 3.9 to 8.0 cents/kWh, also with near zero emissions. Global costs are likely higher than average U.S. costs, largely due to less-e$cient technologies used internationally (!omas 2005). Regardless, one thing is certain: Nuclear-generated electricity is economical and clean.
Nuclear power, therefore, is an excellent means for successful GHG mitigation. Nuclear power annually avoids 600 Mt C emissions, and researchers commonly consider nuclear power to be the “greenest” method of electricity production (Baird 2004; see also Ausubel 2007). Baird (2004) estimates that in the next 50 years, the global population
“…will consume more energy than the combined total used in all previous history. Of all energy sources, nuclear energy has perhaps the lowest impact on the environment, including water, land, habitat, species, and air resources. Nuclear energy is the most ecologically e#cient of all energy sources because it produces the most electricity in relation to its minimal environmental impact. Nuclear energy is the world’s largest source of emission-free energy. Electricity produced by nuclear power results in almost none of the greenhouse and acid gas emissions associated with fossil fuel-"red plants. Nuclear power plants produce virtually no sulfur dioxide, particulates, nitrogen oxides, volatile organic compounds, or greenhouse gases. !e complete nuclear power chain, from resource extraction to waste disposal, including reactor and facility construction, emits only a small amount of carbon, about the same as wind and solar power…” p 22.
Additionally, nuclear power is the only production method that takes complete responsibility for management and "nancing of its waste products and associated costs (Baird 2004), which incidentally adds a mere cost of 0.02 cents per kWh of electricity (Sims et al. 2003). Waste management, therefore, is actually considered a bene"t of nuclear power by some researchers (see e.g. Ausubel; Baird 2004; Cohen 1998), especially when compared to the 25 billion tons of unmanageable CO2, which global fossil fuel combustion emits annually into the atmosphere (Baird 2004). According to Ausubel (2007), such emissions represent an annual carbon waste volume of 15 km3, and that annual energy consumption of each American produces an estimated "ve tons of carbon emissions per person (about 14 kg per day). By contrast, the annual global production of nuclear waste would “…"t inside a two-story structure built on a basketball court” (Baird 2004 p. 23). Similarly, Cohen (1998) compares the waste products of a nuclear power plant and a comparable coal-burning plant, and concludes that the “nuclear waste produced is 5 million times smaller by weight and billions times smaller by volume. !e nuclear waste from a year of operation weighs about 1.5 t and would occupy a volume of half a cubic meter, which means that it would "t

28 !e Economic and Social Costs of Electricity Production Gina Lane
0910907
under an ordinary card table with room to spare” thus making nuclear waster exceptionally manageable by volume (p. 193).
In conclusion, nuclear power clearly o#ers continuous future bene"ts of clean, secure, e$cient, and a#ordable lifetime costs of electricity. For one, fuel costs for nuclear power are negligent compared to fossil fuels, thus making nuclear power robust against volatile fuel prices. Nuclear power also has a low land use, requiring only 0.6 m2 per GWhe. Nuclear power is secure because unlike fossil fuel, the supply of nuclear fuel comes mainly from politically stable countries (Hirschberg and Dones). Lastly, production e$ciency for nuclear power is unattainable by any other method, as “ounce-for-ounce, the energy content of nuclear reactor fuel is over 10,000 times that of any petroleum product.” (Williams 2008, p. 13). Perhaps the biggest drawback towards nuclear power generation is the high overnight construction cost, which could continue to rise with increasing prices of copper, steel, and concrete. Although a potentially signi"cant barrier, the bene"ts of nuclear power could o#set high construction costs, and future costs could be signi"cantly reduced with the introduction of modular and portable nuclear reactors that o#er a much lower price tag than traditional large-scale power plants. !erefore, many researchers conclude that nuclear power o#ers the best hope for sustainable global electricity production.
Table 8: Summary of Cost Estimates for Nuclear ElectricitySources: 1 Sims et al 2003; Sovacool 2007 2 OECD 2005: Global cost estimates (plant generation costs only) 3 Rabl & Spadaro 2005 4 Hirschberg & Dones, Western European average
Cost Parameter or Technology Cost Estimate
Uranium 1 5.0-6.0 (c/kWh)
Emissions 1 0 (g C/kWh)
GHG Emissions (indirect) 4 16 (g C/kWh)
Cost of C reduction (U.S.) (ranges due to varied technology) 52-102 ($/t C)
Sanitary land"ll waste 4 3,100-8,500 (kg/ GWhe)
Chemical land"ll inorganic waste 4 650-1,200 (kg/ GWhe)
Levelized Cost of Electricity (LCOE) in $2005 1 3.5 (c /kWh)
LCOE (40 yr lifetime), 5% discount 2 2.1-3.1 (c/kWh)
LCOE (40 yr lifetime), 10% discount 2 3.0-6.0 (c/kWh)
Overnight Construction, refurbishment or decommissioning costs unknown 1 1,700-3,100 ($/kWh)
Overnight Construction, without refurbishment or decommissioning costs 2 1,000-2,500 ($/kWh)
Overnight Construction, PMBR 1 1,000-1,200 ($/kWh)
External costs (externality) of nuclear power production 3 0.19 (&/kWh)
Years of Life Lost (YOLL), cumulative per GWe year 4 219
Severe accidents, 1969-19964 1
Global Fatality rate (immediate fatalities/ GWe year) 4 .0084

Gina Lane !e Economic and Social Costs of Electricity Production 29
0910907
9:*3:/*;%&'(%)*'*+$#%"0%4"3$&<-*%=52-*&3%>*&2$"3#Portable nuclear power generators are not a particularly new idea. After all, the navy has been using them successfully and safely on submarines and aircraft carriers since 1953 (Williams 2008). For years, researchers have proposed small, safe, contained nuclear power generators (sometimes referred to as nuclear batteries) for distributed small-scale production. As early as 1984, Canadian and U.S. researchers at Los Alamos National Laboratory (LANL) jointly embarked on plans for development of a Compact Nuclear Power Source (CNPS). Although that project was eventually cancelled, research continued at Atomic Energy of Canada Limited (AECL), and in 1992, a nuclear battery design was earmarked to provide small-scale (600 kWe net), safe, reliable, ‘o#-the-grid’ electricity for remote locations for up to 15 years without refueling. !e nuclear battery would replace the need for di$cult (and expensive) importation of diesel for power generation, thus simultaneously providing energy security and protecting remote locations from escalating fossil fuel prices (Kozier 1992).
For years, development of these nuclear technologies has garnered the attention of remote communities such as Galena, AK, that have no connecting roadways, gas lines, or grid power lines (Allan 2004; Marcus 2008). In places like Galena, dependence on fossil fuel powered electricity is necessary but logistically di$cult. Rising fuel prices are further exacerbated by di$cult and long-distance diesel deliveries, which must occur during the few summer months warm enough to permit barges to traverse local rivers that are frozen for most of the year. Solar power generation is not an option due to extended months of total absence of sunlight, and studies of wind power generation proved fruitless. !erefore, interest in small-scale portable nuclear units has garnered enough attention to prompt formal inquiries by these communities to the US Nuclear Regulatory Commission for the acquisition of such technologies (Marcus 2008). !ey are serious customers.
Keep in mind that ‘portable’ in this sense means that the generators are small enough to be built at a remote location and then transported by ship or truck, despite the fact that these units may weigh many tons and some may exceed the height of a multi-story building (Allan 2004; Flin & Pool 2005; Williams 2008). For example, the Nuclear Battery proposed in Kozier (1992) has a reactor core of 2 meters high and 2.5 meters wide (Kozier 1992), but we will see that other more recent designs are considerably larger, weighing in at many tons.
Even so, their size and output is minute compared to full-scale stationary power plants, which is directly associated with many of their bene"ts. Large power plants produce electricity in the thousands of kWh, if not more. !is is optimal for densely populated urban areas, but not very useful in remote, sparsely populated rural areas (Hecht 2004). Rural communities have constant needs, but at a much lower demand, which is better served by a distributed minimum output unit such as a small-scale mWh portable modular reactor. Also, rural areas are unlikely to have a resident population trained in nuclear operations, or able to a#ord importation of such specialists. However, these nuclear reactors are self-contained and sealed, often do not require refueling for many years, do not require on-site continuous sta$ng, and therefore will have negligible operations and maintenance costs (O&M) (Allen 2004; Kozier 1992). Because of the small levels of nuclear fuel required, these reactors operate at a much lower temperature and power density, and also are designed with multi-level passive safety features, thus providing greater safety than full-scale power plants (Kozier 1992). !e risks of meltdown and release of radioactive material is virtually negligent.

30 !e Economic and Social Costs of Electricity Production Gina Lane
0910907
Since the early developments at AECL, several small-scale, portable, nuclear technology prototypes are being developed (See Appendix 5). !e diverse array of designs range from 1 meter up to 25 meters in height, can weigh from 1 ton up to 1,000 tons, and will produce from 40 mWh up to 1,000 mWh (Williams 2008). While the larger units are capable of power production levels competitive with traditional power plants, it is the smaller units that o#er the greatest versatility of use.
Currently, researchers at LANL have invented a promising portable nuclear reactor concept that is being exclusively marketed by Hyperion Power Generation, Inc. Called HPM, the unit is compact at only 3x3.2 meters and weighs in at 20 tons. !e HPM is designed with excellent multi-level safety features, has a "ve to seven year service increment, and is capable of producing 68MW of thermal energy (Williams 2008). !e HPM is an exceptional design concept that would be practical in many di#erent situations. Aside from bringing electricity to remote areas and introducing nuclear power to developing nations that otherwise may not ever have nuclear power, there are numerous other proposed uses for the HPM. For example, the military could employ it in forward operating bases, which would lessen the dependence on petroleum products (which currently consumes a very large portion of military resources, i.e. up to 70% of tonnage required for battle preparations), and enable on-site electricity and water production. Any excess water or electricity could be shared with local communities that do not have access to safe water or reliable energy. In e#ect, this could help improve U.S. international relations and increase trust between military presence and indigenous populations.
In addition to military uses, the HPM could improve disaster relief and humanitarian e#orts (Williams 2008). Imagine what a di#erence these units could have made in producing clean water and electricity in the wake of Hurricane Katrina or the 2005 tsunami disaster, where large scale utilities were wiped out to the point where quick restoration of grid services was virtually impossible. Sadly, tragedies like this are not rare. In May 2008, a cyclone in Myanmar reportedly killed 22,000 people, and analysts are predicting that the overall death toll may reach as much as 100,000, largely due to disease from lack of potable water. Furthermore, even without a large-scale disaster at hand, HPM could be instrumental in the implementation of distributed systems, which many researchers recommend for reasons such as e$ciency improvements and even better homeland security (Martinot et al. 2007; Sovacool 2007). Because distributed systems lack large-scale centralized hubs, they do not provide centralized targets for terrorist attacks. In this sense, the HPM could e#ectively contribute to avoid the kinds of large-scale disasters that they are designed to amend.
!e HPM is also highly e$cient in power delivery, from both cost and land-use perspectives. A 70 MWh HPM unit will cost on average $28.6 million, and requires only one or two acres of land. Compare this to wind power, where average turbines operate at only 35% capacity (mainly due to wind intermittency). !erefore, production of 70 MWe output would require 134 1.5MW turbines. With an average land use of 0.1 km2 and average cost of $1,680 per kW, such a wind farm would require $337.68 million and at least 7 km2 of land (EERE 2007). Solar power fares even worse. An average two-axis tracking %at PV panel produces electricity at an average rate of 5-10 kWh per m2 (NREL 2008). With average PV installation costs of $8.8 - $9.6 per watt, this means that it would cost between $616 - $672 million to install the required 7-14 km2 of necessary PV panels to produce 70 MW of electricity (Wiser et al. 2006).

Gina Lane !e Economic and Social Costs of Electricity Production 31
0910907
So why has this technology been so slow in entering long-term plans for public electricity generation? Much of the problem lies with public perceptions of radioactive wastes and fear of nuclear weapons proliferation. Although these fears are not unfounded, as evidenced by Chernobyl and !ree Mile Island, the reality is that nuclear power has a safety record second only to wind power (Hirschberg & Dones), and these nuclear ‘pod’ technologies o#er even greater safety and security than large-scale stationary power plants (see Allan 2004; Flin & Pool 2005; Kozier, 1992). Although nuclear waste is unique in its properties, the truth is that it is they much more easily managed than the carbon, solid, and GHG wastes of traditional methods of electricity generation (See Ausubel 2007; Cohen 1998). So in reality, much of the negative public perceptions largely stem from fears of the unknown, and better public education could greatly enhance the general perception of nuclear power (Warren 1998).

32 !e Economic and Social Costs of Electricity Production Gina Lane
0910907
97-68=/17-It is obvious that global demands for electricity will increase dramatically in the coming decades. Not only will the world population grow by several billion, per capita consumption of energy and electricity is also expected to increase signi"cantly. !e most dramatic changes will be in developing nations, where historically low per capita rates become more in tune with Western consumption rates. Meanwhile, future production of environmental emissions and pollutants cannot continue at current rates, leaving the electricity industry faced with the dilemma of increasing production while simultaneously reducing pollution. Historically, production methods have overwhelmingly relied on fossil fuels, often without optimal pollution abatement e#orts (especially in developing nations). In the very near future, however, better methods of clean, expandable electricity production will be imperative at a global scale. !is is not going to be an easy task, and the current mix of production will not come anywhere near to meeting future needs.
Many believe that nuclear power is the best strategy for meeting all of these goals. Nuclear power is green, has competitive lifetime costs, is reliable, consistent, and is robust against fuel price %uctuations. Furthermore, the introduction of portable nuclear reactors can aid in bringing nuclear power to developing nations that have previously been unable to tap into nuclear resources. !e problems associated with nuclear power, such as waste management and proliferation, can certainly be overcome, and should be on the global research agenda. !is is precisely the outcome which current and emerging nuclear technologies can provide, and may be the best way to secure an environmentally friendly and abundant energy future.

Gina Lane !e Economic and Social Costs of Electricity Production 33
0910907
B":"'"-6"/(91$".Allan, Keri. 2004. Pocket Power. IEE Power Engineer Vol(issue). December/January 2004/2005. pp 22-23.American Electric Power (AEP). 2006. Annual Report to Shareholders. Available from: http://www.aep.com/investors/annrep/American Electric Power (AEP). 2007. Annual Report to Shareholders. Available from: http://www.aep.com/investors/annrep/Anonymous. Global Monitor. 2008. Departments: DOE scraps FutureGen. Power 152(3). Armistead, !omas F. 2008. DOE drops clean-coal plant to focus on carbon capture. ENR: Engineering News-Record 260(5). 2/11/2008 p. 12.Associated Press (AP). 2009. Environmental Concerns !reaten Solar Power Expansion in California Desert. 18 April 2009. From: http://www.foxnews.com/story/0,2933,517053,00.htmlAusubel, Jesse H. 2007. Renewable and nuclear heresies. International Journal of Nuclear Governance, Economy and Ecology 1(3) pp. 229-243.Baird, Stephen L. 2004. A global need, a global resource: Nuclear power and the new millennium. !e Technology Teacher 64(2) pp. 21-24.Baird, Stuart. 1993. Energy Fact Sheet: Hydro Electric Power. Energy Educators of Ontario. From: http://www.oblivion.net/~ommony/writings/hydro.htmBergerson, J. & Lave, L. 2007. !e long-term life cycle private and external costs of high coal usage in the US. Energy Policy Vol 35, pp. 6225-6234.Blix, Hans. 1997. Nuclear energy in the 21st century. Nuclear News. September 1997, pp. 34-48.Bryner, Gary C. 2003. Coalbed methant development: Costs and bene"ts of an emerging energy source. Natural Resources Journal 43(2): pp. 519-560.Bureau of Labor Statistics (BLS): U.S. Department of Labor. 2008a. All charts: Census of fatal occupational injuries, 2006. Available from http://www.bls.gov/iif/oshwc/cfoi/cfch0005.pdfBureau of Labor Statistics (BLS): U.S. Department of Labor. 2008b. Census of fatal occupational injuries: Industry by private sector, government workers, and self-employed workers 2006. Available from http://www.bls.gov/iif/oshwc/cfoi/cftb0216.pdf Bureau of Labor Statistics (BLS): U.S. Department of Labor. 2008c. Coal Mining: Injuries, illnesses, and fatalities: Fact sheet and charts. Available from http://www.bls.gov/iif/oshwc/osh/os/osar0006.pdfBureau of Labor Statistics (BLS): U.S. Department of Labor. 2008d. Fatal occupation injuries, employment, and rates of fatal occupational injuries by selected worker characteristics, occupations, and industries, 2006. Available from http://www.bls.gov/iif/oshwc/cfoi/CFOI_Rates_2006.pdf Bureau of Labor Statistics (BLS): U.S. Department of Labor. 2008e. Table 1: Incidence rates of nonfatal occupational inuries and illnesses by industry and case types, 2006. Available from http://www.bls.gov/iif/oshwc/osh/os/ostb1765.pdfCarelli, Mario D. & Petrovic, Bojan. 2006. A %exible & economic small reactor. Nuclear Plant Journal 24(5), pp. 28-35.Cohen, B. 1998. Perspectives on the high level waste disposal problem. Interdisciplinary Science Review: Special Issue on Radioactive Waste 23(3), pp. 193-203.
34 !e Economic and Social Costs of Electricity Production Gina Lane
0910907
EERE. 2007. U.S. Department of Energy: Energy E$ciency and Renewable Energy. Annual Report on U.S. Wind Power Installation, Cost, and Performance Trends: 2006. Retrieved from http://www1.eere.energy.gov/windandhydro/pdfs/41435.pdf EIA. 2008. Energy Information Administration. NYMEX Light Sweet Crude Oil Futures Prices. Available from http://www.eia.doe.gov/emeu/international/crude2.htmlFlin, David & Pool, Rebecca. 2005. Great Creations. IEE Power Engineer Vol(Issue) October/November 2005. pp 14-17.Franz, P. 2008. Domestic turbines a load of hot air. Geographical 80(2), p. 11.Goodarzi, F. 2005. !e rates of emissions of "ne particles from some Canadian coal-"red power plants. Fuel 85, pp. 425-433.Hecht, Je#. 2004. US plans ‘take-away’ nuclear power plants. New Scientist 183(2463), pp. 2-3.Herman, Robin. 2000. Air pollution deadlier than previously thought. Press release. Available from: http://www.hsph.harvard.edu/news/press-releases/archives/2000-releases/press03022000.html Hirschberg, Stefan & Dones, Roberto. Year Unknown. Evaluation of sustainability of electricity supply systems. Publication from the Federal Polytechnic School of Lausanne, Paull Scherrer Institute Available from: http://lrs.ep%.ch/webdav/site/lrs/shared/Document/hirschberg1.pdf Johnson, Terry. 2007. Watts Bar Unit 2: First for the 21st. Inside TVA 28(8) pp. 1-2.Kozier, K.S. 1992. !e nuclear battery: A very small reactor power supply for remote locations. Nuclear Engineering and Design Vol. 136 pp. 149-155.Krewitt, W., Heck, T., Trukenmuller, A., & Friedrich, R. 1999. Environmental damage costs from fossil electricity generation in Germany and Europe. Energy Policy Vol. 27, pp. 173-183.Kriz, Margaret. 2008. Power play for coal. National Journal 40(9) 3/1/2008.Kunz, T.H., Arnett, E.B., Cooper, B.M., Erickson, W.P., Larkin, R.P, Mabee, T., Morrison, M.L., Srtickland, M.D., Szerczak, J.M. 2007. Assessing impacts of wind-energy development and nocturnally active birds and bats: A guidance document (Invited Paper). Journal of Wildlife Management 78: pp. 2449-2486.Mabey, S. and Paul, E. 2007. Critical Literture Review: Impact of Wind and Related Human Activities on Grassland and Shrub-Steppe Birds. Prepared for !e National WindCoordinating Collaborative by the Ornithological Council. October 2007. From: http://www.nationalwind.org/pdf/IMPACTOFWINDENERGYANDRELATEDHUMANACTIVITIESONGRASSLANDANDSHRUB-STEPPEBIRDS.pdfMarcus, Gail H. 2008. Innovative nuclear energy systems and the future of nuclear power. Progress in Nuclear Energy 50(1) p. 92-96.Martinez, Adriana. 2008. Sediment Dynamics of an Impounded River: Yegua Creek, TX. Unpublished thesis, Texas A&M University.Martinot, E., Dienst, C., Weiliang, L., & Qimin, C. 2007. Renewable energy futures: Targets, scenarios, and pathways. Annual Review of Environment and Resources 32, pp. 205-239.Nikiforuk, Andrew. 2005. Eight wrong ways to think about the future of energy. Canadian Business 78 (2) pp. 48-55.NPS. 2006. Air quality:Great Smoky Mountains national park management folio #2. Available from: http://www.nps.gov/grsm/naturescience/upload/air%20quality.pdf NREL. 2005. U.S. National Renewable Energy Laboratory. Power Technologies Energy Data Book, Edition 3. Available from: http://www.nrel.gov/analysis/power_databook_3ed/

Gina Lane !e Economic and Social Costs of Electricity Production 35
0910907
NREL. 2008. U.S. National Renewable Energy Laboratory. Atlas for the Solar Radiation Data manual for Flat-Plate and Concentrating Collectors. Retrieved from: http://rredc.nrel.gov/solar/old_data/nsrdb/redbook/atlas/ OECD. 2005. Projected Costs of Generating Electricity. A publication of the Organization for Economic Co-Operation and Development/Nuclear Energy Agency/International Energy Agency. Paris: France.Ostro, Bart & Chestnut, Lauraine. 1998. Assessing the health bene"ts of reducing particulate matter air pollution in the United States. Environmental Research, Section A Vol 76, pp. 94-106.Rabl, Ari & Spadaro, Joe. 2005. Externalities of Energy: Extension of Accounting Framework and Policy Applications: Technical Report 2005.Rhodes, Richard & Beller, Denis. 2000. !e need for nuclear power. Foreign A#airs 79(1) pp. 30-44. Rosa, L.P., & Santos, M.S. 2000. Certainty & Uncertainty in the Science of Greenhouse Gas Emissions from Hydroelectric Reservoirs, !ematic Review II.2 prepared as an input to the World Commission on Dams, Cape Town, www.dams.org.Rosembloom, Eric. 2006. A Problem with Wind Power. Available from: http://www.aweo.org/ProblemWithWind.html Accessed 4 August 2009. Sims et al., Ralph E.H., Rogner, Hans-Holger, and Gregory, Ken. 2003. Carbon emission and mitigation cost comparisons between fossil fuel, nuclear and renewable energy resources for electricity generation. Energy Policy 31(13) pp. 1315-1326.Smith, Brian. 2007. Wind energy technology and application in the United States. National Wind Technology Center, Golden CO. Available from: http://www.ieawind.org/wnd_info/KWEA_pdf/NWTC_WindTechApp.pdf Smith, Rebecca & Power, Stephen. 2008. After Washington pulls plug on FutureGen, clean coal hopes %icker. Wall Street Journal (Eastern Edition) 2/2/2008. p A7.Sovacool, Benjamin K. 2007. Coal and nuclear technologies: Creating a false dichotomy for American energy policy. Policy Sci 40(1) pp. 101-122.!omas, Steve. 2005. !e economics of nuclear power: Analysis of recent studies. Public Services International Research Unit (PSIRU) Report. Available from: http://www.psiru.org/reports/2005-09-E-Nuclear.pdf Tucker, William. 2009. When are we going to start talking about the environmental cost of solar? !e Infrastructurist. 25 march 2009. From: http://www.infrastructurist.com/2009/03/25/when-are-we-going-to-start-talking-about-the-environmental-cost-of-solar/U. S. Census Bureau. 2008. Data Finders. Available from http://www.census.gov/. U.S. 109th Congress. 2005. Energy Policy Act of 2005. Public Law 109-58, August 8, 2005. Retrieved from: http://www.epa.gov/oust/fedlaws/publ_109-058.pdf U.S. 110th Congress. 2007. Energy Independence and Security Act of 2007. Public Law 110-140, December 19, 2007. Retrieved from: http://frwebgate.access.gpo.gov/cgi-bin/getdoc.cgi?dbname=110_cong_public_laws&docid=f:publ140.110 U.S. DOE Energy Information Administration. 2002. North America: !e Energy Picture. Available from http://www.eia.doe.gov/emeu/northamerica/engsupp.htm U.S. DOE Energy Information Administration. 2005a. Annual Energy Outlook 2005: With Projections for 2025. Washington, D.C.: Department of Energy.
36 !e Economic and Social Costs of Electricity Production Gina Lane
0910907
U.S. DOE Energy Information Administration. 2005b. International Energy Outlook 2005. Washington, D.C.: Department of Energy.U.S. DOE Energy Information Administration. 2007a. Annual Energy Outlook 2007: With Projections for 2030. Washington, D.C.: Department of Energy.U.S. DOE Energy Information Administration. 2007b. International Energy Outlook 2007. Washington, D.C.: Department of Energy.U.S. DOE Energy Information Administration. 2007c. Electric Power Annual 2006. Washington, D.C.: Department of Energy. Available from: http://www.eia.doe.gov/cneaf/electricity/epa/epa_sum.htmlU.S. DOE Energy Information Administration. 2008. Annual Energy Outlook 2008 Overview: With Projections for 2030. Washington, D.C.: Department of Energy.Wald, Matthew L. 2008. Higher costs cited as U.S. shuts down coal project. New York Times Jan. 31, 2008. Pg C5.Warren, L.M. 1998. Public perception of radioactive waste. Interdisciplinary Science Review 23(3), pp. 204-208.Williams, Christopher J. 2008. Portable nuclear energy systems: Sustaining 2020 operations and beyond. A Research Report Submitted to the AFOPEC/FO. Maxwell Air Force Base, Alabama. April 2008.Wiser, R., Bolinger, M., Cappers, P., & Margolis, R. 2006. Letting the sun shine on solar costs: An empirical investigation of Photovoltaic cost trends in California. Retrieved from: http://www.nrel.gov/pv/pdfs/39300.pdfWorld Nuclear Association (WNA). 2008. World nuclear power reactors 2006-08 and Uranium requirements. Accessed 16 April 2008 from: http://www.world-nuclear.org/info/reactors.htm.

Gina Lane !e Economic and Social Costs of Electricity Production 37
0910907
,??*'(/@%AB%1#$/C&$*(%DEFE%!"#$#%G%6/$/H&$/"'#%"0%,-$*3'&$/:*%43"(52$/"'%6*$7"(#
,/1-2(<=
8?"'1N".(9708(O<HP(0
-.(97%
&1-".(9;68"(J0
/(3='&1-"(O99J
3P(3"64-78721"/(0/(F0/"81-"/
PF +
fgd,
NO
xIG
CC
CC
GT
PF +
fgd
+ C
O2
capt
ure
IGC
C +
C
O2
capt
ure
CC
GT
+
CO
2 ca
ptur
eN
ucle
arW
ind
PV &
sola
r th
erm
al
Fuel
Type
coal
coal
gas
coal
coal
gas
uran
ium
wind
sunl
ight
Gen
erat
ing
costs
(c/k
Wh)
3.3-
3.7
3.2-
3.9
2.9-
3.4
6.3-
6.7
5.7-
6.4
4.4-
4.9
5.0-
6.0
3.3-
5.5
9.0-
25.0
Emiss
ions
(g C
/kW
h)24
7-25
219
0-21
010
2-12
940
3717
00
0
2010
Miti
gatio
n co
st of
re
ducin
g C
O2
emiss
ions
co
mpa
red
to P
F ($
/t C
)
Base
line
-80
– 16
8-5
3 –
814
1 –
145
93 –
148
30 –
70
52 –
102
-16
– 85
210
– 88
0
2010
Miti
gatio
n co
st of
re
ducin
g C
O2
emiss
ions
co
mpa
red
to C
CG
T ($
t/ C
)
----
Base
line
326-
613
250-
538
134-
176
124-
304
-8 –
245
434-
2167
Sour
ce: S
ims
et a
l 200
3
Note
s:1)
Gen
erat
ion
cost
s ba
sed
on u
tility
pric
es fo
r coa
l ($1
/GJ)
and
nat
ural
gas
$2.
7/GJ
. Ris
ing
pric
es m
ay h
ave
incr
ease
d th
ese
cost
s.2)
Win
d co
sts
are
for h
igh
mea
n w
ind
spee
ds o
f 9-1
0 m
/s.
3) 2
010
Miti
gatio
n co
sts
are
repo
rted
as a
rang
e du
e to
var
ianc
es in
loca
l circ
umst
ance
s. N
egat
ive
miti
gatio
n co
sts
refle
ct lo
wer
ope
ratin
g co
sts
for t
hat p
artic
ular
tech
nolo
gy.
4) B
ased
on
U.S.
Dat
a on
ly
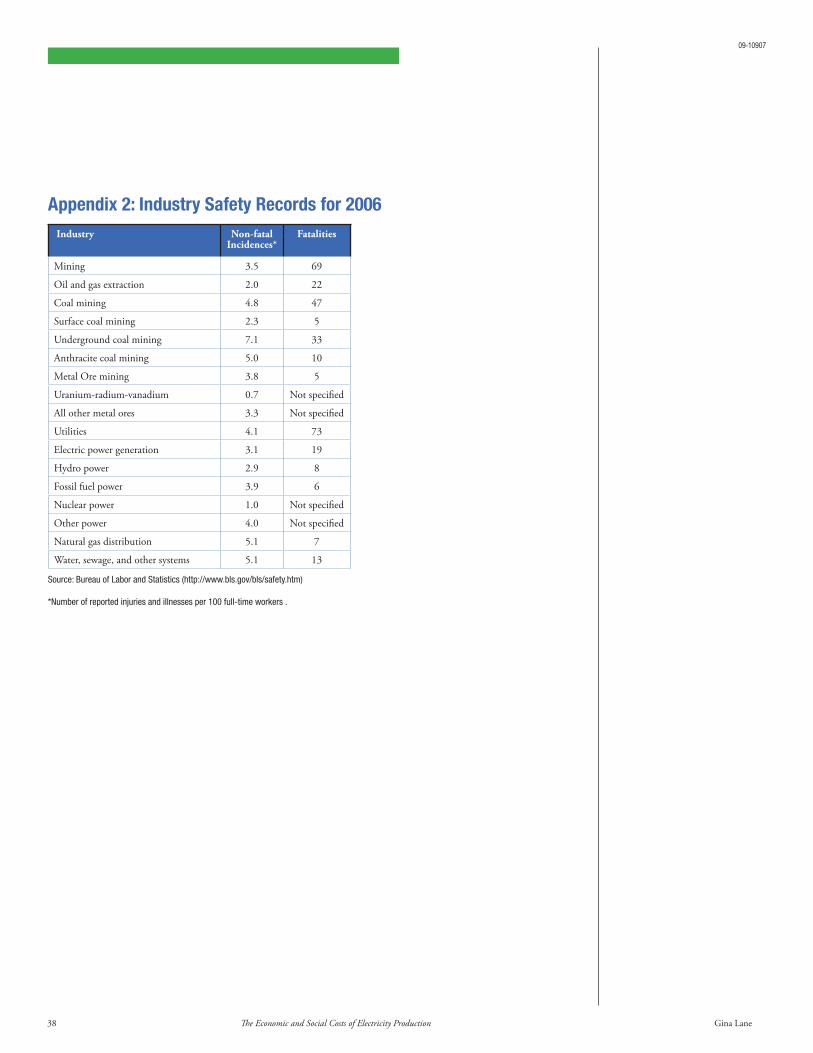
38 !e Economic and Social Costs of Electricity Production Gina Lane
0910907
>##"-.1Q()D(C-.=/$';(!0:"$;(B"67'./(:7'()**R Industry Non-fatal
Incidences*Fatalities
Mining 3.5 69
Oil and gas extraction 2.0 22
Coal mining 4.8 47
Surface coal mining 2.3 5
Underground coal mining 7.1 33
Anthracite coal mining 5.0 10
Metal Ore mining 3.8 5
Uranium-radium-vanadium 0.7 Not speci"ed
All other metal ores 3.3 Not speci"ed
Utilities 4.1 73
Electric power generation 3.1 19
Hydro power 2.9 8
Fossil fuel power 3.9 6
Nuclear power 1.0 Not speci"ed
Other power 4.0 Not speci"ed
Natural gas distribution 5.1 7
Water, sewage, and other systems 5.1 13
Source: Bureau of Labor and Statistics (http://www.bls.gov/bls/safety.htm)
*Number of reported injuries and illnesses per 100 full-time workers .

Gina Lane !e Economic and Social Costs of Electricity Production 39
0910907
>##"-.1Q(SD(5-"'2;(97/$(!=%%0'1"/
30&8"(TD(E"?"81N".(97/$/(7:(58"6$'161$;(OE9I5PU(:7'(97%%7-(58"6$'161$;(<'7.=6$17-
Fuel Burning Technology LCOE, in 2005 $/ kWh
Wind $.028
Advanced Nuclear $.035
Scrubbed coal $.044
Integrated gasi"cation combined cycle IGCC $.044
Combined Cycle (CC) gas/oil $.051
IGCC with carbon sequestration $.057
New hydroelectric $.061
Advanced CC with carbon sequestration $.069
Natural gas fuel cell $.094
Solar thermal $.135
Solar, PV (30%) $.235
Solar, PV (10%) $.310
Source: Sovacool, 2007*LCOE considers the lifetime costs of electricity production. LCOE is measured as the total cost over the life of a generator divided by the total kWh produced.
30&8"()D(T*@V"0'(M1/$7'16(718(H=$='"/(3'0."(<'16"/NYMEX Light Sweet Crude Oil Futures Prices (U.S. $ per barrel) Same week annual closing prices.
Date NYMEX $ Price per barrel
% Change
25 April 1997 19.99 --
24 April 1998 15.09 -24.51
23 April 1999 17.94 18.88
25 April 2000 25.33 41.33
25 April 2001 27.29 7.74
25 April 2002 26.73 -2.05
25 April 2003 26.26 -1.758
23 April 2004 36.46 38.84
25 April 2005 54.57 49.67
25 April 2006 72.88 33.55
25 April 2007 65.84 -9.66
25 April 2008 118.52 80.012
24 April 2009 51.55 -56.5
Source: EIA 2008, Available at http://www.eia.doe.gov/emeu/international/crude2.html

40 !e Economic and Social Costs of Electricity Production Gina Lane
0910907
>##"-.1Q(WD(>6'7-;%/Acronym De!nition Acronym De!nition
$/t C $ per ton carbon Mt C/yr megaton carbon per year
4S Super Safety, Small and Simple Reactor mWh megawatt hour
AECL Atomic Energy of Canada Limited MWe megawatt electric
AEP American Electric Power (corporation) NH3 ammonia
BLS U.S. Bureau of Labor and Statistics NOx nitrous oxide
CC combined cycle NPS U.S. National Park Service
CCGT combined cycle gas turbine OECD Organization for Economic Co-operation and Development
CCS carbon capture and storage OSHA U.S. Occupational Safety and Health Administration
CNPS Compact Nuclear Power Source PMBR pebble bed modular reactor
CO2 carbon dioxide PC pulverized coal
DOE U.S Department of Energy PF pulverized fuel
EIA U.S. Energy Information Administration PM10 Particulate Matter 10 µm or less in diameter
EPA U.S. Environmental Protection Agency PM2.5 Particulate Matter 2.5 µm or less in diameter
EU European Union PNES Portable Nuclear Energy Systems
fgd %ue gas desulphurization (coal scrubber) PV photovoltaic
g C/kWh grams carbon per kilowatt hour SO2 sulfur dioxide
GHG greenhouse gas SOx sulfur oxide
GT gigaton SSTAR Small, Sealed, Transportable, Autonomous Reactor
GWhe gigawatt hour electric t ton
HPM Hyperion Power Module TCF trillion cubic feet
IGCC Integrated Gasi"cation Combined Cycle TVA Tennessee Valley Authority
kWe kilowatt electric VOC volatile organic compound
kWh kilowatt hour YOLL Years of Life Lost
LANL Los Alamos National Laboratory
LCOE levelized cost of electricity
LLNL Lawrence Livermore National Laboratory
MFR maximum feasible reduction
MMBtu million British thermal units

Gina Lane !e Economic and Social Costs of Electricity Production 41
0910907
>##"-.1Q(XD(I?"'?1"K(7:(<7'$0&8"(A=68"0'(B"06$7'(Y"/12-/
A% I.?*3/"'%4";*3%6"(5-*%JI46KResearchers at LANL have invented a portable nuclear reactor concept that is being exclusively marketed by Hyperion Power Generation Inc. !e HPM, is compact at only 3 x 2 meters and weighs in at less than 40 tons. !e HPM is designed with excellent multi-level safety features, has a "ve to seven year service increment, and is capable of producing 68MW of thermal energy (Williams 2008). !e HPM is also highly e$cient in power delivery, from both cost and land-use perspectives. A unit will cost on average $28.6 million, and requires only one or two acres of land.
)( !%088Z(!"08".Z(3'0-/#7'$0&8"Z(>=$7-7%7=/(B"06$7'(O!!3>BPIn 2004 the U.S. DOE announced plans for the development of a unit called SSTAR (Small, Sealed, Transportable, Autonomous Reactor) (Flin & Pool 2005). Researchers at Lawrence Livermore National Laboratory (LLNL) and Argonne National Laboratory worked on the design for SSTAR (Allan 2004; Williams 2008), and prototype testing is scheduled for 2025. !e SSTAR unit is being developed as “a portable, tamper-proof, sealed reactor that, once complete, could be delivered to a site… left to generate power for up to 30 years and then retrieved once the fuel is exhausted” (Allan 2004, p. 22). Overall, a 100-400 MW SSTAR is estimated to be 15 meters tall, 3 meters wide, would weigh about 500 tons, and would not need to be refueled for up to 30 years (Allan 2004; Hecht 2004; Williams 2008). It is designed with excellent safety features, and a tamper-proof design that does not require refueling, which safeguards against fears of weapons proliferation. (Allan 2004; Flin & Pool 2005).
S( !=#"'(!0:"$;Z(!%088(0-.(!1%#8"(B"06$7'(OW!PA team of Japanese scientists are also developing a self-contained small reactor. Called the Super Safe, Small and Simple Reactor (4S), it would produce from 50-150 MW.
W( C-$"'-0$17-08(B"06$7'(C--7?0$1?"(0-.(!"6='"(OCBC!PIRIS is designed to produce as much as 1000 MW thermal energy, but smaller versions could also be designed for as little as 40MW. IRIS is larger in size than other designs with estimated dimensions of 25 meters tall by 5 meters wide, and would require reactor core maintenance every 4 years ( Carelli & Petrovic 2006; Williams 2008).
X( F'77G40?"-(3"64-7872;(J'7=#D(Y55B@T([(Y55B@)Researchers at the Brookhaven Technology Group, Inc. are developing two unit designs called DEER, which are primarily planned for use in the military. !e DEER are very compact units that will produce from 40MW to 200MW of thermal energy. !e units are only about 2 meters tall, and depending on the design, will weigh from 4.5 to 40 tons. DEER units, however, require fuel processing more frequently, as they would need servicing after 300-600 days, but the units themselves do not have to be transported as refueling could be done by trained "eld service teams (Williams 2008).
L% )&<2"2M%G%N/-2"@%6"(5-&3%=52-*&3%1'*3H.O%PP!%B%C4";*3In June 2009, Babcock & Wilcox Modular Nuclear Energy, LLC (a division of McDermott International) announced their intention to seek NRC licensing for the construction of a 125-MW modular reactor design called mPower. !e scalable design unit calls for a steel housing vessel 3.6m in diameter and 22 meters in height, and can be produced for output capacities ranging in 125 MWe increments up to 750 MWe. B&W estimates that every 5 years, the reactor will need to be refueled by replacing the entire core as a single unit. All of the spent fuel produced by the reactor will then be stored in an on-site containment pool that will have enough capacity to hold all of the used fuel over the expected 60-year life of the plant (Babcock & Wilcox 2009; Bryce 2009).


![Topic-Specific Quality Assurance (QA) Guidelines · 10.5 Issue and complaint logging [34] 10.6 Periodic review [34] 10.7 Linkage to quality improvement [34] APPENDICES 35 APPENDIX](https://static.documents.pub/doc/80x56/5f7a92ef4f23bc56a6105a95/topic-specific-quality-assurance-qa-guidelines-105-issue-and-complaint-logging.jpg)


