Deepening Integration in SADC Regional Integration in Southern Africa - Vol. 10 A study conducted for the Friedrich Ebert Foundation Benson Zwizwai, IDS Zimbabwe - Missing SADC Macroeconomic Targets
Transcript
Deepening Integration inSADC
Regi
onal
Inte
grat
ion
in S
outh
ern
Afr
ica
- Vo
l. 10
A study conducted for theFriedrich Ebert Foundation
Benson Zwizwai, IDS
Zimbabwe - Missing SADCMacroeconomic Targets
1
Regional Integration inSouthern AfricaVol. 10
Deepening Integration in SADC
Zimbabwe – Missing SADCMacroeconomic Targets
A study conducted for the
Friedrich Ebert Foundation
Author:
Benson Zwizwai, IDS
February 2007
2
Impressum
Published by
Friedrich Ebert Foundation -Botswana OfficeISBN 99912-564-9-0February 2007
The material in this publication may not be reproduced,stored or transmitted without the prior permission ofthe copyright holder. Short extracts may be quoted,provided the source is fully acknowledged. The viewsexpressed in this publication are not necessarily the onesof the Friedrich Ebert Foundation or of the organisationfor which the author works.
3
Preface
Regional integration can be a key force for sustainable development. It
can promote economic growth, reduce poverty, foster social developmentor protect the environment. But, it can also have negative economic and
social impacts, notably when the domestic regulatory framework is inadequate
or not implemented effectively.The Southern African Development Community (SADC) is committed to
deepening the integration processes amongst its members and has adopted
the Regional Indicative Strategic Development Plan (RISDP) in order to providestrategic direction in the design and formulation of SADC programmes,
projects and activities in order to achieve development and economic growth,
alleviate poverty, enhance the standard and quality of life of the people ofSouthern Africa; and support the socially disadvantaged, through regional
integration.
Amongst the various measures governments can implement to furthersuch integration, ensuring sound macroeconomic management is vital. Given
the commitment to deepening SADC integration through macroeconomic
policies, it is important that policy makers in SADC and its Member Statesassess the impacts that such measures will have on the social well-being of
its people, both in the short term and the long term.
In view of the above, the Friedrich Ebert Foundation, through its office inBotswana, and in close consultation with the Planning Unit of the SADC
Secretariat initiated a regional research programme on “Deepening
Integration in SADC – Macroeconomic Policies and their Impact”.From the very beginning the programme was designed as a collective
effort of the leading economic research institutions of the region. A total of
14 institutes from 11 SADC member countries responded to the call to jointhe programme. In two workshops held in December 2004 in Gaborone,
Botswana, and in April 2005 in Stellenbosch, South Africa, the team
developed detailed terms of reference for the research programme. Phase 1was to begin at the country level with a comprehensive study of the present
status of the economies, their congruence with SADC convergence targets,
the respective policy frameworks, as well as a social impact analysis. Thismore theoretical desk study was complemented by an empirical survey of
the perceptions of Businesses and Non-State Actors vis a vis SADC. A study
4
on South Africa’s international trade diplomacy and its implications forregional integration was to give a contextual perspective.
All members of the research team have spent a lot of time and energy
and produced excellent reports. The ideas and recommendations containedtherein have induced some lively as well as controversial discussions among
the participating institutions, as well as with other experts. The content of
each study reflects of course solely the views of the authors. I commend allof them for their great commitment as well as their great team spirit in this
endeavour. I also wish to acknowledge the substantial input we received
from the SADC Secretariat, especially the Head of the Strategic PlanningUnit, Dr. Angelo E. Mondlane, the then Technical Advisor on Finance, Dr.
Moeketsi Senaoana, as well as other SADC experts. Other external experts
have also contributed to the final documents as part of the various referencegroup meetings in all the participating countries. I wish to extend my greatest
thanks to all them.
In order to make the results of this research programme known to abroader public, especially among the relevant policy and decision makers of
the SADC region, the Friedrich Ebert Foundation then decided to publish a
series of volumes entitled “Regional Integration in Southern Africa”.The 10th volume, presented here, contains the findings of the Country
Study and Survey from Zimbabwe by the Institute of Development Studies,IDS in Zimbabwe. My special thanks go to Benson Zwizwai for writing andrevising the document, to Mompoloki Bagwasi for editing, to Sara Wagner
for proof reading as well as to Peter Maina Kamiti and MacDonald Gotora
for the design and layout.
Gaborone, February 2007
Dr. Marc Meinardus
Resident Representative
Friedrich Ebert FoundationBotswana Office
5
Table of Contents
List of Tables.................................................................................... 8
List ofBoxes..................................................................................... 8
List of Abbreviations........................................................................ 91 Introduction........................................................................... 112 Objectives of the Study......................................................... 153 Macroeconomic Policy Framework....................................... 17
3.1 Macroeconomic Policies 1980 to 1995.......................... 17
3.2 Macroeconomic Policies from 1996 to Present............... 20
3.3 Zimbabwe Millennium Development Goals.................... 213.3.1 Required Growth Rate to Meet Targets.......................... 23
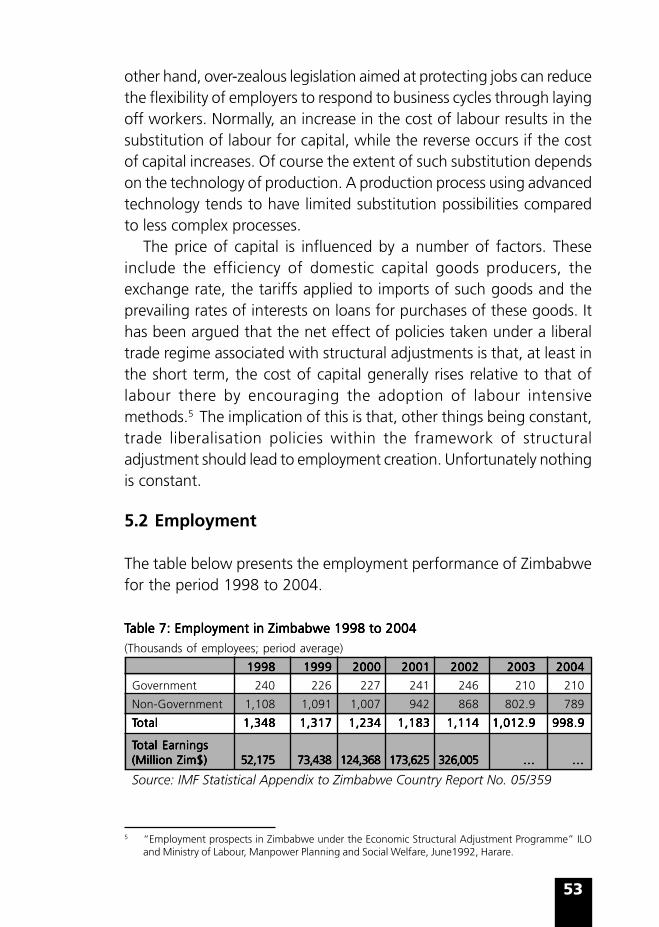
5 Labour Market Policies......................................................... 515.1 Industrial Relations........................................................ 515.2 Employment.................................................................. 53
6 Social Impacts........................................................................ 576.1 Food and Consumption Poverty Indicators..................... 596.2 Child Malnutrition......................................................... 59
6.3 Infant and Under Five Mortality...................................... 60
6.4 Educational Attainment Indicators................................. 616.5 Access to Safe Water..................................................... 61
6
6.6 Challenges That May Affect Attainment of SADCConvergence Indicators................................................. 62
6.6.1 HIV/AIDS, Malaria and other Diseases............................ 626.6.2 Poverty.......................................................................... 63
7 Summary and Conclusions........................................................ 65Bibliography..................................................................................... 69
Part 2: Perceptions of Business and Non-State Actorsin Zimbabwe
List of Tables.................................................................................... 72List of Boxes..................................................................................... 72List of Charts.................................................................................... 73List of Figures................................................................................... 731 Introduction............................................................................ 752 Methodology......................................................................... 773 Characteristics of Respondents............................................. 79
7 Business and NSA views on the Way Forward.................... 1018 Summary and Conclusions.................................................... 103Appendix 1: Tables for Business Survey.......................................... 107Appendix 2: Tables for NSA Survey................................................ 115
7
Deepening Integration in SADC
Zimbabwe – Missing SADC MacroeconomicTarget
Part: 1
Macroeconomic Policies and Their Impacton Zimbabwe
Table 2: Key Development Indicators - 1988 to 2003....................... 10
Table 3: Growth Rate and Time Scenarios for Achieving Goal 1........ 18Table 4: Macroeconomic Targets 2003-2006.................................... 22
Table 5: Exports by Commodity 1998-2004 (Values in million of USD).. 42
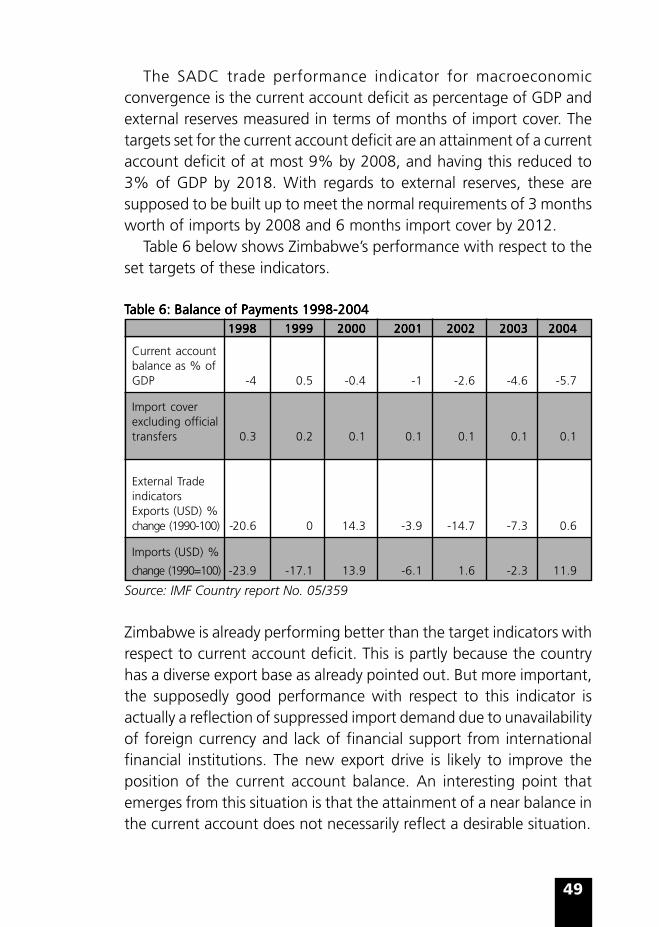
Table 6: Balance of Payments 1998-2004..........................................51Table 7: Employment in Zimbabwe 1998 to 2004............................. 56
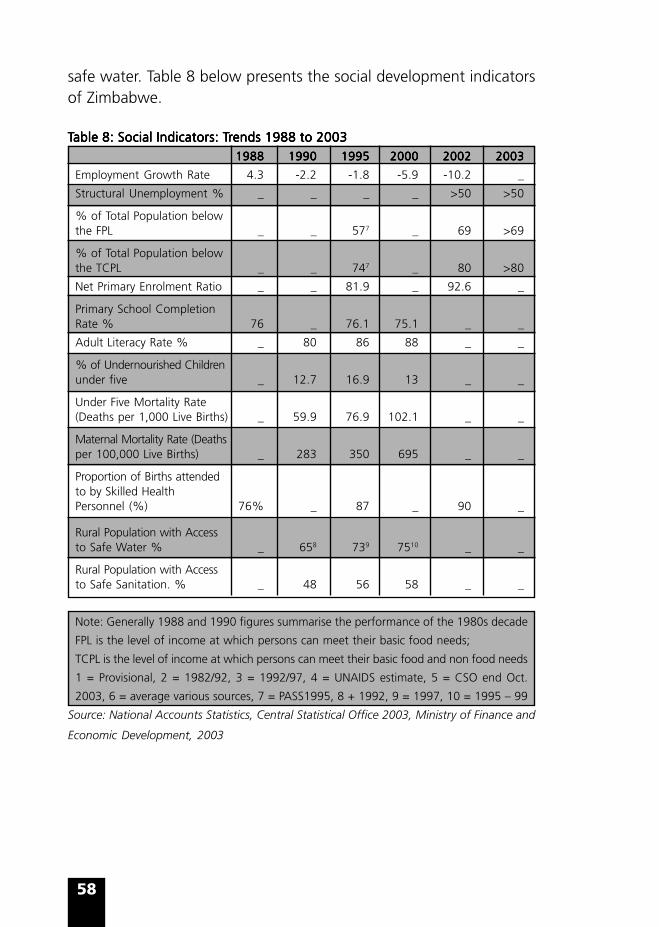
Table 8: Social Indicators: Trends 1988 to 2003.................................62
BoxesBoxesBoxesBoxesBoxes
Box 1: The Ten Point Plan.............................................................. 19
Box 2: Statutory Functions of Reserve Bank of Zimbabwe.............. 24Box 3: Causes of Inflation in Zimbabwe from the RBZ’s Perspective.... 38
Box 4: Financial Support to Exporters............................................ 48
9
Abbreviations
BOP Balance of PaymentsCDTEIC Customs Duty Tradable Export Incentive CertificateECGCZ Export Credit Guarantee Company of ZimbabweEIS Export Incentive SchemesEPZ Export Processing ZoneESAP Economic Adjustment ProgrammeFCA Foreign Currency AccountFES Friedrich Ebert FoundationFFYNDP First Five Year National Development PlanFOB Free On BoardFPL Food Poverty LineFTA Free Trade AreaHPI Human Poverty IndexICEU Implementation and Control of Expenditure UnitMDGs Millennium Development GoalsMERP Millennium Economic Recovery ProgrammeNERP National Economic Revival ProgrammeNTB’s Non Tariff BarriersPASS Poverty Assessment Study SurveyPCV Primary Course of VaccinationPFMS Public Finance Management SystemRISDP Regional Indicative Strategic Development PlanSADC Southern African Development CommunitySFYNDP Second Five Year National Development PlanSPS Sanitary PhytosanitaryTBT’s Technical Barriers to TradeTCPL Total Consumption LineTCPL Total Consumption Poverty LineTCPL Total Consumption Poverty LineUSD United States DollarVAT Value Added TaxZDHS Zimbabwe Demographic Health SurveyZEPI Zimbabwe Expanded Programme on ImmunisationZIMPRESTZimbabwe Programme for Economic and Social TransformationZIMRA Zimbabwe Revenue AuthorityZTNDP Zimbabwe Transitional National Development Plan
10
11
1 Introduction
Regional integration has been championed as a means ofovercoming limits of industrialisation imposed by small domestic
markets. It has further been argued that foreign direct investment canbe more easily attracted to regional blocks that have coordinatedpolicies. Such policy coordination tends to reduce perceivedmacroeconomic uncertainty in the region and can provide the desired“lock in” effect for policy credibility.
Regional trading blocks are important pillars that can be used forbuilding an economically strong Africa that can become a viable tradingpartner in the global economy. The Southern African DevelopmentCoordination Conference (SADCC) was formally launched in April 1980at a summit in Lusaka and at that time it consisted of nine independentsouthern African countries. When SADCC was formed, the centralobjective was to mobilise and coordinate development assistance,facilitate regional co-operation by way of joint development projects,particularly in infrastructure, and to reduce dependence on the thenapartheid South Africa. But towards the end of the 1980 decade,there emerged a desire to move beyond co-operation and strive towardsregional integration. After some four years of preparation, in 1992,the Heads of State in the region signed a Declaration and Treatyestablishing the Southern Africa Development Community (SADC).
SADC aimed at achieving a deeper form of regional integrationbased on trade integration and sectoral cooperation and coordinationto address infrastructure and capacity constraints. The new Communityhad the following objectives as outlined in the Treaty of 1992:• Promote development, poverty reduction and economic growth
through regional integration;• Consolidate, defend and maintain democracy, peace, security and
stability;• Promote common political values and institutions which are
democratic, legitimate and effective;• Strengthen links among the people of the region; and• Mobilise regional and international private and public resources for
the development of the region.
12
SADC aimed at achieving common approaches and policies throughprotocols that were developed by SADC agencies and sectoral actors,approved by the Council of Ministers and signed by Heads of State orGovernment. In pursuit of achieving common approaches and policies,SADC developed and adopted a Regional Indicative StrategicDevelopment Plan (RISDP). RISDP outlined the necessary conditionsthat must be met towards the attainment of SADC’s integration anddevelopment goals and in this respect, set targets that indicated majormilestones towards the achievement of those goals. RISDP identifiedseveral priority areas of intervention that can be broadly categorisedas sectoral and cross sectoral.
Cross sectoral intervention areas are: poverty eradication, combatingthe HIV and AIDS pandemic, gender equality and development, scienceand technology, information and communication technology,environmental sustainability, private sector and statistics. The priorityintervention area for sectoral cooperation and integration are: trade/economic liberalisation and development, infrastructure support forregional integration and poverty eradication, sustainable food securityand human and social development.
Trade and economic liberalisation for deeper integration and povertyeradication is considered to be one of the key catalytic interventionareas. Interventions in this area involve implementing programmes onachieving a free trade area, a customs union and eventually theestablishment of a common market.
The ultimate objective of RISDP is to deepen the integration agendaof SADC so as to accelerate the eradication of poverty and theattainment of other economic and non-economic development goals.
The SADC goals and targets with regards to regional integrationare quite ambitious and are as follows: developing a free trade area(FTA) by 2008, establishing a customs union by 2010, creating acommon market by 2015 and forming a monetary union by 2016.
SADC is convinced that attainment of the above goals and targetsrequire regional economic integration, macroeconomic stability andcompatibility among national and regional strategies and programmes– and these are necessary conditions for sustainable economic growthand for the creation of a monetary union in the region. According tothe RISDP, “this process is linked to achieving macroeconomic
13
convergence, stable and harmonised exchange rate systems,liberalisation of the capital and current accounts transactions andadoption of market oriented approach to the conduct of monetarypolicy” (RISDP – page 56).
In this regard, Governments of SADC signed a memorandum ofunderstanding (MOU) on macroeconomic convergence. The principlesof macroeconomic convergence are:• Restricting inflation to low and stable levels;• Maintaining a prudent fiscal stance based on the avoidance of
large deficits, monetisation of deficits and low ratios of publicdebt to gross domestic product (GDP);
• Avoiding large financial imbalances in the economy; and• Minimising market distortions. (MOU on macroeconomic
convergence).
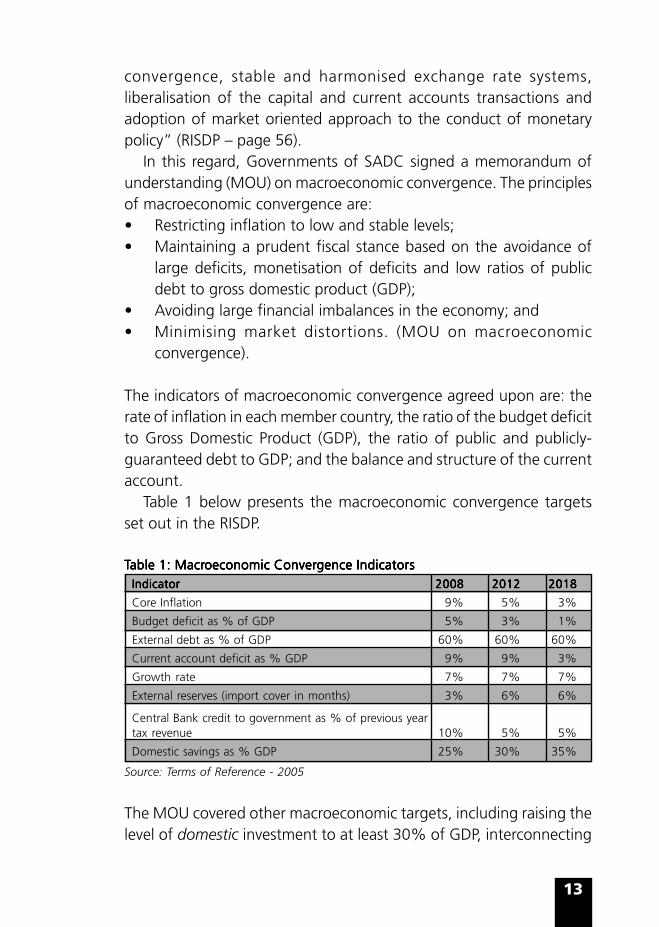
The indicators of macroeconomic convergence agreed upon are: therate of inflation in each member country, the ratio of the budget deficitto Gross Domestic Product (GDP), the ratio of public and publicly-guaranteed debt to GDP; and the balance and structure of the currentaccount.
Table 1 below presents the macroeconomic convergence targetsset out in the RISDP.
External reserves (import cover in months) 3% 6% 6%
Central Bank credit to government as % of previous yeartax revenue 10% 5% 5%
Domestic savings as % GDP 25% 30% 35%
Source: Terms of Reference - 2005
The MOU covered other macroeconomic targets, including raising thelevel of domestic investment to at least 30% of GDP, interconnecting
14
payments and clearing system within SADC, achieving currencyconvertibility and, finalising of the legal and regulatory framework fordual and cross listing on the regional stock exchanges; all by 2008;liberalising exchange controls on current account transactions and onthe capital account; by 2006 and 2010 respectively.
15
2 Objectives of the Study
The above background provides the impetus of this study. Theregional office of the Friedrich Ebert Foundation (FES) based in
Botswana, extended financial support to undertake country studies(and surveys) on macroeconomic policies and their impact, given thecommitment of SADC countries to the macroeconomic convergencetargets. FES recognises that it is important for policy makers in SADCand its Member States to assess the impacts that the agreed measureswill have on the economic and social wellbeing of the populace bothin the short and long term.
The concepts and terms of reference of this study were developedat a workshop organised by FES in close collaboration with the SADCSecretariat, for macroeconomic researchers and policy analysts thatwas held on 6th-7th December 2004 in Gaborone, Botswana. Thepurpose of the study is to provide the SADC Secretariat and SADCnational policy makers with advice on how the process of integrationcan be undertaken taking into consideration the implications of variousoptions on the economies of the countries involved. The study is aimedat providing the SADC Secretariat and policy makers with informationon policy constraints as well identify opportunities that may be takenadvantage of so as to enhance the capacities of national policy makersto harmonise national interest with the regional integration process.The RISDP as summarised above serves as the basic reference documentfor the study.
Given the above, the objective of this study is to provide a broadstock-taking the status of the policy frameworks in Zimbabwe,especially with respect to the targets set out in the MOU onConvergence. The study also identifies the main linkages betweenthese policy frameworks and their social impacts in the country. Thethree major policy frameworks that the study addresses are the basicmacrmacrmacrmacrmacroeconomicoeconomicoeconomicoeconomicoeconomic policy framework (especially fiscal and monetarypolicy), the tradetradetradetradetrade policy framework and the labour marketlabour marketlabour marketlabour marketlabour market policyframework. As already pointed out, the study will investigate the linksbetween these policies and their social impactssocial impactssocial impactssocial impactssocial impacts.
16
This study takes into consideration the fact that the ability ofZimbabwe to achieve the macroeconomic convergence target will bedetermined or affected by factors such as:
(a) The macroeconomic conditions prevailing in the country;(b) The institutional arrangements prevailing within the country;(c) The political priorities of the Government of Zimbabwe; and(d) Zimbabwe’s existing multilateral commitments.
This study is basically a desk study, relying on existing data andinformation that is analysed in accordance with the objectives as statedabove. The study relied on official documents such as governmentand central bank policy documents for data and the analysis wasbasically qualitative.
The remainder of the report is structured as follows: section 3 belowexamines the macroeconomic policy framework of Zimbabwe asreflected in the current development plans. The section reviews pastdevelopments so as to bring out the factors that led to the currentapproaches. This is followed by sections 4 and 5 that deal with tradepolicy and the labour market policy respectively. Section 6 addressessocial impacts of the various policies aimed at achieving macroeconomicstability and convergence. Finally section 7 gives the conclusions ofthe study.
17
3 Macroeconomic Policy Framework
3.1 Macroeconomic Policies 1980 to 1995
In 1980, at independence, Zimbabwe inherited a fairly well diversifiedeconomy with an industrial base stronger than most Sub-Saharan
African countries north of the Limpopo River. However, the economywas dual in nature in the sense that, while the modern sector waswell-developed, there was a largely poor rural sector that employedabout 80% of the labour force (ZHDR 2003). The poor had limitedaccess to education and health and physical infrastructure was poorin the rural areas where the majority lived. The newly independentGovernment of Zimbabwe aimed at correcting the colonial imbalancesthat it inherited. In pursuing this development objective, theGovernment drafted several policy strategy papers/plans. The first wasthe “Growth with Equity” Strategy, published in 1981. This wasfollowed by the “Zimbabwe Transitional National Development Plan”1982–1985 (ZTNDP) and the “Zimbabwe First Five Year NationalDevelopment Plan” 1986–1990 (FFYNDP).
Under these development plans, priority was given to povertyreduction, and Government spending was geared towards increasedsocial sector expenditures. This involved expansion of rural infrastructureand redressing the social and economic inequalities that existed,including land reform. There was an expansion in education at boththe primary and secondary school level and primary education becamealmost universal. By 1995 Zimbabwe had registered a net primaryeducation enrolment rate of 81.9% and an adult literacy rate of 86%.Primary health care services were subsidised and immunisationprogrammes expanded to cover most children. On the whole, theoutcome of these policies had very positive social indicators forZimbabwe.
In 1990, real GDP growth rate was 7%, giving a real GDP growthrate per capita of 3.7%. Average inflation was 12.4% during thatyear having risen from 7% in 1988. Budget deficit as a percentage ofGDP was 5.3%, gross national savings stood at 15.7% of GDP andgross national investment was 18.2%. Export growth was 16.2% inthe same year (see Table 2 below).
18
TTTTTable 2: Key Development Indicators - 1988 to 2003able 2: Key Development Indicators - 1988 to 2003able 2: Key Development Indicators - 1988 to 2003able 2: Key Development Indicators - 1988 to 2003able 2: Key Development Indicators - 1988 to 200319881988198819881988 19901990199019901990 19951995199519951995 20002000200020002000 20022002200220022002 20032003200320032003
Real GDPGrowth rate % 7.5 7.0 0.2 -8.2 -14.5 -13.9
Per Capita Real GDP Growth % 4.3 3.7 -1.3 -7.7 -14.7 -14.1
Source: Zimbabwe Human Development Report - 2003 UNDP, Poverty Reduction Forum, Harare
The 1990 economic and social indicators as a reflection of the outcomesof the decade of the 1980 can now be evaluated in retrospect ashaving been much better than performance during the 1990s decadeup to date. However, the high social sector expenditure of the 1980swas viewed to be unsustainable in the long run and this was partlybecause economic growth during this decade was erratic, with severallow performance years being recorded during the recurring droughts.Thus on average, the economy grew at around 3 to 4% during thisdecade, showing signs of stagnation.
The threats of stagnation and expected eventual economic declineled Government to abandon the Second Five Year NationalDevelopment Plan 1991-1995 (SFYNDP), in favour of the EconomicStructural Adjustment Programme (ESAP) that was adopted in 1991in an effort to boost the country’s economic performance at a timethat the country enjoyed wide international support.
The structural adjustment programme was aimed at restoringmacroeconomic stability through reduced government expenditure,trade liberalisation and deregulation. The main objective of theEconomic Structural Adjustment Programme was to improve the living
19
standards of the poor Zimbabweans through the enhancement ofreal economic growth. In the document A Framework for EconomicReform 1991-95 (1991), the Government spells out the objectives ofESAP, as follows:
“The fundamental objective of economic reform in Zimbabwe isto improve living conditions, especially for the poorest groups.This means increasing real incomes and lowering unemployment,by generating sustained higher economic growth. In order toachieve this primary objective, the economy needs to betransformed to make it more competitive and productive.”
The Government aimed at achieving economic growth through anumber of macroeconomic policies and in essence, via a shift towardsthe market system. The Framework document puts it this way:
“This transformation entails moving away from a highly regulatedeconomy to one where market forces are allowed to play a moredecisive role, while concurrently taking steps to alleviate anytransitional social hardships which may arise from this transition.”
On the whole, ESAP created in higher levels of inflation and high interestrates that crowded out investment. The level of unemploymentincreased as external competition forced some firms to close down.Trade liberalisation was implemented at a pace faster than scheduled.This exposed domestic companies to international competition beforethey were prepared for it, in that they did not have the opportunity tomodernise their plants through greater availability of foreign exchange.On the other hand, tariffs on capital equipment remained high.
Despite the seemingly timely intervention in the economy underESAP, the decade of the 1990s generally saw a decline in economicgrowth and a worsening of the structural problems of high povertyand inequality. According to the first Poverty Assessment Study Survey(PASS I) of 1995, extreme poverty increased significantly during theESAP period and 45% of households lived below the food poverty
20
line (FPL)1 in 1995 compared to 26% in 1990. With regards to generalpoverty, as measured by the total consumption poverty line (TCPL)2 ,this increased from around 40% in the late 1980s to 61% by 1995.
3.2 Macroeconomic Policies from 1996 to Present
The more recent period, 1996 to 2003, has been marked byaccelerated deterioration in the socio-economic situation of the
country as a result of several factors. It is important to note that, duringthis phase, the economic reform mode, including some cost recoverymeasures in social services continue to be launched. On the economicpolicy front, the government replaced ESAP with a “home grown”reform package, the Zimbabwe Programme for Economic and SocialTransformation (ZIMPREST) 1996–2000, officially launched in April 1998.ZIMPREST was short lived, having failed to get the support of internationalfinancial institutions, and hence did not achieve its intended noble goalsof generating sustained economic growth in the context of social equity.In yet another attempt to address the declining economic performance,the Millennium Economic Recovery Programme (MERP) was launchedin August 2001 as a short term 18-month economic recoveryprogramme. Its objective was to restore economic vibrancy and addressthe underlying macroeconomic fundamentals. Unfortunately, MERP wasrendered ineffective mainly due to the withdrawal of support fromZimbabwe by most of the international institutions. In February 2003,Government launched yet another 12-month stabilisation programme,the National Economic Revival Programme (NERP): measures to Addressthe Current Challenges, while continuing to consider options for longterm economic recovery. Despite the early hopes raised under thisprogramme, it failed to kick-start the export sector to generate themuch needed foreign currency to revive the economy.
The Macroeconomic Policy Framework 2005–2006 “TowardsSustained Economic Growth” is the current national development planthat provides the national short and to some extent, medium termgoals of Zimbabwe and this will be discussed below. But before doingso, it is appropriate at this point to discuss the MDGs that are a longer
1 FPL is the level of income at which persons can meet their basic food needs.2 TCPL is the level of income at which persons can meet their basic food and non-food needs.
21
term framework that also guided the formulation of the currentmacroeconomic policy framework.
3.3 Zimbabwe Millennium Development Goals
The unstable economic situation prevailing in the country and theuncertainty regarding future relations with the international
community has made it difficult for the country to develop medium tolong term plans. However, Zimbabwe has committed itself to implementthe Millennium Development Goals (MDGs). These goals have a bearingon all other policies since the design of Zimbabwe’s policies would takeinto consideration achievements of the goals set in the MDGs.
Zimbabwe was among the 189 Heads of State and Governmentsthat agreed to and adopted the Millennium Declaration at theMillennium Summit of September 2000. The MDGs are as follows:
1. Eradicate extreme poverty and hunger;2. Achieve universal primary education;3. Promote gender and empower women;4. Reduce child mortality;5. Improve maternal health;6. Combat HIV and AIDS, malaria and other diseases;7. Ensure environmental sustainability; and8. Develop a global partnership for development.
In 2004, the Government of Zimbabwe, with the support of UNDP,reviewed its efforts in attaining the MDGs and published the Zimbabwe2004 MDGs progress report. The development challenges highlightedin the report are seriously taken by Government as constituting thenew development vision and planning a framework for Zimbabwe. Itis for this reason that the Zimbabwe MDGs reports because it givesgoes a step further than most of the first generation MDG reports bygiving an indication of the growth requirements for achieving theMDGs. The report also indicates a strategy for financing the goals,including budget requirements, strategy for economic growthdevelopment, productive asset redistribution, and enhanced globalpartnership.
22
Zimbabwe identified Goals 1 (poverty), 3 (empowerment of women)and 6 (HIV and AIDS) as the national priority goals. There is a stronglink between poverty, gender and HIV and AIDS.
The goal of eradicating poverty is the one that has the greatestimpact on macroeconomic policies and will be given more attentionhere. In fact this goal presents itself as the greatest challenge todevelopment paradigms, fiscal and monetary policies. This is not tounderplay the importance of the HIV and AIDS problem that is discussedat length in the section dealing with challenges facing Zimbabwe inattaining macroeconomic convergence targets.
The original targets with regards to eradication of extreme povertyand hunger were as follows:
Target 1:• Halve, between 2002 and 2015, the proportion of people whose
income is less than the Total Consumption Line (TCPL).• Halve, between 2002 and 2015, the proportion of people in human
poverty as measured by the Human Poverty Index (HPI).
Target 2:• Halve, between 2002 and 2015, the proportion of people who
suffer from hunger.• Reduce by two thirds, between 2002 and 2015, the proportion of
under-five children who are malnourished.
For Zimbabwe to achieve the above goals or make acceptable progressin that direction, the following priorities for development anddevelopment assistance were identified and need to be addressed:• Formulating and implementing a pro-poor macroeconomic policy
strategy.• Consolidating of agricultural and rural development strategies.• Strengthening disaster management systems.• Developing a nutrition advocacy strategy for people living with HIV
and AIDS.• Establishing a comprehensive food and food and nutrition
• Developing strategies for reversing trends in HIV and AIDS.• Developing Land Information Management Systems.• Consolidating existing nutrition programmes.
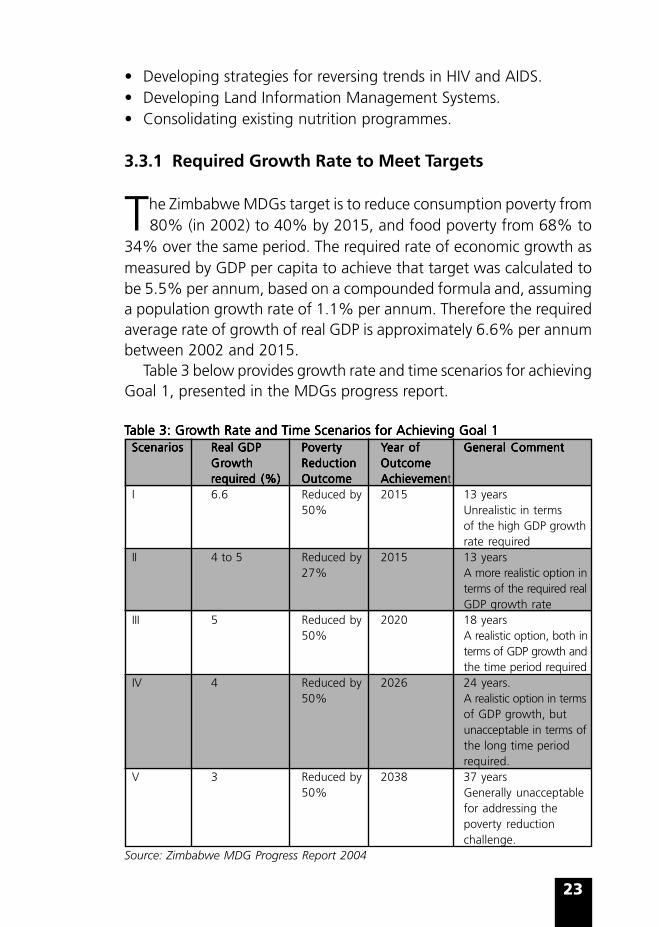
3.3.1 Required Growth Rate to Meet Targets
The Zimbabwe MDGs target is to reduce consumption poverty from80% (in 2002) to 40% by 2015, and food poverty from 68% to
34% over the same period. The required rate of economic growth asmeasured by GDP per capita to achieve that target was calculated tobe 5.5% per annum, based on a compounded formula and, assuminga population growth rate of 1.1% per annum. Therefore the requiredaverage rate of growth of real GDP is approximately 6.6% per annumbetween 2002 and 2015.
Table 3 below provides growth rate and time scenarios for achievingGoal 1, presented in the MDGs progress report.
TTTTTable 3: Grable 3: Grable 3: Grable 3: Grable 3: Growth Rate and Towth Rate and Towth Rate and Towth Rate and Towth Rate and Time Scenarios for Achieving Goal 1ime Scenarios for Achieving Goal 1ime Scenarios for Achieving Goal 1ime Scenarios for Achieving Goal 1ime Scenarios for Achieving Goal 1ScenariosScenariosScenariosScenariosScenarios Real GDPReal GDPReal GDPReal GDPReal GDP PovertyPovertyPovertyPovertyPoverty YYYYYear ofear ofear ofear ofear of General CommentGeneral CommentGeneral CommentGeneral CommentGeneral Comment
I 6.6 Reduced by 2015 13 years50% Unrealistic in terms
of the high GDP growthrate required
II 4 to 5 Reduced by 2015 13 years27% A more realistic option in
terms of the required realGDP growth rate
III 5 Reduced by 2020 18 years50% A realistic option, both in
terms of GDP growth andthe time period required
IV 4 Reduced by 2026 24 years.50% A realistic option in terms
of GDP growth, butunacceptable in terms ofthe long time periodrequired.
V 3 Reduced by 2038 37 years50% Generally unacceptable
for addressing thepoverty reductionchallenge.
Source: Zimbabwe MDG Progress Report 2004
24
In Table 3 above, various scenarios are presented. Option III wasfound to be realistic in respect to the required rate of growth andacceptability in terms of the time that it will take to achieve the targetof reducing poverty by half. This is the basis that determines thedirection of national policies and programmes.
3.4 Macroeconomic Policy Framework 2005-2006 “TowardsSustained Economic Growth” November 2004
As already pointed out, the current development policy documentcontaining the major elements of the Zimbabwe’s macroeconomic
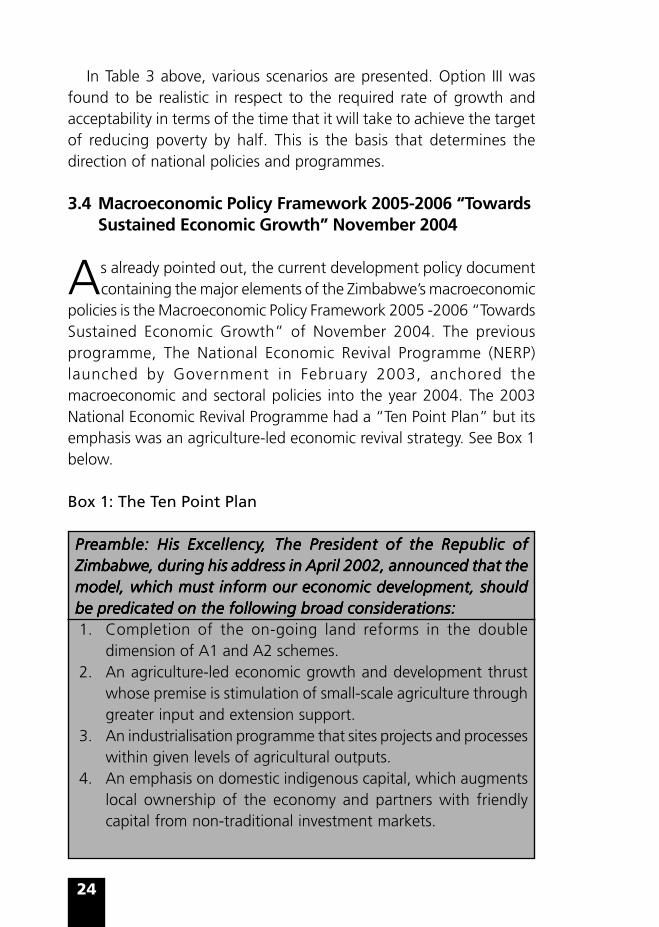
policies is the Macroeconomic Policy Framework 2005 -2006 “TowardsSustained Economic Growth” of November 2004. The previousprogramme, The National Economic Revival Programme (NERP)launched by Government in February 2003, anchored themacroeconomic and sectoral policies into the year 2004. The 2003National Economic Revival Programme had a “Ten Point Plan” but itsemphasis was an agriculture-led economic revival strategy. See Box 1below.
Box 1: The Ten Point Plan
PrPrPrPrPreamble: His Excellencyeamble: His Excellencyeamble: His Excellencyeamble: His Excellencyeamble: His Excellency, The Pr, The Pr, The Pr, The Pr, The President of the Republic ofesident of the Republic ofesident of the Republic ofesident of the Republic ofesident of the Republic ofZimbabwe, during his address in April 2002, announced that theZimbabwe, during his address in April 2002, announced that theZimbabwe, during his address in April 2002, announced that theZimbabwe, during his address in April 2002, announced that theZimbabwe, during his address in April 2002, announced that themodel, which must inform our economic development, shouldmodel, which must inform our economic development, shouldmodel, which must inform our economic development, shouldmodel, which must inform our economic development, shouldmodel, which must inform our economic development, shouldbe predicated on the following broad considerations:be predicated on the following broad considerations:be predicated on the following broad considerations:be predicated on the following broad considerations:be predicated on the following broad considerations:1. Completion of the on-going land reforms in the double
dimension of A1 and A2 schemes.2. An agriculture-led economic growth and development thrust
whose premise is stimulation of small-scale agriculture throughgreater input and extension support.
3. An industrialisation programme that sites projects and processeswithin given levels of agricultural outputs.
4. An emphasis on domestic indigenous capital, which augmentslocal ownership of the economy and partners with friendlycapital from non-traditional investment markets.
25
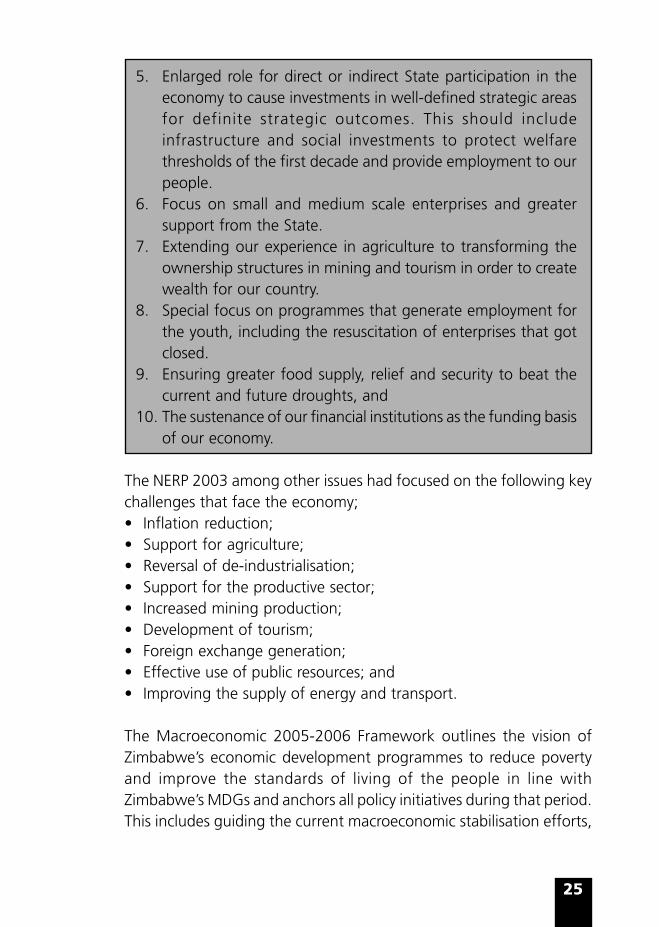
5. Enlarged role for direct or indirect State participation in theeconomy to cause investments in well-defined strategic areasfor definite strategic outcomes. This should includeinfrastructure and social investments to protect welfarethresholds of the first decade and provide employment to ourpeople.
6. Focus on small and medium scale enterprises and greatersupport from the State.
7. Extending our experience in agriculture to transforming theownership structures in mining and tourism in order to createwealth for our country.
8. Special focus on programmes that generate employment forthe youth, including the resuscitation of enterprises that gotclosed.
9. Ensuring greater food supply, relief and security to beat thecurrent and future droughts, and
10. The sustenance of our financial institutions as the funding basisof our economy.
The NERP 2003 among other issues had focused on the following keychallenges that face the economy;• Inflation reduction;• Support for agriculture;• Reversal of de-industrialisation;• Support for the productive sector;• Increased mining production;• Development of tourism;• Foreign exchange generation;• Effective use of public resources; and• Improving the supply of energy and transport.
The Macroeconomic 2005-2006 Framework outlines the vision ofZimbabwe’s economic development programmes to reduce povertyand improve the standards of living of the people in line withZimbabwe’s MDGs and anchors all policy initiatives during that period.This includes guiding the current macroeconomic stabilisation efforts,
26
that target at reducing inflation, initially to below 200% by the end of2004, double digit levels in 2005 and single digit inflation thereafter.3
The specific sectoral objectives of the Framework are:• Agriculture development;• Industrialisation;• Infrastructure development;• Investment promotion;• Social services delivery;• Poverty reduction;• Economic empowerment;• Youth development and gender;• Macroeconomic stability; and• Strengthening institutional capacity.
The new 2005-2006 Framework was built on the Ten Point Plan of theNERP as already mentioned and was aimed at consolidating the gainsachieved during the implementation of that programme and also tostrengthen policy implementation and coordination. When themacroeconomic framework was designed, the country continued toface challenges in the areas of inflation reduction, foreign currencygeneration, capacity utilisation, infrastructure and public servicedelivery.
The new Framework identified macroeconomic stabilisation as oneof the crucial challenges that needs to be addressed. In this regards, itset out macroeconomic targets for the years 2005 and 2006 and theseare presented in Table 4 below.
3 Year on year inflation was 622.8% in January 2004 and had declined to 251.5% by September2004. (It is now above 1 000%).
Real GDP market prices growth rateReal GDP market prices growth rateReal GDP market prices growth rateReal GDP market prices growth rateReal GDP market prices growth rate - 8.5% - 2.5% 3.5 - 5% 5%
SAVINGS AND INVESTMENT
Gross national savings (%of GDP) -5% 4.3% -1.7% 5.1%
Gross national investment (% of GDP)Gross national investment (% of GDP)Gross national investment (% of GDP)Gross national investment (% of GDP)Gross national investment (% of GDP) 9% 10% 12% 20%
INFLATION
CPI inflation annual average 3.65% 382% 90% 40%
CPI inflation at end of periodCPI inflation at end of periodCPI inflation at end of periodCPI inflation at end of periodCPI inflation at end of period 599% 150160% 30-50% 7-9%
BUDGET
Deficit (% of GDP)Deficit (% of GDP)Deficit (% of GDP)Deficit (% of GDP)Deficit (% of GDP) 3-5% 3-5% 2-3% 0.3%
MONEY (M3)
Broad money growth at end of periodBroad money growth at end of periodBroad money growth at end of periodBroad money growth at end of periodBroad money growth at end of period 416.5% 181.2% 60% 12-20%
Source: “Towards Sustained Economic Growth” – Macroeconomic Framework 2005-2006, Government of Zimbabwe, November 2004.
A number of measures were tabled for implementation in meetingthese challenges so as to meet the targets as set out. To ensure prudentfiscal policy, Government decided to do the following:• Continue to strengthen and implement measures that focus on
matching revenues with expenditures.• Develop a financial management legal framework.• Develop further the Public Finance Management System (PFMS).• Improving financial management of parastatals and monitoring their
debt portfolio.
These measures are expected to keep the budget deficit low, improvefinancial management in all government departments and avoidexpenditure overruns. Measures aimed at controlling expenditures areexpected to compliment these. These measures involve strengtheningthe Implementation and Control of Expenditure Unit (ICEU) andimposition of penalties in terms of regulations governing managementof public resources to reduce wasteful expenditures by Ministries andDepartments. Government would invoke the Audit and ExchequerAct for all Ministries that incurred unauthorised expenditures.
28
The following measures, among others, were to be put in place toimprove revenue mobilisation:• Widen the tax net, enhance revenue collection and minimise revenue
leakages;• Strengthen the Zimbabwe Revenue Authority (ZIMRA);• Introduce mechanisms for taxing the informal sector;• Limit tax exemptions to social needs; and• Update the registration of companies for all companies to pay tax.
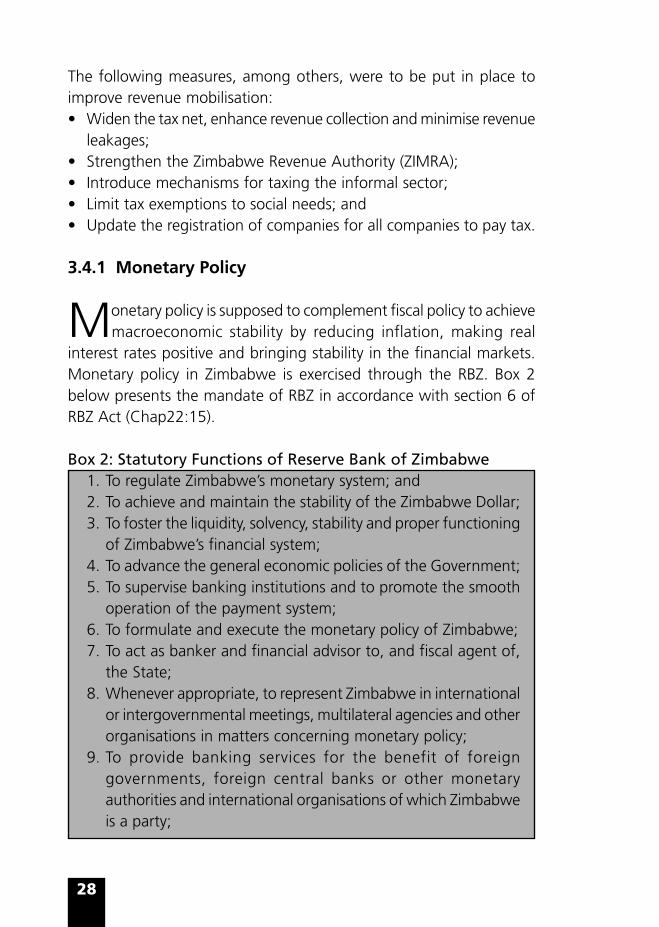
3.4.1 Monetary Policy
Monetary policy is supposed to complement fiscal policy to achievemacroeconomic stability by reducing inflation, making real
interest rates positive and bringing stability in the financial markets.Monetary policy in Zimbabwe is exercised through the RBZ. Box 2below presents the mandate of RBZ in accordance with section 6 ofRBZ Act (Chap22:15).
Box 2: Statutory Functions of Reserve Bank of Zimbabwe1. To regulate Zimbabwe’s monetary system; and2. To achieve and maintain the stability of the Zimbabwe Dollar;3. To foster the liquidity, solvency, stability and proper functioning
of Zimbabwe’s financial system;4. To advance the general economic policies of the Government;5. To supervise banking institutions and to promote the smooth
operation of the payment system;6. To formulate and execute the monetary policy of Zimbabwe;7. To act as banker and financial advisor to, and fiscal agent of,
the State;8. Whenever appropriate, to represent Zimbabwe in international
or intergovernmental meetings, multilateral agencies and otherorganisations in matters concerning monetary policy;
9. To provide banking services for the benefit of foreigngovernments, foreign central banks or other monetaryauthorities and international organisations of which Zimbabweis a party;
29
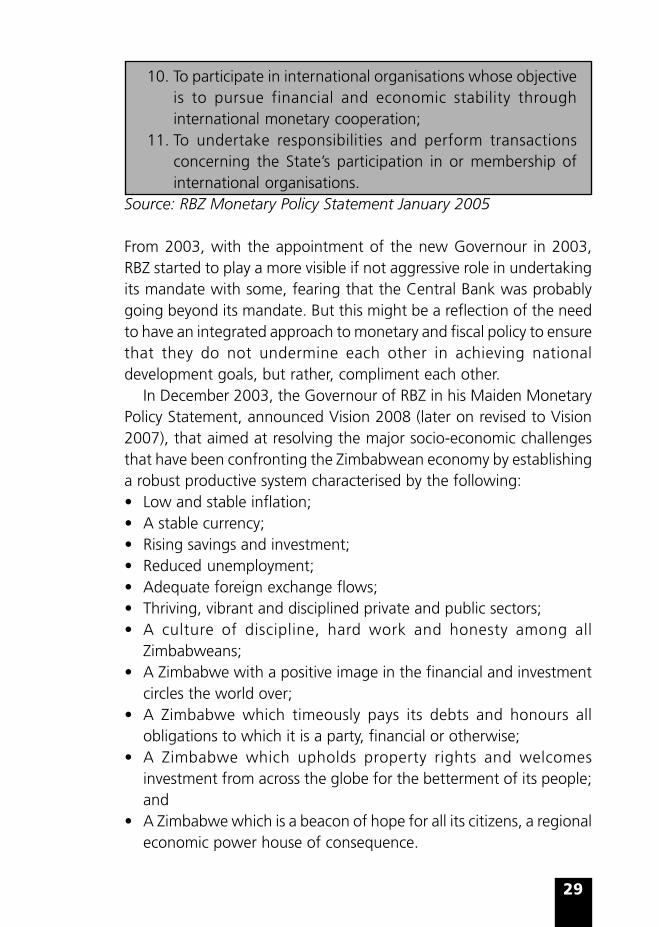
10. To participate in international organisations whose objectiveis to pursue financial and economic stability throughinternational monetary cooperation;
11. To undertake responsibilities and perform transactionsconcerning the State’s participation in or membership ofinternational organisations.
Source: RBZ Monetary Policy Statement January 2005
From 2003, with the appointment of the new Governour in 2003,RBZ started to play a more visible if not aggressive role in undertakingits mandate with some, fearing that the Central Bank was probablygoing beyond its mandate. But this might be a reflection of the needto have an integrated approach to monetary and fiscal policy to ensurethat they do not undermine each other in achieving nationaldevelopment goals, but rather, compliment each other.
In December 2003, the Governour of RBZ in his Maiden MonetaryPolicy Statement, announced Vision 2008 (later on revised to Vision2007), that aimed at resolving the major socio-economic challengesthat have been confronting the Zimbabwean economy by establishinga robust productive system characterised by the following:• Low and stable inflation;• A stable currency;• Rising savings and investment;• Reduced unemployment;• Adequate foreign exchange flows;• Thriving, vibrant and disciplined private and public sectors;• A culture of discipline, hard work and honesty among all
Zimbabweans;• A Zimbabwe with a positive image in the financial and investment
circles the world over;• A Zimbabwe which timeously pays its debts and honours all
obligations to which it is a party, financial or otherwise;• A Zimbabwe which upholds property rights and welcomes
investment from across the globe for the betterment of its people;and
• A Zimbabwe which is a beacon of hope for all its citizens, a regionaleconomic power house of consequence.
30
The overall objectives of monetary policy are consistent with thoseof fiscal policy.
Given that inflation has been seen as “the number one enemy whosecontainment requires total and unwavering commitment and thecollaboration of stakeholders”, successive monetary policy frameworks,from December 2003 (and before), have taken various measures toaddress this problem, taking into consideration the prevailing situation,but so far without sustained success. The December 2003 MonetaryPolicy set the following targets for the monetary policy.
12 Months to December 2004:• To reduce inflation from the expected initial peak of 700% in early
2004 to the range of 170-200% by December 2004.
24 Months to December 2005:• Reduce inflation to below 100% (from three to two digit figures).• Convergence of the exchange rate into a stable currency with one
exchange rate.• Move away from the dual interest rate policy and make real interest
rates positive.
5 Years to December 2008 (subsequently revised to 2007):• Reduce inflation to between 5–9%.• Entrench Inflation and currency stability to have a “healthy
economy”.
3.4.2 Measures Taken to Achieve Goals and Targets
The bank aimed to pursue a tight monetary policy and contain moneysupply (M3) growth from around 500% by December 2003 to
200% by December 2004.For the first 12 to 18 months, a dual interest rate policy was adopted.
This was aimed at encouraging economic growth while fightinginflation by discouraging speculative and consumption borrowing.Interest rates on consumption, speculative and other non-productiveactivities were to attract unsubsidised market related rates. Industryand commerce, including the public sectors of the economy were given
31
time to adjust their operations, adjust their balance sheets and boosttheir production bases using subsidised financial resources.
RBZ established the Productive Sector Facility as a part of the supplyside in response to the Bank’s anti-inflationary drive. In this regard, theRBZ made financial resources available to commercial banks for on-lending to troubled companies in the productive sector at concessionaryinterest rates.
The reserve requirement ratio for commercial and merchant banks’savings and time deposits was increased from 20% to 30% and thatof finance houses from 5% to 15%. For the first time, RBZ imposedstatutory reserve requirements to discount houses and this was peggedat 30% on their non-bank deposits and 30% on 75% of buildingsocieties deposits that do not support mortgage lending.
In this regard, the new Framework envisaged a continuation of therestrictive monetary policy, which has the dual purpose of supportingthe productive sectors through concessionary financing facilities.Further supervision and surveillance of the financial sector to ensurecompliance with the Banking Act was given priority.
The financial sector plays a very important role in facilitating andsupporting economic growth. It is therefore important for the countryto have an effective, efficient and resilient financial system that isresponsive to the changing economic requirements. The financial sectorplays an intermediary role and should mobilise and channel savingstowards investment.
In view of the need to safeguarding the stability of the financialsystem, RBZ’s supervisory role was strengthened and the powers forlicensing and/or withdrawal of licences were shifted from the parentministry to the Reserve Bank in December 2003.
3.4.2.1 Exchange Rate Management
From the late 1990’s up to 2003, Zimbabwe operated a fixedexchange rate regime and internal economic dynamics show that
this system was inappropriate. The exchange rate was overvalued asreflected by the existence of a foreign exchange parallel market. TheRBZ considered other options. The FrFrFrFrFree Float Systemee Float Systemee Float Systemee Float Systemee Float System was consideredinadvisable in a thin market such as Zimbabwe. The Managed CrawlManaged CrawlManaged CrawlManaged CrawlManaged Crawl
32
system, based on inflation differentials with Zimbabwe’s major tradingpartners, was also considered and judged to be inadvisable at thatstage. The TTTTTradable Cerradable Cerradable Cerradable Cerradable Certificate of Deposittificate of Deposittificate of Deposittificate of Deposittificate of Deposit system (CDs) was alsoconsidered and found to fall short on certain attributes and wastherefore disregarded.
With effect from January 2004, Zimbabwe adopted the ContrContrContrContrControlledolledolledolledolledAuctionAuctionAuctionAuctionAuction approach for the foreign exchange management system.Under this system, foreign exchange is auctioned through a CurCurCurCurCurrrrrrencyencyencyencyencyExchangeExchangeExchangeExchangeExchange – an independent body that operates under the supervisionof RBZ. Under the controlled auction system, exporters discharge CD1forms on the basis of gross export proceeds and they can retain 50%of their foreign exchange earnings in their Foreign Currency Accounts(FCA). The FCA are maintained with RBZ and have a time limit withinwhich the foreign currency has to be used – initially set at 60 days.After the set period, exporters are required to liquidate their FCAsinto the market. Of the remaining 50% of export earnings that is notretained in the FCAs, half (25% of total earnings) is sold immediatelyto the auction market at the ruling auction rate while the remainingother half, (25%) is surrendered to the RBZ at the prevailing official(fixed) exchange rate – at time of study Z$800 per US dollar. Thisforeign exchange was reserved for critical imports and otherGovernment requirements.
3.4.2.2 Balance of Payments
The new Framework aims at improving the Balance of Payments(BOP) through the increased export of value added goods as
opposed to traditional primary commodities. The Framework adoptedthe strategy of broadening export markets and encouraging theexploration of non traditional markets such as Latin America and Asia.In this regard, it is necessary to strengthen national institutions involvedin supporting export activities such as the Export Credit GuaranteeCompany of Zimbabwe (ECGCZ) and ZimTrade; establishment of theZimbabwe Export Import Bank. The Framework requires negotiationwith existing and potential financers for loan rescheduling and newfinancing but at the same time ensuring timeous repayment of loansand credits to external creditors.
33
3.5 Inflation and Budget Deficit – Implications for SADC
On the whole, Zimbabwe has been experiencing relatively highand certainly increasing rates of inflation since the end of the
1980s decade. Fiscal deficits have been observed to be typically at theheart of inflation in developing countries, particularly high and hyper-inflation.4 Countries that implemented structural adjustmentprogrammes were required to set targets for reducing budget deficits(in addition to monetary policy) as one of the means of reducinginflation and attaining macroeconomic stability.
SADC identified core inflation and budget deficit as indicators ofconvergence, among others, that are aimed at achievingmacroeconomic stability. In this regards, as pointed out before, thetarget is to reduce inflation to 9% by 2008 and down to 3% by 2018.Budget deficit as a percentage of GDP should be reduced to 5% and1% over the same period. This is in line with the conventional wisdomthat associates high budget deficits with inflation. Therefore the majorreason for setting targets to limit Government expenditures to someproportion with respect to revenue is to contain the rate of inflation.
In the case of Zimbabwe, this relationship between budget deficitand inflation is not so obvious. The exchange rate and foreign currencyavailability appear to have a very strong bearing on inflation. Prior tothe adoption of the structural adjustment programme in 1991, inflationin Zimbabwe was a result of a serious shortage of commodities on themarket due to supply bottlenecks. These came about because of foreignexchange shortages that constrained the availability of imported inputsand spare parts for maintaining production machinery and equipment(see Zwizwai and Ndoro). Therefore, inspite of efforts made to reducegovernment expenditure and other demand management measuresimplemented during ESAP, inflation rose from 12.4% per annum in1990 to 22.6% by 1995.
The 2005 IMF country study on Zimbabwe also found out that “thenormally positive relationship (between fiscal deficits and inflation) isnot immediately evident in Zimbabwe for the period 1997 and 2004”The same study argued that the deficit-inflation relationship has been
4 “Zimbabwe: Selected Issues and Statistical Appendix”, IMF Country Report No. 05/359, October 2005.
34
influenced, in recent years by an overvalued exchange rate and quasi-fiscal activities of the Reserve Bank of Zimbabwe (RBZ), includingproducer and credit subsidies, exchange related losses from multipleexchange rates, and interest payments on sterilisation operations.
1997 to 2000
Between 1997 and the year 2000, budget deficit increased and roseto nearly 18% (24.1% excluding grants). During this period, year onyear consumer price inflation rose from 24% in January 1998 to 55%in December 2000. Budget deficit and inflation exhibited a positiverelationship as is usually expected in the long run. The budget deficitis explained, among other things by, a large unbudgeted payment towar veterans in 1997 that was followed by significant increases in thesalaries of civil servants prior to the 2000 elections. At the same time,the IMF suspended its support to adjust programmes in Zimbabweand thus Government had to make up for at least some proportion ofthe shortfall in expected external financing.
2001 to 2003
During this period, contrary to conventional wisdom, inflationcontinued to rise from 112.1% in 2001 to nearly 600% in 2003 andduring the same period, budget deficit on a cash basis, declined from5.5% of GDP (7.5% on a commitment basis) to a near balance by2003. Government controlled expenditure, particularly on the wagebill. The government wage bill was allowed to decline in real terms asinflation continued to accelerate and as a result, that wage bill fellfrom 16.5% of GDP in 2000 to less than 7.5% of GDP in 2002.However, during the same period, money supply grew sharply andthis was because of credit to non-government sectors as the quasi-fiscal activities of RBZ expanded. Money supply growth rate increasedfrom about 100% in 2001 and picked up to 400% by the end of2003.
During this period, the exchange rate remained pegged initially atZim$ 55/USD 1 and then revised to Zim$ 824/USD 1, but all the same
35
the exchange rate was overvalued as reflected by parallel illegal marketoperations.
2004
During this year, Government expenditures rose sharply from the rangeof 20-27% between 2001 and 2003 to 40% of GDP in 2004. Althoughrevenues increased considerably because of the introduction of valueadded tax (VAT), the fiscal position deteriorated. The increase ingovernment expenditure, ahead of the 2005 parliamentary elections,on wages, capital project and transfers was much higher than theincrease in revenue.
The Reserve Bank tightened monetary policy, and interest rates rosesharply in the first quarter of 2004. Government shifted the financingof the fiscal debt from RBZ to public borrowing through sales of treasurybills. Expansion in net credit to Government from RBZ was contained,money growth slowed and inflation declined to around 133% by theend of 2004 compared to around 600% a year before – all thishappened despite the growing budget deficit. The shift of Governmentfrom borrowing to non-RBZ sources was reflected in the share ofGovernment in overall credit growth that increased from 17% in 2003to 31% in 2004. Government maintained subsidised credit facilitieson producers from the high real interest rates and the increasinglyovervalued foreign exchange rate on the auction market.
3.5.1 Implications on SADC Regional Integration
The above experience of Zimbabwe with regards to inflation andbudget deficit raises at least two issues of relevance to SADC
regional integration. The issue about the trends of inflation and budgetdeficit in Zimbabwe raises the concern about how these relate to theSADC targets of macroeconomic convergence. The second issue relatesto the theoretical underpinnings or assumptions that are related tothe relationship between budget deficit and inflation in so far asachieving macroeconomic stability is concerned. A third matter thatwill arise later on, is the extent to which macroeconomic targets (orprojections) in current or operating development plans can be a
36
sufficient basis to assess whether a country is moving towardsattainment of SADC macroeconomic stability convergence targets ornot.
Zimbabwe: Missing the Inflation and Meeting the Budget DeficitConvergence Targets?
Zimbabwe is in a peculiar situation not found in other SADC countries.After embarking on the land reform programme in 2000, in the formthat it took, Zimbabwe went on to a head-on collision with thedeveloped Western countries, particularly the UK and the USA. Thecountry also delayed in meeting its obligations with internationalfinancial institutions and was suspended from IMF support. The longand short of it all is that Zimbabwe became isolated by the Westerninternational community under the conditions of targeted sanctions.
Since 2000, Zimbabwe has been experiencing conditions of highand hyper-inflation never experienced before. Inflation declined in theyear 2004, only to start rising again the following year up to this time(March 2006). First of all, it is quite obvious that Zimbabwe is far fromthe convergence targets set by SADC with respect to inflation. Secondly,it is obvious that the inflation trends prevailing in the country areundesirable both for macroeconomic stability and the achievement ofnational development goals and objectives as announced in thecountry’s development plans and the Zimbabwe MDGs. Thirdly,Government is committed to achieving the SADC convergence targetsas is reflected by the over-ambitious self-set targets that in some casesare unrealistic given the prevailing economic conditions and relationswith the international community.
The setting out of macroeconomic targets in Zimbabwe is influencedby a number of factors. One factor is the desired outcomes – in so faras such outcomes are expected to improve the standard of living ofthe populace and in that regard, meet the overriding goal of reducingpoverty in accordance with the MDGs. Another important factor thatdetermines setting of targets is the underlying assumption aboutexogenous factors. In the case of Zimbabwe, two such factors arevery important. These are rainfall and international relations.
37
With regards to rainfall, Zimbabwe is an agriculturally basedeconomy with industry having strong linkages with the agriculturalsector. Over the years, economic performance has been very stronglycorrelated to agricultural performance. In fact Zimbabwe used to bethe bread basket of SADC and was food self sufficient. Economicperformance declined in years of drought, especially when thesebecame successive. The setting of high and ambitious macroeconomicperformance indicators in the current Macroeconomic PolicyFramework that are in line with achieving SADC macroeconomicsconvergence targets are a reflection of positive expectations withregards to agricultural performance over the plan period. This is alsoreflected by current serious Government efforts to rehabilitate irrigationschemes and open new ones so as to ensure that the country attainsat least food self sufficiency during years of drought.
On the aspect of international relations, Government has beenmaking efforts to have these normalised, particularly through the RBZ.The Governour of the RBZ has on several occasions repeated thatZimbabwe will continue to pay its international obligations and engagethe international community to normalise relations. Indeed, Zimbabwehas made great strides in paying off its international debts under verydifficult conditions of national foreign currency shortages, particularlygiven other competing national priorities such as fuel and electricityprocurement requirements.
It is with this background of expectations and/or assumptions thattargets that are unrealistic are set. Violation of the assumptions leadsto wide disparity between the planned targets and the actual outcomes.Unfortunately such disparities have happened more often than not inthe case of Zimbabwe.
The implications for this with regards to achieving macroeconomicstability in Zimbabwe is that, it appears attainment of such stability isdetermined by factors well beyond the realm of macroeconomicvariables such as government deficit. Stability requires addressingfundamental structural problems facing the real economy; creating anational environment conducive for business with minimumuncertainty, and restoring normal international relations.
38
The Governour of RBZ recognised the multidimensional aspects ofinflation in Zimbabwe and that the challenges facing the country defyattempts to “box” them into some theoretical or traditional economicphenomena as known.
“Our inflation levels, for instance, cannot be attributed to simplecost-push/demand-pull forces as we traditionally know them; a greatdeal of it is to do with such human-behavioural vices as greed,speculation, negative self-fulfilling expectations, lack of confidence,weakened patriotism and commitment to the country, short-termism,corruption and politics; the treatment of which will require more thana set of Monetary or Fiscal policies and pronouncements” (MonetaryPolicy, December 2003).
Box 3 below details the causes of inflation in Zimbabwe from theRBZ’s perspective.
Box 3: Causes of Inflation in Zimbabwe from the RBZ’s Perspective
1. The foreign exchange shortages and parallel market activitieswhich have effectively dollarised this economy from propertyrentals/purchases to many other non-forex consuming goodsand services.
2. Imported inflation arising from 1. above, especially arising fromthe iniquitous parallel market forces in the country, as opposedto major price changes at source.
3. Shortages of basic commodities due to factors such as drought,sheer greed, as well as hoarding for speculative purposes, greymarket forces reacting to ineffective and sometimes ill advisedacross the board price controls and inadequate output at thefactory level due to shortages of forex for essential capital andworking capital purposes.
4. Loose monetary policies which have given rise to high moneysupply (M3) growth.
5. Self-fulfilling high inflation expectations, practices andbehaviour leading to inexplicable, fundamentally-flawed pricingdecisions, logic-defying practices and parochial actions byindividuals, firms and sectors of the economy.
6. High and persistent government budget deficits.
39
7. Misuse of concessionary resources meant to support theproductive sector but misdirected towards financingconsumptive and sometimes speculative ventures and forexparallel market activities.
8. Every one of grey market activities for goods and services, fuel,cash and other basic items.
9. Corruption to the extent that it involves the externalisation offorex, under-pricing, transfer pricing of goods and servicesproduced in the country, smuggling of precious minerals,agricultural inputs and outputs as well as other forms andpractices which diminish or rob the country of economicoutputs produced from the country’s resources and inputs.
10. Side-kick effects from parastatal financings especially wherethe parastatals charge less than break-even prices for theiractivities and end up seeking support from the fiscus or directlyfrom RBZ.
11. Asset-driven price inflation arising from the diversion of savingsfrom banks into real-estate, forex purchases, equities, vehiclesand other forms of consumptive spending due to lower thaninflation interest rates. This scramble of property is crowdingout credit from real productive activities thereby causingcapacity constrains at the supply level.
12. Lack of international balance of payments support.13. Inaccurate business, social and political reporting by the media
which has tended to fuel rampant speculation and causedthe populace to take positions that worsen the situation.Cooperation with the media and accurate media reporting ofissues will be a key source of inflation stabilisation.
Source: Monetary policy Dec 2003 – Appendix 7
It is encouraging to note that the RBZ does realise the complex natureof sources of inflation and in this regards has attempted to takeapproaches that are broader than money growth management in itsattempt to deal with the problem. This is a clear departure from pastpractices of RBZ that tended to confine itself to traditional moneysupply control.
40
The Zimbabwe experience points out at the fact that some of thetraditionally expected relationships between macroeconomic variablesthat have been used for setting targets may not exist all the time. Thesetting of targets needs to be closely linked to development objectives,taking into consideration specific conditions faced by differentcountries. It may become necessary for a given country to fulfil certaintargets while violating others, in order to meet the requireddevelopment objectives. For example for a country like Zimbabwe thatis not receiving assistance from international financial institutions, itmight be necessary to increase budget deficit in order to meet growthtargets and social development indicator targets and objectives. Similarapparent contradictions are observed with regards to trade relatedindicators that are discussed in section 4 below.
41
4 Trade Policy Framework
At independence, in 1980, Zimbabwe inherited a trade policy thatwas linked on exports to Zambia, South Africa, Malawi and
Botswana. The re-entry of the country into the international communityopened avenues to new markets. The country immediately became amember of the Southern African Development Co-ordinationConference (SADCC), with prospects of a wider regional market. Italso became a member of the Lome Convention, and obtainedpreferential entry for agro-exports in the European EconomicCommunity markets. Further, Zimbabwe joined the Preferential TradeArea (PTA), accessing a closer but extra-regional market in Southernand East Africa. In addition, the Government negotiated trade (barter-type) agreements with a number of socialist countries: North Korea,the former Yugoslavia, Hungary, Cuba, China, etc.
The post-independence trade policy, evidently, did not seek worldmarket penetration for industrial produce. Instead, the trade policythrust sought three aspects:• Accessible markets for raw agricultural materials and products;• Preferential treatment in markets where quality and competition
would be obstacles to surmount, given the domestic base whichwas still short of major skills, capital and technology; and,
• The publicity and attraction of foreign investment by among otherthings, opening up more embassy missions.
The trade policy of Zimbabwe in the 1980s was influenced by thegeneral development thrust of Import Substitution Industrialisation(ISI) that was pursued. Under this policy, the foreign currency allocationmechanisms were used to determine imports on the basis of nationaldevelopment priorities. Government also promoted exports throughsuch schemes as the export revolving fund, the export retention schemeand the incremental export bonus scheme. There was therefore a periodduring which ISI was encouraged under a protective trade regime,and at the same time, exports were encouraged through the foreignexchange allocation system.
42
In 1990, Government abandoned the ISI strategy in favor of anopen market economy, by adopting ESAP. The main thrust of this tradepolicy was to shift away from the system of excessive controls on foreignexchange allocation, to a more market-based system. Imports were tobe liberalised. Most items were to be imported through the OpenGeneral Import Licence (OGIL) system, which previously was veryrestricted. The introduction of a more favourable tariff structure waspart of the reform - i.e. a tariff structure that would enhance thecompetitiveness of industry. On the whole, trade liberalisation entailedremoving quantitative restrictions on imports, while reducing the levelof tariff protection.
Most SADC countries went through similar adjustment programmes,and their guiding development philosophy has largely remained thesame – namely the neo-liberal approach where the private sector takesthe lead in development, with the Government’s role largely confinedto creating a national macroeconomic environment that is conduciveto private sector development.
SADC entered into a Trade Protocol that came into effect at thebeginning of September 2000. The overall target is to have 85% of allintra-SADC trade at zero tariffs level by 2008 and the remaining 15%is to be liberalised by 2012. This would effectively lead to theestablishment of a free trade area.
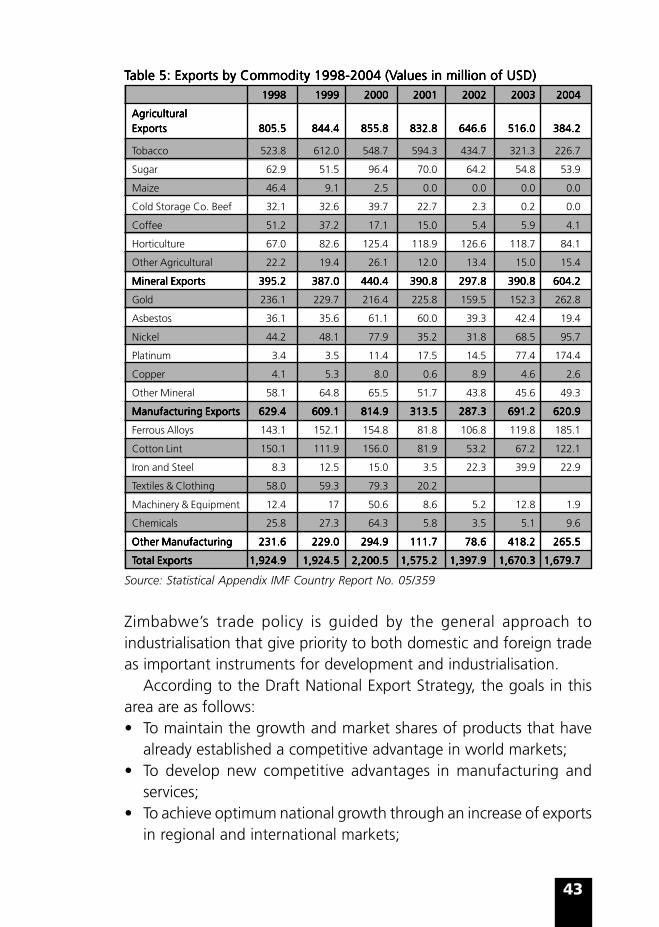
Zimbabwe is one of the few countries in SADC endowed with adiversified export base, both at sectoral level and within sectors. Inmining, Zimbabwe has gold, platinum, nickel granite, asbestos anddiamonds. In agriculture, the country has tobacco, cotton, beef, sugar,tea, coffee and horticultural products. The country also exports a varietyof manufactured products, although the industrial base has beenshrinking. In tourism, hunting has emerged as an important source offoreign currency. Table 5 below shows the major exports in Zimbabwethat demonstrate the diversity of the national export base.
43
TTTTTable 5: Exporable 5: Exporable 5: Exporable 5: Exporable 5: Exports by Commodity 1998-2004 (Vts by Commodity 1998-2004 (Vts by Commodity 1998-2004 (Vts by Commodity 1998-2004 (Vts by Commodity 1998-2004 (Values in million of USD)alues in million of USD)alues in million of USD)alues in million of USD)alues in million of USD)19981998199819981998 19991999199919991999 20002000200020002000 20012001200120012001 20022002200220022002 20032003200320032003 20042004200420042004
Source: Statistical Appendix IMF Country Report No. 05/359
Zimbabwe’s trade policy is guided by the general approach toindustrialisation that give priority to both domestic and foreign tradeas important instruments for development and industrialisation.
According to the Draft National Export Strategy, the goals in thisarea are as follows:• To maintain the growth and market shares of products that have
already established a competitive advantage in world markets;• To develop new competitive advantages in manufacturing and
services;• To achieve optimum national growth through an increase of exports
in regional and international markets;
44
• To narrow down the gap between the country’s export earningsand import payment through the achievement of the export targets;and
• To establish backward linkage industries and services with a view tousing more local raw materials, expand the product base and identifyand export higher value added products.
4.1 Bilateral and Multilateral Trading Arrangements
Zimbabwe has more than 40 Bilateral Trade Agreements that fallinto the category of Most Favoured Nation (MFN) status. The
country has also Bilateral Preferential Trade Agreements with Botswana,Democratic Republic of Congo, Malawi, Mozambique, Namibia andSouth Africa. The country is also negotiating preferential tradingagreements with Iran and Zambia.
Zimbabwe is a member of the following regional multilateralorganisations:• SADC;• COMESA;• African Caribbean and Pacific States/European Union Agreement
(ACP/EU) that will soon be replaced by the Economic PartnershipAgreements (EPAs);
• Regional International Facilitation Forum (RIFF);• Generalised System of Preferences (GSPs);• Group of Fifteen; and the• World Trade Organisation (WTO).
The country is seriously exploring new external trade markets and hasadopted what has been termed the “Look East” Policy. This policywas prompted by the deterioration of economic and political relationswith the traditional Western trading countries and the withdrawal offinancial assistance to the country by the international financialinstitutions. The Asian countries have large markets, have beenexperiencing high growth rates and do not use stringent technicalbarriers to trade or bar trade from other countries.
45
4.2 Trade Promotion
To facilitate efforts directed at exploring new markets and increaseexports in the traditional markets, the Zimbabwe Draft National
Export Strategy, has a number of initiatives to be undertaken in thisregards. The National Trade Development Organisation, Zimtrade, hasan important role to play in these endeavours.
The mission of Zimtrade is to assist businesses in Zimbabwe todevelop and expand profitable international trade in products andservices by:• Identifying and developing export markets;• Market and product research;• Trade promotion missions to and from other countries;• Trade publications;• Assistance in trade policy formulation and bilateral and multilateral
trade negotiations;• Training and development of SMEs and new exporters;• Offering Matching Grant Finance; and• Providing information on sources of raw materials, exports and
imports.
Zimtrade is developing a trade map for Zimbabwe. This will enableZimbabwean exporters to identify new markets around the world andproduct opportunities as well as evaluate market access barriers. TheTrade Map will enable potential exporters to access the followingfeatures:• Analysis of present export markets;• Pre-selection of priority markets;• Overview of competitors in global and specific markets;• Review of opportunities for product diversification in a specific
market; and• Information on tariffs and non-tariff barriers.
Government recognises the strategic importance of Zimtrade inpromoting trade and therefore plans to strengthen its activities.
46
The Zimbabwe Revenue Authority (Zimra) will be encouraged tomake speedy repayments of VAT refunds. Zimra is involved in tradefacilitation through simplifying and harmonising customsadministration procedures.
In light of the computerised CDI forms, it is important to institutean interactive system for the computerisation of the Customs DutyTradable Export Incentive Certificate (CDTEIC) with the existing systemsof monitoring CDI. This will automatically and timely result in theissuance of Customs duty Tradable Export Incentive Certificates, asdistinct from inordinate delays (occasioned primarily by exporters banks)presently pertaining.
4.2.1 Financial Support to Exporters
Since ESAP was implemented Zimbabwe faces the problem of de-industrialisation. Many companies closed down due to the impact
of external competition and an unfavourable economic environment.The strategy of Government is to encourage new entrance in the exportmarket and support the traditional exporters. Several financial supportmeasures have been proposed in the Draft National Export Strategy.These are presented in Box 4 below.
47
Box 4: Financial Support to ExportersBox 4: Financial Support to ExportersBox 4: Financial Support to ExportersBox 4: Financial Support to ExportersBox 4: Financial Support to Exporters
There are a number of Export Incentive Schemes (EIS) administeredby the RBZ under the Exchange Control Act and these include the
following:The first is the Free On Board (FOB) Export Incentive Scheme. This is
made available in the form of tradable duty exemption certificatesvalued at amounts equivalent to a specified percentage of the valueof the exporter’ acquitted CD1s. The Duty Exemption Certificates areredeemed through the use of Duty Payment Vouchers drawn againstthese certificates to settle import duty on capital goods, raw materialsand spares, as might be specified by the Zimbabwe Revenue Authority(Zimra). This incentive was reviewed upwards from 10% of the FOBvalue of exports to 15% with effect from January 2004.
The second EIS involves exemption from the 50% foreign earningsrequirement on incremental exports. This scheme commenced in July2003 and allows exporters to retain 100% of their earnings arisingfrom incremental exports. The incremental value of the exports iscalculated on a quarterly basis.
The other EIS is what has been termed the Carrot and Stick ExportRetention Scheme. This scheme is aimed at providing incentives toexporters to fully repatriate their export earnings into the country asearly as possible by rewarding exporters on the basis of the acquittalperiod. Exporters who declare their earnings and/or repatriate theirforeign exchange within the shortest period would be allowed to retainmore foreign currency for their own use than those who take longeror are inefficient when it comes to their debtors control.
4.2.3 Export Processing Zones – Export Incentive Schemes
Export Processing Zone (EPZ) companies that are locally registeredand locally owned are now subject to the same foreign exchange
surrender requirements applicable to all other exporting companies asoutlined above. However, locally registered but foreign owned EPZcompanies are exempted from the foreign exchange surrenderrequirements. However, such companies would be required to paytheir electricity and fuel bills in foreign currency.
49
The SADC trade performance indicator for macroeconomicconvergence is the current account deficit as percentage of GDP andexternal reserves measured in terms of months of import cover. Thetargets set for the current account deficit are an attainment of a currentaccount deficit of at most 9% by 2008, and having this reduced to3% of GDP by 2018. With regards to external reserves, these aresupposed to be built up to meet the normal requirements of 3 monthsworth of imports by 2008 and 6 months import cover by 2012.
Table 6 below shows Zimbabwe’s performance with respect to theset targets of these indicators.
TTTTTable 6: Balance of Payments 1998-2004able 6: Balance of Payments 1998-2004able 6: Balance of Payments 1998-2004able 6: Balance of Payments 1998-2004able 6: Balance of Payments 1998-200419981998199819981998 19991999199919991999 20002000200020002000 20012001200120012001 20022002200220022002 20032003200320032003 20042004200420042004
Current accountbalance as % ofGDP -4 0.5 -0.4 -1 -2.6 -4.6 -5.7
Zimbabwe is already performing better than the target indicators withrespect to current account deficit. This is partly because the countryhas a diverse export base as already pointed out. But more important,the supposedly good performance with respect to this indicator isactually a reflection of suppressed import demand due to unavailabilityof foreign currency and lack of financial support from internationalfinancial institutions. The new export drive is likely to improve theposition of the current account balance. An interesting point thatemerges from this situation is that the attainment of a near balance inthe current account does not necessarily reflect a desirable situation.
50
When it comes to the level of foreign reserves Zimbabwe is faraway from this SADC indicator of macroeconomic convergence. Since1999, the foreign reserves have been at only 3 days of import covercompared to the target of 120 days by 2008 and 240 days by 2018.The limited import cover juxtaposed with low deficit on the currentaccount reaffirms the situation of suppressed import demand due toshortage of foreign currency and limited options in this regards – surelynot a very healthy situation. Achievement of numeric macroeconomictargets should be looked at within the context of achievingdevelopment goals. The fundamental objective should not be simplyto achieve targets at all costs.
The apparently healthy situation of Zimbabwe with regards to thebalance of trade target indicator is not healthy at all. An initial imbalanceis actually necessary by way of increasing imports so as to stimulateproduction and bring about efficiency in the industry that producetradable goods and basic commodities at affordable prices.
51
5 Labour Market Policies
5.1 Industrial Relations
At independence in 1980, the Government of Zimbabwe adoptedan industrial relations philosophy that was characterised by the
desire to protect workers from exploitation, given the situation thatprevailed prior to independence. The need to protect workers wasalso necessary because the labour movement was weak and facedorganisational problems. In pursuit of this objective, Government putin place legislation that provided for the fixing of national minimumwages, below which payment would be illegal. The Minister responsiblefor labour had control over the termination of an employee’s contract.The Minister was empowered to further regulate industrial relationsin any way s/he deemed fit through the use of subsidiary legislation. Itis interesting to note though, that this period was characterised bythe outlawing of industrial action or collective job action – and thisprevented workers from withdrawing their labour as a means ofcollective bargaining leverage.
A major turn around in Zimbabwe’s industrial relations occurredwith the enactment of the Labour Relations Amendment Act Number12 of 1992 after the adoption of ESAP. Government took a policy ofwithdrawing itself from the centre stage of industrial relations. Codesof conduct negotiated between employers and employees at WorksCouncil or Employment Council level were provided for, but thesewere to be registered with the Ministry of Labour. Dispute settlementwould now start at the work place and would only go beyond onappeal.
The Labour Relations Amendment Number 17 of 2002 stated theAct as meant to advance social justice and democracy at the workplace by:• Giving effect to the fundamental rights of employees provided for
under Part II (of the Act);• Giving effect to the international obligations of the Republic of
Zimbabwe as a Member State of the International LabourOrganisation and a member of or party to any other internationalorganisation or agreement governing conditions of employment;
52
• Promotion of fair labour standards;• Promotion of participation of employees in decisions affecting their
interests in the work place; and• Securing the just, effective and expeditious resolution of disputes
and unfair labour practices.
The fundamental rights of employees as provided for under Part II ofthe Act are:• Entitlement to membership of trade unions and workers committees,
including being an office bearer;• Protection against discrimination on grounds of race, tribe, place
of origin, political opinion, colour, creed or sex;• Rights to fair labour standards; and• Rights to democracy in the work place.
The legal framework still allows the Minister to specify the minimumwage and benefits for any class of employees in any undertaking orindustry through a statutory instrument. The Minister also has powersto require employers to grant or negotiate increments on annualincome of such minimum amount or percentage as s/he may specifyand prohibit the payment of less than such minimum amount orpercentage. However for all practical purposes wage negotiations arenow conducted through Employment Councils. The Labour RelationsAct gives powers to the Minister to direct any certified employer’sorganisation and any certified trade union or federation of such tradeunion to form an employment council.
Employment councils are mandated to assist their members in theconclusion of collective bargaining agreements. They should alsoprevent or settle disputes that have arisen between employers oremployees organisations on the one hand and employees, workerscommittees or trade unions, on the other. The wages agreed throughsuch negotiation are then gazetted by the Minister and become legallybinding.
The importance of well designed industrial relations regulations isthat they can reduce costs of production by improving labourproductivity, encouraging the accumulation of in-firm skills throughlearning by doing and by providing stable industrial relations. On the
53
other hand, over-zealous legislation aimed at protecting jobs can reducethe flexibility of employers to respond to business cycles through layingoff workers. Normally, an increase in the cost of labour results in thesubstitution of labour for capital, while the reverse occurs if the costof capital increases. Of course the extent of such substitution dependson the technology of production. A production process using advancedtechnology tends to have limited substitution possibilities comparedto less complex processes.
The price of capital is influenced by a number of factors. Theseinclude the efficiency of domestic capital goods producers, theexchange rate, the tariffs applied to imports of such goods and theprevailing rates of interests on loans for purchases of these goods. Ithas been argued that the net effect of policies taken under a liberaltrade regime associated with structural adjustments is that, at least inthe short term, the cost of capital generally rises relative to that oflabour there by encouraging the adoption of labour intensivemethods.5 The implication of this is that, other things being constant,trade liberalisation policies within the framework of structuraladjustment should lead to employment creation. Unfortunately nothingis constant.
5.2 Employment
The table below presents the employment performance of Zimbabwefor the period 1998 to 2004.
TTTTTable 7: Employment in Zimbabwe 1998 to 2004able 7: Employment in Zimbabwe 1998 to 2004able 7: Employment in Zimbabwe 1998 to 2004able 7: Employment in Zimbabwe 1998 to 2004able 7: Employment in Zimbabwe 1998 to 2004
Source: IMF Statistical Appendix to Zimbabwe Country Report No. 05/359
5 “Employment prospects in Zimbabwe under the Economic Structural Adjustment Programme” ILOand Ministry of Labour, Manpower Planning and Social Welfare, June1992, Harare.
54
Table 7 above shows that total employment in Zimbabwe has beendeclining steadily since 1998 right up to 2004. This trend is commonto all the productive (as opposed to service) sectors of agriculture,forestry and fisheries, mining and quarrying; and manufacturing sector.In fact, the only sector that witnessed growth in the labour force isfinance, insurance and real estate and education to some extent.
The more liberal labour market policy instituted with the structuraladjustment programme was partly aimed at encouraging investmentand reducing private sector costs of adjustment in so far as labourcosts are concerned. The new legislation that was put in place providedfor termination of employment, for economic or financial reasons(retrenchments), and for the parties to negotiate and agree ontermination packages. The negotiations would be undertaken underthe auspices of the works council for that industry, but if no agreementwas reached, the matter would be taken up by the RetrenchmentCommittee in the Ministry of Labour.
It would however be stretching it too far to try and explain thetrends in employment exclusively on the basis of the industrial relationspolicies. The major explanation of trends in employment is overalleconomic performance as determined by the interaction of severaldomestic policies; and after 2000, Zimbabwe’s relations with theinternational community.
The Zimbabwean economy is closely integrated with the agriculturalsector, and performance in this sector has an effect on the rest of theeconomy. Unfortunately, the country has been faced with recurringdraught and this has adverse effect on the economy in more than oneway. First of all, agriculture is a net foreign exchange earner undernormal harvest. With poor agricultural performance, the foreignexchange earning capacity of the sector is eroded. This reduces theamount of the much needed foreign exchange that is essential tokeep industry going. The impact of this is manifested in shortages ofimported inputs and below-full-capacity industrial production. Thesecond point is that droughts necessitate the importation of food.Under these conditions, agriculture, that is supposed to be a net foreignexchange earner begins to compete with other sectors for the limitedavailable foreign exchange.
55
Zimbabwe has faced fuel and electricity shortages. All petrol anddiesel is imported and the country’s electricity generating capacity isnot adequate to meet national industrial and domestic demand. Hencethe country relies on electricity imports from neighbouring countriesthat are on the same interconnected grid to meet the deficit in itselectricity requirements. These are strategic areas that have to beprioritised with regards to foreign exchange.
The last point is that agriculture has strong production linkageswith the manufacturing sector – in particular the agro-processingindustry. Agriculture provides inputs into these industries and shortagesof such inputs may necessitate importation, or operations belowcapacity. The implication of these three points with regards to outputand employment, in the agricultural sector itself and in agro-processingindustry and other sectors, is fairly obvious.
Since 2000, the Government of Zimbabwe has implemented theaccelerated land reform programme to address the prevailing inequitiesin land ownership. The land reform programme has been criticised forthe manner in which it was undertaken, in that it seriously disruptedagricultural activities. The need for land reform was well recognisedand already overdue, after the expiry of the limiting Lancaster Houseagreement in 1990. The disruption that occurred in agriculture, theisolation of Zimbabwe by the international community and drought,all worked to explain the poor performance of the Zimbabweaneconomy from year 2000 – in terms of output, employment, inflation,export performance and incidence and levels of poverty.
Fiscal policy is normally called upon to address problems that comeabout as a result of drought. Central Government importation of foodfor drought relief has a negative effect on the budget deficit, and thistends to exert inflationary pressures on the economy.
Zimbabwe used to be referred to as the food basket of SADC. Indeedthe country still has potential to be self sufficient in food productionand contribute to meeting the requirements of other food deficitcountries in the region. The country has a lot of irrigation potential.Some of this potential has been used before, but the irrigation schemesrequire to be rehabilitated, while other areas have notes been tappedat all. The Government of Zimbabwe recognises this and has startedefforts to rehabilitate and develop irrigation schemes. The pace of
56
developments in this direction depends on the budget that is alreadystrained. The issue of normalising international relations is importantin breaking this vicious circle because it could provide external financialassistance.
57
6 Social Impacts
This section examines the changes that are likely to occur inZimbabwe with implementation of macroeconomic policies aimed
at deepening SADC regional integration. Reference has already beenmade to the RISDP and MOU on convergence that point out to theneed for macroeconomic stabilisation as a necessary condition forsuccessful regional integration.
The countries within SADC have different national conditions thatprevail within them such as natural resources, levels of industrialdevelopment, prevailing economic conditions, economic structures and,quite important to Zimbabwe at this point, relations with theinternational community. Therefore, the implementation of RISDP andin particular, the MOU on convergence by the different SADC countrieswill affect the countries in different ways.
With regards to macroeconomic convergence, it is worth notingthat almost all the SADC countries went through the ESAP. The policiespursued under these programmes were quite similar and hence it is acorrect generalisation that SADC countries are already pursuing similardevelopment philosophies and development paradigms. Themacroeconomic targets agreed upon, reflect similar thinking; thatbudget deficits have to be contained and reduced, inflation addressedand minimised and the exchange rate and interest rates stabilised inorder to attain sustainable development that benefits the generalpopulation. Given that the objective of economic growth anddevelopment is to improve the wellbeing of the people, and thatmacroeconomic policies are used for this purpose, these policies havesocial impacts.
Social impact assessment relies on economic, social as well asenvironmental data sets. The data requirements and indicators includeincome related indicators and non-income indicators such aseducational attainment indicators, health related indicators andenvironmentally related indicators. The more commonly used socialdevelopment indicators in Zimbabwe are the food and totalconsumption poverty lines, net primary enrolment ratio, adult literacy,percentage of undernourished children below the age of five, underfive and maternal mortality rates, and rural population with access to
58
safe water. Table 8 below presents the social development indicatorsof Zimbabwe.
TTTTTable 8: Social Indicators: Table 8: Social Indicators: Table 8: Social Indicators: Table 8: Social Indicators: Table 8: Social Indicators: Trrrrrends 1988 to 2003ends 1988 to 2003ends 1988 to 2003ends 1988 to 2003ends 1988 to 200319881988198819881988 19901990199019901990 19951995199519951995 20002000200020002000 20022002200220022002 20032003200320032003
Employment Growth Rate 4.3 -2.2 -1.8 -5.9 -10.2 _
Structural Unemployment % _ _ _ _ >50 >50
% of Total Population belowthe FPL _ _ 577 _ 69 >69
% of Total Population belowthe TCPL _ _ 747 _ 80 >80
Net Primary Enrolment Ratio _ _ 81.9 _ 92.6 _
Primary School CompletionRate % 76 _ 76.1 75.1 _ _
Adult Literacy Rate % _ 80 86 88 _ _
% of Undernourished Childrenunder five _ 12.7 16.9 13 _ _
Under Five Mortality Rate(Deaths per 1,000 Live Births) _ 59.9 76.9 102.1 _ _
2003, 6 = average various sources, 7 = PASS1995, 8 + 1992, 9 = 1997, 10 = 1995 – 99
Source: National Accounts Statistics, Central Statistical Office 2003, Ministry of Finance and
Economic Development, 2003
59
6.1 Food and Consumption Poverty Indicators
The 1995 Zimbabwe Poverty Assessment Study found out that 57%of the Zimbabwean population lived below the Food Poverty Line
(FPL), indicating hunger or extreme poverty among Zimbabweans. Thisproportion was estimated to have increased to 67% by 2002. Similarlygeneral poverty as measured by the Total Consumption Poverty Line(TCPL) increased from 74% to 80% over the same period, accordingto the same study. These trends are consistent with macroeconomicgrowth trends and indirect indicators of poverty such as the real GDPgrowth rate that has continued to be negative since the late 1990sinto the 21st century.
Recent trends indicate that poverty is continues to increase in boththe rural and urban areas. Poverty is more common and pronouncedin households headed by women than those headed by men.
6.2 Child Malnutrition
Child malnutrition is a major problem associated with poverty. Thenational nutrition survey of June 2002 estimated that 11% of
children in urban areas and 26.5% of children in rural areas sufferfrom malnutrition. Factors that are responsible for this deterioratingsituation according to the same study are rapid economic decline,rapid decline in agricultural production, high inflation levels (at thattime above 400%)6 , low disposable incomes, high structuralunemployment (estimated at over 50%), high prevalence of HIV(estimated at that time to be over 33.7%)7 , and recurrent naturaldisasters (droughts and floods).
Given that more than 70% of the Zimbabwean population live inthe rural areas and rely heavily on rain fed agriculture, and that rainfallpatterns are unreliable, household food production and security hasremained uncertain and threatened. Poverty in Zimbabwe is worsenedby the high levels of inequalities with respect to income distribution.The GINI coefficient is estimated to be 0.57.8
6 The inflation rate currently prevailing have surpassed this figure considerably.7 This figure has subsequently declined to below 25%.8 Zimbabwe Human Development Report 2006.
60
6.3 Infant and Under Five Mortality
Infant mortality increased from 40 to 65 per 1,000 live births, whileunder five mortality increased from 59 to 102 per 1,000 live births
between 1985-89 and 1995-99. The Zimbabwe Demographic HealthSurvey (ZDHS) 1999 revealed that there is a strong relationship betweena mother’s level of education and a child’s chances of survival. Thechildren of mothers with no education experienced an under fivemortality rate of 119 per 1,000, and those of women with higherthan secondary school education experienced a mortality rate as lowas 21 per 1,000. Better educated women are likely to have betterknowledge of nutrition, hygiene and other practices related to healthcare.
Immunisation programmes against child illness also contribute tothe reduction of prenatal, neonatal and child mortality. The ZimbabweExpanded Programme on Immunisation (ZEPI) that was introduced in1982 had the objective of increasing coverage of all ZEPI vaccines to90% by the year 2000. The programme was assessed on the basis ofthe completion of the Primary Course of Vaccination (PCV) which isone of the measures of quality and effectiveness of such a programme.The ZEPI was so successful that it beat its target and before the end of1997, PCV coverage had reached 96.6%. However, in spite of thepositive outturn of PCV coverage, measles immunisation has beendeclining from 77% in 1988 to 74% in 1994 and to 71% in 1999.
The decline in immunisations is very much influenced by theproblems experienced by the health care delivery system. Theseproblems are manifested by shortages of drugs and staff whoseshortage is a result of brain drain among health professionals. Drugshortages are a result of limited allocations to the health sector, withthe requirements and/or expectation that cost recovery measures shouldmeet these resource demands. This is quite in line with the policies ofreducing budget deficit, but the social impact is obvious. Consequently,Zimbabwe has become a training ground for medical personnel – bothdoctors and nurses, who leave the country for greener pastures becauseof low salaries, poor working conditions and frustrations because oflack of drugs and medical equipment.
61
These are some of the negative effects of policies that are moremacroeconomic indicator target led which are less responsive to longterm social and human development requirements of the populationand nation at large.
On the whole the significant strides that had been made in theearly 1980s in the area of social and human development startedreversing when structural adjustment programmes were implemented.
6.4 Educational Attainment Indicators
The pattern is different and somewhat mixed up in the area ofeducation. By the mid 1990s, Zimbabwe had achieved near
universal primary education. The enrolment ratio has been increasing,reaching 81.9% in 1994 and improving further to 93% by 2002.Literacy levels for 15 to 24 year olds rose from 95% to 98% between1992 and 1999. But during that same period, the primary schoolcompletion rate that was 82.6%, declined to 76.1% by 1995 andfurther to 75.1% by 2000.
6.5 Access to Safe Water
The proportion of the rural population with access to safe waterand sanitation has improved. Access to safe water is very important
for the health of the population. Between 1992 and 2000, theproportion of rural population with access to safe water increasedfrom 65% to 75% - a 10 percentage point improvement over a periodof 8 years. Access to safe sanitation improved from 48% to 58%between 1990 and 2000. These are positive developments becausefrequent outbreaks of diarrhoea usually result in many deaths whenyet they are largely preventable through access to safe drinking water,sanitation and food hygiene.
62
6.6 Challenges That May Affect Attainment of SADCConvergence Indicators
6.6.1 HIV/AIDS, Malaria and other Diseases
Zimbabwe is facing severe HIV and AIDS epidemics although it hasmade considerable progress in addressing the spread of the
pandemic. In 2002, the HIV and AIDS prevalence rate in Zimbabwewas one third of the population. This has subsequently declined toless than a quarter of the population due to serious Government effortsin containing the epidemic through educational programmes. UNAIDSestimated that in 2001, the number of children orphaned by AIDS inZimbabwe was around 780,000 while 70% of patients admitted inhospital wards were due to HIV and AIDS related conditions.
The national target in accordance with the MDG is to reduce HIVprevalence in the medium term (2005) to 24%; and 16% by 2015 (inthe 15-24 age group).
The increasing level of poverty, poor and unhygienic livingenvironments and the HI virus have contributed to the resurgence ofTB, which thrive on immune systems weakened by chronic infectionsand by malnutrition. The number of TB cases was estimated to at9,132 in 1990, increasing to 30,831 cases in 1995 and to a high of51,918 cases in 2000. The national target is to reduce the incidenceof TB from the 399 persons per 100,000 prevailing in 2000, back tothe level of 121 per 100,000 people by 2015 – the level that prevailedin 1991.
Clinical malaria has also increased from 65 per 1,000 people in1990 to over 122 per 1,000 in the year 2000. The declining immunityof the population as a result of HIV and AIDS has made people morevulnerable to malaria-related illness and deaths. The national target isto reduce the incidence of clinical malaria to 60 per 1,000 people by2015.
Combating HIV and AIDS, malaria and other diseases, is one of thethree priority areas identified in the Zimbabwe MDGs. Social challengesthat Zimbabwe faces in this regard regards include behavioural change,stigma and discrimination against people living with HIV and AIDS.Macroeconomic challenges in the fight against HIV and AIDS are related
63
to the availability of financial and human resources to facilitate accessto essential drugs and also for the care and support of orphans. Theshortage of foreign currency is a limiting factor in the procurementand distribution of antiretroviral drugs and essential drugs for thetreatment of opportunistic infections.
The health sector is experiencing significant budgetary reductionsin real terms. The brain drain phenomenon referred to previously is aresult of declining real wages and generally unattractive conditions ofservice. It is also important to put in place appropriate care and supportsystems for orphans in order to avoid the pressure of socialdisintegration that might lead to child labour, children living in thestreets and child abuse.
6.6.2 Poverty
The Zimbabwe MDG of eradicating extreme poverty and hungerand improving livelihoods lies at the heart of all development efforts.
Unfortunately current economic developments are yielding outcomesthat are in the opposite direction. The incidence of poverty has beenincreasing over the years as already pointed out. The concerns ofGovernment about the wellbeing of the people and the need to ensurethat people do not die of hunger means that there has to be acombination of short term consumption support measures and mediumto long term measures of addressing poverty. There is need for thecreation of an enabling environment for pro-poor economic growthunder non-inflationary conditions. There is need to adopt strategiesfor employment creation with special attention being given to smallscale enterprises, reducing dependence on rain fed agriculture andsupport for the land reform programme.
64
65
7 Summary and Conlusions
This study has provided a broad stock taking of the status of thepolicy framework of Zimbabwe, particularly with respect to target
indicators set out in the SADC MOU on macroeconomic convergence.The underlying philosophy with regards to convergence is the need toattain macroeconomic stability for development to occur and improvethe livelihoods of the people of SADC. The aspect of improving thewelfare of the people is fundamental and should not be lost in thepursuit of achieving the convergence targets.
The economic situation in Zimbabwe has been deteriorating fromthe end of the last century up to this one. Zimbabwe adopted thestructural adjustment programme in 1990 and this programme failedto meet the desired objectives of improving the quality of life. Theprogramme was subsequently officially abandoned. But the currentpolicies being pursued are basically entrenched in the samephilosophical approaches as those under ESAP. The big difference isthat in 2000, Zimbabwe embarked on the fast track land reformprogramme that saw the eviction of white farmers without noticeand in many cases in a violent way. This strained Zimbabwe’s relationshipwith the developed Western countries, particularly UK and USA withthe resultant cutting of aid to Zimbabwe. The Government ofZimbabwe responded by taking a firm stance against what it saw asthe “revival of colonialism” that was aimed at reversing the land reformprogramme. Zimbabwe took a Pan-African stance that was aimed atfighting the exploitation of African and other developing countries bythe developed Western countries. But after all is said and done, themacroeconomic policies followed are within the neo-liberal frameworkthat was the basis of structural adjustment, with limited reversals aimedat reducing the negative impact of such policies.
The income performance indicators of Zimbabwe – GDP, FPL andCPL – have been on the decline indicating poor economic performance.Zimbabwe is experiencing hyper-inflation that is not showing any signsof stability and this needs to be addressed urgently. The inflationindicator is not only off target, but moving in the wrong direction.The same can be said of the above income indicators, the onlydifference is that of magnitude.
66
The budget deficit is on target but this has not helped in addressingthe inflation problem. In fact the causes of inflation in Zimbabwe areso multi-dimensional that the normally assumed relationship betweenbudget deficit and inflation has been violated.
In the area of trade, the current account deficit target for 2008 hasalready been achieved, but the external reserve/import cover target isway off. Import cover is 0.1 against the target of 3 months by 2008.There is suppressed demand for imports which are needed in order tovitalise the economy.
The exchange rate remains overvalued. The Reserve Bank ofZimbabwe considered a number of options for exchange ratemanagement and decided to use the controlled auction system. Underthis system, exporters are allowed to retain a certain proportion oftheir export earnings and surrender the balance to the Reserve Bankfor auctioning. The country is experiencing serious foreign currencyshortages that have manifested themselves in several ways includingsevere shortages of fuel and disruptions in electricity supplies. In March2006, the official exchange rate, i.e. the inter-bank rate, was peggedat USD 1 to Zim$ 99,000 while the parallel market rate was aroundUSD 1 to Zim$ 200,000 The parallel market rate has since declinedfurther.
The experience of Zimbabwe requires that caution be exercised whenit comes to macroeconomic convergence target indicators with respectto the setting of the targets (which has already been done) and moreimportant, the interpretation of indicator performance among SADCcountries. There is also the issue of a mix in target performance. Acountry such as Zimbabwe might perform well in some indicators anddo badly in others. It is necessary to understand the underlying factorsbecause in most cases, performance indicators are a reflection oroutcome of the fundamentals and under-currencies within an economy.
The objectives of ensuring equity and eradicating poverty stated inthe SADC treaty and the RISDP are noble objectives that should bepursued vigorously. But if target indicators of convergence focussingon macroeconomic stability take the centre stage, preoccupation withthese might end up being the end rather than the means to the end.This point was clearly expressed by the Minister of Public Service, Labourand Social Welfare in Zimbabwe, Nicholas Goche, when he said:
67
“The uniqueness of public service arrangements worldwide makesit difficult to apply the outcomes of consultative processes wholesomely.It is acknowledged that the fiscal determination of percentage of GrossDomestic Product (GDO) militates against consultations on conditionsof service in the public sector.”9
This is simply one illustration that shows how budget deficit targetscan undermine legitimate and desirable labour market policies put inplace to protect the welfare of workers (through collective bargaining).
The extent to which SADC regional integration and the policy targetsset and agreed upon, will achieve the noble objectives stated above,will to a large extent be determined by the underlying approachesespecially with regards to the region’s relationship with the internationalcommunity within the context of globalisation. It is argued that:
“The new SADC approach takes globalisation as given, seeing itsrole as one of compliance and facilitation. The original approach ofviewing regionalisation as a collective defence instrument to protectlocal economies and industries from wider competition has beenreplaced by an open regionalisation that exposes the individualcountries and regions to the vagaries of the world economy wherethe risk of contagion is very high.”10
What this points at is that, collective SADC policies should take intoaccount the nature of economic relationships that prevail or shouldprevail between these countries and developed countries, if they areto achieve their fundamental and noble objectives.
9 Quoted in The Business Herald, 17 October 2005: 4.10 G. Kanyenze, “Macroeconomic Framework and Finance in Southern Africa”, Paper prepared for the
Alternatives to neo-liberalism in Southern Africa – ANSA - Project.
68
69
Bibliography
1. Sibanda, A.: Report on the Symposium and Inaugural Congress ofthe Zimbabwe Industrial Relations Association (ZIRA), July. 1994,Harare.
2. Gono,G. Reserve Bank of Zimbabwe, Monetary Policy Statement,January 2005.
3. Gono,G. Reserve Bank of Zimbabwe, Monetary Policy Statement,July 2004.
4. Gono,G. Reserve Bank of Zimbabwe, Monetary Policy Statement,July 2005.
5. Gono,G. Reserve Bank of Zimbabwe, Monetary Policy Statement,October 2004.
6. Kanyenze, Macroeconomic Framework and Finance in SouthernAfrica, Paper prepared at the “Alternatives to Neo-Liberalism inSouthern Africa – ANSA – Project,” December 2005.
7. Government of Zimbabwe, (supported by UNDP) ZimbabweMillennium Development Goals: 2004 Progress Report, 2004.
8. Government of Zimbabwe, Draft National Export Strategy (no date).9. Government of Zimbabwe, Growth with Equity – Policy Statement,
1981.10. Government of Zimbabwe, Labour Relations Act, Chapter 28:01,
Revised Edition, 1996, Harare.11. Government of Zimbabwe, Labour Relations Amendment Number
17, Harare, 2002.12. Government of Zimbabwe, Macro-Economic Policy Framework
2005 – 2006: Towards Sustained Economic Growth, November2004.
13. Government of Zimbabwe, Millennium Economic RecoveryProgramme, August 2001.
14. Government of Zimbabwe, National Economic Revival Programme,February 2003.
15. Government of Zimbabwe, National Economic Revival Programme:Measures to Address the Current Challenges, February 2003.
16. Government of Zimbabwe, Zimbabwe First Five Year NationalDevelopment Plan, 1986 – 1990.
70
17. Government of Zimbabwe, Zimbabwe National TransitionalDevelopment Plan, 1982 – 1985.
18. Government of Zimbabwe, Zimbabwe Programme for Economicand Social Transformation, April 1998.
20. Murerwa,H. Mid-Term Fiscal Policy Review Statement, July, 2004.21. Murerwa,H. The 2005 National Budget Statement, November 200422. International Monetary Fund, Zimbabwe: Selected Issues and
Statistical Appendix, Country Report No. 05/359. IMF, WashingtonD.C.
23. Senaona,M.P. Deepening Regional Integration in SADC: theCurrent Status of Macroeconomic Convergence in SADC Region,Paper presented at workshop on “Deepening Integration in SADC– Macroeconomic Policies and their Impact”, Stellenbosh, SouthAfrica, 13-14 April 2005.
24. Poverty Reduction Forum (PRF), Zimbabwe Human DevelopmentReport 2003: Redirecting our Response to HIV and Aids, PRF-IDS,University of Zimbabwe, 2003.
25. Ralph van der Hoeven, Economic Reforms and Labour Markets inAfrica in “African Political and Economic Monthly – SouthernAfrican Aconomist” Vol. 13 No. 4, January 2000.
26. Lall,S. Wignaraja,G. Sellek, M. and Robinson, P. Zimbabwe:Enhancing Export Competitiveness, Economic Division,Commonwealth Secretariat, December 1997.
27. SADC Secretariat, Regional Indicative Strategic Development Plan,2003.
71
Deepening Integration in SADC
Zimbabwe – Missing SADC MacroeconomicTarget
Part: 2
Perception of Business and Non-State Actors inZimbabwe
72
List of Tables
Appendix 1: Tables for Business Survey
Table B1: Type of Business.............................................................. 107Table B2: Main Activity of Company............................................... 107
Table B3: Number of Employees..................................................... 107
Table B4: Period of Operation........................................................ 107Table B5: Annual Turnover............................................................. 108
Table B6: Annual Imports and Exports............................................ 108
Table B7: First and Second Main Export Market.............................. 108Table B8A:Competition from Other Countries................................. 109
Table B9: Macroeconomic Impact of RI - Business Perceptions....... 109Table B10: Relevance of Trade Barriers............................................ 110
Table B11: Most Relevant Trade Barrier........................................... 110
Table B12: Second Most Relevant Trade Barrier............................... 109Table B13: Third Most Relevant Trade Barrier................................... 111
Table B14: Rating of Current Business Climate in Different Markets.. 112
Table B14: Continued...................................................................... 112Table B15: Impact of RI on Domestic Business.................................. 112
Table B16: Average Change by Sector as a Result of RI.................... 113
Table B17: Public Debates on Regional Integration.......................... 113Table B18: Attending Workshops/Seminars on Regional Integration.. 113
Table B19: Support for Regional Integration..................................... 113
Table B20: Preferred Degree of SADC Integration............................. 113
Appendix 2: Tables for NSA Survey
Table N1: Type of Organisation....................................................... 115Table N2: Period of Operation........................................................ 115
Table N3: Membership to SADC National Committee And
Regional Umbrella Organisation..................................... 115Table N 4: Invitation to SADC National Committee Meetings........... 115
Table N5: Participation in SADC National Committee Meetings....... 115
Table N6: Need to Increase Capacity among NSAs ......................... 116Table N7: Macroeconomic Impact of RI ......................................... 116
73
Table N8: Relevance of Trade Barriers ............................................ 116Table N9: Most Relevant Barrier to Trade........................................ 117
Table N10: Second Most Relevant Barrier to Trade.......................... 117
Table N11: Third Most Relevant Barrier to Trade............................. 117Table N12: Impact of RI on Domestic Business ............................... 118
Table N13: Impact of RI on NSA's Involvement in Policy Making...... 118
Table N14: Involvement in Design of Policies................................... 118Table N15: Impact of RI on NSA's Influence on Domestic Policies..... 118
Table N16: Public Debates on Regional Integration......................... 118
Table N17: Discussions of Regional Integration within Organisations.. 119Table N18: Organisation of Public Workshops/Seminars on RI ......... 119
Table N19: Use of Press Releases to Raise Issues of RI ..................... 119
Table N20: Attendance of Workshops/Seminars on RegionalIntegration..................................................................... 119
Table N21: Support for Regional Integration................................... 119
Table N22: Preferred Degree of SADC Integration........................... 120
List of ChartsChart 1: Percentage Sales in Domestic Market................................ 80
List of FiguresFigure 1: Classification of Trade Barriers.......................................... 91
74
75
1 Introduction
This survey is part of SADC's country wide studies on DeepeningRegional Integration in SADC, that are aimed at informing the
policy making process and various partners in this regards, in the areaof regional integration. The country studies have two components.The first component is a survey of perceptions of business and Non-State Actors (NSA) on regional integration. The second componentexamines the national macroeconomic policies and their implicationson regional integration.
It is expected that the survey will provide the Southern AfricanDevelopment Community (SADC) Secretariat, policy-makers inGovernment, chambers of commerce and industry, and otherdevelopment partners, valuable information that can be used as abasis for determining the most appropriate action programme forimplementing regional integration measures in the region.
The questionnaires used to investigate the perceptions of thebusinesses and NSAs, consists of three broad sections. The first sectionis aimed at providing the profile of the respondents. The second sectionis aimed at evaluating the perceived impact of regional integration onthe economy in general and on the different types of business at theenterprise level. The third and final section evaluates the extent ofpolicy debates on regional integration, and involvement of businessesand NSAs in this debate.
The rest of this report is structured as follows: Section 2 belowprovides the methodology used in conducting the survey. This isfollowed by Section 3, which presents the profiles of the respondents.Section 4 and 5 present the findings on the perceptions of businessand NSAs on regional integration and the business climate within SADCand beyond. Section 6 then addresses the extent of national debateon regional integration in Zimbabwe, before concluding remarks inSection 7.
76
77
2 Methodology
The two questionnaires used, one for business and the other forNSA, were designed by the Namibian Economic Policy Research
Unit (NEPRU). The terms of reference required a sample of at least 30businesses and 10 NSA. The small size of the sample brought aboutsome limitations in data analysis, particularly when it came todisaggregating perceptions of business and NSA by their profiles.
In sampling the companies to be interviewed, we used the businessdirectories of the Confederation of Zimbabwe Industries (CZI) and theZimbabwe National Chamber of Commerce (ZNCC). On that basis, arandom sample of 60 companies was compiled. These were contactedand questionnaires distributed to them physically and in some casesby e-mail. A trained research assistant made follow ups to explainaspects of the questionnaire that needed clarification. Some of theselected companies did not respond. Others did not cooperate, whileothers indicated that the questionnaire was not relevant to them, giventheir type of operations. A total of 38 responses was received.
The sample frame of the NSA was drawn from the Poverty ReductionForum directory of national stakeholders. This list is quite comprehensiveand includes business associations, the labour movement, employers'confederations professional associations, Non-GovernmentalOrganisations (NGOs), human rights organisations, churchorganisations and others. We selected those NSA whose focus was oneconomic and social issues. 20 NSA were randomly selected, andquestionnaires were distributed to them. The rest of the process wassimilar to the business perceptions survey and 12 responses werereceived.
78
79
3 Characteristics of Respondents
3.1 Business
30 out of the 38 companies (79%) interviewed were privatecompanies. 4 were parastatals and two were private-public
partnerships. The remaining 2, classified as others were actually soleproprietorships and as such they also qualify to be classified as privatecompanies (Table B1). In terms of sectoral distribution shown on (TableB2), slightly more than half of the responding companies (20) wereinvolved in manufacturing. Of these, 6 were involved in wholesaleand retail trade in addition to manufacturing. Four respondents wereinvolved exclusively in wholesale and retail trade. The other respondentswere in transport and communication (3), mining (2), financial services(2) tourism (1) and what was classified as others (5). The last categoryinvolved companies in printing, publishing and design, security services,metal fabrication and watch repairs.
In Zimbabwe, the size of enterprises is defined in terms ofemployment and turnover, in addition to other attributes. For thepurposes of this study, and given the hyper-inflation prevailing in thecountry, it was found to be more appropriate to use the employmentvariable for purposes of classifying enterprises by size. Large-scaleenterprises are defined as those employing more than 75 people inthe case of the manufacturing sector, and those employing more than50 people in all other sectors. Medium-scale enterprises are thoseemploying 50 to 75 in the manufacturing sector, and 30 to 50 forother sectors. Small-scale enterprises are those employing 5 but lessthan 50 for manufacturing and less than 30 for the rest of the economy.Any enterprise employing less than 5 people is classified as a microenterprise. 71% of the sample consisted of large companies employingmore than one hundred employees. The remaining 29% were micro,small and medium enterprises (Table B3). All the parastatals and public-private partnerships within the sample were large-scale companies.
Table B4 shows that 82% of the respondents had been in operationfor more than 10 years. 5 (13%) had been in operation for between 2and 5 years. There was only one response from a company that hadoperated for less than 2 years.
80
Given the fact that there was a higher rate of response from largescale companies, it was not surprising that as much as 74% of therespondents had annual turnover in excess of USD 100,000 (TableB5). Most of the respondents indicated that they were more involvedin trade with SADC countries than those outside the region. 75% ofthe respondents involved in exports, have a SADC country as theirnumber one export destination and the countries mentioned are SouthAfrica, Zambia, Botswana and Malawi in descending order (Table B7).95% cited a SADC country as their number 2 country or exportdestination. Countries mentioned are Malawi, Zambia, South Africafollowed by Botswana, Mauritius and Kenya.
The chart below shows that very few of the responding companiesrely heavily on export markets. The main market for most of them isthe domestic market. The domestic market for every four out of fivecompanies constitute up to 80% of total sales. This suggests potentialfor diversification into export markets if opportunities presentthemselves.
CharCharCharCharChart 1 - Pert 1 - Pert 1 - Pert 1 - Pert 1 - Percentage Sales in Domestic Marketscentage Sales in Domestic Marketscentage Sales in Domestic Marketscentage Sales in Domestic Marketscentage Sales in Domestic Markets
81
South Africa is the major source of competition, 65% of the companiesthat responded indicated that they faced some competition from thiscountry. 19% indicated that they faced strong competition from SouthAfrica and 29% faced moderate competition. It is interesting to notethat all the companies facing some competition from South Africa arenot against regional integration within SADC. The next major sourceof competition is Asia. 42% of the responding companies faced somecompetition from this region. 24% actually indicated that they facedstrong competition from Asia, while 16% indicated that they facedweak competition. Asia is followed by Botswana, Lesotho, Namibiaand Swaziland (BLNS), with almost one fifth of the respondentsindicated that they faced competition from this group of countries.(see Table B8).
3.2 Non-State Actors
Half of the NSA in the sample are civil society organisations, while33% are industry associations (see table N1). The remaining 2
are organised labour and organised employer organisations. 75% havebeen in operation for more than 10 years while the remaining 25%have been in operation for 6 to 10 years (see Table N2). Only one thirdof the respondents are members of a SADC National Committee whilethe other two thirds are not. On the other hand, 83% of these NSAare members of a regional umbrella organisation and only 17% arenot. (Table N3)
All the NSA interviewed were involved at one point or another, inthe design of domestic policies, while 75% of them participated inthe design of SADC policies. Only 25% were never involved in thedesign of SADC policies. The majority of the NSA respondents are ofthe opinion that regional integration will strengthen the involvementof NSA in policy design. 58% are of the opinion that it will stronglystrengthen their involvement, while 33% believe that the impact willbe slight but positive, this figure make a total of 92% of respondentswho feel that regional integration will strengthen their involvement inpolicy design. Only one NSA out of the 12 expected no changes. Nonebelieved that regional integration will weaken the involvement of NSAin policy design (Tables N13 to N15). It is interesting to note, however,
82
that when it comes to assessing the perceived impact of regionalintegration on the policy involvement of particular respondents - asopposed to the overall assessment, 8% believed that regionalintegration would slightly weaken their involvement. 83% were ofthe opinion that it would strengthen their involvement while 8%expected no changes.
In Zimbabwe, there has been a shift in the policy making process.Previously, there was very little consultation. The formation of theNational Consultative Economic Forum (NECF) created a broaderframework for the involvement of various stakeholders in thepolicymaking process.1 The results of the survey indicate that thisframework has been effective. It should be pointed out, however,that involvement in policy design does not necessarily guaranteeadoption of the preferred policies. Similarly, it is also possible thatpolicies agreed upon in forums such as this one, can be reversed bydecisions made outside the forums. And finally, policies agreed uponin such forums and implemented, can have their potential positiveimpact counteracted by other policies that may be made outside theforum.
1 NECF is a stakeholder driven and owned organisation which provides a broad based participationplatform for the formulation and implementation of national policies through dialogue and consensusbuilding among and between Government, private sector, labour, civil society and academia.
83
4 Perceptions on Regional IntegrationWithin SADC
This section examines the perceptions of both business and NSA,on regional integration using their responses to the questionnaires.
The major areas covered are overall macroeconomic impact of regionalintegration, assessment of the different types of barriers to enterprises,firm level impact of regional integration, and views on deepeningregional integration.
4.1 Perceptions on Macroeconomic Impact on RegionalIntegration
4.1.1 Business
On the basis of the responses received, the business community isin favour of regional integration. In fact all the responding
companies were in favour of regional integration within SADC andonly one among these was not in favour of regional integration ingeneral. Most companies were of the opinion that there were toomany barriers to trade within the SADC region that impeded tradeand the effective exploitation of a larger market. Some companiescomplained that there was too much talk about regional integrationwithin SADC and limited action on the ground.
Table B19 shows business perceptions on the macroeconomic impactof SADC regional integration. 92% of the respondents were of theopinion that regional integration will benefit the economy in general.This is despite the fact that they believed that regional integration willincrease competition on the domestic market. Respondents believedthat regional integration would ease production bottlenecks that theyface in the form of availability of inputs and spare parts for equipmentimported from the region. With the easing of such bottlenecks, regionalintegration will result in increased efficiency and competitiveness ofthe domestic industry. 97% of the respondents felt this way. 76% ofthe companies also felt that regional integration would reduce theprices of inputs, thus improving competitiveness. In addition, benefitsto the economy will further accrue from increased investment and
84
export opportunities that will be created as a result of regionalintegration.
92% and 89% of the respondents believed that RI would createnew investment and export opportunities respectively and 82% wereof the opinion that regional integration would result in a reduction ofprices of consumer goods. Further questions on administration revealedthat the decline in prices of consumer goods was a long termexpectation in view of the hyper-inflationary situation in the country.What was more likely to happen in the short and medium term was areduction in the rate of inflation.
74% of the responding companies were of the opinion that regionalintegration will have positive impact on their company's turnover. More(84%) believed that regional integration will have positive impact onother domestic producers.
With regards to the impact of regional integration on the labourmarket, about two thirds of the respondents were of the opinion thatregional integration would reduce the unemployment rate inZimbabwe, while one quarter disagreed with this position, with therest were not sure of the effect of the impact. Less than a third believedthat regional integration would lower the cost of labour. The majority(58%) disagreed and did not believe that regional integration wouldresult in lower wages.
Less than half (43%) believed that there will be an influx ofimmigrants to Zimbabwe as a result of regional integration. Thosethat held this view expected immigrants to come from countries suchas Mozambique and Malawi that have in the past supplied Zimbabwewith cheap unskilled labour. There were also expectations of a reversalin the brain drain that the country is facing. However, this was theview of the minority, as pointed out ealier.
These views of business on the impact of SADC regional integrationon the economy were deemed to be valid if the regional integrationwas within the Common Market for East and Southern Africa(COMESA) and the East African Community (EAC). 63% of therespondents expressed that their responses would be the same if thequestions asked related to COMESA or EAC.
85
On the human rights situation, more than half of the respondentsbelieved that regional integration would enhance these. 28% disagreedand 16% were not sure of the outcome. Only 22% of the respondentswere of the opinion that regional integration would reduce the politicalsovereignty of Zimbabwe. The majority (66%) disagreed, while theremaining 10% did not know the outcome. That result is not surprisinggiven the openly expressed position of the Government of Zimbabweon the matter of national sovereignty - that Zimbabwe will nevercompromise in defending its national sovereignty.
4.1.2 Non-State Actors
The perceptions of NSA on the macroeconomic impact of SADCregional integration are summarised in Table N7. Like in the case
of the business community, there is a general consensus among NSAthat regional integration will benefit the economy as a whole. Onlyone out of the twelve respondents disagreed with this position. AllNSA respondents were of the opinion that regional integration willcreate new export and investment opportunities. And like business,they also recognised that regional integration will increase competitionon the domestic market. 75% believed that the increased competitionwill improve efficiency of domestic production to remain competitive,while the remaining 25% felt otherwise. The majority of the NSAwere of the opinion that regional integration will reduce prices ofboth inputs and consumer goods.
Coming to the labour market, the position of the NSA is quite similarto that of business with respect to its impact on employment. Howevertheir positions differ when it comes to the expected impact on thecost of labour. The majority of the NSA, just like business, believedthat regional integration would reduce the unemployment ratealthough the percentage (58%) is lower than that of business, whileone quarter disagreed with this position. While less than a third of thebusiness respondents believed that regional integration would lowerthe cost of labour, 58% of the responding NSA believed that regionalintegration would lower the cost of labour. Like in the case of business,less than half (one third) believed that RI will result in an influx oflabour.
86
58% believed that regional integration will have a positive impacton domestic companies' turnover. 33% disagreed, while onerespondent was not sure about the outcome.
On the aspect of human rights, all NSA except one were of theopinion that regional integration will enhance the human rightssituation in Zimbabwe. Three quarters of them believed that regionalintegration could not undermine the political sovereignty of the countrywhile one quarter believed that it would reduce the country'ssovereignty.
4.2 Perceived Impact of Regional Integration onDomestic Businesses
4.2.1 Business
On the whole, the companies interviewed are optimistic that deeperregional integration will have positive effects on their business
operations (see Tables B15 and B16). More than 70% of therespondents predict that with deeper regional integration, they willincrease domestic production, employ more workers, venture into newbusiness activities and seek joint ventures with companies in otherSADC countries. Again more than 70% indicated that with deeperregional integration, they would import and export more to otherSADC countries and increase their access to cheaper inputs.
The above responses are partly a reflection of the constraints thatZimbabwe industries are facing and the hope that regional integrationwill contribute towards relieving these constraints. Zimbabwe faces aserious problem of foreign currency shortages and a depreciatingexchange rate. Many companies are operating at well below fullcapacity - some as low as 40%. Some are facing viability threats dueto unavailability of imported inputs and in some cases fail to meetorders due to these constraints. The high inflation rate, coupled withrelatively stagnant wages, is eroding the domestic demand base.Companies believe that deeper regional integration will create newopportunities that will contribute towards resolving problems associatedwith foreign currency shortages. Joint ventures with strategic partnersin SADC are expected to resolve the problems of input shortages,
87
provide new opportunities for business expansion and diversificationand enable easier market penetration within the region and overcomethe constraints caused by a shrinking domestic market.
Only 13% of the responding companies expected deeper regionalintegration to have negative effects on their operations, resulting inthem retrenching employees. All these companies are in themanufacturing sector. A close examination of this sector shows that,25% of the responding companies were of the view that regionalintegration will force them to retrench employees and 20% actuallyexpected to close down. Therefore in relative terms, the manufacturingsector foresees more challenges with regional integration comparedto other sectors. There was only one company in wholesale and trailtrade that expected to close down operations as a result of deeperregional integration.
All the 5 companies that expected to close down because of deeperregional integration were large companies with annual turnover ofnow than USD 100,000 and with more than 100 employees. All ofthese with the exception of one have been in operation for more than10 years.
Follow up questions during interviews revealed concerns by industryabout the need to address current constraints in order to improveproduction efficiency that is required in a more competitiveenvironment. Regional integration was viewed to come withopportunities and threats (challenges). To minimise the negative effectsor the threats and to take advantages of the opportunities companiesinterviewed suggested that the national policy environment need tocreate a business climate that is conducive.
Companies were asked to quantify the expected impact of deeperregional integration. The responses were quite consistent with thequalitative responses. On average, employment was expected toincrease by 13%, production by 31% and investment by 21%2. Exportswere expected to increase by a greater margin than imports at 44%compared to 33%. The expected decline in prices of imports was just3%. The high expected changes in the above variables reflect theconstraints that industry is facing in Zimbabwe and the high
2 These results exclude the extreme case of one microenterprise that expected employment andproduction to increase by 1000% each and investment by 400%.
88
expectations and optimism attached to regional integration inaddressing these constraints.
It was difficult for companies to assess annual gains and losses inDollar terms. Those that attempted to do so made it clear that thesewere more of guest-mates. Another problem of making projectionsand estimates in Zimbabwe is the disparity between the officialexchange rate and the parallel market rate and the rapid changes inthese both in absolute terms and in relation to each other. Given theseproblems, and the relatively more reliable estimated impacts givenabove, it was decided that there was no point in adding to the analysisthe quantity in Dollar terms of the gains and losses from improvedmarket access and lower import costs that are a result of increasedcompetition. In fact the inaccuracies may even distort the picture.
4.2.2 Non-State Actors
The views of NSA on the impact of regional integration on businessin Zimbabwe were similar to those of business (Table N12). The
expected impact on business was positive. 75% of NSA expectedregional integration to result in higher employment, increasedproduction and increased investment abroad. An even higherproportion (83%) expected domestic companies to seek joint ventureswith companies in other SADC countries as well as entering into newbusiness activities. Both exports and imports were expected to increase.The NSA quantified their expectations of changes in employment,production, investment, imports and exports and all these fell in therange of 36% to 42%. The average price of inputs was expected tofall by 12%.
All the NSA interviewed were involved in the design of domesticpolicies. 75% of them were involved in the design of SADC policies.NSA believed that regional integration within SADC will strengthentheir involvement in policy making in Zimbabwe.
89
4.3 Rating of Trade Barriers
4.3.1 Business
Out of all the 38 companies that responded to the questionnaire, 10were not involved in trade with any SADC countries. Of the remaining28 that trade with other SADC countries, 10 reported that they didnot experience barriers when exporting to or importing from SADCcountries while the other 18 did - representing two thirds of companiesinvolved in SADC trade.
The analysis below focuses on those companies experiencing barriersin trade within SADC (Tables B10 to B13). It is interesting to note thatthose companies experiencing trade barriers found most of the barrierslisted in the questionnaire at least relevant. More than 80% of thecompanies reported that the following barriers were either relevantor very relevant: customs tariffs currently employed, payment of importand taxes in cash, rules of origin, requirements for import/exportpermits, time consuming customs procedures, excessive paper workand bureaucracy, lack of information about foreign markets, visarequirements for travelling abroad, exchange rate uncertainty, poorregional infrastructure, high regional communication costs, weakregional transport infrastructure, and high transport costs. A corruptofficial was mentioned by 78% of the companies as relevant or veryrelevant, but with the very relevant response carrying even greaterweight.
With regards to rating of the above, all 18 companies cited exchangerate uncertainty and high transport costs as a barrier to trade. Visarequirements were mentioned by all except one. Customs tariffs, Rulesof Origin and time consuming customs procedures were mentionedby all except two companies as relevant or very relevant barriers.
The only barriers that were mentioned by 50% companies or lesswere SPS regulations, lack of transparency of rules and regulationsabroad, risk of non payment and lack of availability of export insuranceto cover payment risk of exports.
For the sake of emphasis and comparison later, we re-list the mostwidely cited barriers to trade.
90
1. Exchange rate uncertainty;2. High transport costs;3. Visa requirements;4. Customs tariffs currently employed;5. Rules of Origin; and6. Time consuming customs procedures.
Companies were also asked to identify the three most relevant barriersthey face in foreign trade. Because of the relatively few responsesaccompanied by a large number of barriers to choose from, the resultswere quite spread. This, in a way indicates that companies are affectedto differing degrees by the different barriers.
The most relevant barriers to trade were compared in this way; wegave weights of 3, 2 and 1 to the number of responses associatedwith the first, second and third most relevant barriers identifiedrespectively and summed the results.
B1: TB1: TB1: TB1: TB1: Type of Businessype of Businessype of Businessype of Businessype of Business
TTTTType of barype of barype of barype of barype of barrierrierrierrierrier MostMostMostMostMost 2nd Most2nd Most2nd Most2nd Most2nd Most 3r3r3r3r3rd Mostd Mostd Mostd Mostd Most PointsPointsPointsPointsPoints r r r r relevantelevantelevantelevantelevant rrrrrelevantelevantelevantelevantelevant r r r r relevantelevantelevantelevantelevant
Customs tariffs 5 3 1 22
Export/import licences and permits 2 0 0 6
Import & export duties to be paid in cash 0 5 5 15
Time consuming customs procedures 2 2 1 11
Visa requirements 1 0 2 5
Exchange rate uncertainty 2 0 1 9
Weak transport infrastructure 0 0 2 2
High transport costs 1 0 3 8
Using this approach, the barriers ranked is as follows:
1. Customs tariffs currently employed;2. Import duties and taxes that have to be paid in cash;3. Time consuming customs procedures;4. Exchange rate uncertainty;5. High transport costs;6. Export/Import licences.
91
It is interesting to bring together and compare these results withthe earlier ones where companies simply indicated whether barrierswere very relevant, relevant or not relevant, without identifying themost relevant barriers.
The first set of results indicates incidence or spread of the barrieramong companies. In other words the results indicate barriers thatare most commonly faced by companies. The second set of resultsindicates the intensity or the relative height of the barriers. The rankingreflects those barriers that pose the biggest challenges to companies -that is, those that are most difficult to overcome or that are costly toresolve.
Combining the two results provides a basis for developing aframework or methodology for classifying the barriers and identifyingpriorities in respect of regional integration measures aimed ataddressing these barriers to trade.
Four classifications of barriers can be made and these are: HighBarriers with Low Incidence (HB/LI), High Barriers with High Incidence(HB/HI), Low Barriers with High Incidence (LB/HI) and Low Barriers withLow Incidence (LB/LI). This situation is depicted in the diagram below.
FigurFigurFigurFigurFigure 1: Classification of Te 1: Classification of Te 1: Classification of Te 1: Classification of Te 1: Classification of Trade Barrade Barrade Barrade Barrade Barriersriersriersriersriers
If we take the barriers listed above, they are all important in eitherheight, incidence or both. Those that are not listed above are lessimportant in both height and incidence and hence will fall in thequadrant of Low-Barrier, Low-Incidence (LB/LI). These barriers haveless negative impact on those companies and/or industries that they
Barrier HeightHigh BarrierLow Incidence
High BarrierHigh Incidence
Low BarrierLow Incidence
Low BarrierHigh Incidence
Incidence
92
affect and are not so as spread among companies or industries as tothose listed above. In terms of prioritisation and implementation ofregional integration measures, addressing these barriers requires theleast priority. This is in respect to the expected returns that are reflectedby benefits accruing as a result of inputs made in addressing thesebarriers.
The barriers listed above are classified on the basis of which set ofresults they appear. If they appear on one set of results, then they arehigh on that one and are low on the one that they do not appear. Ifthey appear on both, logically they are high on both. The classificationthat comes out is as follows:
• High Barriers, High Incidence- Customs tariffs currently employed- High transport costs- Exchange rate uncertainty- Time consuming customs procedures
• High Barriers, Low Incidence- Import duties to be paid in cash- Export / Import licences
• Low Barriers, High Incidence- Visa requirements- Rules of Origin
• Low Barriers, Low Incidence- The rest of the barriers
The Zimbabwe survey responses suggest that customs tariffs currentlyemployed, high transport costs, exchange rate uncertainty and timeconsuming customs procedures present themselves as the most severebarriers to regional trade both in terms of intensity and spread in thecountry. These barriers need to be given priority so as to relievecompanies of the stress they cause and enable the country to quicklybenefit from increased regional trade.
93
The next category of trade barriers (HB/LI) has great negative impacton enterprises. However, the barriers are confined to relatively fewersectors or companies. A possible explanation is that some companiesmay have developed strategies to circumvent or overcome thesebarriers. There is reason to believe that a characteristic of this group ofbarriers is that there is room at the enterprise level to acquire capacityto address these barriers and minimise their negative impact as isreflected by the fact that most companies have managed to overcomethem.
The responses from the Zimbabwe survey indicate that therequirement to have import duties and taxes paid in cash and export/import licences, fall in this category. The low rate of incidence of this(high) barrier suggests that companies must have developed ways ofovercoming it.
Low Barriers with High Incidence LB/HI have a relatively low negativeimpact on individual enterprises, but are wide spread through out thewhole economy. Solutions to such barriers are more external to theenterprises and take a national and regional character. In the case ofZimbabwe, these barriers include visa requirements for travel abroadand Rules of Origin.
4.3.2 Non-State Actors
The rating of trade barriers by Non-State Actors is along the sameline as that of business (Tables N8 to N11). All of the listed trade
barriers were rated as relevant or very relevant by at least 75% (9 outof 12) of the responding NSA, except risk of non-payment of customersabroad and weak law enforcement in export destinations. These twobarriers were rated as relevant or very relevant by two thirds of therespondents. What these responses clearly indicate is that on the wholeNSA believe that the listed trade barriers are relevant.
When it comes to rating, customs tariffs, and weak regionalinfrastructure were rated as relevant or very relevant by all therespondents. These two were followed by import duties and taxesthat have to be paid in cash, export/import licence and permitrequirements, time consuming customs procedures, bureaucracy, lackof market information, visa requirements and poor regional
94
communication infrastructure. These were each mentioned by all exceptone respondent (92%) as relevant or very relevant.
Some interesting observations emerge when the responses arebroken down to "very relevant" and "relevant". The ranking becomesas follows: exchange rate uncertainty received the highest rating asvery relevant at 75%. This was followed by export/import licenses,visa requirements for travelling abroad at 58% and customs tariffs,rules of origin, time consuming customs procedures, and poor regionalcommunication infrastructure.
It is not surprising that in Zimbabwe, exchange rate uncertainty isviewed by both business and non state actors as a huge barrier totrade and business in general. The Zimbabwean Dollar has beendepreciating at a high rate. The foreign exchange policy has beenchanging and these changes are hard to predict. There is a widedisparity between the official exchange rate and the parallel marketrate. The foreign exchange allocation system has been changing inresponse to various pressures and in response to unexpected outcomesof various exchange rate regulations.3
It is interesting to note that customs and tariffs that were cited as ahigh barrier to trade, with high incidence. This is important given thefact that the SADC Trade Protocol that came into effect in September2000 aims at achieving a zero tariff rate for 85% of all intra SADCtrade by 2008, with the remaining 15% being zero rated by 2012.Zimbabwe has been implementing its tariff reduction schedule to meetthese targets and, in that regard, this problem is being addressed andshould not be of such serious concern. In fact at the SADC leveldiscussions are now focussed more on non-tariff barriers such as SPSregulations and quarters imposed by SACU on other countries.
The concerns over customs tariffs reflect that, in some cases, tariffreduction schedules are not being implemented on time. In other casesnew tariffs are announced, but implementation of these at boarderposts is lagged. This causes serious problems at boarder posts andhence customs tariffs come to be perceived as a high barrier by manycompanies. Quantitative restrictions are also seen as a major source ofconcern at the policy level. However, their low-rating as a trade barrier
3 The paper “Deepening Regional Integration in SADC: Macroeconomic Policies and their Impact -Zimbabwe Country Study” by the same author, provides details on this issue.
95
reflect the prevailing situation in Zimbabwe. As already pointed out,many companies are operating below full capacity and in some casesfail to meet orders. What that means is that under current conditions,quantitative restrictions are not a binding constraint, and thereforeare not "felt" by many companies. They would certainly become amore serious issue as companies increase production and seek greaterexport opportunities.
96
97
5 Perceived Business Climate in SADC andBeyond
The objective of encouraging trade within SADC and beyond is tostimulate economic growth and development within the region
and improve the standards of living within member countries. TheZimbabwe survey found out that both business and NSA expectedregional integration to result in increased domestic production and toopen up new investment and export opportunities and possibilitiesfor joint ventures with companies in other SADC countries.
The extent to which these possible outcomes become a realitydepends to a significant extent, on the actual and perceived businessclimate prevailing within the region and beyond.
Companies were asked to rate the business climate in the domesticmarket and other markets within and outside SADC and the resultsare presented in Table B14. The South African business climate wasrated the most favourable with 65.8% of the responding companiesindicating that it was either favourable or very favourable. Only 13%of the responding companies found the South African business climateunfavourable.
After South Africa, the next most conducive business climateaccording to the responses is the BLNS countries. Half of therespondents rated the business climate in this market as favourable orvery favourable. 28.9% were not knowledgeable about the businessclimate in the BLNS countries. The figure is almost the same for SADCcountries. In fact the dearth of knowledge about external markets isobvious in this survey.
Almost 60% of the responding companies did not have knowledgeabout the business climate in African countries outside the SADCregion. The figure for the rest of the world is 63% while that of theEuropean Union (EU), United States of America (USA) and Asia is justover 50%. Zimbabwe recently adopted the "Look East" Policy withthe view of increasing economic relations with Asian countries. Thiswas in response to the sour political and economic relations that havebeen prevailing between Zimbabwe and the developed Westerncountries. But as much as policy has shifted in that direction, the
98
business community remains with limited knowledge about thebusiness climate in that part of the world.
The wholesale and retail trade sector is leading in its lack ofknowledge about other markets, beyond the domestic one. 3 out of4 firms in this sector (well above the average) do not know the businessclimate in the BLNS countries, non-BLNS SADC countries excludingSouth Africa, ROA, EU and ROW. Countries that the wholesale andretail sector is familiar with in terms of the business climate are SouthAfrica and Asia because three quarters of the respondents were ableto rate these markets. This outcome suggests that with regards to theLook East Policy, it is the East that has successfully penetrated theZimbabwean market, and very little if anything of the reverse hasoccurred.
The manufacturing sector performs well above average in terms ofknowledge of the business climate in external markets within the SADCregion. However, beyond this, it gravitates towards the average.
Two thirds of the respondents in the transport sector were familiarwith the SADC region in so far as business climate is concerned. Onlyone third, slightly below average, has knowledge about the businessclimate in all other markets.
Beside South Africa and the BLNS countries, the next market viewedby the Zimbabwe business community as having a favourable businessclimate, is the remaining SADC countries. 37% of the respondentsrated this market as having at least a favourable business climate. Thiswas followed by Asia (34%) and EU (29%).
The Zimbabwe business climate was rated second to last, togetherwith USA and ROW. Not a single response rated the domestic businessclimate as very favourable. Only 24% rated the domestic businessclimate as favourable compared with 71% that rated it as unsatisfactoryor less favourable. This outcome is not very surprising given the foreignexchange problems already alluded to and the hyper-inflation prevailingin the country. The rate of inflation in Zimbabwe has been increasingover the last year and is now beyond the 1,000% mark.
The rest of Africa was viewed not to be good for doing business inor with. Only 5% of responding companies were of the opinion thatthis market was favourable or very favourable.
99
6 National Debate on Regional Integration
This section examines the extent to which the business communityand NSA are involved in national debate on regional integration
on the basis of the responses to the questionnaire. The responses ofbusiness on this issue are summarised in Tables B17 and B18 and thoseof NSA in Tables N16 to N20.
6.1 Business
On the whole, there is general consensus among the businessrespondents that regional integration is a topic that is debated
by the public in Zimbabwe. 70% of the respondents are of this opinion.However, of this 70% two thirds think that the debate is not soprominent and only one third think that there is healthy debate onthe subject.
According to the business responses, there is more debate on SADCregional integration, than regional integration in general. This pointremains equally valid when the debate on integration is compared todiscussions on COMESA and the EAC. In the case of SADC, 30% ofthe responses were of the view that there is a lot of debate on SADCregional integration and 50% were of the opinion that there is somedebate, but it is not so prominent. Business responses indicate thatthere is least debate on regional integration within the framework ofEAC. Only 3% are of the opinion that there is healthy debate on RIwithin EAC.
The majority of the businesses that responded to the questionnairehad never attended workshops or seminars on regional integration.Only one quarter attended workshops/seminars on regional integration,fewer than one quarter had attended meetings on regional integrationspecific to SADC, COMESA and the EAC in that declining order.Between 40% and 50% indicated that they had not attended suchworkshops for the different regional groupings because suchworkshops were not offered.
100
6.2 Non-State Actors
Like business, NSA were of the opinion that in Zimbabwe, there ispublic debate on regional integration in general, but that the debate
is not prominent. Only one quarter of the respondents had the viewthat public debate on regional integration in general was prominent,compared to two thirds that felt otherwise. The responses indicatethat, debate on regional integration within SADC is just slightly moreprominent than that on regional integration in general with one third(compared to one quarter) holding that view. Public debate withinCOMESA is less prominent than within SADC and within EAC it iseven less prominent.
Most of the NSA that responded to the questionnaire have hadsome discussions on regional integration within their organisations.Discussions on regional integration within SADC are more popularamong NSA compared to discussions on COMESA and EAC. Threequarters of the NSA have had some discussions on SADC compared tohalf that have discussed COMESA and 42% that have discussed EAC.However for most of the NSA, such discussions have not been regular.
Most of the NSA stated that they have not organised workshops/seminars on regional integration. Only 2 NSA out of the 12 interviewedstated that they have occasionally organised workshops on regionalintegration in general and specific to SADC, COMESA and EAC. TheseNSA are a labour organisation and a civil society organisation. Most ofthe NSA (two thirds) have never done anything to raise the issue ofregional integration in general, within SADC and within COMESA. Inthe case of EAC, the percentage is even higher, 83%. In general, NSAhave not been pro-active in promoting debate on regional integration.They have been relatively more active in participating in initiatives takenby others as reflected by a relatively greater proportion of those thatattended seminars on regional integration.
Participation of NSA in SADC National Committee meetings is notimpressive. Only one quarter of the responding NSA (4 out of 12) hasbeen invited to and attended SADC National Committee meetings, 3of them regularly and one occasionally. All the NSA responding to thequestionnaire were of the view that it was necessary to increase thecapacity of NSA to participate in committees on regional issues.
101
7 Business and NSA Views on the WayForward
Both business and Non-State Actors strongly support regionalintegration initiatives particularly within the context of SADC (Tables
B19 and B20 for business and N22 for NSA). This is quite consistentwith their perceptions on the impact that regional integration couldhave on the economy, i.e. increasing domestic production, investmentand export opportunities among other things.
Virtually all the responding companies supported regionalintegration within SADC, with the majority, 68% supporting it strongly.Similarly, all the NSA interviewed support SADC regional integration,with an even higher percentage, 83%, doing so strongly. In fact, somecompanies and NSA even complained about the slow pace at whichSADC regional integration is being implemented, expressing the needto see more action than words.
Regional integration within COMESA also received less support thanSADC among both companies and NSA. Only 50% of the companiesand 58% of the NSA strongly supported regional integration withinCOMESA, compared to 68% and 83% respectively. ECA received muchless support, and only 45% of the companies and 42% of the NSAsupported it strongly.
There appears to be a contradiction with regards to the preference,by both business and NSA, for SADC vis-à-vis COMESA as this relatesto increased market opportunities. COMESA presents itself as a largermarket compared to SADC, but the latter is preferred. The businesscommunity in Zimbabwe is much more familiar with the SADC marketthan non-SADC COMESA. Removal of trade barriers within SADC(including greater availability of foreign exchange required for importedinputs) can easily lead to greater production for exports to the SADCregion, with little investment in market exploration. But when it comesto COMESA, it would become necessary for business to makeconsiderable investment to break into that market, given the limitedknowledge that Zimbabwean business has about it.
The perceptions about the business climate in other countriesreinforce the greater preference for SADC. Firstly, both business andNSA have a more positive perception of the business climate in SADC
102
countries than the rest of COMESA and Africa. Further, they havemore knowledge about the business climate in SADC than in COMESAand the rest of Africa. It is therefore not surprising that both businessand NSA believe that, deepening regional integration within SADCwill benefit them and the nation at large, at much lower cost comparedto COMESA regional integration.
The overwhelming support for the SADC regional integrationmanifested itself in the responses that address the individual barriersto trade within SADC.
All the NSA want to see all trade restrictions removed, tariffs reducedand eventually eliminated within SADC, with a common external tariffto all other countries established. They all want restrictions on the freemovement of capital, labour and services to be removed. Again all theNSA expressed the desire to see competition and trade policies designedfor SADC as a whole. Only 2 out of the 12 NSA interviewed opposedimplementation of the same level of taxes within SADC and the ideaof a single currency within SADC while the rest supported thesemeasures.
Business supported the removal of all the above trade barriers to aslightly lesser extent than the NSA. Note that the following trade barriersreceived the least support. The establishment of a political union wasthe least popular move, supported by 53% of the companies - stillmore than half. Next was removal of all trade restrictions at 68%support rate, followed by removal of restrictions on the free movementof labour (71%) and the creation of a single currency, supported by74% of businesses interviewed. Relaxing of all other barriers wassupported by at least 80% of the business community.
103
8 Summary and Conclusions
The major finding of the survey is that both the business communityand NSA in Zimbabwe strongly support regional integration in
general and more so within the context of SADC. They are both awarethat regional integration will result in greater competition but theyare confident that companies will be able to increase efficiency to staycompetitive. In this regards they expect the national policy frameworkto address the current constraint and bottlenecks that they are facingin the form of foreign currency shortages and an unstablemacroeconomic environment characterised by hyper-inflation.
Zimbabwean business and NSA expect deeper SADC regionalintegration to benefit the economy by easing production bottlenecksthat prevail in the form of shortages of imported inputs and spareparts for equipment. This would lead to greater capacity utilisationand, hence, increased domestic production by local companies andincreased efficiency and competitiveness of domestic industry. SADCregional integration is expected to create new investment and exportopportunities and possibilities for business diversification, lower theprices of both inputs and consumer goods and open up opportunitiesfor joint ventures with companies in other SADC countries.
For the country to reap the benefits of deeper SADC regionalintegration, it is necessary to put in place measures and policies thatwill strategically position Zimbabwean industry to enable it to competeeffectively under a liberalised economic environment. In this regards,it is necessary to address the hyper-inflation prevailing in the countrythat hampers normal business operations. It is also necessary to makeforeign exchange available so as to increase capacity utilisation andimprove production efficiency. In general, the constraints thatZimbabwean industry is facing need to be addressed for the expectedbenefits from regional integration to materialise. Otherwise the trendof de-industrialisation would be the outcome.
The rating and ranking of trade barriers revealed that exchangerate uncertainty, high transport costs, customs tariffs currentlyemployed and time consuming customs procedures are high barriersthat have a high incidence rate. There is need for policy interventionto address these as a matter of priority. Higher levels of integration
104
such as the establishment of a political union and creation of a singlecurrency can come later. Some of the barriers to trade can be dealtwith internally at country level for example domestic macroeconomicstability, which is an important priority that has implications on theability of domestic companies not only to survive but to increaseefficiency and thrive under a more competitive environment.
On the whole, the survey found out that both business and NSAare in favour of a free trade area with competition and trade policiesfor the SADC region. This would entail free movement of capital, labourand services within the regional block. SADC regional integration waspreferred to COMESA. Both business and NSA were more familiarwith the SADC region than COMESA countries and perceived thebusiness climate in the former to be better than in the latter. On thewhole both business and NSA have limited knowledge about thebusiness climate in other countries, particularly outside SADC.
Zimbabwe should therefore continue to implement its tariffreduction schedules - along other SADC countries, while takingmeasures to relieve industry of the constraints that it is facing. It appearsthat Zimbabwe might have to make a choice between SADC andCOMESA. Zimbabwe appears to be gravitating more towards COMESAthan SADC. In making this choice, it is important to take intoconsideration the views of both business and NSA. It is recommendedthat consultations be made on this issue. The consultative processcould greatly benefit from a through study of the comparative potentialbenefits from the two groupings.
Regional integration is a topic of debate in Zimbabwe. Howeverthe debate is not prominent. While the majority of the NSA attendedworkshops on regional integration at some point, this was less frequentthan is desirable. The majority of companies did not attend anyworkshops on regional integration. Therefore their views on this subjectare restricted by the limited knowledge available to them and thedesire to survive under current difficult conditions. The fact that SACUquantitative restrictions did not come out as a major issue reflects theshort term planning horizon that tends to occur when business isstriving to survive. Companies and NSA also demonstrated limitedknowledge of markets even within the SADC region, but more sobeyond SADC.
105
There is need to create an effective framework for knowledgesharing and dissemination on matters of regional integration andeconomic policies in general. In Zimbabwe, there is the NationalConsultative Forum which could play a greater role in this matter.There is also the Non-State Actor Forum (NSAF) that was establishedin accordance with the spirit of the Cotonou Agreement.
There is need for capacity building on the NSAF and business toenable them to make informed contributions to trade policyformulation and debate on regional integration. The NAS expressedthe need for such capacity building. If SADC and COMESA turn out tobe mutually exclusive, national debate on which regional grouping tojoin would be necessary.
The support for regional integration from the business communityand Non-State Actors and their enthusiasm on this matter indicatethat deepening regional integration is the right step to take.
106
107
Appendix 1: TAppendix 1: TAppendix 1: TAppendix 1: TAppendix 1: Tables for Business Surables for Business Surables for Business Surables for Business Surables for Business Surveyveyveyveyvey
TTTTTable B1: Table B1: Table B1: Table B1: Table B1: Type of Businessype of Businessype of Businessype of Businessype of BusinessFrFrFrFrFrequencyequencyequencyequencyequency PerPerPerPerPercentcentcentcentcent
TTTTTable B2: Main Activity of Companyable B2: Main Activity of Companyable B2: Main Activity of Companyable B2: Main Activity of Companyable B2: Main Activity of CompanyFrFrFrFrFrequencyequencyequencyequencyequency PerPerPerPerPercentcentcentcentcent
TTTTTable B3: Number of Employeesable B3: Number of Employeesable B3: Number of Employeesable B3: Number of Employeesable B3: Number of EmployeesFrFrFrFrFrequencyequencyequencyequencyequency PerPerPerPerPercentcentcentcentcent
TTTTTable B4: Period of Operationable B4: Period of Operationable B4: Period of Operationable B4: Period of Operationable B4: Period of OperationFrFrFrFrFrequencyequencyequencyequencyequency PerPerPerPerPercentcentcentcentcent
TTTTTable B7: First and Second Main Exporable B7: First and Second Main Exporable B7: First and Second Main Exporable B7: First and Second Main Exporable B7: First and Second Main Export Markett Markett Markett Markett Market First main marketFirst main marketFirst main marketFirst main marketFirst main market Second main market Second main market Second main market Second main market Second main market Per Per Per Per Percentcentcentcentcent Per Per Per Per Percentcentcentcentcent
Botswana 5.3 Botswana 2.6
Malawi 2.6 Malawi 15.8
South Africa 23.7 Mauritius 2.6
Zambia 15.8 South Africa 10.5
EU 7.9 Zambia 13.2
Asia 2.6 Kenya 2.6
Others 5.3 Asia 2.6
Total 63.2 Total 50.0
No response 36.8 No response 50.0
100.0 100.00
Note: No response for 1st main market means the companies do not export. For 2nd main
market, it means that they do not export or they only export to one country
109
TTTTTable B8A: Competition frable B8A: Competition frable B8A: Competition frable B8A: Competition frable B8A: Competition from Other Countriesom Other Countriesom Other Countriesom Other Countriesom Other Countries
RSARSARSARSARSA BLNS BLNS BLNS BLNS BLNS Other SADC Other SADC Other SADC Other SADC Other SADC Rest of Rest of Rest of Rest of Rest of EUEUEUEUEU Africa Africa Africa Africa Africa
Per Per Per Per Percentcentcentcentcent Per Per Per Per Percentcentcentcentcent Per Per Per Per Percentcentcentcentcent Per Per Per Per Percentcentcentcentcent Per Per Per Per Percentcentcentcentcent
Yes strong 18.4 2.6 2.6 2.6 5.3
Yes moderate 28.9 10.5 2.6 0 7.9
Yes weak 15.8 5.3 5.3 7.9 2.6
No 23.7 60.5 57.9 57.9 52.6
Does not apply 10.5 15.8 23.7 23.7 23.7
Total 97.4 94.7 92.1 92.1 92.1
System 2.6 5.3 7.9 7.9 7.9
100.0 100.0 100.0 100.0 100.0
TTTTTable B8: Continuedable B8: Continuedable B8: Continuedable B8: Continuedable B8: Continued AsiaAsiaAsiaAsiaAsia USA USA USA USA USA Rest of W Rest of W Rest of W Rest of W Rest of Worldorldorldorldorld Unknown Unknown Unknown Unknown Unknown
PerPerPerPerPercentcentcentcentcent Per Per Per Per Percent Percent Percent Percent Percent Percentcentcentcentcent Per Per Per Per Percentcentcentcentcent
Yes strong 23.7 5.3 2.6 0
Yes moderate 2.6 5.3 2.6 5.3
Yes weak 15.8 2.6 2.6 0
No 36.8 55.3 60.5 42.1
Does not apply 18.4 23.7 23.7 34.2
Total 97.4 92.1 92.1 81.6
System 2.6 7.9 7.9 18.4
100.0 100.0 100.0 100.0
TTTTTable B9: Macrable B9: Macrable B9: Macrable B9: Macrable B9: Macroeconomic Impact of RI - Business Peroeconomic Impact of RI - Business Peroeconomic Impact of RI - Business Peroeconomic Impact of RI - Business Peroeconomic Impact of RI - Business PerceptionsceptionsceptionsceptionsceptionsStrStrStrStrStronglyonglyonglyonglyongly AgrAgrAgrAgrAgreeeeeeeeee DisagrDisagrDisagrDisagrDisagreeeeeeeeee StrStrStrStrStronglyonglyonglyonglyongly Don'tDon'tDon'tDon'tDon't
Increase efficiency to be competitive 39.5 52.6 5.3 2.6 0
Improve turnover of domestic companies 23.7 50 18.4 5.3 2.6
Positive impact on other domestic producers 34.2 50 7.9 2.6 5.3
Benefit the economy in general 26.3 63.2 2.6 2.6 2.6
Provide new export opportunities 31.6 55.3 5.3 2.6 5.3
Provide new investment opportunities 39.5 52.6 5.3 0 2.6
Reduce unemployment rates 18.4 50 21.1 5.3 5.3
Lower cost of labour 13.2 15.8 39.5 15.8 11.1
Influx of immigrants 21.1 21.1 26.3 18.4 10.5
Enhance human rights situation 10.5 42.1 18.4 10.5 15.8
Reduce political sovereignty 2.6 18.4 47.4 18.4 10.5
110
TTTTTable B10: Relevance of Table B10: Relevance of Table B10: Relevance of Table B10: Relevance of Table B10: Relevance of Trade Barrade Barrade Barrade Barrade Barriersriersriersriersriers VVVVVerererereryyyyy Relevant Har Relevant Har Relevant Har Relevant Har Relevant Hardlydlydlydlydly Not at all Not Not at all Not Not at all Not Not at all Not Not at all Not
High regional communication costs 13.2 26.3 7.9 0 52.6
Regional transport infrastructure 21.1 18.4 2.6 5.3 52.6
High transport costs 23.7 23.7 0 0 52.6
Weak law enforcement in exportdestination 5.3 18.4 7.9 7.9 57.9
TTTTTable B11: Most Relevant Table B11: Most Relevant Table B11: Most Relevant Table B11: Most Relevant Table B11: Most Relevant Trade Barrade Barrade Barrade Barrade BarrierrierrierrierrierFrFrFrFrFrequencyequencyequencyequencyequency PerPerPerPerPercentcentcentcentcent
Customs tariffs 5 13.2
Rules of Origin 1 2.6
Export/import licenses and permits 2 5.3
Time consuming customs procedures 2 5.3
Corruption of officials 1 2.6
Visa requirements for travelling abroad 1 2.6
Exchange rate uncertainty 2 5.3
Risk of non-payment of customers abroad 1 2.6
No export insurance to cover payment risks of exports 1 2.6
High transport costs 1 2.6
Others (please specify) 1 2.6
Total 18 47.4
System 20 52.6
38 100.0
111
TTTTTable B12: Second Most Relevant Table B12: Second Most Relevant Table B12: Second Most Relevant Table B12: Second Most Relevant Table B12: Second Most Relevant Trade Barrade Barrade Barrade Barrade BarrierrierrierrierrierFrFrFrFrFrequencyequencyequencyequencyequency PerPerPerPerPercentcentcentcentcent
Customs tariffs 3 7.9
Import duties and taxes 5 13.2
Rules of Origin 1 2.6
Lack of transparency of rules andregulations abroad 1 2.6
Time consuming customs procedures 2 5.3
Corruption of officials 1 2.6
Lack of information about foreign markets 1 2.6
Exchange rate uncertainty 1 2.6
Poor regional communication infrastructure 1 2.6
High regional communication costs 1 2.6
High transport costs 1 2.6
Total 18 47.4
Non importing companies 20 52.6
38 100.0
TTTTTable B13: Thirable B13: Thirable B13: Thirable B13: Thirable B13: Third Most Relevant Td Most Relevant Td Most Relevant Td Most Relevant Td Most Relevant Trade Barrade Barrade Barrade Barrade Barrierrierrierrierrier
TTTTTable B14A: Rating of Curable B14A: Rating of Curable B14A: Rating of Curable B14A: Rating of Curable B14A: Rating of Currrrrrent Business Climate in Difent Business Climate in Difent Business Climate in Difent Business Climate in Difent Business Climate in Differferferferferent Marketsent Marketsent Marketsent Marketsent MarketsDomesticDomesticDomesticDomesticDomestic SouthSouthSouthSouthSouth BLNSBLNSBLNSBLNSBLNS Other SADCOther SADCOther SADCOther SADCOther SADC Rest ofRest ofRest ofRest ofRest of
AfricaAfricaAfricaAfricaAfrica AfricaAfricaAfricaAfricaAfricaPerPerPerPerPercentcentcentcentcent PerPerPerPerPercentcentcentcentcent Per Per Per Per Percent Percent Percent Percent Percent Percentcentcentcentcent Per Per Per Per Percentcentcentcentcent
TTTTTable B15: Impact of RI on Domestic Businessable B15: Impact of RI on Domestic Businessable B15: Impact of RI on Domestic Businessable B15: Impact of RI on Domestic Businessable B15: Impact of RI on Domestic BusinessLikelyLikelyLikelyLikelyLikely UnlikelyUnlikelyUnlikelyUnlikelyUnlikely Don'tDon'tDon'tDon'tDon't DoesDoesDoesDoesDoes
knowknowknowknowknow not applynot applynot applynot applynot apply
Retrenchment of employees 13.2 76.3 2.6 5.3
More employment 75.7 21.6 0 2.6
Increased domestic production 73.7 21.1 0 2.6
Increasing investment abroad 63.2 23.7 7.9 2.6
Closing down of domestic production 13.2 78.9 0 5.3
More joint ventures in other SADC countries 73.3 18.9 0 5.3
New business activities 78.9 15.8 0 2.6
More imports from SADC 73.7 15.8 2.6 5.3
More exports to SADC countries 71.1 15.8 0 10.5
Access to cheaper inputs 79.3 15.8 2.6 2.6
Access to cheaper foreign labour 23.7 55.3 7.5 10.5
113
TTTTTable B16: Aable B16: Aable B16: Aable B16: Aable B16: Average Change by Sector as a Result of RIverage Change by Sector as a Result of RIverage Change by Sector as a Result of RIverage Change by Sector as a Result of RIverage Change by Sector as a Result of RIAAAAAverage%verage%verage%verage%verage% AAAAAverage%verage%verage%verage%verage% AAAAAverage%verage%verage%verage%verage% AAAAAverage%verage%verage%verage%verage% AAAAAverage%verage%verage%verage%verage% AAAAAverage%verage%verage%verage%verage%
Agriculture 20.00 30.00 20.00 15.00 20.00 -10.00
Mining 2.50 2.50 2.50 2.50 2.50 -1.00
Manufacturing 7.61 31.76 21.32 55.00 32.22 -6.47
Wholesale 35.00 53.33 12.50 40.00 32.50 10.00
Transport andcommunication 3.50 7.50 11.00 10.00 -5.00
TTTTTable B17: Public Debates on Regional Integrationable B17: Public Debates on Regional Integrationable B17: Public Debates on Regional Integrationable B17: Public Debates on Regional Integrationable B17: Public Debates on Regional IntegrationRI in generalRI in generalRI in generalRI in generalRI in general SADCSADCSADCSADCSADC COMESACOMESACOMESACOMESACOMESA ECAECAECAECAECA
Yes, very much 21.1 28.9 15.8 2.6
Yes, but not so prominent 47.4 50.0 36.8 28.9
No 28.9 18.4 39.5 50.0
Don't know 0 0 5.3 15.8
TTTTTable B18: Attending Wable B18: Attending Wable B18: Attending Wable B18: Attending Wable B18: Attending Workshops/Seminars on Regional Integrationorkshops/Seminars on Regional Integrationorkshops/Seminars on Regional Integrationorkshops/Seminars on Regional Integrationorkshops/Seminars on Regional IntegrationRI in generalRI in generalRI in generalRI in generalRI in general SADCSADCSADCSADCSADC COMESACOMESACOMESACOMESACOMESA ECAECAECAECAECA
Yes, regularly 2.6 0 2.6 0
Yes, sometimes 23.7 18.4 10.5 7.9
No, because no workshops were offered 39.5 44.7 47.4 50.0
No, but workshops were offered 10.5 13.2 15.8 15.8
Does not apply 18.4 18.4 18.4 21.1
TTTTTable B19: Supporable B19: Supporable B19: Supporable B19: Supporable B19: Support for Regional Integrationt for Regional Integrationt for Regional Integrationt for Regional Integrationt for Regional IntegrationRI in generalRI in generalRI in generalRI in generalRI in general SADCSADCSADCSADCSADC COMESACOMESACOMESACOMESACOMESA ECAECAECAECAECA
Yes strongly 60.5 68.4 50.0 44.7
Yes slightly 36.8 31.6 42.1 23.7
No 2.6 0 2.6 15.8
Don't know 0 0 5.3 15.8
114
TTTTTable B20: Prable B20: Prable B20: Prable B20: Prable B20: Preferefereferefereferrrrrred Degred Degred Degred Degred Degree of SADC Integrationee of SADC Integrationee of SADC Integrationee of SADC Integrationee of SADC IntegrationYYYYYeseseseses NoNoNoNoNo Don't knowDon't knowDon't knowDon't knowDon't know
Reduce tariffs 97.4 2.6 0
Remove tariffs and establish CET to all other countries 89.5 10.5 0
Remove all trade restrictions 68.4 31.6 0
Remove restrictions on free movement of capital 97.4 2.6 0
Remove restrictions on free movement of labour 71.1 26.3 2.6
Remove restriction on free movement of services 86.8 13.2 0
Implement same level of taxes 81.6 15.8 0
Design competitive trade policies for SADCCreate a single currency 73.7 21.1 5.3
Create a political union with Parliament & Executive 52.6 34.2 10.5
115
Appendix 2: Tables for NSA Survey
TTTTTable N1: Table N1: Table N1: Table N1: Table N1: Type of Orype of Orype of Orype of Orype of Organisationganisationganisationganisationganisation
TTTTTable N2: Period of Operationable N2: Period of Operationable N2: Period of Operationable N2: Period of Operationable N2: Period of OperationFrFrFrFrFrequencyequencyequencyequencyequency PerPerPerPerPercentcentcentcentcent
6-10 years 3 25.0
More than 10 years 9 75.0
Total 12 100.0
TTTTTable N3: Membership to SADC National Committee And Regional Umbrable N3: Membership to SADC National Committee And Regional Umbrable N3: Membership to SADC National Committee And Regional Umbrable N3: Membership to SADC National Committee And Regional Umbrable N3: Membership to SADC National Committee And Regional Umbrella Orella Orella Orella Orella OrganisationganisationganisationganisationganisationMembership to SADCMembership to SADCMembership to SADCMembership to SADCMembership to SADC Membership to rMembership to rMembership to rMembership to rMembership to regionalegionalegionalegionalegionalNational CommitteeNational CommitteeNational CommitteeNational CommitteeNational Committee umbrumbrumbrumbrumbrella orella orella orella orella organisationganisationganisationganisationganisation
Yes 33.3 83.3
No 66.7 16.7
Total 100.0 100.0
TTTTTable N 4: Invitation to SADC National Committee Meetingsable N 4: Invitation to SADC National Committee Meetingsable N 4: Invitation to SADC National Committee Meetingsable N 4: Invitation to SADC National Committee Meetingsable N 4: Invitation to SADC National Committee Meetings
TTTTTable N5: Parable N5: Parable N5: Parable N5: Parable N5: Participation in SADC National Committee Meetingsticipation in SADC National Committee Meetingsticipation in SADC National Committee Meetingsticipation in SADC National Committee Meetingsticipation in SADC National Committee MeetingsFrFrFrFrFrequencyequencyequencyequencyequency PerPerPerPerPercentcentcentcentcent
Yes, regularly 3 25.0
Yes, sometimes 1 8.3
No, was not invited 7 58.3
Don't know 1 8.3
Total 12 100.0
116
TTTTTable N6: Need to Incrable N6: Need to Incrable N6: Need to Incrable N6: Need to Incrable N6: Need to Increase Capacity among NSAsease Capacity among NSAsease Capacity among NSAsease Capacity among NSAsease Capacity among NSAsFrFrFrFrFrequencyequencyequencyequencyequency PerPerPerPerPercentcentcentcentcent
Yes 11 91.7
No 1 8.3
Total 12 100.0
TTTTTable N7: Macrable N7: Macrable N7: Macrable N7: Macrable N7: Macroeconomic Impact of RIoeconomic Impact of RIoeconomic Impact of RIoeconomic Impact of RIoeconomic Impact of RIStrStrStrStrStronglyonglyonglyonglyongly AgrAgrAgrAgrAgreeeeeeeeee DisagrDisagrDisagrDisagrDisagreeeeeeeeee StrStrStrStrStronglyonglyonglyonglyongly Don’Don’Don’Don’Don’tttttAgrAgrAgrAgrAgreeeeeeeeee disagrdisagrdisagrdisagrdisagreeeeeeeeee KnowKnowKnowKnowKnow
Increase competition 25 75 0 0 0
Reduce input prices 8.3 75 17.7 0 0
Reduce prices of goods 25 66.7 8.3 0 0
Increase production efficiency 33.3 41.7 25 0 0
Improve turnover of domestic Companies 8.3 50 33.3 0 8.3
Benefit the economy in general 33.3 58.3 8.3 0 0
Provide new export opportunities 25 75 0 0 0
Provide new investment opportunities 33.3 66.7 0 0 0
Reduce unemployment rates 8.3 50 8.3 16.7 16.7
Lower labour costs 8.3 50 41.7 0 0
Influx of immigrants 16.7 16.7 50 8.3 0
Enhance human rights situation 25 66.7 0 0 8.3
Reduce political sovereignty 8.3 16.7 58.3 16.7 0
TTTTTable N8: Relevance of Table N8: Relevance of Table N8: Relevance of Table N8: Relevance of Table N8: Relevance of Trade Barrade Barrade Barrade Barrade BarriersriersriersriersriersVVVVVerererereryyyyy RelevantRelevantRelevantRelevantRelevant HarHarHarHarHardlydlydlydlydly Not at allNot at allNot at allNot at allNot at all Don’Don’Don’Don’Don’ttttt
Weak law enforcement in export destination 16.7 50 33.3 0 0
117
TTTTTable N9: Most Relevant Barable N9: Most Relevant Barable N9: Most Relevant Barable N9: Most Relevant Barable N9: Most Relevant Barrier to Trier to Trier to Trier to Trier to TraderaderaderaderadeFrFrFrFrFrequencyequencyequencyequencyequency PerPerPerPerPercentcentcentcentcent
Customs tariffs currently employed 2 16.7
Import duties and taxes have to be paid in cash 1 8.3
Sanitary and phyto-sanitary regulations 2 16.7
Rules of Origin 2 16.7
Export/import licenses and permits required 1 8.3
Corruption of officials 1 8.3
Exchange rate uncertainty 1 8.3
Others 2 16.7
Total 12 100.0
TTTTTable N10: Second Most Relevant Barable N10: Second Most Relevant Barable N10: Second Most Relevant Barable N10: Second Most Relevant Barable N10: Second Most Relevant Barrier to Trier to Trier to Trier to Trier to TraderaderaderaderadeFrFrFrFrFrequencyequencyequencyequencyequency PerPerPerPerPercentcentcentcentcent
Import duties and taxes have to be paid in cash 2 16.7
Rules of Origin 2 16.7
Export/import licenses and permits required 1 8.3
Lack of transparency of rules and regulations abroad 1 8.3
Time consuming customs procedures 1 8.3
Corruption of officials 1 8.3
Visa requirements for travelling abroad 1 8.3
Exchange rate uncertainty 1 8.3
No export insurance available to cover payment risks 1 8.3
Weak regional transport infrastructure 1 8.3
Total 12 100.0
TTTTTable N11: Thirable N11: Thirable N11: Thirable N11: Thirable N11: Third Most Relevant Bard Most Relevant Bard Most Relevant Bard Most Relevant Bard Most Relevant Barrier to Trier to Trier to Trier to Trier to TraderaderaderaderadeFrFrFrFrFrequencyequencyequencyequencyequency PerPerPerPerPercentcentcentcentcent
Customs tariffs currently employed 1 8.3
Export/import licenses and permits required 2 16.7
Substantial paper works, bureaucracy 1 8.3
Lack of information about foreign markets 2 16.7
Exchange rate uncertainty 2 16.7
Risk of non-payment of customers abroad 1 8.3
High transport costs 1 8.3
Weak law enforcement in export destination 2 16.7
Total 12 100.0
118
TTTTTable N12: Impact of RI on Domestic Businessable N12: Impact of RI on Domestic Businessable N12: Impact of RI on Domestic Businessable N12: Impact of RI on Domestic Businessable N12: Impact of RI on Domestic Business
More joint ventures in other SADC countries 83.3 16.7 0
New business activities 83.3 16.7 0
More imports from SADC 91.7 8.3 0
More exports to SADC countries 83.3 16.7 0
Access to cheaper inputs 75 16.7 8.3
Access to cheaper foreign labour 41.7 58.3 0
TTTTTable N13: Impact of RI on NSA's Involvement in Policy Makingable N13: Impact of RI on NSA's Involvement in Policy Makingable N13: Impact of RI on NSA's Involvement in Policy Makingable N13: Impact of RI on NSA's Involvement in Policy Makingable N13: Impact of RI on NSA's Involvement in Policy MakingFrFrFrFrFrequencyequencyequencyequencyequency PerPerPerPerPercentcentcentcentcent
Strengthen strongly 7 58.3
Strengthen slightly 4 33.3
No changes expected 1 8.3
Total 12 100.0
TTTTTable N14: Involvement in Design of Policiesable N14: Involvement in Design of Policiesable N14: Involvement in Design of Policiesable N14: Involvement in Design of Policiesable N14: Involvement in Design of PoliciesSADC PoliciesSADC PoliciesSADC PoliciesSADC PoliciesSADC Policies Domestic PoliciesDomestic PoliciesDomestic PoliciesDomestic PoliciesDomestic Policies
Yes 75 100.0
No 25 0
TTTTTable N15: Impact of RI on NSA's Influence on Domestic Policiesable N15: Impact of RI on NSA's Influence on Domestic Policiesable N15: Impact of RI on NSA's Influence on Domestic Policiesable N15: Impact of RI on NSA's Influence on Domestic Policiesable N15: Impact of RI on NSA's Influence on Domestic PoliciesFrFrFrFrFrequencyequencyequencyequencyequency PerPerPerPerPercentcentcentcentcent
Strengthen strongly 7 58.3
Strengthen slightly 3 25.0
Weaken slightly 1 8.3
No changes expected 1 8.3
Total 12 100.0
TTTTTable N16: Public Debates on Regional Integrationable N16: Public Debates on Regional Integrationable N16: Public Debates on Regional Integrationable N16: Public Debates on Regional Integrationable N16: Public Debates on Regional IntegrationRI in generalRI in generalRI in generalRI in generalRI in general SADCSADCSADCSADCSADC COMESACOMESACOMESACOMESACOMESA ECAECAECAECAECA
Yes, very much 25 33.3 33.3 25
Yes, but not so prominent 66.7 58.3 41.7 25
No 0 0 16.7 33.3
Don't know 8.3 8.3 8.3 16.7
119
TTTTTable N17: Discussions of Regional Integration within Orable N17: Discussions of Regional Integration within Orable N17: Discussions of Regional Integration within Orable N17: Discussions of Regional Integration within Orable N17: Discussions of Regional Integration within OrganisationsganisationsganisationsganisationsganisationsRI in generalRI in generalRI in generalRI in generalRI in general SADCSADCSADCSADCSADC COMESACOMESACOMESACOMESACOMESA ECAECAECAECAECA
Yes, regularly 25 33.3 25 16.7
Yes, sometimes 41.7 41.7 25 25
No 25 16.7 41.7 50
Don't know 8.3 8.3 8.3 8.3
TTTTTable N18: Orable N18: Orable N18: Orable N18: Orable N18: Organisation of Public Wganisation of Public Wganisation of Public Wganisation of Public Wganisation of Public Workshops/Seminars on RIorkshops/Seminars on RIorkshops/Seminars on RIorkshops/Seminars on RIorkshops/Seminars on RIRI in generalRI in generalRI in generalRI in generalRI in general SADCSADCSADCSADCSADC COMESACOMESACOMESACOMESACOMESA ECAECAECAECAECA
Yes, regularly 16.7 16.7 16.7 16.7
Yes, sometimes 16.7 8.3 8.3 0
No 58.3 66.7 66.7 75
Don't know 0 0 0 0
Does not apply 8.3 8.3 8.3 8.3
TTTTTable N19: Use of Prable N19: Use of Prable N19: Use of Prable N19: Use of Prable N19: Use of Press Releases to Raise Issues of RIess Releases to Raise Issues of RIess Releases to Raise Issues of RIess Releases to Raise Issues of RIess Releases to Raise Issues of RI
RI in generalRI in generalRI in generalRI in generalRI in general SADCSADCSADCSADCSADC COMESACOMESACOMESACOMESACOMESA ECAECAECAECAECA
Yes, regularly 8.3 16.7 16.7 8.3
Yes, sometimes 25 16.7 16.7 8.3
No 66.7 66.7 66.7 83.3
Don't know 0 0 0 0
Does not apply 0 0 0 0
TTTTTable N20: Attendance of Wable N20: Attendance of Wable N20: Attendance of Wable N20: Attendance of Wable N20: Attendance of Workshops/Seminars on Regional Integrationorkshops/Seminars on Regional Integrationorkshops/Seminars on Regional Integrationorkshops/Seminars on Regional Integrationorkshops/Seminars on Regional IntegrationRI in generalRI in generalRI in generalRI in generalRI in general SADCSADCSADCSADCSADC COMESACOMESACOMESACOMESACOMESA ECAECAECAECAECA
Yes, regularly 25 33.3 33.3 16.7
Yes, sometimes 25 25 8.3 8.3
No - Because no workshops were offered 41.7 33.3 41.7 58.3
No, but workshops were offered 0 0 8.3 8.3
Don't know 8.3 8.3 8.3 8.3
Does not apply 0 0 0 0
TTTTTable N21: Supporable N21: Supporable N21: Supporable N21: Supporable N21: Support for Regional Integrationt for Regional Integrationt for Regional Integrationt for Regional Integrationt for Regional IntegrationRI in generalRI in generalRI in generalRI in generalRI in general SADCSADCSADCSADCSADC COMESACOMESACOMESACOMESACOMESA ECAECAECAECAECA
Yes strongly 75 83.3 58.3 41.7
Yes slightly 25 16.7 41.7 25
No 0 0 0 25
Don't know 0 0 0 8.3
120
TTTTTable N22: Prable N22: Prable N22: Prable N22: Prable N22: Preferefereferefereferrrrrred Degred Degred Degred Degred Degree of SADC Integrationee of SADC Integrationee of SADC Integrationee of SADC Integrationee of SADC IntegrationYYYYYeseseseses NoNoNoNoNo Don't knowDon't knowDon't knowDon't knowDon't know
Reduce tariffs 100 0 0
Remove tariffs and establish CET to all other countries 100 0 0
Remove all trade restrictions 100 0 0
Remove restrictions on free movement of capital 100 0 0
Remove restrictions on free movement of labour 100 0 0
Remove restriction on free movement of services 100 0 0
Implement same level of taxes 83.3 16.7 0
Design competitive trade policies for SADC 100 0 0
Create a single currency 83.3 16.7 0
Create a political union with Parliament & Executive 75 25 0
Create umbrella organisation for NSA 100 0 0
121
About the Author:
BBBBBenson Zwizwaienson Zwizwaienson Zwizwaienson Zwizwaienson Zwizwai is a research economist and Deputy Director ofthe Institute of Development Studies of the University of
Zimbabwe. He has extensive experience in policy research and as adevelopment consultant stretching for 23 years. His areas of researchinclude science and technology policy, macroeconomic policy, tradepolicies and regional integration, and small-scale enterprisedevelopment.