105
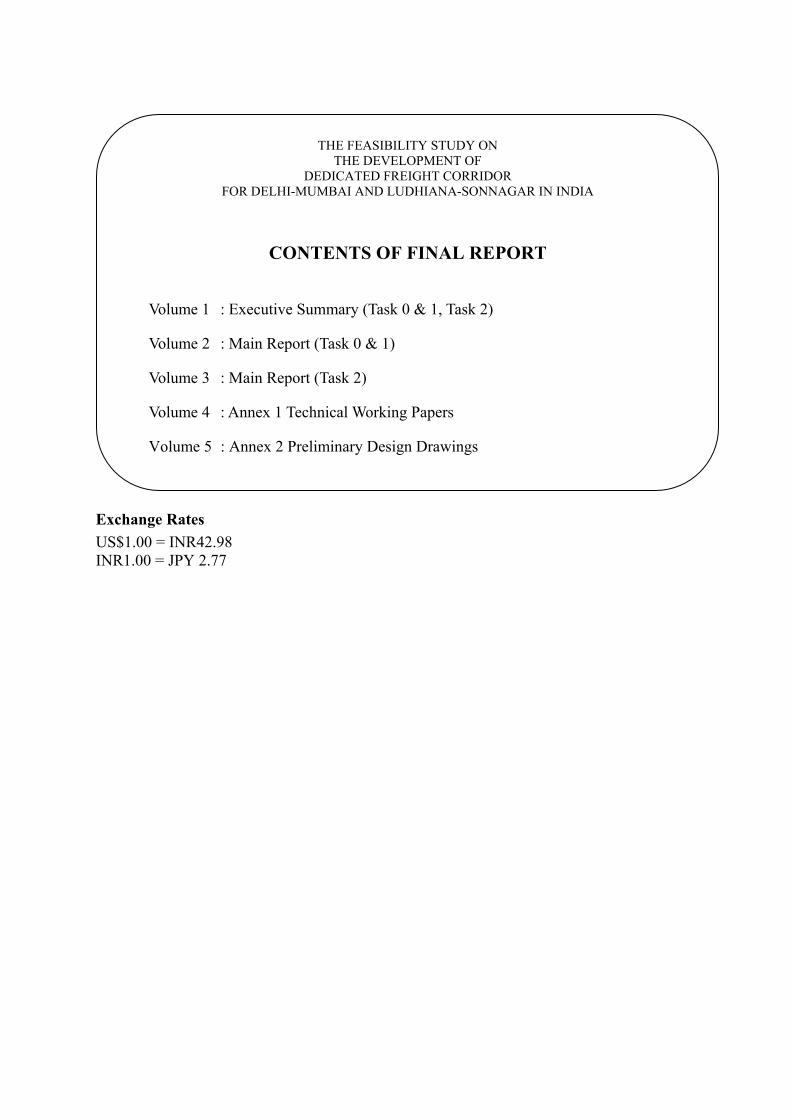
Exchange Rates US$1.00 = INR42.98 INR1.00 = JPY 2.77
THE FEASIBILITY STUDY ON THE DEVELOPMENT OF
DEDICATED FREIGHT CORRIDOR FOR DELHI-MUMBAI AND LUDHIANA-SONNAGAR IN INDIA
CONTENTS OF FINAL REPORT
Volume 1 : Executive Summary (Task 0 & 1, Task 2)
Volume 2 : Main Report (Task 0 & 1)
Volume 3 : Main Report (Task 2)
Volume 4 : Annex 1 Technical Working Papers
Volume 5 : Annex 2 Preliminary Design Drawings

PREFACE
At the Japan-India Summit Meeting in Delhi on the 29th of April 2005, eight-fold initiative for strengthening Japan-India Global Partnership was agreed by the Prime Ministers of both countries. Japan and Indian governments share the view that Japan’s Special Terms for Economic Partnership (hereinafter referred to as “STEP”) Scheme could be one of the effective means for carrying out large scale priority projects in infrastructure sector in India and confirmed their intention to examine the feasibility of the project, providing the inputs of Japanese technology and expertise.
In July 2005, The Government of India (hereinafter referred to as “GOI”) officially requested the Government of Japan (hereinafter referred to as “GOJ”) for Japan’s technical cooperation to assist in the feasibility assessment of a high priority transport development initiative, the “Dedicated Multimodal High-axle Load Freight Corridors with Computerized Train Control System on Mumbai-Delhi and Delhi-Howrah” (hereafter referred to as the Project).
In response to the request from the GOI, Japan International Cooperation Agency (hereinafter referred to as “JICA”) dispatched in October 2005 a contact mission to collect and analyze the necessary information for the above mentioned Project. JICA and the Ministry of Railways (hereinafter referred to as “MOR”) agreed that the feasibility study of the Project would be executed jointly. Based on the result of the preliminary study, the GOJ decided in November 2005 to conduct the feasibility study on the development of a multimodal high axle load freight corridor with computerised control for Delhi-Mumbai and Delhi-Howrah (hereinafter referred to as “the Study”).
In February 2006, JICA dispatched the preparatory study team, and the Scope of Work of the Study and the Minutes of Meeting were signed and exchanged between MOR and JICA.
In May 2006, JICA selected and dispatched the Study Team headed by Mr. Minoru Shibuya of Nippon Koei Co., Ltd., and consisting of Nippon Koei Company Limited, Japan Railway Technical Service, and Pacific Consultants International.
This report compiles the results of the Study that was carried out between May 2006 to the end of October 2007 and covers deliberation of various aspects of the Project such as the engineering feasibility, financial viability, and environmental and social consideration; all aspects being the key issues essential for the feasibility of the Project. Throughout the implementation of the Study, an Advisory Committee chaired by Mr. Katsuji Iwasa, Senior Advisor of Japan Freight Railway Company Limited, was organised to assist and to advise JICA and the Study Team for the execution of the study, as well as to coordinate and adjust the various stakeholders on the Japanese side. I would like to convey my appreciation to Mr. Iwasa and the members of the Advisory Committee for their continuous support to us.
Finally, it is my hope that this report will contribute to the realization of the Project and I wish to express my sincere appreciation to the officers of the Ministry of Railways of the Government of India who have devoted their time, provided information, and cooperating in good spirit with the Study Team for the completion of the Study.
October 2007
Eiji Hashimoto Vice-President
Japan International Cooperation Agency

October 2007
Mr. Eiji Hashimoto
Vice-President
Japan International Cooperation Agency
Letter of Transmittal
Dear Sir,
We have the pleasure of submitting herewith the Final Report on the “Feasibility Study on the Development of Dedicated Freight Corridor Delhi-Mumbai and Ludhiana-Sonnagar in India” (hereinafter referred to as the Study.).
The Study was undertaken from May 2006 to the end of October 2007 by the Study Team. The Study Team headed by Mr. Minoru Shibuya of Nippon Koei Co., Ltd., and is consisted of Nippon Koei Co., Ltd., Japan Railway Technical Service, and Pacific Consultants International.
We would like to express our sincere gratitude and appreciation to all the officials of your agency and the JICA Advisory Committee, the Ministry of Foreign Affairs, the Embassy of Japan in India, the Ministry of Railways as the counterpart agency, and to all of the counterpart personnel.
Yours faithfully,
Minoru Shibuya Team Leader
Feasibility Study on the Development of Dedicated Freight Corridor for Delhi-Mumbai and
Ludhiana-Sonnagar in India
�����
�����
����
���� ���
�������� �
��� �� ������
������
� � � � �
�� ��!"�
��#�$%&'#
��()&'#��)����*�'+�%�,)-
./!.�0�
1�)&'#
����%�2�3
�%'2���4%+�#
�)��4&'#
5657��
1�2��&'#
89:�:9�9
;9:�<
=>�?:9@9:
A>���9
B�:><9�9
C�� D9E9�
F���9>'�3#� ��#,
���3�� ��#,
�)&�G�G ��#,
'H2�) ��#,
1� ��#,
��� � � ��� �� ��� � ��� �� �� ��� � � ��� ������� � ��� ������ ��� � � ��� ������ ���� � ��� ������ � ��� � ��� ����� � ��� ���� ��� � � ��� �
���� �� ���� !��" � # $�%���� &���'�� � � () �%��!��" � ���� �� ����*�+ �) � �%��
������I���� ��)�+�� ���3J'�#,�#4
K LKK MKK NKK $H
�
! / O � 0 � / � 5 � P
��3)Q�,�3 R#�)�%, ��##)3�#� ��� �����(������ �����(%�

PROJECT AT A GLANCE

Project at a Glance (Entire Project) Details
No. Description Western Corridor Eastern Corridor
Alignment
0
JNPT - Vasai Rd – Vadodara –
Ahmedabad – Ajmer – Rewari
- Dadri
Sonnagar - Mughal Sarai –
Kanpur – Khurja - Dadri,
and Khurja – Kalanaur -
Dhandari Kalan
Route length
1 Total Length
- Double line
- Single line
1,468 km
1,468 km
-
1,309 km
883 km
426 km
Gradient
- Ruling gradient 1 in 200 (5/1000) 2
- Steepest gradient in yards 1 in 1200 (0.83/1000)
1 in 400 (2.5/1000) exceptional case
Standards of construction
- Gauge 1,676 mm
- Rails 60 kg/m UIC/90 UTS rail, HH rail
- Sleepers PSC 1660 nos./km density for main line, 1540 nos./km
density for loop line & sidings
- Points & crossings 60 kg rails, 1 in 12 with curved switches and CMS crossings
on PSC fan shaped sleepers or FFU (Fibre reinforced Formed
Urethane) sleepers
Minor loop lines and non-running lines,1 in 8 1/2 turnout
- Ballast 300 mm cushion
- Maximum speed 100 km/hr
3
- Type of traffic and axle load Double stack container movement on well type wagon and
5800 tonne train hauling with 25 tonne axle load
Formation (Detour Route)
- Bank width for double line 12.5 m
- Slope of embankment 2H: 1V
- Cutting width for double line 14.9 m
(11.9 m+1.5 m extra for each side for side drains)
- Slope of cutting 1:1
4
- Blanketing 0.60 m depth
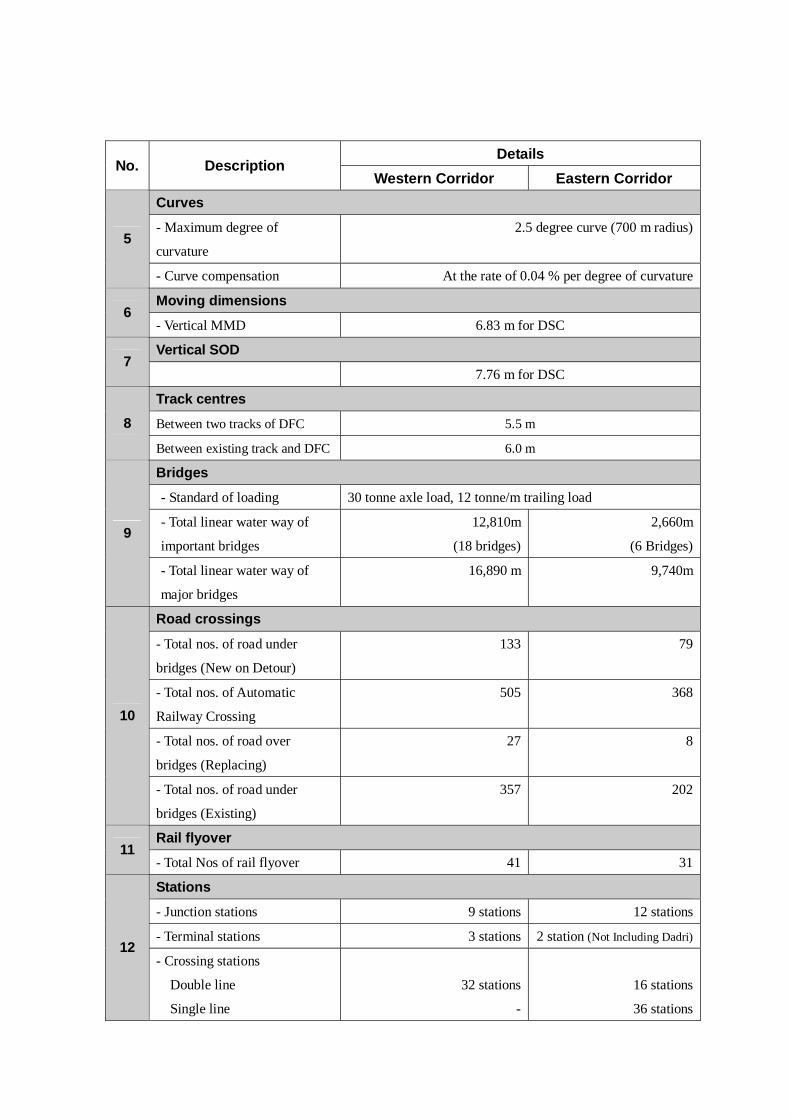
Details No. Description
Western Corridor Eastern Corridor Curves
- Maximum degree of
curvature
2.5 degree curve (700 m radius)5
- Curve compensation At the rate of 0.04 % per degree of curvature
Moving dimensions 6
- Vertical MMD 6.83 m for DSC
Vertical SOD 7
7.76 m for DSC
Track centres
Between two tracks of DFC 5.5 m 8
Between existing track and DFC 6.0 m
Bridges
- Standard of loading 30 tonne axle load, 12 tonne/m trailing load
- Total linear water way of
important bridges
12,810m
(18 bridges)
2,660m
(6 Bridges)9
- Total linear water way of
major bridges
16,890 m 9,740m
Road crossings
- Total nos. of road under
bridges (New on Detour)
133 79
- Total nos. of Automatic
Railway Crossing
505 368
- Total nos. of road over
bridges (Replacing)
27 8
10
- Total nos. of road under
bridges (Existing)
357 202
Rail flyover 11
- Total Nos of rail flyover 41 31
Stations
- Junction stations 9 stations 12 stations
- Terminal stations 3 stations 2 station (Not Including Dadri)12
- Crossing stations
Double line
Single line
32 stations
-
16 stations
36 stations
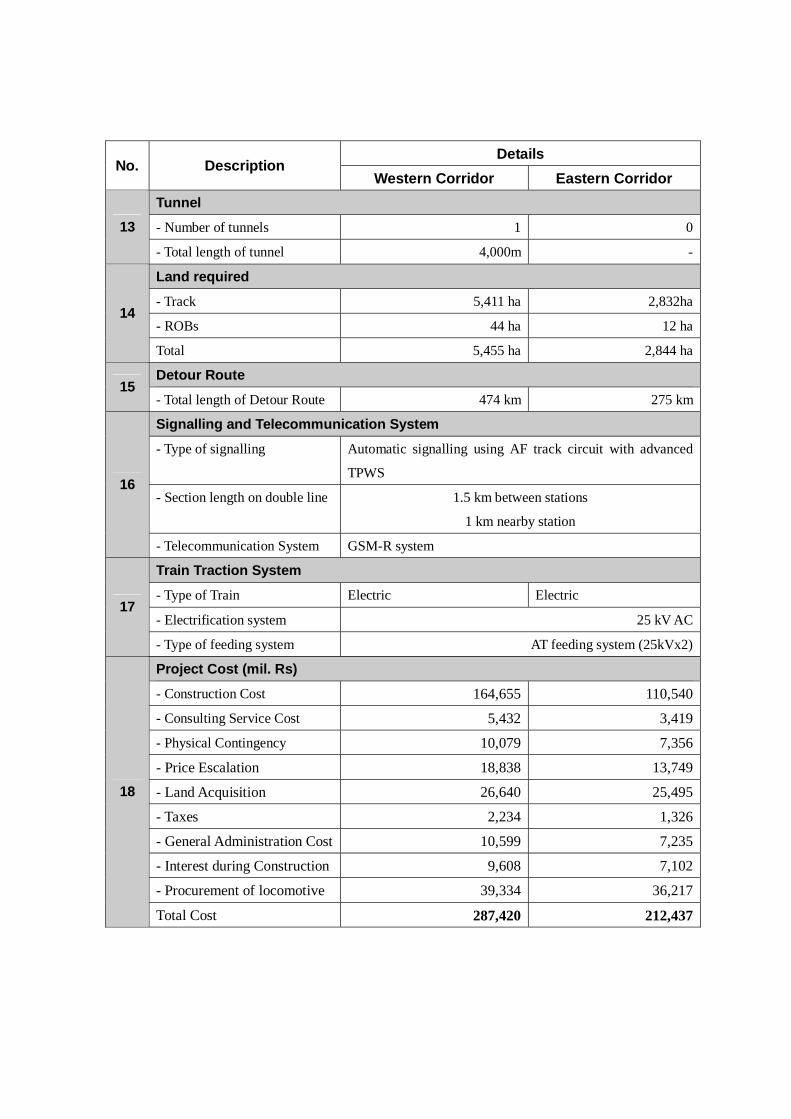
Details No. Description
Western Corridor Eastern Corridor Tunnel
- Number of tunnels 1 013
- Total length of tunnel 4,000m -
Land required
- Track 5,411 ha 2,832ha
- ROBs 44 ha 12 ha14
Total 5,455 ha 2,844 ha
Detour Route 15
- Total length of Detour Route 474 km 275 km
Signalling and Telecommunication System
- Type of signalling Automatic signalling using AF track circuit with advanced
TPWS
- Section length on double line 1.5 km between stations
1 km nearby station
16
- Telecommunication System GSM-R system
Train Traction System
- Type of Train Electric Electric
- Electrification system 25 kV AC17
- Type of feeding system AT feeding system (25kVx2)
Project Cost (mil. Rs) - Construction Cost 164,655 110,540
- Consulting Service Cost 5,432 3,419
- Physical Contingency 10,079 7,356
- Price Escalation 18,838 13,749
- Land Acquisition 26,640 25,495
- Taxes 2,234 1,326
- General Administration Cost 10,599 7,235
- Interest during Construction 9,608 7,102
- Procurement of locomotive 39,334 36,217
18
Total Cost 287,420 212,437
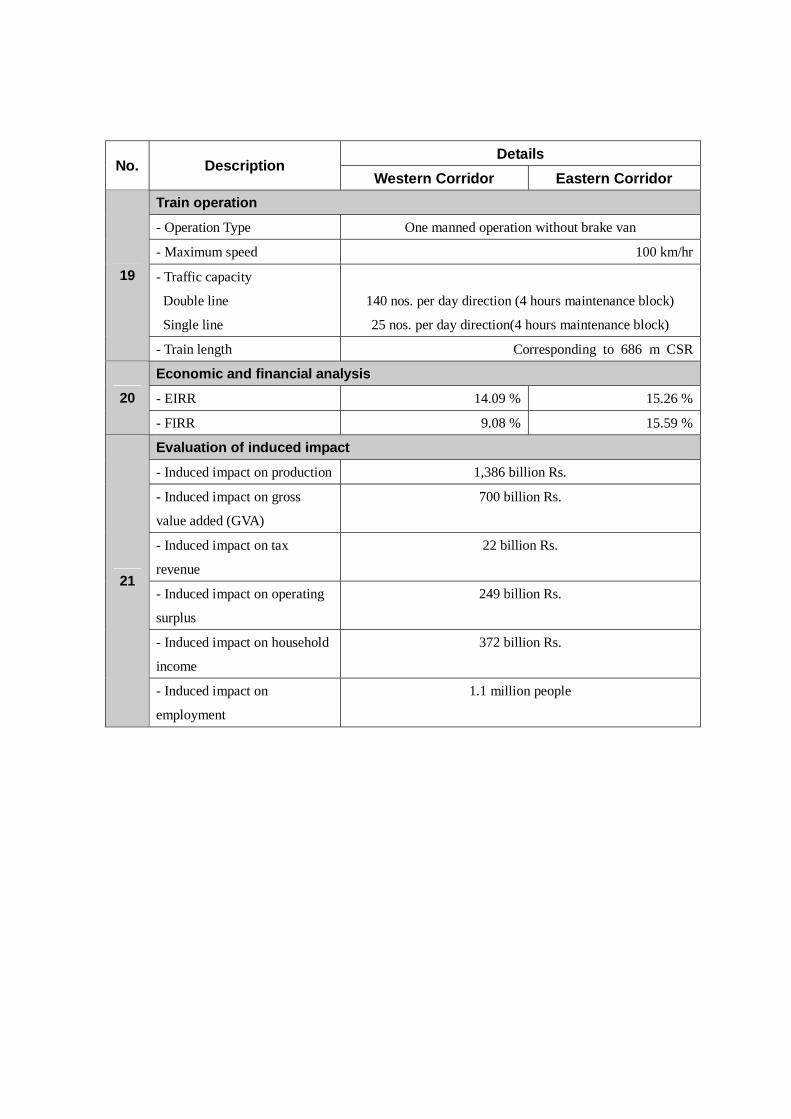
Details No. Description
Western Corridor Eastern Corridor Train operation
- Operation Type One manned operation without brake van
- Maximum speed 100 km/hr
- Traffic capacity
Double line
Single line
140 nos. per day direction (4 hours maintenance block)
25 nos. per day direction(4 hours maintenance block)
19
- Train length Corresponding to 686 m CSR
Economic and financial analysis
- EIRR 14.09 % 15.26 %20
- FIRR 9.08 % 15.59 %
Evaluation of induced impact
- Induced impact on production 1,386 billion Rs.
- Induced impact on gross
value added (GVA)
700 billion Rs.
- Induced impact on tax
revenue
22 billion Rs.
- Induced impact on operating
surplus
249 billion Rs.
- Induced impact on household
income
372 billion Rs.
21
- Induced impact on
employment
1.1 million people
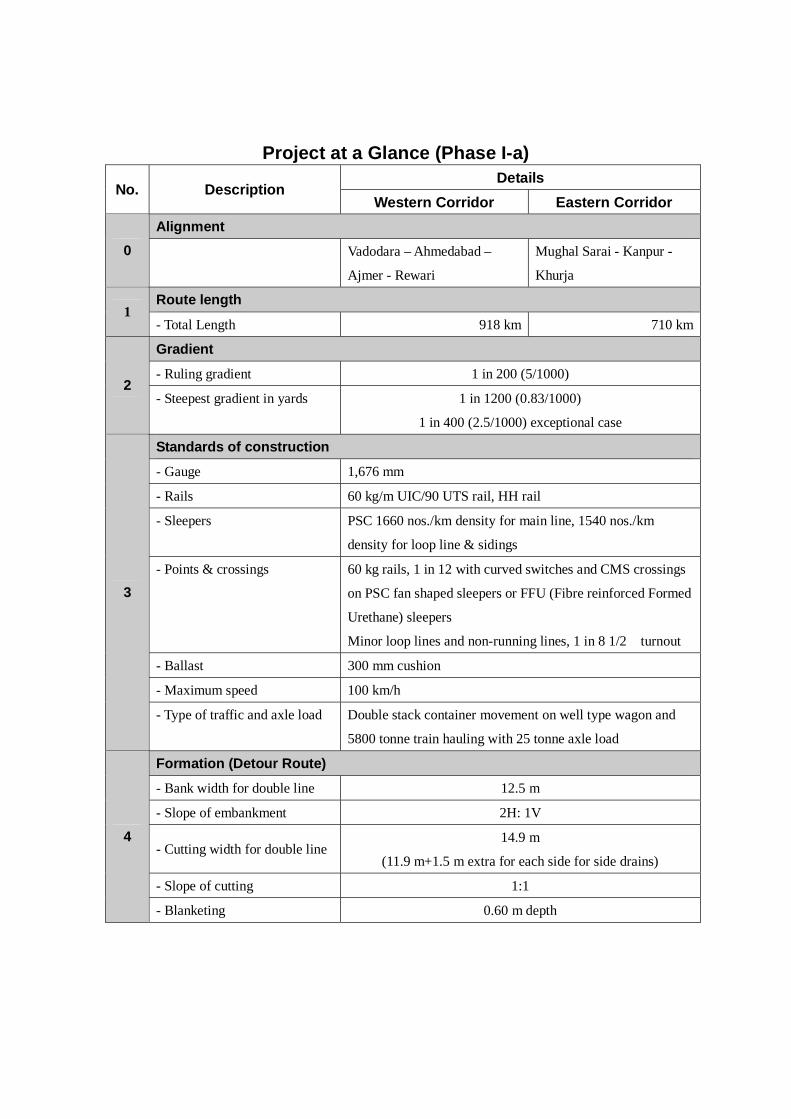
Project at a Glance (Phase I-a) Details
No. Description Western Corridor Eastern Corridor
Alignment 0
Vadodara – Ahmedabad –
Ajmer - Rewari
Mughal Sarai - Kanpur -
Khurja
Route length 1
- Total Length 918 km 710 km
Gradient
- Ruling gradient 1 in 200 (5/1000) 2
- Steepest gradient in yards 1 in 1200 (0.83/1000)
1 in 400 (2.5/1000) exceptional case
Standards of construction
- Gauge 1,676 mm
- Rails 60 kg/m UIC/90 UTS rail, HH rail
- Sleepers PSC 1660 nos./km density for main line, 1540 nos./km
density for loop line & sidings
- Points & crossings 60 kg rails, 1 in 12 with curved switches and CMS crossings
on PSC fan shaped sleepers or FFU (Fibre reinforced Formed
Urethane) sleepers
Minor loop lines and non-running lines, 1 in 8 1/2 turnout
- Ballast 300 mm cushion
- Maximum speed 100 km/h
3
- Type of traffic and axle load Double stack container movement on well type wagon and
5800 tonne train hauling with 25 tonne axle load
Formation (Detour Route)
- Bank width for double line 12.5 m
- Slope of embankment 2H: 1V
- Cutting width for double line 14.9 m
(11.9 m+1.5 m extra for each side for side drains)
- Slope of cutting 1:1
4
- Blanketing 0.60 m depth

Details No. Description
Western Corridor Eastern Corridor Curves
- Maximum degree of
curvature
2.5 degree curve (700 m radius)5
- Curve compensation At the rate of 0.04 % per degree of curvature
Moving dimensions 6
- Vertical MMD 6.83 m for DSC
Vertical SOD 7
7.76 m for DSC
Track centres
Between two tracks of DFC 5.5 m 8
Between existing track and DFC 6.0 m
Bridges
- Standard of loading 30 tonne axle load, 12 tonne/m trailing load
- Total linear water way of
important bridges
5,970m
(4 bridges)
1,620m
(2 Bridges)9
- Total linear water way of
major bridges
7,960m 2,200m
Road crossings
- Total nos. of road under
bridges (New)
87 48
- Total nos. of Automatic
Railway Crossing
317 212
- Total nos. of road over
bridges (rebuilt
1 2
10
- Total nos. of road under
bridges (extension)
207 110
Rail flyover 11
- Total Nos of rail flyover 29 18
Stations
- Crossing stations
Double line 21 stations 14 stations
- Junction stations 7 stations 8 stations
12
- Terminal stations 0 stations 0 stations
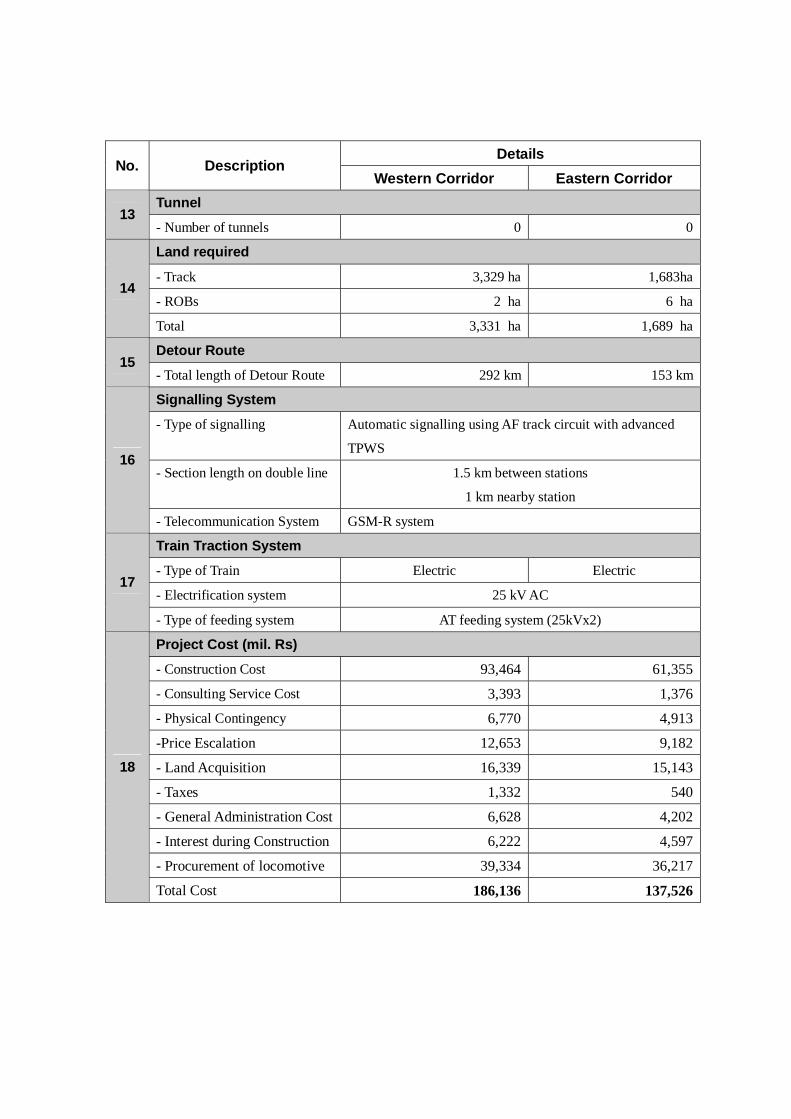
Details No. Description
Western Corridor Eastern Corridor Tunnel
13 - Number of tunnels 0 0
Land required
- Track 3,329 ha 1,683ha
- ROBs 2 ha 6 ha14
Total 3,331 ha 1,689 ha
Detour Route 15
- Total length of Detour Route 292 km 153 km
Signalling System
- Type of signalling Automatic signalling using AF track circuit with advanced
TPWS
- Section length on double line 1.5 km between stations
1 km nearby station
16
- Telecommunication System GSM-R system
Train Traction System
- Type of Train Electric Electric
- Electrification system 25 kV AC 17
- Type of feeding system AT feeding system (25kVx2)
Project Cost (mil. Rs) - Construction Cost 93,464 61,355
- Consulting Service Cost 3,393 1,376
- Physical Contingency 6,770 4,913
-Price Escalation 12,653 9,182
- Land Acquisition 16,339 15,143
- Taxes 1,332 540
- General Administration Cost 6,628 4,202
- Interest during Construction 6,222 4,597
- Procurement of locomotive 39,334 36,217
18
Total Cost 186,136 137,526
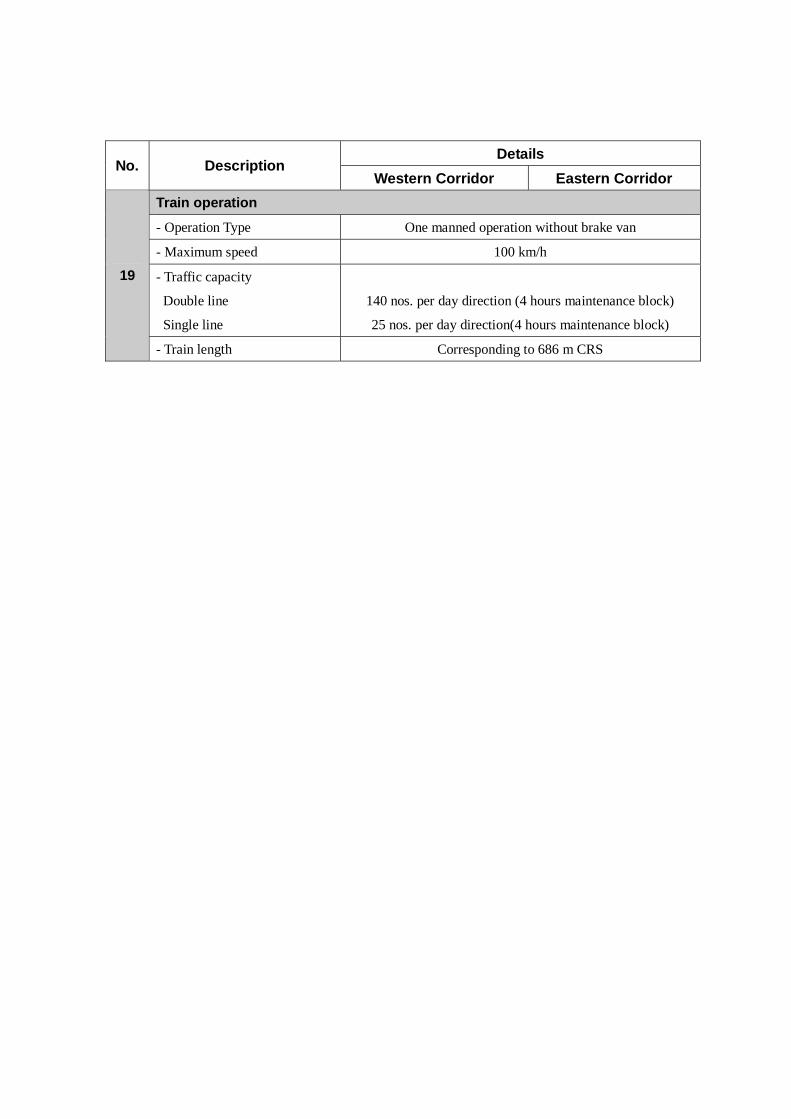
Details No. Description
Western Corridor Eastern Corridor Train operation
- Operation Type One manned operation without brake van
- Maximum speed 100 km/h
- Traffic capacity
Double line
Single line
140 nos. per day direction (4 hours maintenance block)
25 nos. per day direction(4 hours maintenance block)
19
- Train length Corresponding to 686 m CRS

TABLE OF CONTENTS

The Feasibility Study on The Development of Dedicated Freight Corridor for Delhi-Mumbai and Ludhiana-Sonnagar in India Final Report (Task 0&1)
i
THE FEASIBILITY STUDY
ON THE DEVELOPMENT
OF DEDICATED FREIGHT CORRIDOR
FOR DELHI-MUMBAI AND LUDHIANA-SONNAGAR IN INDIA
FINAL REPORT
Volume 2
TASK 0&1
CONTENTS PREFACE
LETTER OF TRANSMITTAL
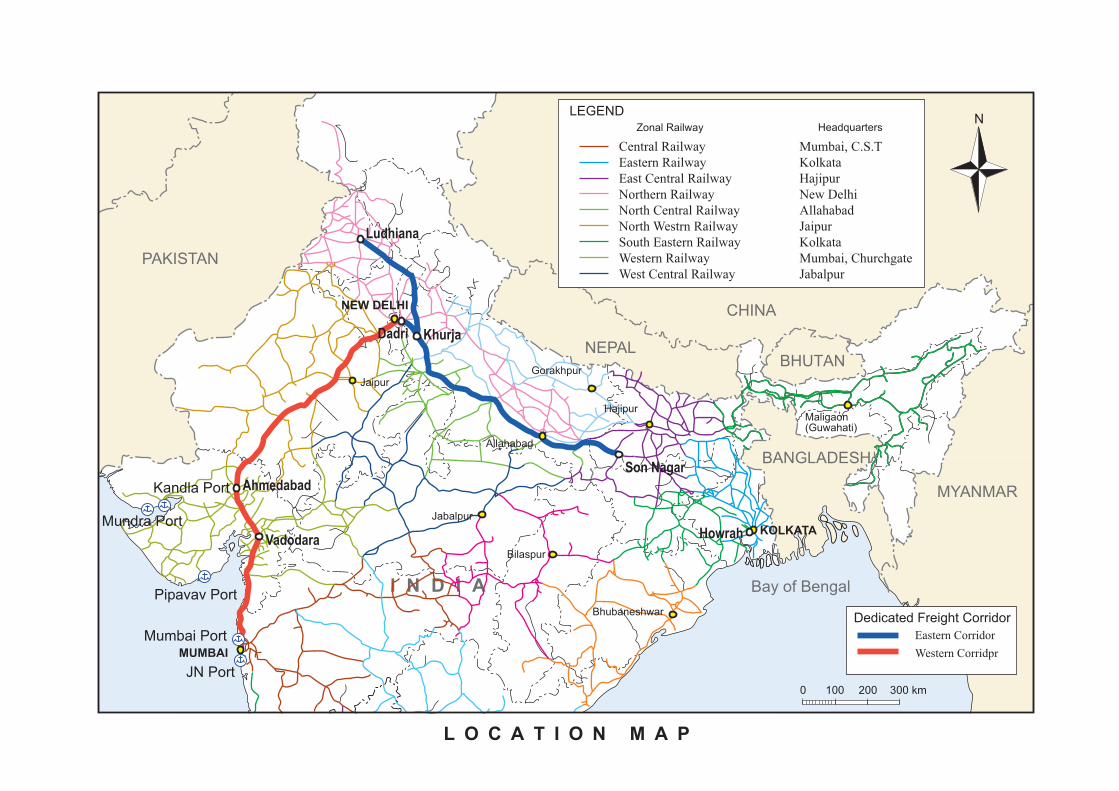
LOCATION MAP
PROJECT AT A GLANCE (ENTIRE PROJECT)
PROJECT AT A GLANCE (PHASE I-a)
ABBREVIATIONS LIST
CHAPTER 1 INTRODUCTION………………………………………………………………1-1 . CHAPTER 2 CURRENT CONDITION AND ISSUES PERTAINING TO THE
TRANSPORT SECTOR SCENARIO IN INDIA.……………………………2-1 2.1 INTRODUCTION............................................................................................................2-1 2.2 SUMMARY OF RAIL TRANSPORT IN INDIA AND THE NATIONAL TRANSPORT IMPROVEMENT PLAN ..........................................................................2-3 2.2.1 Summary of Track System of the Indian Railways .......................................................2-3 2.2.2 The Rail Improvement Plan in the National Improvement Plan ....................................2-4 2.3 ROLE OF RAILWAY IN FREIGHT TRANSPORT OF INDIA.......................................2-5 2.3.1 Freight Transport in India ............................................................................................2-5 2.3.2 Comparison of Rail Freight Transport With Other Transport Modes ..........................2-12 2.3.3 Freight Transport on Existing Lines ...........................................................................2-13 2.4 PASSENGER TRANSPORT .........................................................................................2-15 2.4.1 Passenger Transport in India ......................................................................................2-15 2.4.2 Comparison of Rail Passenger Transport with other Transport Modes ........................2-17 2.4.3 Passenger Transport on Existing Lines.......................................................................2-19 CHAPTER 3 SOCIO-ECONOMIC CONDITION OF THE CORRIDORS……………….3-1 3.1 INTRODUCTION............................................................................................................3-1 3.2 REGIONAL PROFILE ....................................................................................................3-1 3.3 DEMOGRAPHIC CONDITION ......................................................................................3-3 3.4 ECONOMIC CONDITION..............................................................................................3-5
The Feasibility Study on The Development of Dedicated Freight Corridor for Delhi-Mumbai and Ludhiana-Sonnagar in India Final Report (Task 0&1)
ii
3.5 INDUSTRY .....................................................................................................................3-5 3.5.1 Overview.....................................................................................................................3-5 3.5.2 Sectoral Profile ............................................................................................................3-6 3.5.3 Location Map of Industry ............................................................................................3-9 CHAPTER 4 STUDY OF THE PRESENT SITUATION OF THE TARGET
LINES……………………………………………………………………………4-1 4.1 PRESENT TRANSPORT SITUATION ...........................................................................4-1
4.1.1 Train operation systems on the relevant lines ....................................................................4-1 4.1.2 Present situation of Traffic and Train Operation on the target lines ...................................4-4 4.1.3 Bottlenecks in Transport.................................................................................................4-14 4.1.4 Freight Train Diagrams and Traffic Control....................................................................4-21
4.2 STATIONS / YARDS ....................................................................................................4-22 4.2.1 Role of stations/yards on existing trunk lines for freight traffic .......................................4-22 4.2.2 Large-scale multifunction station/yards ..........................................................................4-22 4.2.3 Marshalling yards...........................................................................................................4-24 4.2.4 Medium scale station/yard..............................................................................................4-25 4.2.5 Intermediate stations.......................................................................................................4-25 4.2.6 Travel speed at turnouts..................................................................................................4-26
4.3 CIVIL ENGINEERING FACILITIES ............................................................................4-26 4.3.1 Standards of Construction...............................................................................................4-27 4.3.2 Track..............................................................................................................................4-28 4.3.3 Earth Work.....................................................................................................................4-31 4.3.4 Bridges and Culverts ......................................................................................................4-32
4.4 ELECTRICAL FACILITIES..........................................................................................4-36 4.4.1 Present State of Existing Electrified Sectors in Zonal Railways.......................................4-37 4.4.2 General View on Traction Power Facilities of the Status Quo .........................................4-38 4.4.3 Present Power Supply Condition over Non-Electrified Sectors........................................4-41 4.4.4 Regulation against Electromagnetic Induction and Harmonics in Indian Railways ..........4-41
4.5 TELECOMMUNICATION SYSTEM............................................................................4-42 4.5.1 Existing Telecommunication Systems.............................................................................4-43 4.5.2 Development Tendency and Directivity of the Telecommunication Systems ...................4-44
4.6 SIGNALLING SYSTEM ...............................................................................................4-47 4.6.1 Existing Signalling System.............................................................................................4-47 4.6.2 Issues of Signalling Systems...........................................................................................4-50 4.6.3 The Modernisation Plan of Signalling System.................................................................4-52 4.6.4 Ongoing Modernization Plan in the Section Ghaziabad-Kanpur and other section...........4-52
4.7 ROLLING STOCK ........................................................................................................4-53 4.7.1 Current rolling stock conditions......................................................................................4-54 4.7.2 Current Condition of Maintenance Depots and Workshops .............................................4-56 4.7.3 Maintenance System for the Rolling Stock .....................................................................4-62 4.7.4 The Present State of Locomotive Industry in India..........................................................4-62
4.8 STUDY ON FEEDER ROUTES....................................................................................4-64 4.8.1 Introduction....................................................................................................................4-64 4.8.2 Identified Feeder Routes by MOR ..................................................................................4-65 4.8.3 Existing Railway System and Major Commodities of the Feeder Routes .........................4-66
4.9 PRESENT CONDITION AND FUTURE DEVELOPMENT PLAN OF TARGET PORTS...........................................................................................................................4-71
4.9.1 Present Condition of Target Ports ...................................................................................4-71 4.9.2 Past Trend of Cargo Shipment ........................................................................................4-71 4.9.3 Past Trend of Container Traffic ......................................................................................4-72 4.9.4 Present Condition of Port Facilities and its future plan ....................................................4-73 4.9.5 Railway and Port Operation............................................................................................4-74
4.10 PRESENT CONDITION OF ROAD NETWORK ..........................................................4-76

The Feasibility Study on The Development of Dedicated Freight Corridor for Delhi-Mumbai and Ludhiana-Sonnagar in India Final Report (Task 0&1)
iii
4.10.1 Present Condition of Road Network in India...................................................................4-76 4.10.2 Present National Road Conditions along the DFCs .........................................................4-78
4.11 INLAND CONTAINER DEPOT (ICD) .........................................................................4-79 4.11.1 Function of ICD .............................................................................................................4-79 4.11.2 ICD for CONCOR..........................................................................................................4-79 4.11.3 Summary of Existing ICD Conditions around South Area in NCR..................................4-80 4.11.4 Trend of ICD Business ...................................................................................................4-81
CHAPTER 5 CURRENT IMPROVEMENT PLAN FOR EXISTING LINES AND
FACILITIES…………………………………………………………………….5-1 5.1 FUTURE RAILWAY NETWORK DEVELOPMENT PLAN ..........................................5-1 5.1.1 Initiatives taken by the Zonal Railways ........................................................................5-1 5.1.2 Improvement Plan .......................................................................................................5-1 5.1.3 Ongoing and sanctioned existing line improvement projects.........................................5-5 5.2 FUTURE PORT DEVELOPMENT PLAN.......................................................................5-9 5.2.1 Future Port Development Plan .....................................................................................5-9 5.2.2 Future Container Cargo Handling Productivity...........................................................5-12 5.3 FUTURE ROAD NETWORK DEVELOPMENT PLAN................................................5-12 5.3.1 National Highway Development Plan in India............................................................5-12 5.3.2 Future road network development plan in National Capital Region (NCR) .................5-15 5.4 FUTURE DEVELOPMENT PLAN ON SOUTH AREA IN NCR ..................................5-16 5.4.1 Gurgaon District ........................................................................................................5-16 5.4.2 Rewari District ..........................................................................................................5-18 5.4.3 National Capital Region.............................................................................................5-19 CHAPTER 6 DEMAND FORECAST………………………………………………………..6-1 6.1 INTRODUCTION............................................................................................................6-1 6.2 SOCIO-ECONOMIC FRAMEWORK..............................................................................6-2 6.2.1 Population ...................................................................................................................6-2 6.2.2 Economic Growth........................................................................................................6-2 6.2.3 Industrial Structure ......................................................................................................6-3 6.3 FREIGHT DEMAND FORECAST ..................................................................................6-5 6.3.1 Methodology ...............................................................................................................6-5 6.3.2 Container Traffic .........................................................................................................6-7 6.3.3 Coal Traffic ...............................................................................................................6-11 6.3.4 Traffic Demand of Other Commodities ......................................................................6-14 6.3.5 Traffic Assignment ....................................................................................................6-16 6.3.6 Cross-Section Traffic.................................................................................................6-17 6.3.7 Freight Transport Output in Tonne-Km......................................................................6-18 6.4 PASSENGER DEMAND FORECAST ..........................................................................6-19 6.4.1 Trend Analysis ..........................................................................................................6-19 6.4.2 Modal Share Analysis ................................................................................................6-21 6.4.3 Future Demand in Passenger Transport ......................................................................6-22 6.4.4 Cross-Section Passenger Traffic.................................................................................6-23 6.5 CORRIDOR TRAFFIC..................................................................................................6-25 6.6 DFC TRAFFIC FORECAST..........................................................................................6-33 6.6.1 Base Year DFC Traffic in PETS-I..............................................................................6-33 6.6.2 Train Load.................................................................................................................6-33 6.6.3 Projection of DFC on the Eastern Corridor.................................................................6-34 6.6.4 Projection of DFC on the Western Corridor ...............................................................6-35 6.7 TRAFFIC DEMAND ON HOWRAH – SONNAGAR ...................................................6-37

The Feasibility Study on The Development of Dedicated Freight Corridor for Delhi-Mumbai and Ludhiana-Sonnagar in India Final Report (Task 0&1)
iv
CHAPTER 7 ESTIMATION OF LINE CAPACITY………………………………………..7-1 7.1 THE NEED FOR ESTIMATING .....................................................................................7-1 7.2 METHODS USED FOR ESTIMATING LINE CAPACITY.............................................7-1 7.2.1 Estimations based on a model section ..........................................................................7-2 7.3 ASSUMPTIONS..............................................................................................................7-2 7.3.1 Enhanced speed restrictions at turnouts ........................................................................7-2 7.3.2 Improved loops at stations ...........................................................................................7-2 7.3.3 Improved layout of the stations and the signals around the station ................................7-2 7.3.4 Confirmed locomotive performance and train specifications.........................................7-3 7.3.5 The brake performance of hauled coaches or wagons ...................................................7-5 7.3.6 The allocations of the increased number of trains by train type.....................................7-5 7.4 ESTIMATING LINE CAPACITY ...................................................................................7-5 7.4.1 Estimation of Headways ..............................................................................................7-5 7.4.2 Estimation of travel time..............................................................................................7-6 7.4.3 Drawing of the train charts...........................................................................................7-6 7.4.4 Calculation of the line capacity ....................................................................................7-6 7.4.5 Remarks ......................................................................................................................7-6 7.4.6 Estimation of line capacity of DFC and the existing line after the comprehensive
improvements ..............................................................................................................7-7 CHAPTER 8 THE MOST SUITABLE TECHNICAL OPTION…………………………...8-1 8.1 REALIZATION OF EFFECTIVE LOGISTICS................................................................8-1 8.1.1 Seamless Transport Systems ........................................................................................8-1 8.1.2 Seamless Logistics Technology ...................................................................................8-3 8.1.3 Seamless Institution System.........................................................................................8-8 8.2 TRACK TECHNOLOGIES FOR HIGH AXLE LOAD..................................................8-10 8.2.1 Track Maintenance and Rail Failure in Indian Railway ..............................................8-10 8.2.2 Subject to Be Examined on High Axle Load Railways and HH Rail...........................8-12 8.2.3 Cast Manganese Crossing ..........................................................................................8-13 8.2.4 Prestressed Concrete Sleeper .....................................................................................8-13 8.3 AXLE LOAD AND LOOP LENGTH ............................................................................8-14 8.3.1 Axle load...................................................................................................................8-14
8.3.2 Loop length ...............................................................................................................8-15 8.4 DOUBLE-STACK CONTAINER TRANSPORT...........................................................8-16 8.4.1 Studies on Examples..................................................................................................8-16 8.4.2 Technical Possibilities and Restrictions......................................................................8-17
8.4.3 Subjects relevant to Electrification.............................................................................8-20 8.4.4 Considerations on through operations between existing lines .....................................8-22 8.5 MAXIMUM MOVING DIMENSIONS AND WAGONS PARAMETERS ....................8-23 8.6 STRUCTURES..............................................................................................................8-24
8.6.1 Earth Work................................................................................................................8-24 8.6.2 Bridges ......................................................................................................................8-25 8.7 ROLLING STOCK ........................................................................................................8-27 8.7.1 Latest locomotives for high speed heavy hauling........................................................8-27 8.8 ELECTRIC FACILITIES...............................................................................................8-28 8.8.1 Review of PETS-II ....................................................................................................8-28
8.8.2 Proposal on Electrification.........................................................................................8-29 8.8.3 SCADA.....................................................................................................................8-29
8.8.4 Power Supply for Telecommunication and Signalling System....................................8-29 8.8.5 Plans on Electric Power Plants ...................................................................................8-29
8.9 TELECOMMUNICATION AND SIGNALING SYSTEMS...........................................8-32 8.9.1 Telecommunications System......................................................................................8-32

The Feasibility Study on The Development of Dedicated Freight Corridor for Delhi-Mumbai and Ludhiana-Sonnagar in India Final Report (Task 0&1)
v
8.9.2 Signaling System.......................................................................................................8-36 8.9.3 Power Supply for Telecommunication and Signalling System....................................8-38
8.10 TRAIN OPERATING CONTROL SYSTEM .................................................................8-39 8.10.1 Need for operation control system on DFC ................................................................8-39 8.10.2 Traffic operation control functions .............................................................................8-39 8.10.3 The effect of introducing traffic operation control ......................................................8-40 8.10.4 Latest technical trends in train operation control systems ...........................................8-40 8.10.5 Performance and specification requirements for the DFC operation control system ....8-42 8.10.6 Hardware of Traffic Operation Control System..........................................................8-43 8.10.7 Hardware Configuration of Monitoring System of Telecommunication and Signaling
Devices .....................................................................................................................8-46
CHAPTER 9 STRATEGY FOR INTER-MODAL TRANSPORT BY RAILWAY……….9-1 9.1 PRESENT SITUATION OF LONG DISTANCE ROAD TRANSPORT ..........................9-1 9.1.1 Problems of road transport ...........................................................................................9-2 9.1.2 Improvement of road transport.....................................................................................9-3 9.2 THE PROBLEMS OF INTER-MODAL TRANSPORT BY RAILWAY ..........................9-4 9.3 TARGETS FOR INTERMODAL TRANSPORTATION BY RAILWAYS ....................9-11 9.3.1 Minimizing lost time by improving cooperation among companies ............................9-11
9.3.2 Clarifying train schedules ..........................................................................................9-12 9.3.3 Improvement of service quality..................................................................................9-13 9.3.4 Estimation of improvement effect by inter-modal transport strategy ...........................9-13 9.3.5 Transport of value-added commodities.......................................................................9-14 9.4 THE PROPOSAL ROLES OF DFCCIL AND IR IN INTERMODAL TRANSPORT.....9-15 9.4.1 Realization of visible logistics over the whole transport system..................................9-16 9.4.2 Consolidation of common structures for railway operators .........................................9-16
9.4.3 Promoting a metropolitan area ICD plan ....................................................................9-17 CHAPTER 10 STUDY OF ALTERNATIVES……………………………………………….10-1 10.1 PROCESS OF ALTERNATIVES EVALUATION.........................................................10-1 10.2 POLICIES AND ISSUES FACING THE ALTERNATIVES STUDY............................10-1 10.2.1 Alt.1: Construction of New Dedicated Freight Corridor (DFC)...................................10-2 10.2.2 Alt.2: Construction of New Dedicated Passenger Corridor .........................................10-2 10.2.3 Alt.3: Improvement of Existing Lines ........................................................................10-3 10.2.4 Zero Option (Without Project) ...................................................................................10-3 10.3 ROUTE SETTING IN THE ALTERNATIVES STUDY ................................................10-3
10.3.1 Alt.1: Construction of New Dedicated Freight Corridor (DFC)...................................10-3 10.3.2 Alt.2: Construction of New Dedicated Passenger Corridor .........................................10-4 10.3.3 Alt.3: Improvement of Existing Lines ........................................................................10-5 10.3.4 Zero Option (Without Project) ...................................................................................10-6
10.4 DESIGN STANDARDS OF ALTERNATIVES .............................................................10-6 10.5 QUALITATIVE COMPARISON OF ALTERNATIVES IN RELATION TO MERITS
AND DEMERITS ..........................................................................................................10-7 10.6 SCREENING OF ALTERNATIVES FROM ENVIRONMENT AND SOCIAL
CONSIDERATION VIEWPOINT .................................................................................10-9 10.6.1 Dedicated Freight Corridor ........................................................................................10-9 10.6.2 Dedicated Passenger Corridor ..................................................................................10-10 10.6.3 Improvement of Existing Lines ................................................................................10-11 10.6.4 Zero Option .............................................................................................................10-13
10.7 EVALUATION OF ALTERNATIVES ........................................................................10-16 10.7.1 Evaluation by means of Comparison between Traffic Demand and Line Capacity....10-16 10.7.2 Comparison of the DPC Option and DFC Option by Construction Cost....................10-25 10.7.3 Comprehensive Evaluation Result............................................................................10-26

The Feasibility Study on The Development of Dedicated Freight Corridor for Delhi-Mumbai and Ludhiana-Sonnagar in India Final Report (Task 0&1)
vi
CHAPTER 11 ENVIRONMENTAL AND SOCIAL CONSIDERATIONS STUDY
(ESCS)………………………………………………………………………….11-1 11.1 Alternative ANALYSIS .................................................................................................11-1
11.1.1 Setting of Alternatives ....................................................................................................11-1 11.1.2 Environmental Scoping for Each Alternative ..................................................................11-1
11.2 Laws and Regulations on Environmental and Social Considerations .............................11-14 11.2.1 Indian Laws and Regulations on Environmental Clearance ...........................................11-14 11.2.2 Procedures for Land Acquisition...................................................................................11-17
11.3 Environmental and Social Considerations Study at IEE Level.......................................11-18 11.3.1 Study Area ...................................................................................................................11-18 11.3.2 Methodology and Items to be Studied...........................................................................11-20 11.3.3 Preliminary Findings of Environmental and Social Impacts ..........................................11-21 11.3.4 Supplementary Measurement of Railway Noise and Vibration Levels...........................11-28 11.3.5 Narrow-Down of Study Area for ESIMMS...................................................................11-33
11.4 Stakeholder/PUBLIC CONSULTATION Meeting .......................................................11-34 11.4.1 Policy for Implementation of Stakeholder/Public Consultation Meeting........................11-34 11.4.2 Results of the First Stage Stakeholder/Public Consultation Meeting..............................11-36
11.5 Establishment of and Discussions with EWG................................................................11-41 11.5.1 Background, Objectives and Roles of EWG..................................................................11-41 11.5.2 Composition of EWG ...................................................................................................11-41 11.5.3 Summary of EWG Meetings.........................................................................................11-42
CHAPTER 12 PROJECT IMPLEMENTATION PLAN FOR THE OPTIMUM
PROPOSITION………………………………………………………………..12-1 12.1 OUTLINE COST ESTIMATE OF OPTIMUM PROPOSITION.....................................12-1
12.1.1 Outline Costs on PETS Report ...................................................................................12-1 12.1.2 Approach for Review of Project Cost estimated in PETS-2 Report .............................12-4 12.1.3 Approach for Review of Construction Cost of Main Items and Unit Rates used in PETS-2
Report .......................................................................................................................12-5 12.1.4 Review of Unit Rate for Earth Work ..........................................................................12-7 12.1.5 Review of Construction Cost for Bridges ...................................................................12-8 12.1.6 Review of Construction Cost for Track Work ..........................................................12-12 12.1.7 Review of Electrification Cost .................................................................................12-12 12.1.8 Review of the construction for Signalling system.....................................................12-12 12.1.9 Review of the construction for Telecommunication system ......................................12-13 12.1.10 Cost Estimate for Rolling Stock Procurement...........................................................12-14
12.2 ESTIMATION OF BUDGETARY PROJECT COST...................................................12-14 12.2.1 Conditions of Estimation .........................................................................................12-14 12.2.2 Budgetary Project Cost ............................................................................................12-14
12.3 CONSTRUCTION MANAGEMENT ..........................................................................12-18 12.3.1 Outline of DFC Project and Trend of Indian Construction Industries ........................12-18 12.3.2 Implementation Structure of Large-scale Projects Executed/Under Execution in
India ........................................................................................................................12-22 12.3.3 Delhi Metro Rail Corporation (DMRC)....................................................................12-23
12.4 EFFORTS FOR FORMULATING SPV AND CHALLENGES OF THE SPV..............12-25 12.4.1 Efforts Made for the Formation of the DFC-SPV .....................................................12-25 12.4.2 PPP (Public Private/Public Public Partnership) strategy of MOR..............................12-28 12.4.3 Challenges of the DFC Project Through MOR’s Experience ....................................12-32 12.4.4 Implementation Plan of SPV in DFC .......................................................................12-34

The Feasibility Study on The Development of Dedicated Freight Corridor for Delhi-Mumbai and Ludhiana-Sonnagar in India Final Report (Task 0&1)
vii
LIST OF TABLES
Table 2-1 Main Infrastructure Investment Targets in the 10th 5-Year Plan................................2-4 Table 2-2 Share of Transport Sector to Gross Domestic Product ...............................................2-5 Table 2-3 Modal Share for Freight Transport in India ...............................................................2-6 Table 2-4 Estimation of Tonne-Kilometres by Road for Year 2000...........................................2-9 Table 2-5 Length of Roads by Category ...................................................................................2-9 Table 2-6 List of National Waterways ....................................................................................2-11 Table 2-7 Passenger Traffic by Mode .....................................................................................2-15 Table 3-1 State Profile..............................................................................................................3-2 Table 3-2 List of Million plus City ...........................................................................................3-4 Table 3-3 Official Languages, % of scheduled castes and tribes, literacy rate and poverty ratio.3-4 Table 3-4 Factories and Enterprises ..........................................................................................3-6 Table 3-5 Steel Plants in proximity to the Corridors..................................................................3-7 Table 3-6 Production of Iron Ore (2003-04)..............................................................................3-7 Table 3-7 Coal Reserves in India ..............................................................................................3-7 Table 3-8 Cement Production in India ......................................................................................3-8 Table 3-9 Production of Fertilizer (2004-05).............................................................................3-8 Table 3-10 Production of Selected Crops (2003-04)....................................................................3-9 Table 4-1 Train Parameters and their Performance.......................................................................4-3 Table 4-2 Average Sectional Train Number 2004-05 (Western Corridor-Southern Route) ............4-6 Table 4-3 Average Sectional Train Number 2004-05 (Western Corridor-Northern Route) ............4-7 Table 4-4 Average Sectional Train Number2004-05 (Eastern Corridor) .......................................4-8 Table 4-5 Standards of Construction of IR .................................................................................4-27 Table 4-6 Codes and Manuals for Bridge Design .......................................................................4-34 Table 4-7 Standard Drawings for Bridge Design ........................................................................4-35 Table 4-8 Loading conditions to be considered for Bridge design...............................................4-36 Table 4-9 Detail specification of Live load.................................................................................4-36 Table 4-10 Limits of Induced Voltage due to 25kV AC Electrification.......................................4-42 Table 4-11 Existing Telecommunication Systems ......................................................................4-43 Table 4-12 Current Condition of the Zonal Railways .................................................................4-44 Table 4-13 Percentage of Train Kilometres by Type of Traction ................................................4-55 Table 4-14 Percentage of Gross Tonne Kilometres by Type of Traction .....................................4-55 Table 4-15 Number of Locomotives by Type.............................................................................4-55 Table 4-16 Types of Diesel Locomotives ...................................................................................4-55 Table 4-17 Types of Electric Locomotives .................................................................................4-56 Table 4-18 (A) Electric Loco sheds on WR..............................................................................4-59 Table 4-18 (B) Diesel Loco Sheds on WR..................................................................................4-59 Table 4-19 Diesel Loco shed on NWR.......................................................................................4-59 Table 4-20 (A) Electric Loco Sheds on WCR.............................................................................4-59 Table 4-20 (B) Diesel Loco sheds on WCR................................................................................4-60 Table 4-21 (A) Electric Loco Sheds on NR...................................................................................4-60 Table 4-21 (B) Diesel Loco sheds on NR ...................................................................................4-60 Table 4-22 (A) Electric Loco Sheds on NCR .............................................................................4-60 Table 4-22 (B) Diesel Loco Sheds on NCR................................................................................4-60 Table 4-23 (A) Electric Loco Sheds on ER ................................................................................4-61 Table 4-23 (B) Diesel Loco Sheds on ER...................................................................................4-61 Table 4-24 (A) Electric Loco Sheds on ECR..............................................................................4-61 Table 4-24 (B) Diesel Loco Sheds on ECR ................................................................................4-61 Table 4-25 (A) Electric Loco Sheds on SER ..............................................................................4-61 Table 4-25 (B) Diesel Loco Shed on SER ..................................................................................4-62 Table 4-26 Maintenance System for Rolling Stock (Freight Use Only).......................................4-62
The Feasibility Study on The Development of Dedicated Freight Corridor for Delhi-Mumbai and Ludhiana-Sonnagar in India Final Report (Task 0&1)
viii
Table 4-27 Outline Locomotive Builders and Equipment Supplier ............................................4-63 Table 4-28 Feeder Routes for Moving Double Stack Container Trains on Western Corridor
Identified by MOR .................................................................................................4-65 Table 4-29 Feeder Routes for Coal Wagons for 25tonne Axle Load on Eastern Corridor Identified
by MOR .................................................................................................................4-65 Table 4-30 Major Commodities Handled at Terminal Stations of Feeder Routes (2005/2006) ...4-70 Table 4-31 Feature of Berth at Target Ports ..............................................................................4-73 Table 4-32 Cargo Handling Volume and Container Traffic at Target Ports ...............................4-73 Table 4-33 Summary of Port Facilities and Cargo Handling Equipment for Container Cargo ....4-73 Table 4-34 Summary of Container Cargo Handling Productivity at Target Ports.......................4-74 Table 4-35 Length of Roads by Category (April, 2007) ............................................................4-76 Table 4-36 Length of Roads by Lane Number (July, 2007).......................................................4-78 Table 4-37 Summary of ICD for CONCOR..............................................................................4-79 Table 4-38 Features of TKD ICD and Dadri ICD......................................................................4-81 Table 4-39 List of Operators to Sign the Concession Agreement with Indian Railway ..............4-83 Table 5-1 Single-line Sections and Their Length.......................................................................5-7 Table 5-2 Scope of Improvements on the Four Existing Routes ................................................5-8 Table 5-3 Future Improvement Works in RITES Report ...........................................................5-9 Table 5-4 The features of port facilities for Phase-1 and Phase-2 ............................................5-10 Table 5-5 The cargo handling productivity estimated for the period between 2005 and 2010 of Pipavav port ...........................................................................................................5-11 Table 5-6 Summary of Potential Container Cargo Handling Productivity at Target Ports ........5-12 Table 5-7 The components of NHDP......................................................................................5-12 Table 6-1 Population Projection of India ..................................................................................6-2 Table 6-2 State-wise Socioeconomic Framework......................................................................6-4 Table 6-3 Projection of Container Throughput..........................................................................6-8 Table 6-4 Modal Share of Container Transport from/ to JNPT ..................................................6-9 Table 6-5 Projection of Container Traffic for 2021-22 and 2031-32 ..........................................6-9 Table 6-6 Projection of Container Traffic for 2011-12 and 2016-17 ..........................................6-9 Table 6-7 O/D Pattern of Container Traffic for the Projection.................................................6-10 Table 6-8 Container Transport by Rail (’000 TEUs) ...............................................................6-11 Table 6-9 List of Thermal Power Stations...............................................................................6-11 Table 6-10 New Power Plants and Coal Demand in the Period of 10th and 11th Plan............... .6-13 Table 6-11 Assumed Additional Capacity in the 12th and 13th Plans (MW) .............................6-13 Table 6-12 Distribution of Coal Transport ................................................................................6-14 Table 6-13 Time Series Data of Population, GDP, and Traffic Volume by Indian Railways ......6-15 Table 6-14 Commodity-wise Traffic Production (Million Tonne) .............................................6-15 Table 6-15 Traffic Volume Ratio (Future Traffic/Base Year Traffic) of Major Section .............6-16 Table 6-16 Container Traffic Assignment to Rail Corridors ......................................................6-17 Table 6-17 O/D pairs for Container Traffic Assignment ...........................................................6-17 Table 6-18 No. of Freight Trains in the Eastern Corridor in the Future......................................6-17 Table 6-19 No. of Freight Trains in the Western Corridor .........................................................6-18 Table 6-20 The Future Tonne-Km by Corridors (Both Directions) ............................................6-18 Table 6-21 CAGR of GDP, Population, and Railway Passenger Traffic for the Last 10 Years...6-19 Table 6-22 Comparison of Air and Rail between Major Cities ..................................................6-21 Table 6-23 Demand Forecast of Number of Passenger Originating ...........................................6-22 Table 6-24 Estimation of Average Lead of Passenger Transport ...............................................6-23 Table 6-25 Demand Forecast of Passenger-km and Growth Ratio .............................................6-23 Table 6-26 Projected Average Passenger Occupancy................................................................6-24 Table 6-27 No. of Passenger Trains in the Eastern Corridor ......................................................6-24 Table 6-28 No. of Passenger Trains in the Major Sections of the Western Corridor.................. .6-24 Table 6-29 Future passenger km by corridor (billion passenger km) .........................................6-24 Table 6-30 No. of Trains in the Eastern Corridor ......................................................................6-25
The Feasibility Study on The Development of Dedicated Freight Corridor for Delhi-Mumbai and Ludhiana-Sonnagar in India Final Report (Task 0&1)
ix
Table 6-31 No. of Trains in the Western Corridor .....................................................................6-25 Table 6-32 Projection of the Number of Trains on Eastern Corridor (Delhi - Howrah) ..............6-27 Table 6-33 Projection of the Number of Trains on Eastern Corridor (North Route) ...................6-28 Table 6-34 Projection of the Number of Trains on Western Corridor (North Route)..................6-29 Table 6-35 Projection of the Number of Trains on Western Corridor (South Route)..................6-30 Table 6-36 Transport Volume by DFC in year 2004-05 (non-container)....................................6-33 Table 6-37 Container Traffic Volume by DFC in 2004-05 (Western Corridor)..........................6-33 Table 6-38 Train Load..............................................................................................................6-33 Table 6-39 No. of Trains on the DFC (East), current axle load..................................................6-33 Table 6-40 Projection of the Number of DFC Trains on the Western Corridor ..........................6-35 Table 7-1 Line Capacity of Indian Railways .............................................................................7-1 Table 7-2 Profile of Trains .......................................................................................................7-3 Table 7-3 Allocation of the Increased Number of Trains...........................................................7-5 Table 7-4 Calculated Headways ...............................................................................................7-5 Table 7-5 Additional Time for Stopping ...................................................................................7-6 Table 7-6 Results of Line Capacity Calculations.......................................................................7-6 Table 7-7 Line capacity of DFC and the existing line after the comprehensive improvements ...7-8 Table 8-1 Properties of Railway & Road ..................................................................................8-3 Table 8-2 Representative Sizes of Palette & Container .............................................................8-4 Table 8-3 Axle load and tonnage of bulk train, Case of loop length - 686 m............................8-14 Table 8-4 Axle load and hauling tonnage of container wagons................................................8-15 Table 8-5 DSC loading conditions corresponding the axle load...............................................8-19 Table 8-6 Speed Limits at Curves ...........................................................................................8-20 Table 8-7 Latest Electric Locomotives in Europe and Japan....................................................8-27 Table 8-8 Latest Diesel Electric Locomotives in U.S. Europe and Japan .................................8-28 Table 8-9 Comparison of Telecommunications Systems Described in the RITES Report (Interim
Report, PETS-II) and JICA Study Team .................................................................8-33 Table 8-10 Signaling system comparison between PET2 and JST.............................................8-37 Table 9-1 Cost Ratio to Revenue of Long Distance Road Transporter .......................................9-2 Table 9-2 List of Interstate Transit Documentation ...................................................................9-3 Table 9-3 Planning of Highways and Expressways ...................................................................9-4 Table 9-4 Problems by Nodes/Modes of Inter-modal Transport by Railway..............................9-6 Table 9-5 Transport Days of Debarked Containers from Port to ICD ........................................9-8 Table 9-6 The Number of Trains from JNP (year 2007) ..........................................................9-10 Table 9-7 Solutions and Their Effects on the “Not Speedy” Problem ......................................9-12 Table 9-8 Solutions and their effects on the “Not punctual” problem ......................................9-13 Table 9-9 Solutions and Their Effects on the “Not Customer-oriented“ Problem.....................9-13 Table 10-1 Features and Construction Standards of Alternatives...............................................10-7 Table 10-2 Advantages and disadvantages of Alt.2 and Alt3 against Alt.1 (DFC) .....................10-8 Table 10-3 Increase of CO2 Emission for the Western Corridor Without DFC Project: Trucks 10-14 Table 10-4 Increase of CO2 Emission for the Eastern Corridor Without DFC (Trucks)............10-14 Table 10-5 Increase of CO2 Emission for the Western Corridor Without DFC: Buses .............10-15 Table 10-6 Increase of CO2 Emission for the Eastern Corridor Without DFC: Buses...............10-15 Table 10-7 Number of Cedar Trees Necessary to Absorb the CO2 Emitted in 1 Year ..............10-16 Table 10-8 Chronological Relation between Demand and Capacity for the Eastern corridor....10-24 Table 10-9 Chronological Relation between Demand and Capacity for the Western corridor ..10-24 Table 10-10 Summary of Design Condition and Other Assumptions for the Cost
Comparison ..........................................................................................................10-25 Table 10-11 Comparison of Construction Cost of DPC&DFC Options .....................................10-26 Table 10-12 Comprehensive Evaluation Results of Alternatives ...............................................10-27
The Feasibility Study on The Development of Dedicated Freight Corridor for Delhi-Mumbai and Ludhiana-Sonnagar in India Final Report (Task 0&1)
x
Table 11-1 Impact Matrix of Zero Option Alternative (Eastern Corridor)..................................11-4 Table 11-2 Impact Matrix of Zero Option Alternative (Western Corridor) ................................11-5 Table 11-3 Impact Matrix of Modification of Existing Line Alternative
(Improvement of Present Signal and Track System: Eastern Corridor) ....................11-6 Table 11-4 Impact Matrix of Modification of Existing Line Alternative
(Improvement of Present Signal and Track System: Western Corridor) ...................11-7 Table 11-5 Impact Matrix of Modification of Existing Line Alternative
(Construction of Double-tracks and Improvement of Present Signal and Track System: Eastern Corridor)....................................................................................................11-8
Table 11-6 Impact Matrix of Modification of Existing Line Alternative (Construction of Double-tracks and Improvement of Present Signal and Track System: Western Corridor)...................................................................................................11-9
Table 11-7 Impact Matrix of Dedicated Passenger Corridor (DPC) Alternative (Eastern Corridor)... .............................................................................................................................11-10 Table 11-8 Impact Matrix of Dedicated Passenger Corridor (DPC) Alternative (Western Corridor) . .............................................................................................................................11-11 Table 11-9 Impact Matrix of Dedicated Freight Corridor (DFC) Alternative (Eastern Corridor) ....... .............................................................................................................................11-12 Table 11-10 Impact Matrix of Dedicated Freight Corridor (DFC) Alternative (Western Corridor)...... .............................................................................................................................11-13 Table 11-11 Ambient Air Quality Standard ..............................................................................11-16 Table 11-12 Use-based Classification of Surface Waters ..........................................................11-16 Table 11-13 DFC Sections for the ESCS ..................................................................................11-19 Table 11-14 Land Uses of Respective States ............................................................................11-20 Table 11-15 Potential Environmental and Social Impacts in Western Corridor : Social Aspects 11-21 Table 11-16 Potential Environmental and Social Impacts in Western Corridor: Natural Environment .............................................................................................................................11-23 Table 11-17 Potential Environmental and Social Impacts in Western Corridor: Pollution..........11-24 Table 11-18 Potential Environmental and Social Impacts in Eastern Corridor: Social Aspects ..11-26 Table 11-19 Potential Environmental and Social Impacts in Eastern Corridor : Natural Environment. .............................................................................................................................11-27 Table 11-20 Potential Environmental and Social Impacts in Eastern Corridor: Pollution ...........11-27 Table 11-21 Ambient Noise Standard in India ..........................................................................11-28 Table 11-22 Categories of Train Operation for Railway Noise and Vibration Measurement ......11-30 Table 11-23 Results of Railway Noise and Vibration Measurement ..........................................11-33 Table 11-24 Category of the Stakeholders and their Impact Items and Concerns .......................11-35 Table 11-25 Method of Stakeholder/Public Consultation Meeting ............................................11-35 Table 11-26 Summary of the Stakeholder/Public Consultation Meeting....................................11-36 Table 11-27 Schedule for the First Stage Stakeholder/Public Consultation Meeting ..................11-37 Table 11-28 Categorization of Stakeholders by Type................................................................11-37 Table 11-29 Stakeholders by Group .........................................................................................11-38 Table 11-30 Social Structure of the Participants .......................................................................11-39 Table 11-31 Occupation of the Participants ..............................................................................11-39 Table 11-32 Interest on DFC Project ........................................................................................11-39 Table 11-33 Level of Annual Income of the Participants ..........................................................11-39 Table 11-34 Education Level of the Participants.......................................................................11-40 Table 11-35 Category of Questions and Opinions by Participants .............................................11-40 Table 11-36 Members of EWG ................................................................................................11-41 Table 11-37 Members of Academic Adviser.............................................................................11-41 Table 12-1 RITES Estimate Cost..............................................................................................12-2 Table 12-2 Estimated Cost of Western Corridor in PETS-II......................................................12-3 Table 12-3 Estimated Cost of Eastern Corridor in PETS-II .......................................................12-4 Table 12-4 Content of PETS-II Estimation Cost for Western & Eastern Corridors ....................12-5 Table 12-5 Cost Reviw of Earth work Rates .............................................................................12-8
The Feasibility Study on The Development of Dedicated Freight Corridor for Delhi-Mumbai and Ludhiana-Sonnagar in India Final Report (Task 0&1)
xi
Table 12-6 Detail of Bridge Costs on PETS-II..........................................................................12-8 Table 12-7 Cost Review of Steel & Masonry Bridges ...............................................................12-9 Table 12-8 Costs Review of Bridge -ROBs ..............................................................................12-9 Table 12-9 Estimate table for Lx protection system per 1Lx ...................................................12-11 Table 12-10 Alternatives for Bridge -ROBs Cost Consideration ...............................................12-11 Table 12-11 Computation of Electrification Cost for Western Corridor.....................................12-12 Table 12-12 Comparison of Specification of Signaling System.................................................12-13 Table 12-13 Comparison of Specification of Telecommunication System.................................12-13 Table 12-14 Computation of Locomotive & Wagon Cost .........................................................12-14 Table 12-15 Structure and Amount of Budgetary Project Cost ..................................................12-14 Table 12-16 JICA Study Team’s estimate Construction Cost ....................................................12-16 Table 12-17 Risks to be Considered in DFC Project Implementation by Project Phase..............12-20 Table 12-18 Pros and Cons in both Integrated and Separated models ........................................12-26 Table 12-19 Comparison of Characteristic of PPP ....................................................................12-28 Table 12-20 Historical project costs estimated..........................................................................12-29 Table 12-21 Revenue Budget and current business performance...............................................12-29 Table 12-22 Equity structure ....................................................................................................12-29 Table 12-23 Final Financing (UNIT: billion Rs.) ......................................................................12-30 Table 12-24 Organizational similarity between DFCCIL and MRVC .......................................12-31 Table 12-25 TOR of Project Consultancy Services ...................................................................12-35
The Feasibility Study on The Development of Dedicated Freight Corridor for Delhi-Mumbai and Ludhiana-Sonnagar in India Final Report (Task 0&1)
xii
LIST OF FIGURES
Figure 2-1 GDP at constant (1993-04) prices and GDP Growth Rate..........................................2-5 Figure 2-2 Modal Share between Rail and Road (tonne-km) ......................................................2-6 Figure 2-3 Freight Transport in Tonne-Kilometres by Indian Railways (Revenue Earning............... traffic) ......................................................................................................................2-6 Figure 2-4 Commodity-wise & state-wise freight generation & attraction by rail (Left:
generation, Right: attraction) ....................................................................................2-7 Figure 2-5 Freight O/D (2005, Over 2 million ton for both directions)........................................2-7 Figure 2-6 Commodity Movements by Rail ...............................................................................2-8 Figure 2-7 Length of National Highways (1994-2004) .............................................................2-10 Figure 2-8 National Highways Development Project I & II ......................................................2-11 Figure 2-9 Cargo Traffic by Air (Freight + Mail) .....................................................................2-11 Figure 2-10 Freight Demand by Mode of Transport ...................................................................2-12 Figure 2-11 Rate of Freight by a Single Mode and Mixed Mode ................................................2-13 Figure 2-12 Ton-km/Route Length.............................................................................................2-14 Figure 2-13 Freight Revenue per ton/km (PPP)..........................................................................2-14 Figure 2-14 Modal Share of Passenger Transport between Rail and Road...................................2-15 Figure 2-15 The Number of Registered Buses ............................................................................2-16 Figure 2-16 Air Route Map........................................................................................................2-16 Figure 2-17 Passenger-km of Domestic Airlines ........................................................................2-17 Figure 2-18 Road vs Rail (Passenger-km) ..................................................................................2-17 Figure 2-19 Ratio of Second Class Passenger km and Earnings ..................................................2-18 Figure 2-20 Passenger km/Route km..........................................................................................2-20 Figure 2-21 Ratio of Two Categories of train-km.......................................................................2-20 Figure 2-22 Revenue per Passenger-km .....................................................................................2-20 Figure 3-1 States in India...........................................................................................................3-1 Figure 3-2 Compound Annual Growth Rate (CAGR) of GSDP..................................................3-5 Figure 3-3 State-wise Industrial Structure ..................................................................................3-6 Figure 3-4 Location of Steel Plants in India ...............................................................................3-9 Figure 3-5 Location of Coalfields in India................................................................................3-10 Figure 3-6 Location of Cement Plants in India .........................................................................3-11 Figure 4-1 Figure of Trains........................................................................................................4-3 Figure 4-2 Route Map of the Metropolitan Area.........................................................................4-5 Figure 4-3 Train Diagram (1/4)................................................................................................4-10 Figure 4-3 Train Diagram (2/4)................................................................................................4-11 Figure 4-3 Train Diagram (3/4)................................................................................................4-12 Figure 4-3 Train Diagram (4/4)................................................................................................4-13 Figure 4-4 Causes of Stopping of Succeeding Trains at Home Signals .....................................4-15 Figure 4-5 Operational Constrains by Merging or Crossing at Stations.....................................4-16 Figure 4-6 Route Conflict for Up and Down Tracks and its Resolution ....................................4-17 Figure 4-7 Line Capacity and the Average Number of Trains (West Corridor via Southern
Route) ....................................................................................................................4-18 Figure 4-8 Line Capacity and the Average Number of Trains (Eastern Corridor)......................4-19 Figure 4-9 Line Capacity and the Average Number of Trains (West Corridor via Northern
Route) ....................................................................................................................4-20 Figure 4-10 Ballast Profile for LWR Track (Single Line B.G)....................................................4-29 Figure 4-11 Standard Ballast Profile for B.G. (Other than LWR/CWR)......................................4-30 Figure 4-12 Electrical Single Line Diagram...............................................................................4-40 Figure 4-13 Optical fiber network plan as of June 30, 2006........................................................4-46 Figure 4-14 Example of Rolling Maintenance Organisation .......................................................4-56 Figure 4-15 Allocation of depots and workshops .......................................................................4-57

The Feasibility Study on The Development of Dedicated Freight Corridor for Delhi-Mumbai and Ludhiana-Sonnagar in India Final Report (Task 0&1)
xiii
Figure 4-16 Work Flow of the Study on Feeder Routes..............................................................4-64 Figure 4-17 Feeder Routes Identified by MOR ..........................................................................4-67 Figure 4-18 Existing Railway System of DFC Trunk Routes and Feeder Routes ........................4-68 Figure 4-19 National Highway Route Map in India....................................................................4-77 Figure 4-20 Present Road Condition of NH8 and NH2...............................................................4-78 Figure 4-21 Location Map of CONCOR’s Terminal ..................................................................4-80 Figure 4-22 Location Map of ICD around NCR .........................................................................4-82 Figure 5-1 Diagram of Widening Banks for Doubling................................................................5-6 Figure 5-2 Diagram of Widening Cutting for Doubling..............................................................5-7 Figure 5-3 NHDP Maps...........................................................................................................5-14 Figure 5-4 Proposed Transport Network (Road) 2021 ..............................................................5-16 Figure 5-5 Development Plan of Gurgaon District Controlled Area up to 2021.........................5-17 Figure 5-6 Development Plan of Rewari District Controlled Area up to 2021...........................5-18 Figure 5-7 Proposed Land use 2021 in NCR ............................................................................5-19 Figure 5-8 Proposed Land Plan 2021 in Delhi (Draft) ..............................................................5-20 Figure 5-9 Proposed Transport Network (Rail) 2021................................................................5-21 Figure 6-1 Reference Map of Chapter 5 .....................................................................................6-1 Figure 6-2 Population and NSDP Growth by State.....................................................................6-3 Figure 6-3 Flow of Demand Forecast of Freight Train in this Study ...........................................6-7 Figure 6-4 Projection of Container Traffic by Elasticity Model and Linear Model......................6-7 Figure 6-5 Projection of Container Throughput at All Indian Ports.............................................6-8 Figure 6-6 Location of Thermal Power Plants and Coal Fields .................................................6-12 Figure 6-7 Relation between GDP and Freight Traffic by Rail .................................................6-14 Figure 6-8 Number of Passengers originating from 1999-00 to 2005-05...................................6-19 Figure 6-9 Passenger-km from 1999-00 to 2005-05..................................................................6-20 Figure 6-10 Relationship between GDP and Passenger-kilometre of Indian Railways ................6-20 Figure 6-11 Modal Share depending on Travel Distance ............................................................6-21 Figure 6-12 Number of trains by direction per day on the East and Western Corridor (2004-05).6-26 Figure 6-13 Number of trains by direction per day on the East and Western Corridor
(2031-32)…………………………………………………………………………….6-26 Figure 6-14 Future traffic flow of the Corridors .........................................................................6-31 Figure 6-14 Future traffic flow of the Corridors (cont’)..............................................................6-32 Figure 6-15 Section-wise traffic volume on the DFC (East), current axle load............................6-36 Figure 6-16 Section-wise Traffic Volume on the DFC (West), current axle load ........................6-36 Figure 6-17 Demand-Capacity Analysis on Sonnagar – Howrah ................................................6-37 Figure 7-1 Method for Confirming the Improvement of Line Capacity.......................................7-2 Figure 7-2 Layout of Stations and Signals Near Them................................................................7-3 Figure 7-3 Distribution Chart of Acceleration ............................................................................7-4 Figure 7-4 Distribution Chart of Deceleration ............................................................................7-4 Figure 7-5 Figures of Headway Patterns ....................................................................................7-6 Figure 7-6 Train Chart for the Section between Valsad and Surat (1) 00:00 – 04:00 ...................7-9 Figure 7-7 Train Chart for the Section between Valsad and Surat (2) 04:00 – 08:00 .................7-10 Figure 7-8 Train Chart for the Section between Valsad and Surat (3) 08:00 – 12:00 .................7-11 Figure 7-9 Train Chart for the Section between Valsad and Surat (4) 12:00 – 16:00 .................7-12 Figure 7-10 Train Chart for the Section between Valsad and Surat (5) 16:00 – 20:00 .................7-13 Figure 7-11 Train Chart for the Section between Valsad and Surat (6) 20:00 – 24:00 .................7-14 Figure 8-1 The Structure of Transport System............................................................................8-1 Figure 8-2 Linkage of Time and Cost in Logistics......................................................................8-2 Figure 8-3 Identification Units & Identification Technologies of Materials ................................8-6 Figure 8-4 A figure of IT-FRENS summary...............................................................................8-7 Figure 8-5 Seamless Information in Intermodal Transport through Land and Sea .......................8-8

The Feasibility Study on The Development of Dedicated Freight Corridor for Delhi-Mumbai and Ludhiana-Sonnagar in India Final Report (Task 0&1)
xiv
Figure 8-6 Relation between Accumulated Tonnage and Rail Defects ......................................8-13 Figure 8-7 Comparison of DSC on Flat and Well Type Wagons...............................................8-18 Figure 8-8 Over Head Catenaries adapted to MMD allowing DSC studied by RDSO...............8-21 Figure 8-9 Conceptual Design of Pantograph to Allow Higher Working Range........................8-22 Figure 8-10 MMD Studied by RDSO.........................................................................................8-23 Figure 8-11 Fixed structure gauge for electrified territory of the dedicated freight corridor studied
by RDSO................................................................................................................8-24 Figure 8-12 Suitable bridge type due to span length ...................................................................8-26 Figure 8-13 Bridge using Atmospheric corrosion-resistant steel .................................................8-26 Figure 8-14 Thermal Power Plant Plan cleared/appraised by CEA .............................................8-30 Figure 8-15 Hydro Power Plant Plan cleared/appraised by CEA.................................................8-31 Figure 8-16 Grid relevant the Western DFC...............................................................................8-32 Figure 8-17 Power supply for telecommunication and signalling system ....................................8-38 Figure 8-18 Configuration of the Computerized Traffic Operation Control System ....................8-39 Figure 8-19 Comparative Features between Centralized and Decentralized System....................8-41 Figure 8-20 Configuration of CRCS (Computerized Route Control System) and CTC ...............8-44 Figure 8-21 Hierarchy route setting system................................................................................8-45 Figure 8-22 Workflow of the Repair Work ................................................................................8-47 Figure 9-1 Major problems encountered during the transport of international container via rail
from J.N.P. to Delhi..................................................................................................9-7 Figure 9-2 Present Layout of Intermodal Transport from JNPT to Delhi.....................................9-8 Figure 9-3 Restrictions on the Movement of Vehicles in the Urban Area of Delhi ......................9-9 Figure 9-4 Effect of the Solutions (without consideration of DFC)...........................................9-14 Figure 9-5 Tariff Unit Price in 20 and 40 foot Containers.........................................................9-15 Figure 10-1 Proposed Route for Alt.1 ( New Dedicated Freight Corridors).................................10-4 Figure 10-2 Proposed Route for Alt.2 ( New Dedicated Passenger Corridors) ............................10-5 Figure 10-3 Proposed Route for Alt.3 (Improvement of Existing Lines) .....................................10-6 Figure 10-4 Relation between Demand and Line Capacity of ELI Option Case of the Eastern
Corridor ...............................................................................................................10-17 Figure 10-5 Traffic Distribution Pattern of the Eastern Corridor (Unit: Trains/day/direction) ...10-18 Figure 10-6 Relation between Demand and Line Capacity of DPC Option Case of the Eastern
Corridor ...............................................................................................................10-19 Figure 10-7 Relation between Demand and Line Capacity of DFC Option Case of the Eastern
Corridor ...............................................................................................................10-20 Figure 10-8 Western Corridor Comparison figure for line capacity and forecast demand of
ELI.......................................................................................................................10-21 Figure 10-9 Relation between Demand and Line Capacity of DPC Option Case of the Western
Corridor ...............................................................................................................10-22 Figure 10-10 Relation between Demand and Line Capacity of DFC Option Case of the Western
Corridor ...............................................................................................................10-23 Figure 11-1 Locations of DFC Sections for the ESCS..............................................................11-19 Figure 11-2 Noise and Vibration Measurement Sites................................................................11-30 Figure 11-3 Noise and Vibration Measurement Points .............................................................11-31 Figure 11-4 Features by DFC Section ......................................................................................11-34 Figure 11-5 Administrative Structure in India ..........................................................................11-36 Figure 12-1 Comparison of Project Implementation Structure..................................................12-19 Figure 12-2 DMRC Managerial Organization Chart (Construction Stage) ................................12-24 Figure 12-3 GC Managerial Organization Chart.......................................................................12-24

ABBREVIATIONS LIST
The Feasibility Study on The Development of Dedicated Freight Corridor for Delhi-Mumbai and Ludhiana-Sonnagar in India Final Report (Task 0&1)
Abbreviations List i
ABBREVIATIONS LIST
A AAR Association of American Rairoads ABB Air Blast Breaker ABS Absolute Blocking System AC Super high voltage transmission ACD Anti-Collision Device ADB Asian Development Bank ADI Ahmedabad Division ADV Advisior AF Audio Frequency AFTC Audio Frequency Track Circuit AGA Agra AGC Agra Division AII Ajimer Division ALD Allahabad Division AM Additional Member AOH Additional Overhaul AP Andhra Pradesh APSEB Andhra Pradesh State Electricity Board ARE Automatic Air Brake System ARTC Australian Rail Track Corporation ASN Asansol Division AT Auto-transformer ATC Automatic Train Control ATO Automatic Train Operation ATP Automatic Train Protection ATS Automatic Train Stop ATSP Automatic Train Stop Control with Speed Pattern Profile AUG Aurangabad AWR Alwar AxC Adoption of Axle Counter
B BCCL Bharat Coking Coal Limited BCLA Container Wagons with Automatic Couplers BCLB Container Wagons with Fixed Coupler BESCOM Bangalore Electric Supply Company BG Broad Gauge BHEL Bharat Heavy Electrical Limited BKI Bandikui BMA Bangalore Metropolitan Area BMP Bangalore Mahangara Palika (Bangalore City Government) BMRTL Bangalore Mass Rapid Transit Limited BNW Bhiwani
The Feasibility Study on The Development of Dedicated Freight Corridor for Delhi-Mumbai and Ludhiana-Sonnagar in India Final Report (Task 0&1)
Abbreviations List ii
BPAC Block Proving by Axle Counter BPK Billion Passenger Km BRD Baroda BRDA Bangalore Regional Development Authority BSC Base Station Controllers BSS Base Station System BT Booster Transformer, Boosting Transformer BTKM Billion Tonne Km BTS Base Transceiver Station BVH Ballabgarh BWSSB Bangalore Water Supply and Sewerage Board
C CAD Computer Aided Dispatch CAGR Compound Annual Growth Rate CAPEX Capital Expenditure CARG Compound Annual Rate of Growth CAS Collision Avoidance System CCEA Cabinet Committee of Economic Affairs CCGT Combined Cycle Gas Turbine CCH Chinchwad CCI Chamber of Commerce and Industry CCL Central Coalfields Limited CDM Clean Development Mechanism CDMA Code Division Multiple Access CEA Central Electric Authority CERC Central Electricity Regulatory Commission CFA Cash Flow Projection CFS Container Freight Station CL Curve Length CLS Colour Light Signal CLW Chittaranjan Locomotive Works CM Construction Management CMA Chennai Metropolitan Administration CMDA Chennai Metropolitan Development Authority CMR Construction Manager CMS Cast Manganese Steel CMWSSB Chennai Metropolitan Water Supply and Sewerage Board CNB Kanpur CNG Compressed Natural Gas CNOC Consolidated National Operations Center CO2 Carbon Dioxide CONCOR Container Corporation of India Ltd. CPT Chennai Port Trust CR Central Railway Cr. Crore
The Feasibility Study on The Development of Dedicated Freight Corridor for Delhi-Mumbai and Ludhiana-Sonnagar in India Final Report (Task 0&1)
Abbreviations List iii
CRCS Computerized Route Control System CRIS Centre for Railway Information Systems CS Crossing Station CSO Central Statistics Organization CSR Clear Standing Room CTC Centralized Traffic Control System CTCC Centralized Traffic Control Centre CWSS Cauvery Water Supply Scheme
D DB Design & Build DBB/ DBD Design-Bid-Build DBOM Design-Build-Operate-Maintain DCT Double Coupled Train DDR/ DER Dadri DEC Delhi Cantt DFC Dedicated Freight Corridor DFCCIL DFC Corporation of India Ltd. DGPS Differential GPS DH Diamond Harbor DHN Dhanbad DL/ DLI Delhi DLW Diesel Locomotive Works DMRC Delhi Metro Rail Corporation DMRTS Delhi Mass Rapid Transport System DO Dausa DPC Dedicated Passenger Corridor DR Detailed Railway Noise and Vibration Survey DRB Detailed Railway Noise and Vibration Survey at Bridge DRP Detailed Railway Noise and Vibration Survey at Plain Route DSC Double-stack container DSS Double Slip Switch DT Double Track DTMF Dual Tone Multi Frequency DUA Distant Urban Area
E ECL Eastern Coalfields Limited ECR East Central Railway EDI Electric Data Interchange EGNOS European Geostationary Navigation Overlay Service EIA Environmental Impact System EIRENE European Integrated Railway Radio Enhanced Network EIRR Economic Internal Rate of Return EJR East Japan Railway ELI Existing Line Improvement ELL Electric Leveling Luffing EMaP Environmental Management Plan
The Feasibility Study on The Development of Dedicated Freight Corridor for Delhi-Mumbai and Ludhiana-Sonnagar in India Final Report (Task 0&1)
Abbreviations List iv
EMC Electromagnetic Compatibility EMoP Environmental Monitoring Plan ER Eastern Railway ERTMS European Rail Traffic Management System ES Engineering Services ESA European Space Agency ESCS Environment and Social Consideration Study ESIMMS Environmental and Social Impact Mitigation Measures Study ETCS European Train Control System ETSI European Telecommunication Standards Institute EU European Union EUDL Equivalent Uniformly Distributed Load EWG Environmental Working Group
F F/S Feasibility Study FCL Full Container Load FDI Foreign Direct Investment FDMA Frequency Division Multiple Access FIRR Financial Internal Rate of Return FL Formation Level FLP Freight Logistic Park FLS Final Location Survey FO Freight Operations FOIS Freight Operations Information System FS Feasibility Study FSW Friction Stir Welding
G G.Noida Greater Noida GADEROS Galileo Demonstrator for Railway Operation System GAIL Gas Authority of India Limited GAR Guntur GBAS Ground-based Augmentation System GC General Consultants GDP Gross Domestic Product GGC Gangapur City GHz Giga Harzs GIS Geographic Information System GL Ground Level GNSS Global Navigation Satellite Systems GOI Government of India GOJ Government of Japan GOM Government of Maharashtra GPRS General Packet Radio Service GPS Global Positioning System GQ Golden Quadrilateral GSDP Gross State Domestic Product
The Feasibility Study on The Development of Dedicated Freight Corridor for Delhi-Mumbai and Ludhiana-Sonnagar in India Final Report (Task 0&1)
Abbreviations List v
GSDP Gross State Domestic Product GSDPi(y) GSDP of state in the year GSM Global System for Mobile communication GSM-R Global System for Mobile Communication for railway applications GT Gas Turbine GTI Gateway Terminal India GTO Gate Turn Off Thrystor GU Gujarat GZB Ghaziabad
H H.P. Himachal Pradesh ha Hectare HH Head Hardened HLR Home Location Register HO Head Office Hp Horse Power HPGCL Haryana Power Generation Co. Ltd. HSR Hisar HT High Tension HWH Howrah HYC Hydrabad Hz/ Hertz I IA Intersection Angle IBS Intermediate Blocking System IC Independent Consultant IC Inspection C IC Radio Frequency Identity ICCP Information and Community Consultation Programme ICD Inland Container Depot ID Identification IE Independent Engineer IEC Ineternational Electrotechnical Commission IEE Initial Environmental Examination IGBT Insulated Gate Bipolar Transistor IGM Import General Manifest IMO Independent Monitoring Organization IOH Intermediate Overhaul IP Intersection Point IPCC Intergovernmental Panel on Climate Change IPGCL Indraprastha Power Generation Co. Ltd. IR Indian Railways IRR Internal Rate of Return IRR Inner Ring Road ISO International Organization for Standardization ISO International Organization for Standardization
The Feasibility Study on The Development of Dedicated Freight Corridor for Delhi-Mumbai and Ludhiana-Sonnagar in India Final Report (Task 0&1)
Abbreviations List vi
IWT Inland Water Transport J J Yen Japanese Yen J&K Jammu and Kashmir J.N. Port Jawaharlal Nehru Port JAI Jaipur JARTS Japan Railway Technical Service JBIC Japan Bank for International Cooperation JETRO Japan External Trade Organisation JICA Japan International Cooperation Agency JN Junction JNPCT Jawaharlal Nehru Port Container Terminal JNR Japanese National Railways JOD Jodhpur JR Japan Railway JS Junction Station JST JICA Study Team JV Joint Venture
K KBI Knorr-Bremse India KBPS Kilo Bites Per Second KDS Kolkata Dock System KEB Karnataka Electricity Board KoPT Kolkata Port Trust KPCL Karnataka Power Corporation Limited KPR Kanpur KPTCL Karnataka Power Transmission Corporation Limited KRCL Konkan Railway Corporation Ltd KUIDFC Karnataka Urban Infrastructure Development & Finance Corporation KUWS&DB Karnataka Urban Water Supply and Drainage Board
L LCL Less than Container Load LCX Leaky Coaxial Cable Leq Equivalent noise level LNG Liquefied natural Gas lpcd Litre per capita per day LT Low Tension LUD Ludhiana LWR Long Welded Rail
M M Million M.P. Madhya Pradesh MAL Malanpur MARS Multi Access Reservation System MCL Mahanadi Coalfields Limited MDB Moradabad MDP Mandideep MEPZ Madras Export Processing Zone
The Feasibility Study on The Development of Dedicated Freight Corridor for Delhi-Mumbai and Ludhiana-Sonnagar in India Final Report (Task 0&1)
Abbreviations List vii
MGD Million Gallon per Day mld million litre per day MLIT Ministry of Land Infrastructure and Transport, Japan MM Man Months MMD Maximum Moving Dimensions MMRDA Mumbai Metropolitan Regional Development Authority MMU Mobile Maintenance Units MOEF Ministry of Environment and Forest MOF Ministry of Finance MOR Ministry of Railway MOR road Manali Oil Refinery Road (Chennai) MORD Ministry of Rural Devevelopment MOU Memorandum of Understanding MPs/MLAs Member of Paliament/Member of Legislative Assembly MRTS Mass Rapid Transit System MRVC Mumbai Rail Vikas Corporation Ltd. MSC Mobile Switching Center mtpa Million tons per annum MTR Mid-term Rehabilitation MTRC Mobile Train Radio Communication MU Million Unit (=1,000,000kWh) MUL Mulund MUTP Mumbai Urban Transport Project MUX Multiplexer
N NAG Nagpur NATM New Austrian Tunnelling Method NCL Northern Coalfield Limited NCR National Capital Region NDE New Delhi NDP Net Domestic Product NEEPCO North Eastern Electric Power Corporation NER North Eastern Region NESDP National Economic and Social Development Plan NGO Non-Governmental Organization NH National Highway NHAI National Highways Authority of India NHDP National Highways Development Project NHPC National Hydro Power Corporation Limited NMDP National Maritime Development Programme NMPT New Mangalore Port Trust NR Northern Railway NRP National Rehabilitation Plan NRVY National Rail Vikas Yojana NRVY National Rail Vikas Yojana

The Feasibility Study on The Development of Dedicated Freight Corridor for Delhi-Mumbai and Ludhiana-Sonnagar in India Final Report (Task 0&1)
Abbreviations List viii
NSDP Net State Domestic Product NSICT Nhava Sheva International Container Terminal NTKM net tonne km NTPC National Thermal Power Corporation NTPC National Thermal Power Plant Co. Ltd. NWR North Western Railway
O OFC Optical fiber cable ONGC Oil and Natural Gas Corporation Ltd.
P PAF Project Affected Family PAP Project Affected People PB Performance Bond PCM Pulse Code Modulation PESB Public Enterprise Selecting Board PETS Preliminary Engineering cum Traffic Study PIT Pitampur pkm Passenger Kilometer PLF Power Load Factor POH Periodical Overhaul POL Petroleum-Oil-Liquid PPP Public Private Partnership PPTA Project Preparatory Technical Assistance PPTA Project Preparatory Technical Assistance PSC Prestressed Concrete PSEB Punjab State Electricity Board PSU Public Sector Undertaking PWD Public Works Department
R R&M Renovation and Modernization RAP Resettlement Action Plan RC Reinforced Concrete RDSO Research Designs and Standards Organization REW Rewari RITES Rail India Technical and Economic Services RL Rail Level RLMS Rural Load Management System RMG Railed Mounted Gantry Crane ROB Road Over Bridge ROBs Road Over Bridges ROH Routine Overhaul ROW Right-of-Way RRD Ravtha Road RRP Framework of Resettlement and Rehabilitation Plan RRR Reinforced Rail Road RS Railway Station Rs. Indian Rupees

The Feasibility Study on The Development of Dedicated Freight Corridor for Delhi-Mumbai and Ludhiana-Sonnagar in India Final Report (Task 0&1)
Abbreviations List ix
RTK Real Time Kinematics RTRI Railway Technical Research Institute RUB Road Under Bridge RVNL Rail Vikas Nigam Limited. RWF Railway Wheel Factory
S SBAS Satellite-based Augmentation System SBI Sanarmati SC Schedule Castes SCADA Supervisory Control And Data Acquisition SDH Synchronous Digital Hierarchy SEBs State Electricity Boards SECL South East Central Coalfield Limited SERCs States Electricity Regulatory Commission SEZ Special Economic Zone SGC State Grievance Committee SGSN Serving GPRS Support Node SH State Highways SIPCOT State Industries Promotion Corporation of Tamil Nadu Ltd. SMTP Sub-Manifest Transshipment Permit SOD Schedule of Dimensions SP Section Post SPAD Signal Passed at Danger SPART Self-propelled Accident Relief Trains SPCM/ID-PAF Stakeholder/Public Consultation Meeting and Identification of PAFS SPURT Self Propelled Ultrasonic Rail Testing SPV Special Purpose Vehicle SR Sensitive Receptor SRSF Special Railway Safety Fund SRTUs State Road Transport Undertakings SSC Single Stacked Container SSI Solid State Interlocking SSS Single Slip Switch ST Schedule Tribes sta. Station STEP Special Terms for Economic Partnership STM Synchronous Transfer Mode Stn Station SVN Space Vehicle Number
T TA Technical Assistance TAC Track Access Charge TCI Transport Corporation of India TCL Transitional Curve Length TERI The Energy and Resources Institute TETRA Terrestrial Trunked Radio

The Feasibility Study on The Development of Dedicated Freight Corridor for Delhi-Mumbai and Ludhiana-Sonnagar in India Final Report (Task 0&1)
Abbreviations List x
TEU Twenty feet equivalent unit TKD Tughlakabad tkm Track Kilometer TLD Track Loading Density TMCP Thermo-Mechanical Control Process TMG Tire Mounted Gantry Crane TNEB Tamil Nadu Electricity Board TNRDC Tamil Nadu Road Development Corporation TOR Terms of Reference tpa Tons per annum TPP Thiruvottiyur Ponneri Panchetti TPWS Train Protection and Warning System TS Terminal Station TSS Traction Substation TU Transport Units (tkm+pkm) TVU Train Vehicle Unit TWS Thick Web Switches TWS&DB Tamil Nadu Water Supply and Drainage Board
U U.P. Uttar Pradesh UFW Unaccounted for water UIC Union Internationale Chemins de Fer ULBs Urban Local Bodies UP Unit Price UPRVUNL Uttar Pradesh Rajya Vidyut Utpadan Nigam Ltd. UrEDAS Urgent Earthquake Detection and Alarm System UTS Ultimate Tensile Strength
V VCB Vacuum Circuit Breaker VCL Vertical Curve Length VK Vakkadu VRRC Village Resettlement and Rehabilitation Committee V-SAT Very Small Aperture Terminal VTMS Vessel Traffic Management System
W WB World Bank WCL Western Coalfield Limited WCR West Central Railway WDM Wave Division Muyltiplexing WLC With line capacity WOL without the maintenance interval WR Western Railway
CHAPTER 1 INTRODUCTION
The Feasibility Study on the Development of Dedicated Freight Corridor for Delhi-Mumbai and Ludhiana-Sonnagar in India Final Report (Task 0&1)
Chapter 1 1-1
CHAPTER 1 INTRODUCTION
Corridors which connect major urban centers of Mumbai, Delhi, Kolkata and Chennai are called as “Golden Quadrilateral”. The corridors are placed as the most important and indispensable corridors for economic growth of India. Railway transport has been playing an important role along the corridors in the land transport market. However, now, the task of drastic expansion of railway transport capacity in India has become the most important and urgent, because the existing railway transport system can not catch up with the increased demand which has been derived from recent rapid economic growth of India. Direction to attain the task was discussed at the Japan-India Summit Meeting in Delhi in April 2005, and “the two sides shared the view that Japan’s Special Terms for Economic Partnership (STEP) Scheme could be one of the effective means for carrying out large-scale priority projects in infrastructure sector in India. The two sides confirmed their intention to examine the feasibility of proposals for dedicated multimodal high-axle load freight corridors with computerized train control system on Mumbai-Delhi and Delhi-Howrah routes utilizing STEP Scheme and with the inputs of Japanese technology and expertise”. In July 2005, Government of India (hereinafter referred to as “GOI”) officially requested Government of Japan (hereinafter referred to as “GOJ”) for the execution of Japan’s technical cooperation to assess the feasibility on the development of dedicated multimodal high-axle load freight corridors with computerized control for Delhi-Mumbai and Delhi-Howrah in India (hereinafter referred to as “The Project”).
In response to the request from the GOI, in October 2005, Japan International Cooperation Agency (hereinafter referred to as “JICA”) dispatched the contact mission to collect and analyze necessary information for the Project. Based on the result of the preliminary study, in November 2005, GOJ decided to conduct “the feasibility study on the development of multimodal high axle load freight corridor with computerized control for Delhi-Mumbai and Delhi-Howrah” (hereinafter referred to as “the Study”). In February 2006, JICA dispatched preparatory study team, and the Scope of Work of the Study and the Minutes of Meeting were signed and exchanged between MOR and JICA.
In June 2006, JICA dispatched the Study Team to India for the Study for commencement of the site survey. Study area of the Study is as below, which is confirmed in S/W between the GOJ and GOI.
1) DFC Western Corridor: Jawaharlal Nehru Port Terminal (JNPT) - Dadri, Tuglakabad ICD including branch lines
2) DFC Eastern Corridor: Sonnagar – Dhandarikalan (Ludhiana), Khurja – Dadri including branch lines
The GOI decided to extend the DFC Eastern Corridor from Sonnagar to a planned deep seaport in Kolkata area. MOR and the Study Team had a series of discussion to include the extended section into the Study. However, the section was excluded from the Study, since location of the deep seaport in the Kolkata area was not decided within the Study period.
The Study consists of the following 3 tasks.
1) Task 0 : Base-line Survey for Railway Transport Capacity Development 2) Task 1: Justification of the Construction of the New Freight Corridor 3) Task 2: Feasibility Study on the Dedicated Freight Corridor Project
The Study Team has finished all the tasks mentioned above and compiled the results as the Final Report. This report provides all results of Task 0 and 1 among the above three Tasks.
The Feasibility Study on the Development of Dedicated Freight Corridor for Delhi-Mumbai and Ludhiana-Sonnagar in India Final Report (Task 0&1)
Chapter 1 1-2
The Final Report not only integrates the following reports which were submitted to GOI in the past but also reflects valuable comments on the report made by concerned personnel.
Jun. 2006 Inception Report : Explanation of policies of the Study
Sep. 2006 Progress Report 1 : All items of the Task 0 with Study policies on Task 1
Dec. 2006 Interim Report 1 : All items of the Task 0 with parts of Task 1
Mar. 2007 Progress Report 2 : All items of the Task 0 and 1 with Study policies on Task 2
Jul. 2007 Interim Report 2 : All items of the Task 0 and 1 with parts of Task 2
Sep. 2007 Draft Final Report : All Study results of Task 0, 1 and 2
The Study reviewed the feasibility study on DFC development between Delhi – Mumbai and Delhi – Howrah, i.e. “Preliminary Engineering-cum-Traffic Study (PETS)”, conducted by Indian side (by RITES Ltd.). In addition to this, the Study complemented important items which international financing organizations needs for their project evaluation when financial assistance is requested. These items shown below are lacking in the RITES report.
i) Evaluation of feasibility of the DFC as an optimum alternative (Task 1)
ii) Comparison of major technology options concerned to DFC
iii) Social and environmental consideration study
iv) Study on organization/institution and financial plan of DFC
v) Study on Intermodal transport and facilities
vi) Comprehensive evaluation of the Project
It is needless to say that items from i) to iv) and vi) are generally necessary to apply financial assistance request to international financing organizations. The v) is an item which should be duly studied in this Project in particular. It should be emphasized that the new freight railway line contributes to only a part, though it is the most important, of the whole corridor transport system. In other words, the new freight railway line only is not able to complete the necessary freight transport service by itself. Intermodal services to supplement the railway service, such as developments of ports, inland container depot (ICD), access road railway feeder lines, are absolutely indispensable. This means the DFC investment would not be effective enough, if the proper intermodal service is not developed simultaneously.
The Study Team made a detailed study and proposed necessary conditions to synchronize the DFC development on the provision of intermodal facilities and services putting stress on the Western Corridor, where the intermodal function of the new railway service would be critical.
As mentioned before, this report shows the Task 0 and 1 study results. The Feasibility study results on the new freight railway (Task 2) is compiled in Volume 3.
The following is the list of volumes consisting the Final Report, which covers all the Study results.
The Feasibility Study on the Development of Dedicated Freight Corridor for Delhi-Mumbai and Ludhiana-Sonnagar in India Final Report (Task 0&1)
Chapter 1 1-3
Volume 1 : Executive Summary
Volume 2 : Main Report (Task 0 & 1)
Volume 3 : Main Report (Task 2)
Volume 4 : Annex 1 Technical Working Papers
Volume 5 : Annex 2 Preliminary Design Drawings
Furthermore, this Final Report was prepared based on the comments received on October 17th 2007 from the Ministry of Railways (MOR) on the Draft Final Report that was submitted to the MOR on September 18th 2007.
Finally, it should be mentioned that a report entitled “Study on Development of Intermodal Freight Transport Strategy – Final Report -”, JICA, March 2007, which was studied and submitted by the Intermodal Research Unit of the Study Team, and that studies on intermodal development and project evaluation in this report are completed by utilizing the results of the above report.
CHAPTER 2 CURRENT CONDITION AND ISSUES
PERTAINING TO THE TRANPOSRT SECTOR SCENARIO IN INDIA
The Feasibility Study on The Development of Dedicated Freight Corridor for Delhi-Mumbai and Ludhiana-Sonnagar in India Final Report (Task 0&1)
Chapter 2 2-1
CHAPTER 2 CURRENT CONDITION AND ISSUES PERTAINING TO THE TRANSPORT SECTOR SCENARIO IN INDIA
2.1 INTRODUCTION
This section clarifies the current condition for the entire transport network in India, including the present position of railways in that network and the issues that will be faced by them in the future.
To investigate this, a summary of the current scenario of Indian Railways is presented and then viewed from the standpoint of national transport plans, such as the 10th 5-Year Plan, and the results of various other studies and investigations that have been presented till now. After that, the role of road, air and rail in domestic transport will be viewed in terms of passenger and freight transport sectors. And then Indian Railways will be compared with railroads in other countries with large land masses to reinforce its gigantic scale. Then the conditions found in the various types of transport sectors in the region along the DFC will be presented.
This chapter will show the reciprocal relationship of these transportation sectors and the perceived changes in the role of Railways. The following is a summary of the conclusions in this section.
(1) Issues and Directions in Transport Sector of India
To further transport infrastructure development: Delay in development of transport infrastructure is a serious obstruction to the economic growth in India. It is necessary to make extensive investments in transport infrastructure.
To establish a cost efficient system for long distance transport: Delhi and its surrounding areas are located far from seaports. It is necessary to reduce transport cost for the long distance transport in order to promote foreign trade.
To improve quality of service: The quality of service is still low even though freight rates and passenger fares are low. It is necessary to improve the quality of transport services in order to satisfy the ever-increasing demand by providing higher quality services.
To balance economic viability and social needs: Poverty alleviation, balanced regional development, and other social restructures are important issues of India. It is necessary to provide adequate transport means for poor people and to develop rural road networks.
To control environmental load: With increasing income level, India increases energy consumption and vehicle emissions, and this trend will continue. It is necessary to formulate an environmental friendly transport system.
(2) Issues and Directions in Freight Distribution System of India
To improve efficiency of inter-modal facilities: Unending time spending at inter-modal terminals such as transhipment facilities in seaports and ICDs cause time and money losses. It is necessary to reduce time spending and to speed up handling at inter-modal facilities.
To simplify procedures of freight transport: It is necessary to reduce time and money spending for export and import, checkpoint procedures, and other freight transport procedures.

The Feasibility Study on The Development of Dedicated Freight Corridor for Delhi-Mumbai and Ludhiana-Sonnagar in India Final Report (Task 0&1)
Chapter 2 2-2
To improve road network around inter-modal facilities: Congestion around inter-modal terminals is very heavy and causes delays in freight transport. It is necessary to reduce the traffic congestion.
To encourage inter-modal transport: In order to save economic cost of freight transport and to reduce environmental load, it is necessary to promote an inter-modal transport concept in the sector.
To modernize vehicle fleets and freight transport facilities: It is necessary to modernise truck terminals and warehouses, and to introduce 3-axle rigid trucks and tractor- trailer trucks instead of 2-axle rigid trucks, identify relevant trucks, and other modern trucks for efficient on-land freight transport.
To reform freight industry: Trucking industry in India is not necessarily reliable. Most of the operators are classified into unorganised sector, and are suffering low profit in high competitive market. On the other hand, freight container transport by rail is monopolised by CONCOR with high freight rates. It is necessary to encourage adequate competitive market and reliable enterprises in the Indian freight transport market.
(3) Role of Railways in the transport sector in India
- Indian Railways, which were built much before improvement of roadways, form a vast domestic network within India. The railway is a core transportation organization in this vast country.
- While share held by the railway has declined in recent years due to improvements in roadways, the role that the railway is playing in the current dramatic economic growth remains large and the traffic volume for both passenger and freight sectors continues to grow year after year.
- Usage of shipment is so limited in India continental land that the role of railway being eco-friendly, having large volume capacity needs to be quite high.
- As the safety and punctuality of railway transport is better than that of road transport, increase of the share of railway transportation is expected to enlarge.
- On a railway that is newly constructed or improved, large capacity and high speed can be provided. Modernization of equipment of sidings at ports, mines and factories will result in effective and economical transport. It is expected to contribute significantly to the expansion of Indian economy.
(4) Issues to be addressed by Indian Railways
- The increase in the number of trains corresponding to the increasing demand has nearly reached to its limit of transport capacity under the current infrastructure. Indian Railways must remove these barriers to grow, so that it can proactively respond to this demand and take on the increase in freight and passenger transport demand.
- A comparison of the freight rates in India with those in other countries shows that they are exceptionally high. There is a need to find out a fare structure that meets the railway transport cost and yet is in range with the fares of other modes of transport.
- The concept of setting train schedules is being established when the traffic volume corresponds to one trainload between origin and destination for both passenger and
The Feasibility Study on The Development of Dedicated Freight Corridor for Delhi-Mumbai and Ludhiana-Sonnagar in India Final Report (Task 0&1)
Chapter 2 2-3
freight trains. In future, there will be need to operate trains with attention to the need of the users, such as user-friendly train operation.
- Freight transport compatible with modern manufacturing systems need to be able to provide information about when the freight will arrive at their destination.
- The management of railway is required to provide proper service according to the requirement of the market, though there are difficulties in improving the operating system of the railways.
- Railway is required to be not only the public transport means for common use and social development, but also a financially balanced transport service organ with efficient operation.
2.2 SUMMARY OF RAIL TRANSPORT IN INDIA AND THE NATIONAL TRANSPORT IMPROVEMENT PLAN
2.2.1 Summary of Track System of the Indian Railways
With some 62,000 km of tracks, Indian Railways has one of the largest rail networks in the world. This network is a mixture of broad gauge, meter gauge and narrow gauge lines due to the differences in application and the entity that had been in charge of the construction. Some 75% of the network is broad gauge (1.676m) and there is an ongoing effort to standardize the other sections to broad gauge.
Among the main trunk lines that form the “Golden Quadrilateral", which links the four major metropolitan cities, some of them are being converted into double-track electrified lines. This includes the sections between Delhi and Mumbai, Delhi and Kolkata and Delhi and Chennai. The line toward the south from Mumbai remains a single-track, non-electrified route.
Some 24% of the entire route is electrified. However, as of 2005, there is a total of 10 million horsepower by diesel locomotives being used in comparison to 13 million horsepower by electric locomotives, showing that the traffic capacity by electric operation has already been growing. There are even a few steam locomotives remaining.
The railway is under the jurisdiction of the Ministry of Railways. The entire railway system has been divided into 16 zonal railways that are controlled by the Railway Board of the Railway Ministry in Delhi. As of June 2005, this rail system employed 1.47 million people.
The 2002 Status Paper stated that there are 473 million tons of freight and 4,833 million passengers transported annually. This results in 233 billion rupees of freight revenue and 105 billion rupees in passenger revenue. Key expenditures include 188 billion rupees for personnel, 108 billion for fuel and 30 billion for leasing fees.
Most of the freight transported is bulk items, of which 89% of the volume transported comes from coal, fertilizer, cement, limestone, grain, iron and iron ore. However, towards the end of the twentieth century other forms of transportation, such as overland trucking, pipelines and domestic ocean freight, took over some of the transport commodities such as cement, fertilizer and iron. This has been reason of declining railway share.
Some 60% of all passengers come from the four main cities of Delhi, Kolkata, Chennai and Mumbai. 27% of these are long-distance passengers. However, in terms of passenger kilometers, passenger transport in urban regions does even reach 20%. And the passenger

The Feasibility Study on The Development of Dedicated Freight Corridor for Delhi-Mumbai and Ludhiana-Sonnagar in India Final Report (Task 0&1)
Chapter 2 2-4
income for this 20% comes from the fares charged to the first class traveling passengers, which is less than 1% of the total passengers.
While accidents are on the decline, on an average there are some 20 collisions and 300 derailments per year along with several cases of on board train fires. This causes deaths of dozens of passengers.
2.2.2 The Rail Improvement Plan in the National Improvement Plan
According to “India’s Transport Sector, 2002” by the World Bank Report, the current situation of India’s transport sector is as follows. Twenty-five percent of national and state highways are congested. Truck and bus speeds averages only 30-40 km per hour. All high- density rail corridors face severe capacity constraints. In Mumbai and other metropolitan cities, overcrowding during peak hours is common in commuter trains and buses.” “In India, the major economic centers are not linked by expressways. Most national highways are two-lane or less; only 3,000 km are four-lane.” “Poor transport services impact the Indian economy —and Indian society in general—in a number of direct and indirect ways. An enormous amount of time, and therefore money, is wasted because of the inefficient movement of people and goods.”
The tenth five-year plan targets a sustainable annual economic growth in the 8% range, but the insufficient economic infrastructure for roads, railways and other forms of transport is hampering the attainment of this goal. This same plan also shows an energy policy that calls for the rationalization of coal transport by rail and the shifting of the transport of coal by road to ships and railways.
Table 2-1 Main Infrastructure Investment Targets in the 10th 5-Year Plan
Roadways A 2,000 km extension of national roadways. The construction of 5,846 km of trunk roads for the Golden Quadrilateral. The construction of 7,300 km of regional-national roadways.
Railways Providing 52,000 km of rail improvements over a broad area. Ports Increasing the volume of freight handled at the main ports from 289 to 415 million tons.
The following is a brief summary of the key policy items of the Plan related to railways.
- Re-evaluation of the rigid railway fees that is not appropriate for a market economy.
- Returning freight transport to Railways to counter the recent trend towards road transport in consideration of environmental issues such as exhaust fumes.
- Increasing the operating efficiency and reducing the operating expenses of the national railway which has become a gigantic organization with role of providing both the social functions for commuting in urban areas, low-cost transport for daily necessities and the commercial services for high quality transport.
The items for investment related to railways are as follows:
1) Building a stronger high-density network. 2) Increasing the transport speed by making operations more efficient. 3) Using information technology to respond to customers. 4) Using the Special Safety Fund to improve safety by replacing facilities that have
exceeded their life span. 5) Reducing energy costs by purchasing energy from centralized or cogeneration plants.
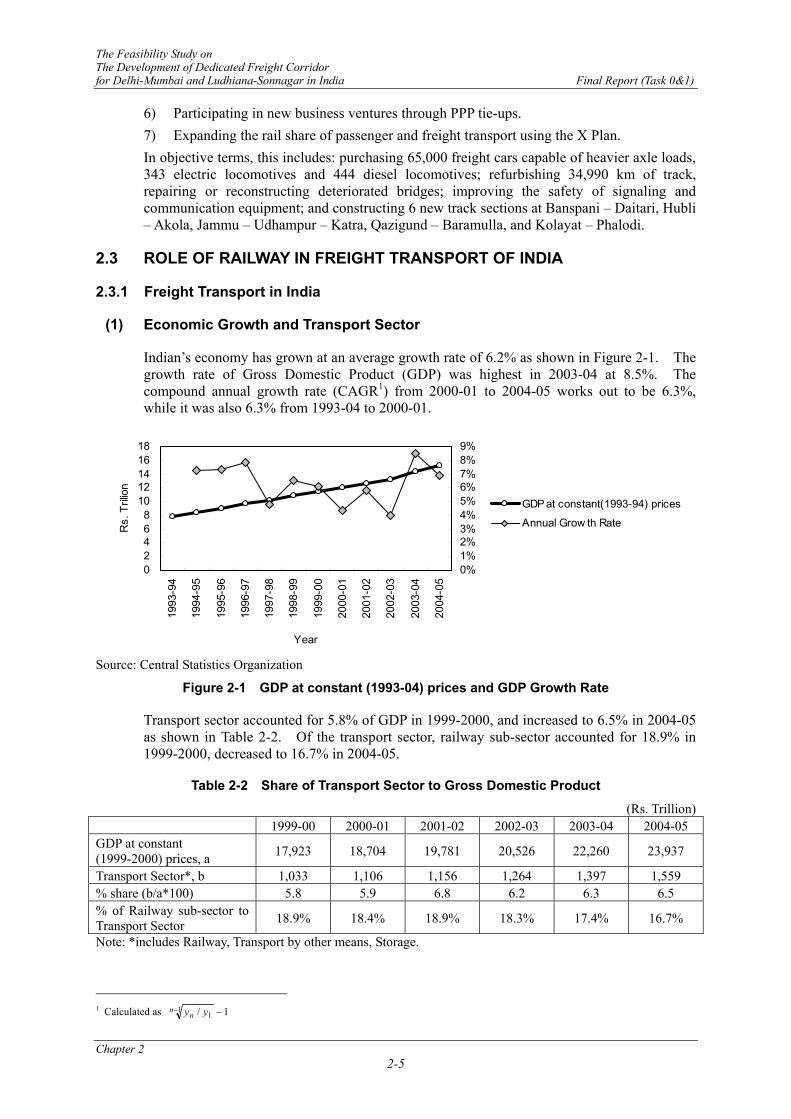
The Feasibility Study on The Development of Dedicated Freight Corridor for Delhi-Mumbai and Ludhiana-Sonnagar in India Final Report (Task 0&1)
Chapter 2 2-5
6) Participating in new business ventures through PPP tie-ups. 7) Expanding the rail share of passenger and freight transport using the X Plan. In objective terms, this includes: purchasing 65,000 freight cars capable of heavier axle loads, 343 electric locomotives and 444 diesel locomotives; refurbishing 34,990 km of track, repairing or reconstructing deteriorated bridges; improving the safety of signaling and communication equipment; and constructing 6 new track sections at Banspani – Daitari, Hubli – Akola, Jammu – Udhampur – Katra, Qazigund – Baramulla, and Kolayat – Phalodi.
2.3 ROLE OF RAILWAY IN FREIGHT TRANSPORT OF INDIA
2.3.1 Freight Transport in India
(1) Economic Growth and Transport Sector
Indian’s economy has grown at an average growth rate of 6.2% as shown in Figure 2-1. The growth rate of Gross Domestic Product (GDP) was highest in 2003-04 at 8.5%. The compound annual growth rate (CAGR1) from 2000-01 to 2004-05 works out to be 6.3%, while it was also 6.3% from 1993-04 to 2000-01.
02468
1012141618
1993
-94
1994
-95
1995
-96
1996
-97
1997
-98
1998
-99
1999
-00
2000
-01
2001
-02
2002
-03
2003
-04
2004
-05
Year
Rs.
Tril
ion
0%1%2%3%4%5%6%7%8%9%
GDP at constant(1993-94) prices
Annual Grow th Rate
Source: Central Statistics Organization
Figure 2-1 GDP at constant (1993-04) prices and GDP Growth Rate
Transport sector accounted for 5.8% of GDP in 1999-2000, and increased to 6.5% in 2004-05 as shown in Table 2-2. Of the transport sector, railway sub-sector accounted for 18.9% in 1999-2000, decreased to 16.7% in 2004-05.
Table 2-2 Share of Transport Sector to Gross Domestic Product
(Rs. Trillion) 1999-00 2000-01 2001-02 2002-03 2003-04 2004-05 GDP at constant (1999-2000) prices, a 17,923 18,704 19,781 20,526 22,260 23,937
Transport Sector*, b 1,033 1,106 1,156 1,264 1,397 1,559 % share (b/a*100) 5.8 5.9 6.8 6.2 6.3 6.5 % of Railway sub-sector to Transport Sector 18.9% 18.4% 18.9% 18.3% 17.4% 16.7%
Note: *includes Railway, Transport by other means, Storage.
1 Calculated as 1/1
1 −−nn yy
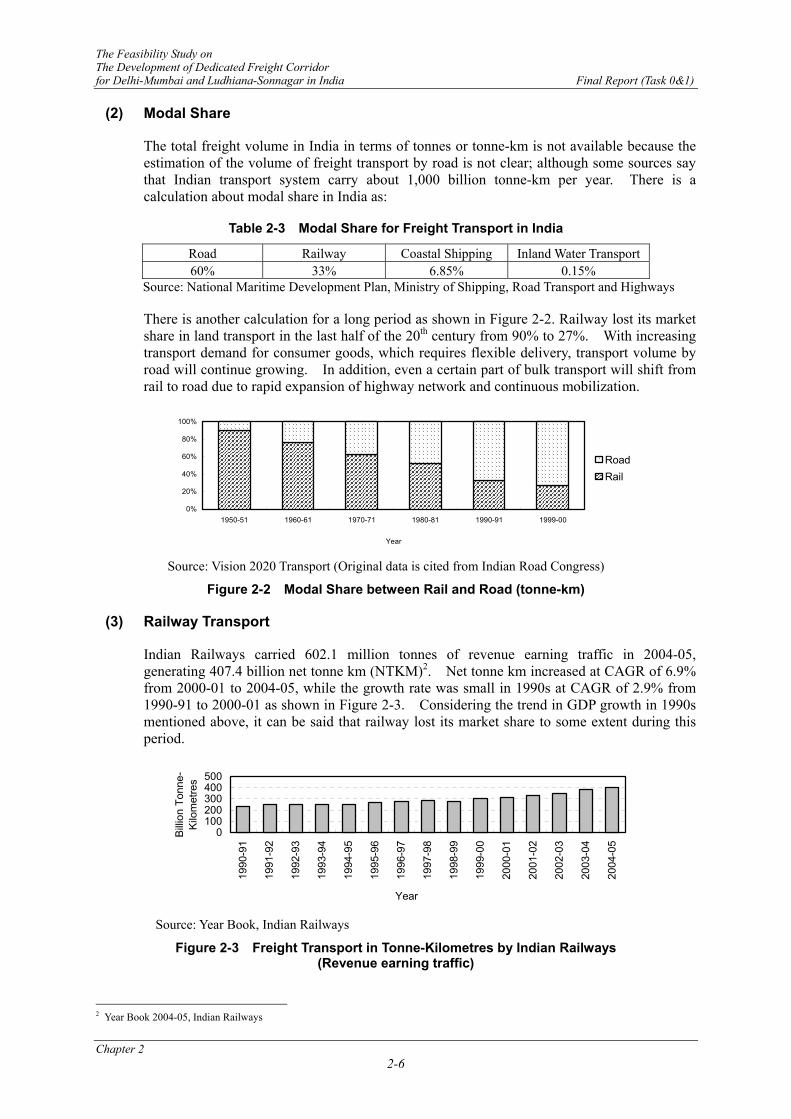
The Feasibility Study on The Development of Dedicated Freight Corridor for Delhi-Mumbai and Ludhiana-Sonnagar in India Final Report (Task 0&1)
Chapter 2 2-6
(2) Modal Share
The total freight volume in India in terms of tonnes or tonne-km is not available because the estimation of the volume of freight transport by road is not clear; although some sources say that Indian transport system carry about 1,000 billion tonne-km per year. There is a calculation about modal share in India as:
Table 2-3 Modal Share for Freight Transport in India
Road Railway Coastal Shipping Inland Water Transport 60% 33% 6.85% 0.15%
Source: National Maritime Development Plan, Ministry of Shipping, Road Transport and Highways
There is another calculation for a long period as shown in Figure 2-2. Railway lost its market share in land transport in the last half of the 20th century from 90% to 27%. With increasing transport demand for consumer goods, which requires flexible delivery, transport volume by road will continue growing. In addition, even a certain part of bulk transport will shift from rail to road due to rapid expansion of highway network and continuous mobilization.
0%
20%
40%
60%
80%
100%
1950-51 1960-61 1970-71 1980-81 1990-91 1999-00
Year
RoadRail
Source: Vision 2020 Transport (Original data is cited from Indian Road Congress)
Figure 2-2 Modal Share between Rail and Road (tonne-km)
(3) Railway Transport
Indian Railways carried 602.1 million tonnes of revenue earning traffic in 2004-05, generating 407.4 billion net tonne km (NTKM)2. Net tonne km increased at CAGR of 6.9% from 2000-01 to 2004-05, while the growth rate was small in 1990s at CAGR of 2.9% from 1990-91 to 2000-01 as shown in Figure 2-3. Considering the trend in GDP growth in 1990s mentioned above, it can be said that railway lost its market share to some extent during this period.
0100200300400500
1990
-91
1991
-92
1992
-93
1993
-94
1994
-95
1995
-96
1996
-97
1997
-98
1998
-99
1999
-00
2000
-01
2001
-02
2002
-03
2003
-04
2004
-05
Year
Billi
on T
onne
-K
ilom
etre
s
Source: Year Book, Indian Railways
Figure 2-3 Freight Transport in Tonne-Kilometres by Indian Railways (Revenue earning traffic)
2 Year Book 2004-05, Indian Railways
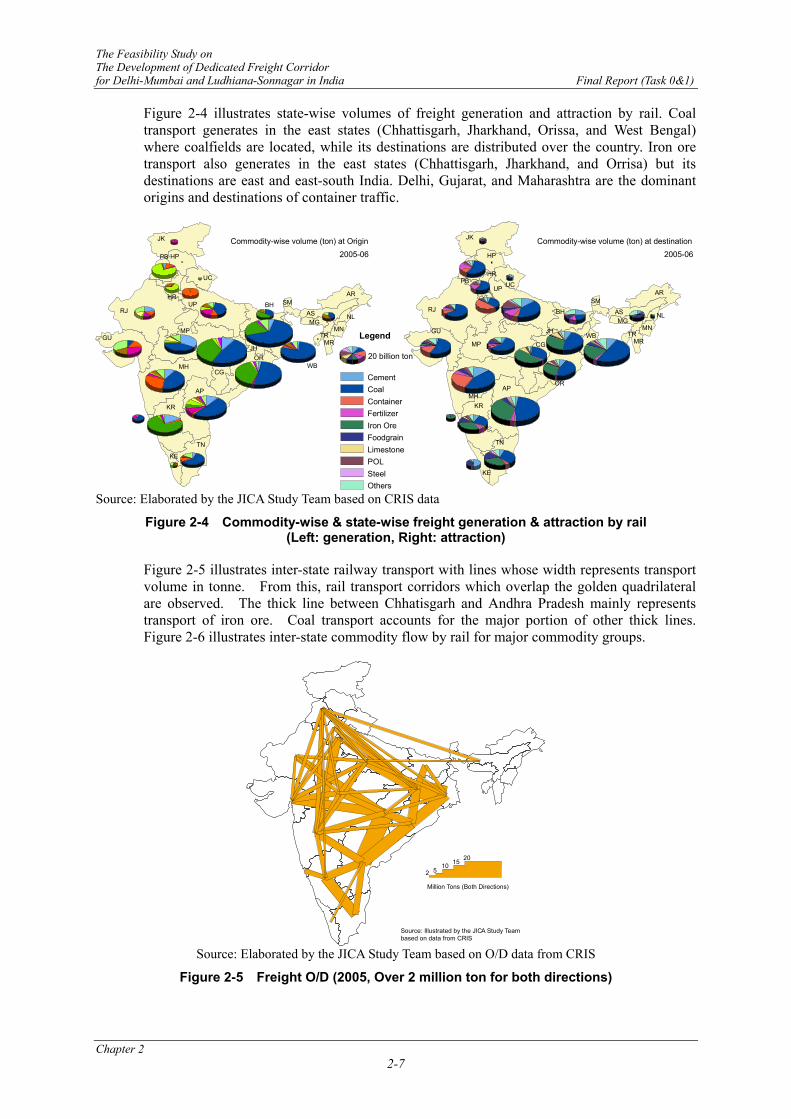
The Feasibility Study on The Development of Dedicated Freight Corridor for Delhi-Mumbai and Ludhiana-Sonnagar in India Final Report (Task 0&1)
Chapter 2 2-7
Figure 2-4 illustrates state-wise volumes of freight generation and attraction by rail. Coal transport generates in the east states (Chhattisgarh, Jharkhand, Orissa, and West Bengal) where coalfields are located, while its destinations are distributed over the country. Iron ore transport also generates in the east states (Chhattisgarh, Jharkhand, and Orrisa) but its destinations are east and east-south India. Delhi, Gujarat, and Maharashtra are the dominant origins and destinations of container traffic.
Commodity-wise volume (ton) at destination2005-06
RJ
MP
AP
UP
JK
KR
CG
AR
AS
MH
GU
OR
TN
BH
JHWB
HP
PB UC
HR
KE
MGMN
MR
NL
TR
SM
Legend
CementCoalContainerFertilizerIron OreFoodgrainLimestonePOLSteelOthers
20 billion ton
Commodity-wise volume (ton) at Origin2005-06
RJ
MP
AP
MH
UP
JK
KR
GU
TN
CG
BH
JH
AR
AS
HP
ORWB
PB
UC
HR
KE
MGMN
MR
NL
TR
SM
Source: Elaborated by the JICA Study Team based on CRIS data
Figure 2-4 Commodity-wise & state-wise freight generation & attraction by rail (Left: generation, Right: attraction)
Figure 2-5 illustrates inter-state railway transport with lines whose width represents transport volume in tonne. From this, rail transport corridors which overlap the golden quadrilateral are observed. The thick line between Chhatisgarh and Andhra Pradesh mainly represents transport of iron ore. Coal transport accounts for the major portion of other thick lines. Figure 2-6 illustrates inter-state commodity flow by rail for major commodity groups.
20151052
Million Tons (Both Directions)
Source: Illustrated by the JICA Study Teambased on data from CRIS
Source: Elaborated by the JICA Study Team based on O/D data from CRIS
Figure 2-5 Freight O/D (2005, Over 2 million ton for both directions)
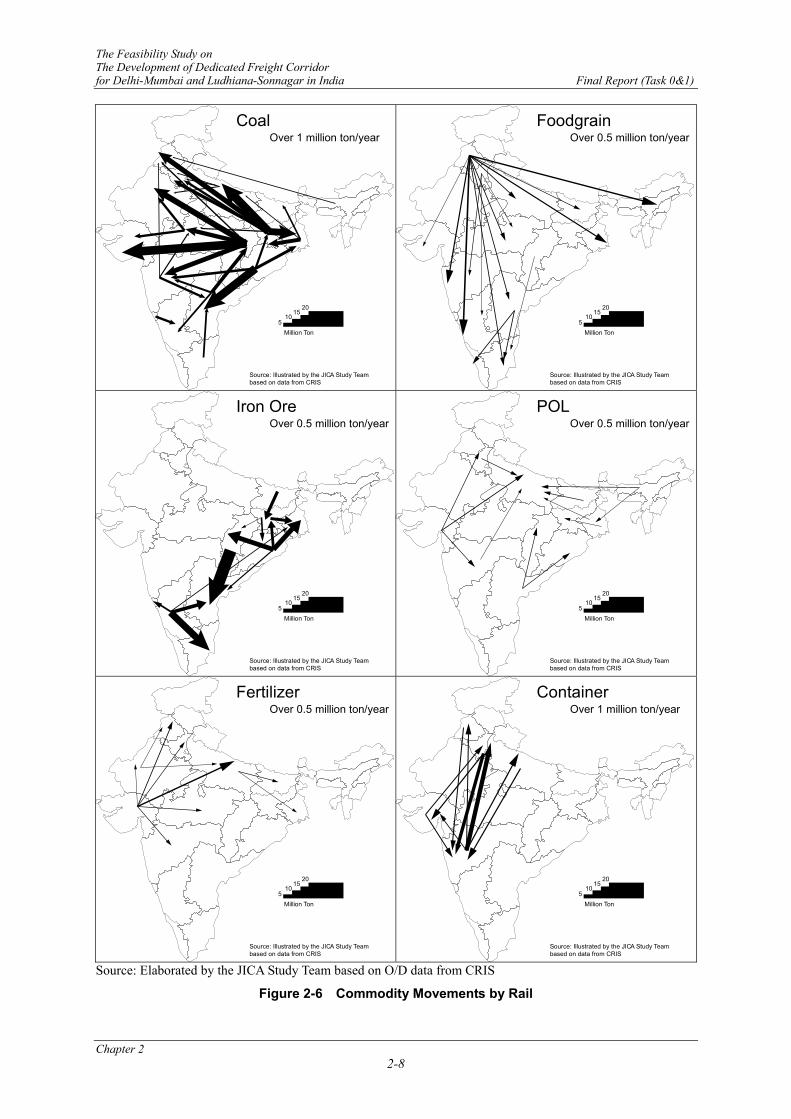
The Feasibility Study on The Development of Dedicated Freight Corridor for Delhi-Mumbai and Ludhiana-Sonnagar in India Final Report (Task 0&1)
Chapter 2 2-8
Million Ton5
1015
20
Source: Illustrated by the JICA Study Teambased on data from CRIS
CoalOver 1 million ton/year
Million Ton5
1015
20
Source: Illustrated by the JICA Study Teambased on data from CRIS
FoodgrainOver 0.5 million ton/year
Million Ton5
1015
20
Source: Illustrated by the JICA Study Teambased on data from CRIS
Iron OreOver 0.5 million ton/year
Million Ton5
1015
20
Source: Illustrated by the JICA Study Teambased on data from CRIS
POLOver 0.5 million ton/year
Million Ton5
1015
20
Source: Illustrated by the JICA Study Teambased on data from CRIS
FertilizerOver 0.5 million ton/year
Million Ton5
1015
20
Source: Illustrated by the JICA Study Teambased on data from CRIS
ContainerOver 1 million ton/year
Source: Elaborated by the JICA Study Team based on O/D data from CRIS
Figure 2-6 Commodity Movements by Rail

The Feasibility Study on The Development of Dedicated Freight Corridor for Delhi-Mumbai and Ludhiana-Sonnagar in India Final Report (Task 0&1)
Chapter 2 2-9
(4) Road Transport
Past trend of road transport volume in recent years is not available. There are several estimations of freight traffic by road in tonne-kilometres for a recent year, varying from 520 billion tonne km (BTKM) to 1,100 BTKM as shown in Table 2-4. Economic Survey mentions that Indian roads carry 70% of the freight traffic in the country.
Table 2-4 Estimation of Tonne-Kilometres by Road for Year 2000
10th Five Year Plan Road India*1 National Maritime Development Plan
Fact Sheet, Press Information Bureau
520 BTKM (1999-00) 1,100 BTKM (2000) 600-650 BTKM 1,136 BTKM (2001) Note: These sources indicate the figure for tonne-km in 1950-51 as 6 BTKM *1 Department of Industrial Policy & Promotion Ministry of Commerce & Industry
Trucking Industry
According to World Bank3, freight transport by road in India increased at an annual average growth rate of 12% in 1990s. The number of goods vehicles was 3.5 million in 2003 (as of 31st March) 4. It increased at a CAGR of 8.2% in 1990s and a CAGR of 8.3% from 2000 to 2003.
The trucking industry in India is competitive in freight transport sector, offering very low rates. On the other hand, profit is so small in competitive market with low rates that service quality tends to be very poor. Travel speed is relatively slow. For example, it takes three days between Delhi – Mumbai (1,400 km). Administrative check at state borders is one of the factors for delay.
Owner operators in the trucking service are in majority, and the size of their enterprises is generally small. According to Transport Corporation of India (TCI), one of the largest trucking companies in India, unorganised sector5 accounts for 86% of the entire road freight market.
The major vehicle types are 2 and 3 axle rigid trucks with low cubic capacity. Trucks on Indian roads are generally old with out-dated technology.
Infrastructure
It is often mentioned that road network of India is insufficient and this is a potential obstacle to economic growth, although Indian road network of 3.34 million km is second largest in the world. The length of expressway is only 200km, while that of National Highways is 66,590 km as shown in Table 2-5. Four or more lane-roads account for 12% of the total length of National Highways.
Table 2-5 Length of Roads by Category
Expressway National Highways State Highways Major District Roads
Rural and Other Roads
200 km 66,590 km 128,000 km 470,000 km 2,650,000 km Source: Road Sector On Fast Track, Ministry of Shipping, Road Transport & Highways
3 India’s Transport Sector: The Challenges Ahead, May 10, 2002 4 Ministry of Shipping, Road Transport & Highways 5 Individual or enterprises less than 10 employees

The Feasibility Study on The Development of Dedicated Freight Corridor for Delhi-Mumbai and Ludhiana-Sonnagar in India Final Report (Task 0&1)
Chapter 2 2-10
National Highways expanded its network in the last 10 years by 92%, from 34,200 km in 1994 to 65,569 km in 2004 as shown in Figure 2-7. Upgrading of parts of State Highways in the 9th Five Year Plan was one of the reasons of the expansion.
0
10
20
30
40
50
60
70
1994 1995 1996 1997 1998 1999 2000 2001 2002 2003 2004
Year
'000
km
Source: Economic Survey, Department of Road Transport and Highways (morth.nic.in)
Figure 2-7 Length of National Highways (1994-2004)
Currently, the National Highways Development Project (NHDP), the largest highway project in India, is underway to upgrade two-lane roads to 4 or more lane roads along major corridors. The total cost is estimated to be US$ 13.2 billion (on 1999 prices). The NHDP consists of:
1) The Golden Quadrilateral (5,846 km) 2) The North-South and East-West Corridor (7,300 km) 3) Port Connectivity and other projects (1,133 km)
The Golden Quadrilateral connects four major cities of Delhi, Mumbai, Chennai and Kolkata. Delhi - Mumbai Corridor has already completed and 431 km sections remain on other corridors. The North – South Corridor connects Srinagar and Kanyakumari, and the East-West Corridor connects Silchar and Porbandar. The corridors are illustrated in Figure 2-8.
Source: National Highway Authority of India (www.nhai.org)
DELHI
KOLKATA
MUMBAI
CHENNAI
SILCHAR
KANNIAKUMARI
PORBANDAR
SRINAGAR
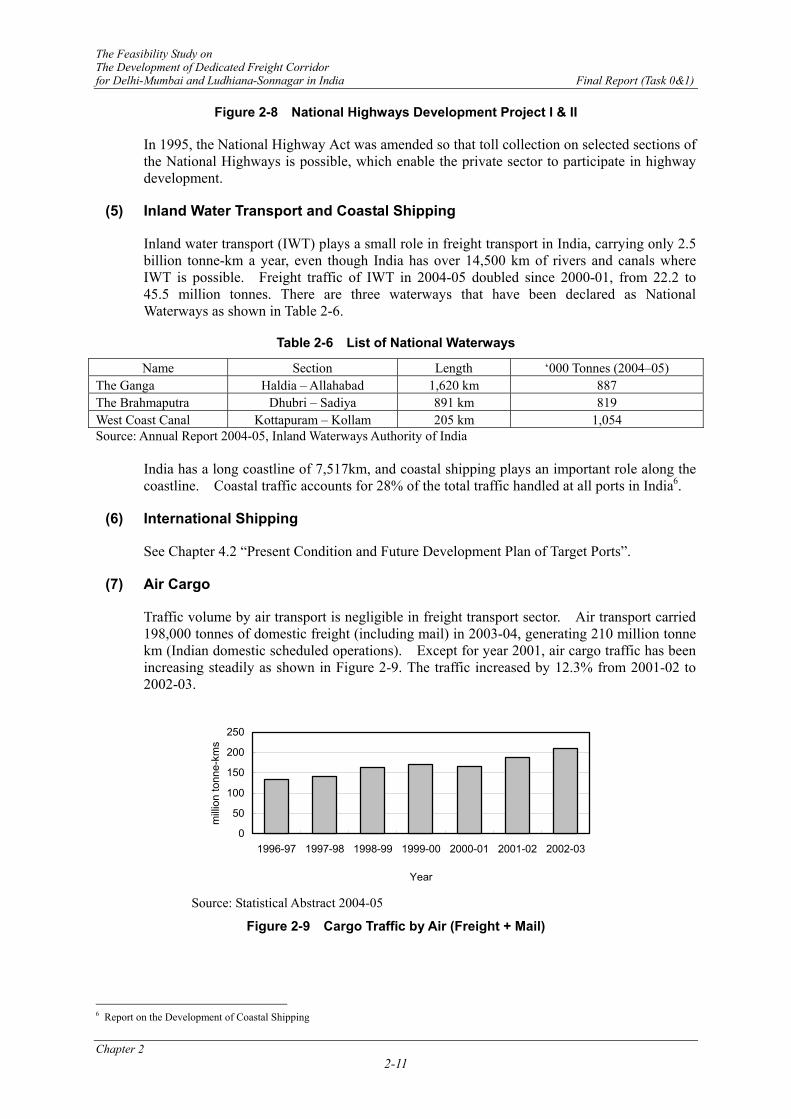
The Feasibility Study on The Development of Dedicated Freight Corridor for Delhi-Mumbai and Ludhiana-Sonnagar in India Final Report (Task 0&1)
Chapter 2 2-11
Figure 2-8 National Highways Development Project I & II
In 1995, the National Highway Act was amended so that toll collection on selected sections of the National Highways is possible, which enable the private sector to participate in highway development.
(5) Inland Water Transport and Coastal Shipping
Inland water transport (IWT) plays a small role in freight transport in India, carrying only 2.5 billion tonne-km a year, even though India has over 14,500 km of rivers and canals where IWT is possible. Freight traffic of IWT in 2004-05 doubled since 2000-01, from 22.2 to 45.5 million tonnes. There are three waterways that have been declared as National Waterways as shown in Table 2-6.
Table 2-6 List of National Waterways
Name Section Length ‘000 Tonnes (2004–05) The Ganga Haldia – Allahabad 1,620 km 887 The Brahmaputra Dhubri – Sadiya 891 km 819 West Coast Canal Kottapuram – Kollam 205 km 1,054 Source: Annual Report 2004-05, Inland Waterways Authority of India
India has a long coastline of 7,517km, and coastal shipping plays an important role along the coastline. Coastal traffic accounts for 28% of the total traffic handled at all ports in India6.
(6) International Shipping
See Chapter 4.2 “Present Condition and Future Development Plan of Target Ports”.
(7) Air Cargo
Traffic volume by air transport is negligible in freight transport sector. Air transport carried 198,000 tonnes of domestic freight (including mail) in 2003-04, generating 210 million tonne km (Indian domestic scheduled operations). Except for year 2001, air cargo traffic has been increasing steadily as shown in Figure 2-9. The traffic increased by 12.3% from 2001-02 to 2002-03.
0
50
100
150
200
250
1996-97 1997-98 1998-99 1999-00 2000-01 2001-02 2002-03
Year
milli
on to
nne-
kms
Source: Statistical Abstract 2004-05
Figure 2-9 Cargo Traffic by Air (Freight + Mail)
6 Report on the Development of Coastal Shipping

The Feasibility Study on The Development of Dedicated Freight Corridor for Delhi-Mumbai and Ludhiana-Sonnagar in India Final Report (Task 0&1)
Chapter 2 2-12
2.3.2 Comparison of Rail Freight Transport with other Transport Modes
This section compares the freight transport on Indian Railways with other modes of transport, such as road and air, and identifies the roles and issues related to the railway. Since air freight transport is only a minute component of domestic freight transport in India, this section is limited mainly to comparing rail freight transport to road transport.
(1) Rail Transport Share and Trends
In the past, Indian Railways held a 60% share of overland transport from the 1960's to the 1970’s. However, the railway share declined in recent years. (Refer to graph.) Yet the rail transport itself shows an increasing trend. Railways have not been able to latch onto the increase in transport occurring in conjunction with India’s economic development. The cause of this is the limited traffic carrying capacity of Indian Railways. This has made it difficult to increase the allocation of the number of trains for freight trains to meet the demand for freight transport. However, in comparison with the road transport, the service level of railway transport is low in such areas as reliability, ease of use and price and these may also be driving down the ratio of rail transport.
Road345.0
Road937.9
Rail256.9
Rail356.03
Domestic Air0.1
Domestic Air0.164
0.0
200.0
400.0
600.0
800.0
1,000.0
1,200.0
1,400.0
1991/92 2002/03
Year
Ton
-kilo
met
ers
(bill
ion)
Source: Statistical Abstract of India 2003, 2002/3 Figures by JICA Study Team
Figure 2-10 Freight Demand by Mode of Transport
(2) Zones where Railways have Competitive Power
During its investigation, the Project Research Group of the JICA Study Team found that it costs Rs. 48,000 to 65,000 to transport a 40-foot container from Mumbai to Delhi by rail; it costs Rs. 40,000 to 70,000 to transport it by truck. The figure shows a comparison of costs for rail and road transport. When rail is used, a truck will still be needed to deliver the container to its final destination after it reaches to the rail station. Because of this, there will be a difference in cost at this point. As can be seen from the figure, when the freight charge for transport by truck is low, the truck offers a benefit in terms of cost. However it can also be seen that in other cases there is a point after which rail is the superior method for long-distance transport.
In recent years, Indian Railways has yielded the transport of small unit loads to nearby destinations to trucks and is concentrating on providing transport between points that have large-unit freight loads. The results shown above may also be the results of these facts and coincidences.
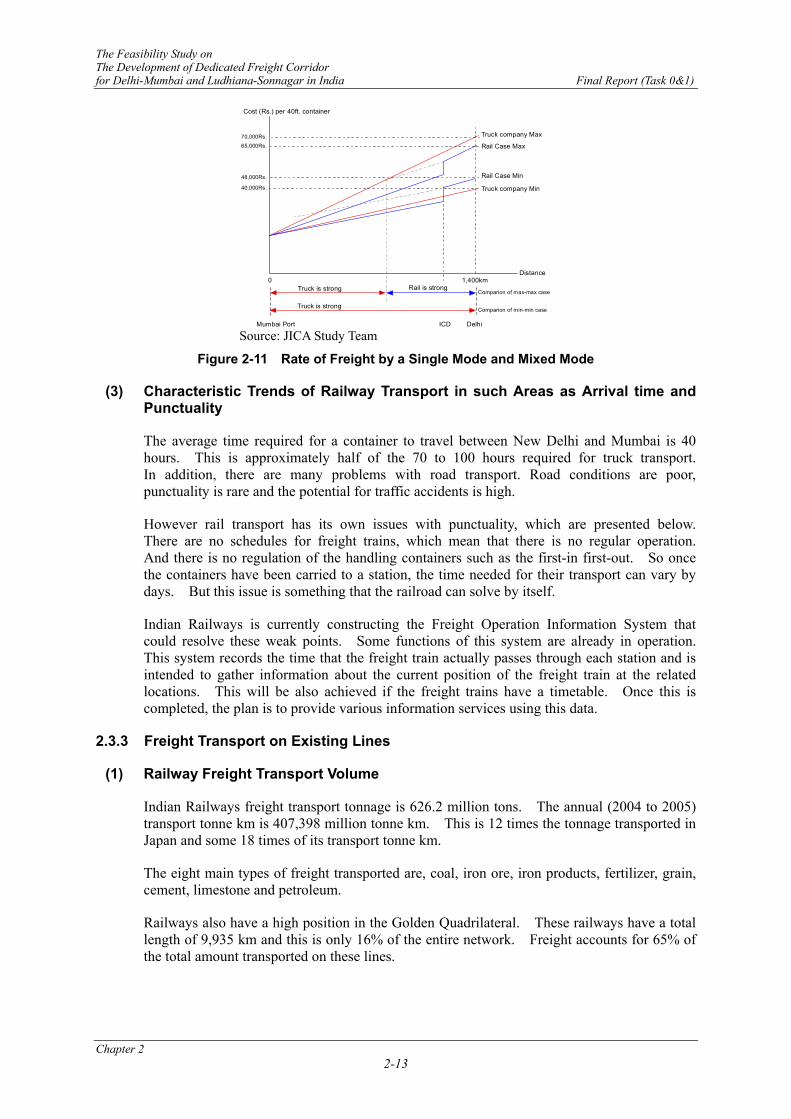
The Feasibility Study on The Development of Dedicated Freight Corridor for Delhi-Mumbai and Ludhiana-Sonnagar in India Final Report (Task 0&1)
Chapter 2 2-13
Distance
Mumbai Port Delhi
0 1,400km
Cost (Rs.) per 40ft. container
70,000Rs.
40,000Rs.
Truck company Max
Truck company Min
48,000Rs.
65,000Rs.
ICD
Rail Case Max
Rail Case Min
Truck is strong Rail is strongComparion of max-max case
Truck is strong Comparion of min-min case
Source: JICA Study Team
Figure 2-11 Rate of Freight by a Single Mode and Mixed Mode
(3) Characteristic Trends of Railway Transport in such Areas as Arrival time and Punctuality
The average time required for a container to travel between New Delhi and Mumbai is 40 hours. This is approximately half of the 70 to 100 hours required for truck transport. In addition, there are many problems with road transport. Road conditions are poor, punctuality is rare and the potential for traffic accidents is high.
However rail transport has its own issues with punctuality, which are presented below. There are no schedules for freight trains, which mean that there is no regular operation. And there is no regulation of the handling containers such as the first-in first-out. So once the containers have been carried to a station, the time needed for their transport can vary by days. But this issue is something that the railroad can solve by itself.
Indian Railways is currently constructing the Freight Operation Information System that could resolve these weak points. Some functions of this system are already in operation. This system records the time that the freight train actually passes through each station and is intended to gather information about the current position of the freight train at the related locations. This will be also achieved if the freight trains have a timetable. Once this is completed, the plan is to provide various information services using this data.
2.3.3 Freight Transport on Existing Lines
(1) Railway Freight Transport Volume
Indian Railways freight transport tonnage is 626.2 million tons. The annual (2004 to 2005) transport tonne km is 407,398 million tonne km. This is 12 times the tonnage transported in Japan and some 18 times of its transport tonne km.
The eight main types of freight transported are, coal, iron ore, iron products, fertilizer, grain, cement, limestone and petroleum.
Railways also have a high position in the Golden Quadrilateral. These railways have a total length of 9,935 km and this is only 16% of the entire network. Freight accounts for 65% of the total amount transported on these lines.

The Feasibility Study on The Development of Dedicated Freight Corridor for Delhi-Mumbai and Ludhiana-Sonnagar in India Final Report (Task 0&1)
Chapter 2 2-14
(2) Various Factors of Freight Transport and their Features
From 1991, Indian Railways changed from a gather-and-transport system, in which freight trains were arranged in yards, to a system that provided direct transport between two main points. This made spending time in the yard unnecessary and simplified the transport system.
The freight trains characteristically handle large transport units with container trains transporting 3,385 tonnes (carrying 90 TEU per train) and regular freight trains transporting 4,715 tonnes (3,400 tonne load) per train.
Freight trains on Indian Railways do not use a schedule. Once the freight for one train has been gathered, transportation arrangement is procured and the freight train leaves the station in conjunction with an open interval in passenger train operation. Container trains are comprised of rolling stock with a maximum speed of 100 km/h and travel concurrently with passenger trains. Regular freight trains have a maximum speed of 75 km/h. However, since passenger trains have track priority along the way, the average speed of freight trains with stopping time is included is said to be 20 to 30 kilometers per hour.
0.0
5.0
10.0
15.0
20.0
India China USA Russia
Source: India’s Transport Sector WB 2002
Figure 2-12 Ton-km/Route Length
(3) Comparisons with other Countries
This section compares the freight transport volume on Indian Railways with other countries that have a large land mass. (Refer to Figure 2-13.) In India, the transport tonne km is relatively small in relation to total track length. The passenger km ratio in India is 63%, which is relatively high when compared to 38% in China and 41% in Russia.
And when the level of rail freight rates in India are compared with other countries with large land masses and adjusted for purchasing power parity, it shows that the freight rate per tonne km is US$0.062, which is dramatically higher than freight rates found in other countries. From these factors we can surmise the railways have overwhelming competitive superiority because of the underdeveloped roadways.
0
0.01
0.02
0.03
0.04
0.05
0.06
0.07
India China USA Russia
US$
Source: India’s Transport Sector WB 2002
Figure 2-13 Freight Revenue per ton/km (PPP)

The Feasibility Study on The Development of Dedicated Freight Corridor for Delhi-Mumbai and Ludhiana-Sonnagar in India Final Report (Task 0&1)
Chapter 2 2-15
2.4 PASSENGER TRANSPORT
2.4.1 Passenger Transport in India
(1) Modal Share
Passenger traffic has risen from 23 Billion Passenger km (BPK) in 1950-51 to 2220 BPK in 1999-00, according to 10th Five Year Plan. There are some estimates about passenger traffic volumes in 2000, varying 1,880 BPK to 4,000 BPK. The recent figures are not available in officially published documents because estimate of passenger-km by road is not clear. There is a calculation of passenger-km by land transport for the past trend as shown in Figure 2-14. The chart indicates that Railways’ share dropped from 74% in 1950-51 to 21% in 1999-00.
0%
20%
40%
60%
80%
100%
1950-51 1960-61 1970-71 1980-81 1990-91 1999-00
Year
RoadRail
Source: Vision 2020 Transport (Original data is cited from Indian Road Congress)
Figure 2-14 Modal Share of Passenger Transport between Rail and Road
Indian Railways carried 5.4 billion passengers with 576 BPK in 2004-05. The number of domestic passengers by air in 2004-05 was 19.4 million, and the passenger-km was 18.0 BPK. Table 2-7 indicates passenger traffic volume by different mode.
Table 2-7 Passenger Traffic by Mode
SRTUs* Indian Railways Indian Domestic Airlines No. of passenger (million) 19,361 5,378 19.4 Passenger-km (BPK) 410.3 576 18.0 Note: SRTU – State Road Transport Undertakings Source: /1) Association of State Road Transport Undertakings (www.asrtu.org) /2) Year Book 2004-05,
Indian Railways, /3) Directorate General of Civil Aviation (www.dgca.nic.in)
(2) Railway
The railway network covers all India with the total track length of 63,000 km. The Indian Railways play an important role in passenger transport in India, providing passenger services for suburban trains (commuter), non-suburban trains including ordinary and express and mail. Night trains are very important transport method for long distance travel such as Delhi – Mumbai, Delhi – Kolkata, Mumbai – Kolkata, and so on, even with the rapid increase in air services between major cities in India. Passenger trains are always crowded, especially suburban trains and second class of long-distance trains. Quality of second class service is very poor.
(3) Road (inter-city/ inter-state bus service)
According to Economic Survey, Indian roads carry about 85% of passengers in India. Road transport services are provided by both private and public sector. Public sector, mainly the
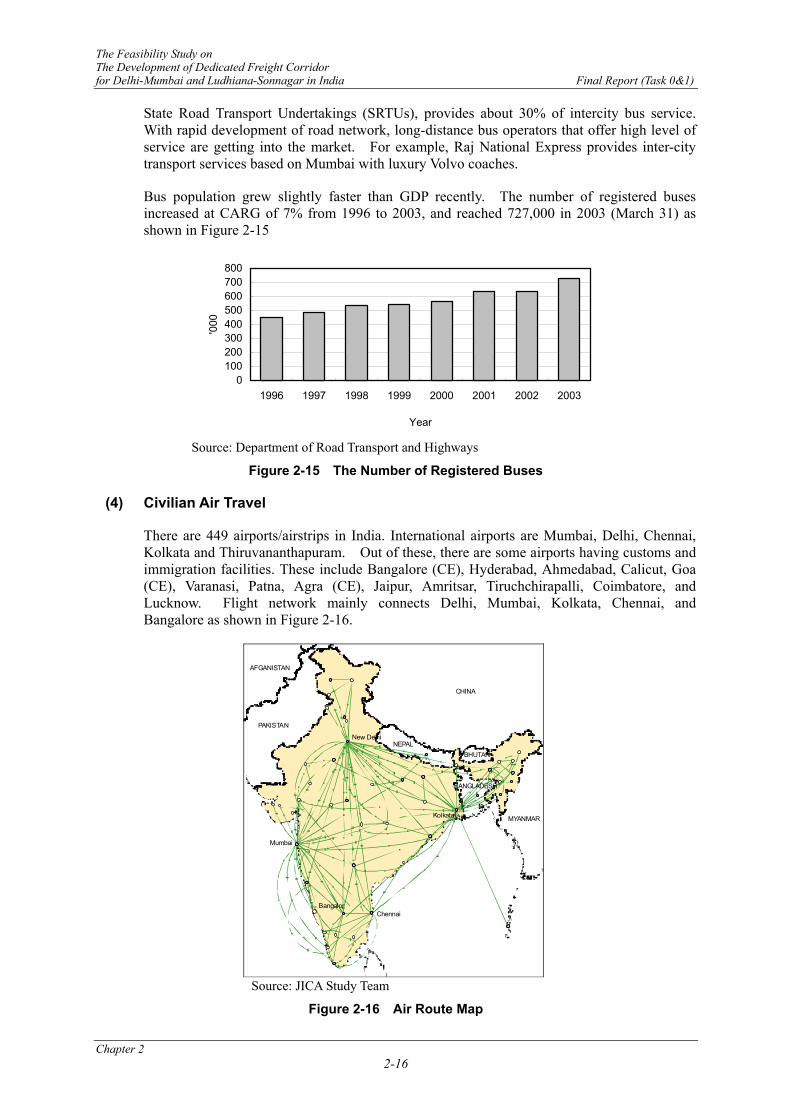
The Feasibility Study on The Development of Dedicated Freight Corridor for Delhi-Mumbai and Ludhiana-Sonnagar in India Final Report (Task 0&1)
Chapter 2 2-16
State Road Transport Undertakings (SRTUs), provides about 30% of intercity bus service. With rapid development of road network, long-distance bus operators that offer high level of service are getting into the market. For example, Raj National Express provides inter-city transport services based on Mumbai with luxury Volvo coaches.
Bus population grew slightly faster than GDP recently. The number of registered buses increased at CARG of 7% from 1996 to 2003, and reached 727,000 in 2003 (March 31) as shown in Figure 2-15
0100200300400500600700800
1996 1997 1998 1999 2000 2001 2002 2003
Year
'000
Source: Department of Road Transport and Highways
Figure 2-15 The Number of Registered Buses
(4) Civilian Air Travel
There are 449 airports/airstrips in India. International airports are Mumbai, Delhi, Chennai, Kolkata and Thiruvananthapuram. Out of these, there are some airports having customs and immigration facilities. These include Bangalore (CE), Hyderabad, Ahmedabad, Calicut, Goa (CE), Varanasi, Patna, Agra (CE), Jaipur, Amritsar, Tiruchchirapalli, Coimbatore, and Lucknow. Flight network mainly connects Delhi, Mumbai, Kolkata, Chennai, and Bangalore as shown in Figure 2-16.
Kolkata
New Delhi
M u m b a i
ChennaiB angalor
A F G A N I S T A N
P A K I S T A N
CHINA
NEPALBHUTAN
BANGLADESH
MYANMAR
Source: JICA Study Team
Figure 2-16 Air Route Map
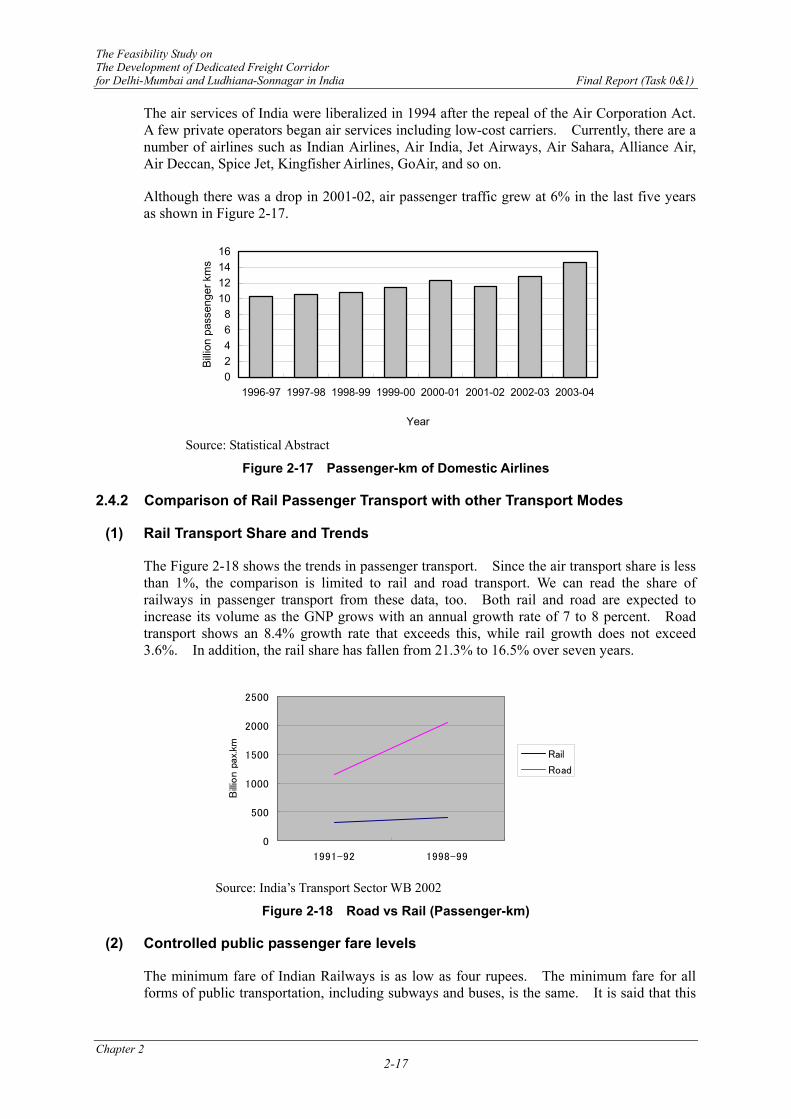
The Feasibility Study on The Development of Dedicated Freight Corridor for Delhi-Mumbai and Ludhiana-Sonnagar in India Final Report (Task 0&1)
Chapter 2 2-17
The air services of India were liberalized in 1994 after the repeal of the Air Corporation Act. A few private operators began air services including low-cost carriers. Currently, there are a number of airlines such as Indian Airlines, Air India, Jet Airways, Air Sahara, Alliance Air, Air Deccan, Spice Jet, Kingfisher Airlines, GoAir, and so on.
Although there was a drop in 2001-02, air passenger traffic grew at 6% in the last five years as shown in Figure 2-17.
02468
10121416
1996-97 1997-98 1998-99 1999-00 2000-01 2001-02 2002-03 2003-04
Year
Billio
n pa
ssen
ger k
ms
Source: Statistical Abstract
Figure 2-17 Passenger-km of Domestic Airlines
2.4.2 Comparison of Rail Passenger Transport with other Transport Modes
(1) Rail Transport Share and Trends
The Figure 2-18 shows the trends in passenger transport. Since the air transport share is less than 1%, the comparison is limited to rail and road transport. We can read the share of railways in passenger transport from these data, too. Both rail and road are expected to increase its volume as the GNP grows with an annual growth rate of 7 to 8 percent. Road transport shows an 8.4% growth rate that exceeds this, while rail growth does not exceed 3.6%. In addition, the rail share has fallen from 21.3% to 16.5% over seven years.
0
500
1000
1500
2000
2500
1991-92 1998-99
Billio
n p
ax.k
m
Rail
Road
Source: India’s Transport Sector WB 2002
Figure 2-18 Road vs Rail (Passenger-km)
(2) Controlled public passenger fare levels
The minimum fare of Indian Railways is as low as four rupees. The minimum fare for all forms of public transportation, including subways and buses, is the same. It is said that this
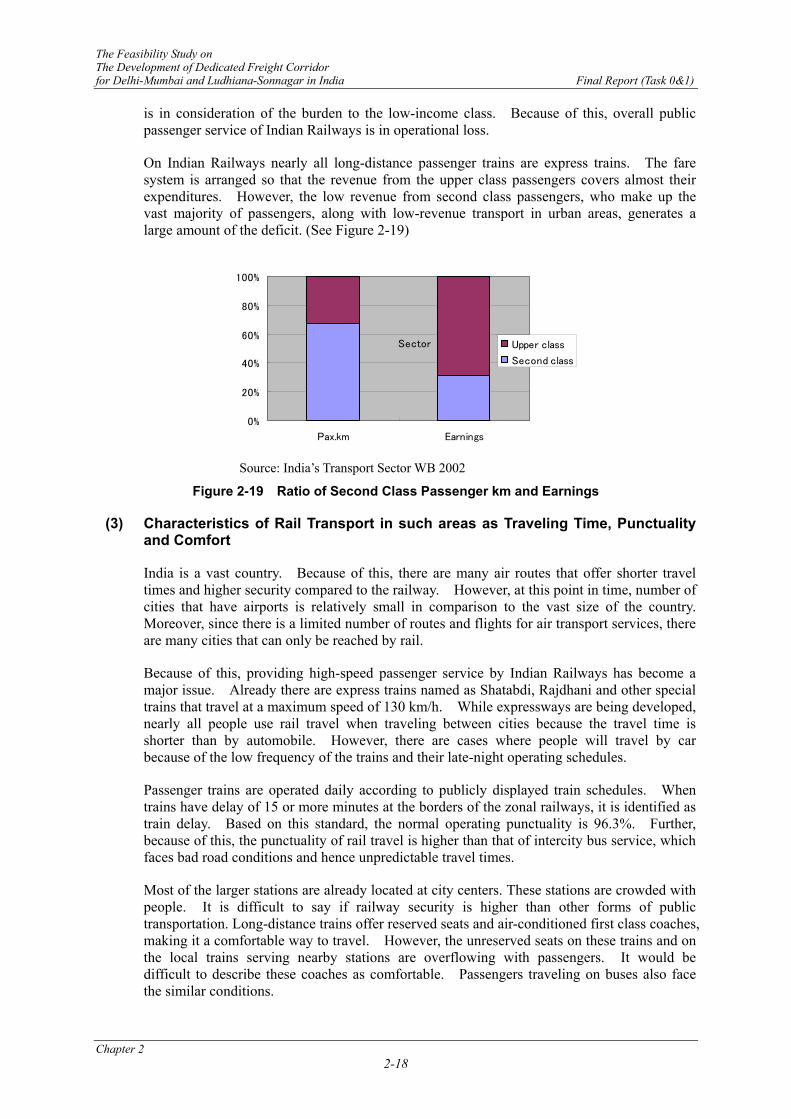
The Feasibility Study on The Development of Dedicated Freight Corridor for Delhi-Mumbai and Ludhiana-Sonnagar in India Final Report (Task 0&1)
Chapter 2 2-18
is in consideration of the burden to the low-income class. Because of this, overall public passenger service of Indian Railways is in operational loss.
On Indian Railways nearly all long-distance passenger trains are express trains. The fare system is arranged so that the revenue from the upper class passengers covers almost their expenditures. However, the low revenue from second class passengers, who make up the vast majority of passengers, along with low-revenue transport in urban areas, generates a large amount of the deficit. (See Figure 2-19)
0%
20%
40%
60%
80%
100%
Pax.km Earnings
Upper class
Second class
Sector
Source: India’s Transport Sector WB 2002
Figure 2-19 Ratio of Second Class Passenger km and Earnings
(3) Characteristics of Rail Transport in such areas as Traveling Time, Punctuality and Comfort
India is a vast country. Because of this, there are many air routes that offer shorter travel times and higher security compared to the railway. However, at this point in time, number of cities that have airports is relatively small in comparison to the vast size of the country. Moreover, since there is a limited number of routes and flights for air transport services, there are many cities that can only be reached by rail.
Because of this, providing high-speed passenger service by Indian Railways has become a major issue. Already there are express trains named as Shatabdi, Rajdhani and other special trains that travel at a maximum speed of 130 km/h. While expressways are being developed, nearly all people use rail travel when traveling between cities because the travel time is shorter than by automobile. However, there are cases where people will travel by car because of the low frequency of the trains and their late-night operating schedules.
Passenger trains are operated daily according to publicly displayed train schedules. When trains have delay of 15 or more minutes at the borders of the zonal railways, it is identified as train delay. Based on this standard, the normal operating punctuality is 96.3%. Further, because of this, the punctuality of rail travel is higher than that of intercity bus service, which faces bad road conditions and hence unpredictable travel times.
Most of the larger stations are already located at city centers. These stations are crowded with people. It is difficult to say if railway security is higher than other forms of public transportation. Long-distance trains offer reserved seats and air-conditioned first class coaches, making it a comfortable way to travel. However, the unreserved seats on these trains and on the local trains serving nearby stations are overflowing with passengers. It would be difficult to describe these coaches as comfortable. Passengers traveling on buses also face the similar conditions.
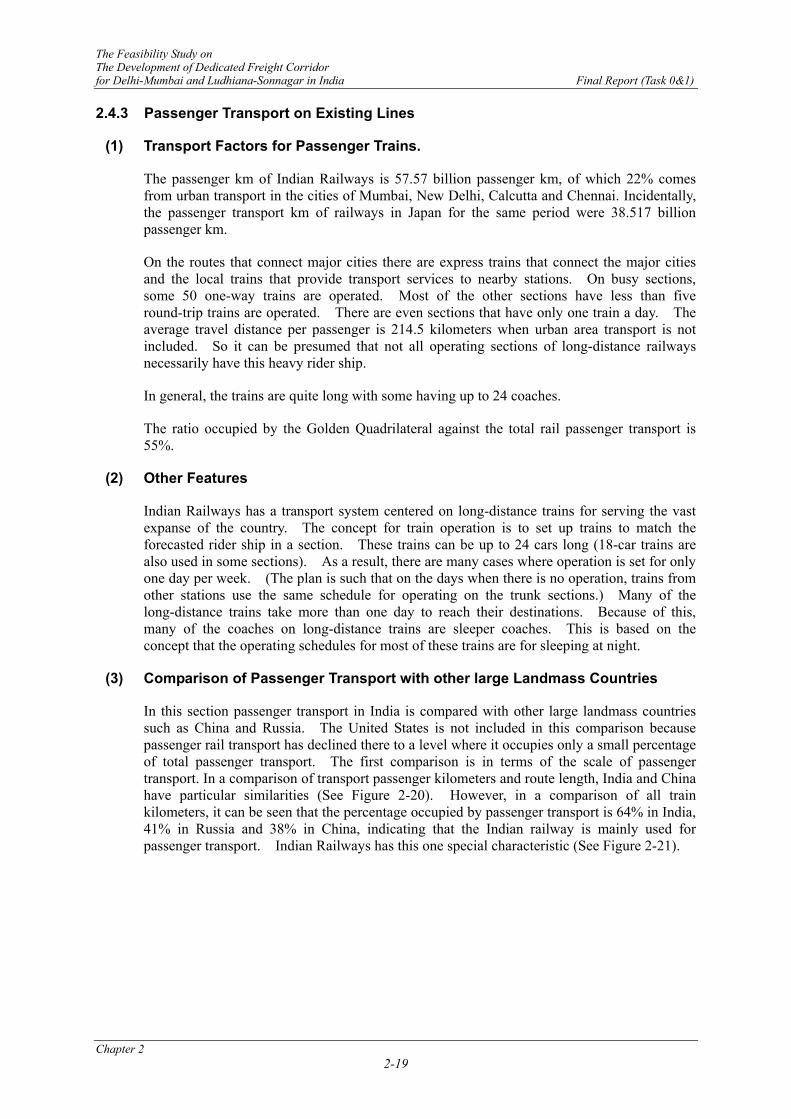
The Feasibility Study on The Development of Dedicated Freight Corridor for Delhi-Mumbai and Ludhiana-Sonnagar in India Final Report (Task 0&1)
Chapter 2 2-19
2.4.3 Passenger Transport on Existing Lines
(1) Transport Factors for Passenger Trains.
The passenger km of Indian Railways is 57.57 billion passenger km, of which 22% comes from urban transport in the cities of Mumbai, New Delhi, Calcutta and Chennai. Incidentally, the passenger transport km of railways in Japan for the same period were 38.517 billion passenger km.
On the routes that connect major cities there are express trains that connect the major cities and the local trains that provide transport services to nearby stations. On busy sections, some 50 one-way trains are operated. Most of the other sections have less than five round-trip trains are operated. There are even sections that have only one train a day. The average travel distance per passenger is 214.5 kilometers when urban area transport is not included. So it can be presumed that not all operating sections of long-distance railways necessarily have this heavy rider ship.
In general, the trains are quite long with some having up to 24 coaches.
The ratio occupied by the Golden Quadrilateral against the total rail passenger transport is 55%.
(2) Other Features
Indian Railways has a transport system centered on long-distance trains for serving the vast expanse of the country. The concept for train operation is to set up trains to match the forecasted rider ship in a section. These trains can be up to 24 cars long (18-car trains are also used in some sections). As a result, there are many cases where operation is set for only one day per week. (The plan is such that on the days when there is no operation, trains from other stations use the same schedule for operating on the trunk sections.) Many of the long-distance trains take more than one day to reach their destinations. Because of this, many of the coaches on long-distance trains are sleeper coaches. This is based on the concept that the operating schedules for most of these trains are for sleeping at night.
(3) Comparison of Passenger Transport with other large Landmass Countries
In this section passenger transport in India is compared with other large landmass countries such as China and Russia. The United States is not included in this comparison because passenger rail transport has declined there to a level where it occupies only a small percentage of total passenger transport. The first comparison is in terms of the scale of passenger transport. In a comparison of transport passenger kilometers and route length, India and China have particular similarities (See Figure 2-20). However, in a comparison of all train kilometers, it can be seen that the percentage occupied by passenger transport is 64% in India, 41% in Russia and 38% in China, indicating that the Indian railway is mainly used for passenger transport. Indian Railways has this one special characteristic (See Figure 2-21).

The Feasibility Study on The Development of Dedicated Freight Corridor for Delhi-Mumbai and Ludhiana-Sonnagar in India Final Report (Task 0&1)
Chapter 2 2-20
0.0
2.0
4.0
6.0
8.0
India China Russia
Mill
ion
pax
Source; Indian transport sector WB2002
Figure 2-20 Passenger km/Route km
0%
20%
40%
60%
80%
100%
India China USA Russia
Freighttrain-kmPassengertrain-km
Source: UIC statistics 2003
Figure 2-21 Ratio of Two Categories of train-km
By the way, in the position paper of the World Bank Group it was pointed out that the fare level of the passenger on Indian Railways is relatively low compared with the level of rail freight rates. The comparison of passenger fare revenue per passenger- km of China and India, compensated with GNI per capita (the data of Russian Railways was not available) derived from International Rai lways Statistics 2002 by UIC tells us that the fare level of Indian Railways is not so different as in other countries. If it were extremely low, problem would lie, due to government control on the fare structure.
0
2
4
6
8
10
12
India China
Revn
ue/P
ass
enge
r-km
/G
NIp
erc
apita
Source: UIC Railway statistics in 2002 and WB database
Figure 2-22 Revenue per Passenger-km
CHAPTER 3 SOCIO-ECONOMIC CONDITION OF THE CORRIDORS
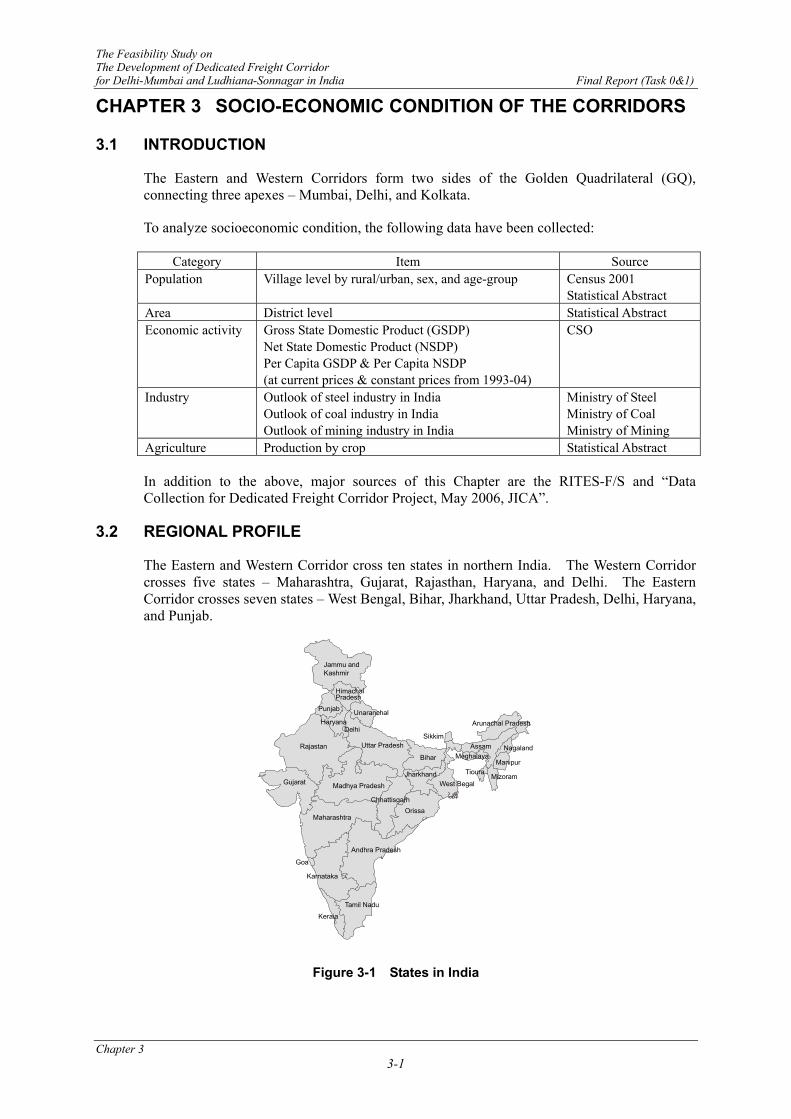
The Feasibility Study on The Development of Dedicated Freight Corridor for Delhi-Mumbai and Ludhiana-Sonnagar in India Final Report (Task 0&1)
Chapter 3 3-1
CHAPTER 3 SOCIO-ECONOMIC CONDITION OF THE CORRIDORS
3.1 INTRODUCTION
The Eastern and Western Corridors form two sides of the Golden Quadrilateral (GQ), connecting three apexes – Mumbai, Delhi, and Kolkata.
To analyze socioeconomic condition, the following data have been collected:
Category Item Source Population Village level by rural/urban, sex, and age-group Census 2001
Statistical Abstract Area District level Statistical Abstract Economic activity Gross State Domestic Product (GSDP)
Net State Domestic Product (NSDP) Per Capita GSDP & Per Capita NSDP (at current prices & constant prices from 1993-04)
CSO
Industry Outlook of steel industry in India Outlook of coal industry in India Outlook of mining industry in India
Ministry of Steel Ministry of Coal Ministry of Mining
Agriculture Production by crop Statistical Abstract
In addition to the above, major sources of this Chapter are the RITES-F/S and “Data Collection for Dedicated Freight Corridor Project, May 2006, JICA”.
3.2 REGIONAL PROFILE
The Eastern and Western Corridor cross ten states in northern India. The Western Corridor crosses five states – Maharashtra, Gujarat, Rajasthan, Haryana, and Delhi. The Eastern Corridor crosses seven states – West Bengal, Bihar, Jharkhand, Uttar Pradesh, Delhi, Haryana, and Punjab.
Jammu andKashmir
HimachalPradesh
Punjab
Haryana
Rajastan
Gujarat Madhya PradeshJharkhand
Chhattisgarh
Maharashtra
Andhra Pradesh
Karnataka
Tamil Nadu
Keraia
Goa
Orissa
Bihar
SikkimAssam Nagaland
Manipur
Mizoram
Meghalaya
Tioura
Arunachal Pradesh
West Begal
Delhi
Unaranchal
Uttar Pradesh
Figure 3-1 States in India
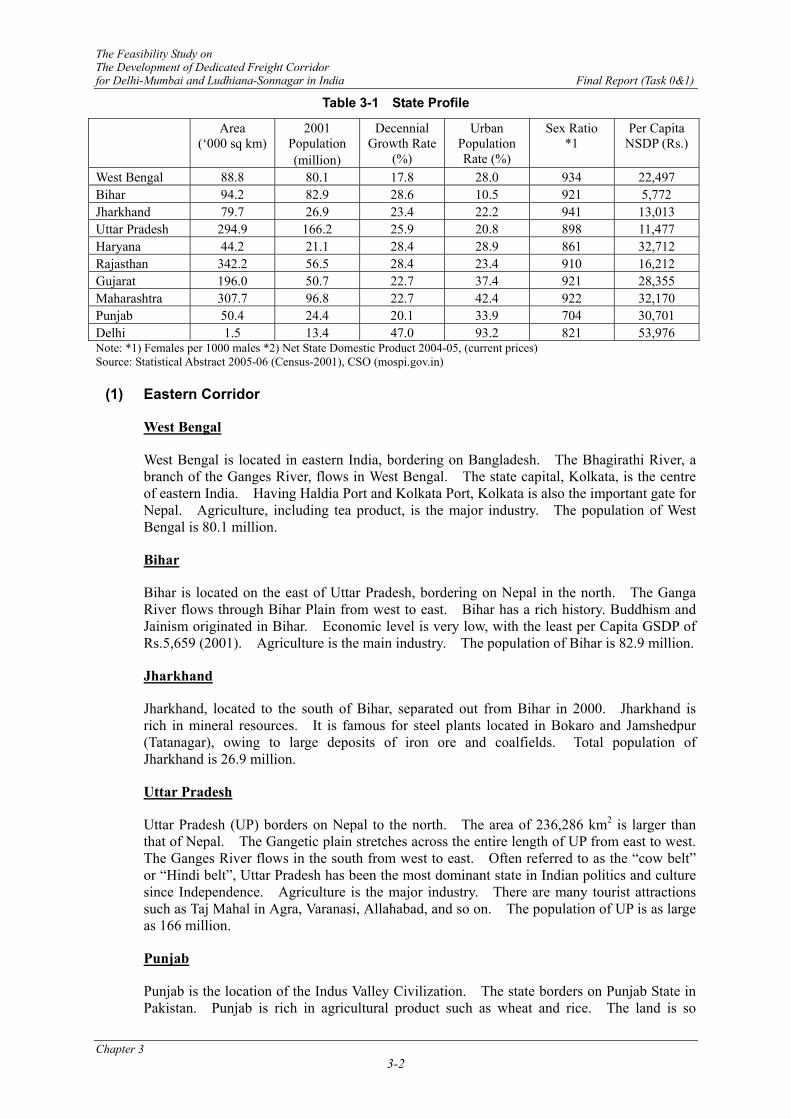
The Feasibility Study on The Development of Dedicated Freight Corridor for Delhi-Mumbai and Ludhiana-Sonnagar in India Final Report (Task 0&1)
Chapter 3 3-2
Table 3-1 State Profile
Area (‘000 sq km)
2001 Population (million)
Decennial Growth Rate
(%)
Urban Population Rate (%)
Sex Ratio *1
Per Capita NSDP (Rs.)
West Bengal 88.8 80.1 17.8 28.0 934 22,497 Bihar 94.2 82.9 28.6 10.5 921 5,772 Jharkhand 79.7 26.9 23.4 22.2 941 13,013 Uttar Pradesh 294.9 166.2 25.9 20.8 898 11,477 Haryana 44.2 21.1 28.4 28.9 861 32,712 Rajasthan 342.2 56.5 28.4 23.4 910 16,212 Gujarat 196.0 50.7 22.7 37.4 921 28,355 Maharashtra 307.7 96.8 22.7 42.4 922 32,170 Punjab 50.4 24.4 20.1 33.9 704 30,701 Delhi 1.5 13.4 47.0 93.2 821 53,976 Note: *1) Females per 1000 males *2) Net State Domestic Product 2004-05, (current prices) Source: Statistical Abstract 2005-06 (Census-2001), CSO (mospi.gov.in)
(1) Eastern Corridor
West Bengal
West Bengal is located in eastern India, bordering on Bangladesh. The Bhagirathi River, a branch of the Ganges River, flows in West Bengal. The state capital, Kolkata, is the centre of eastern India. Having Haldia Port and Kolkata Port, Kolkata is also the important gate for Nepal. Agriculture, including tea product, is the major industry. The population of West Bengal is 80.1 million.
Bihar
Bihar is located on the east of Uttar Pradesh, bordering on Nepal in the north. The Ganga River flows through Bihar Plain from west to east. Bihar has a rich history. Buddhism and Jainism originated in Bihar. Economic level is very low, with the least per Capita GSDP of Rs.5,659 (2001). Agriculture is the main industry. The population of Bihar is 82.9 million.
Jharkhand
Jharkhand, located to the south of Bihar, separated out from Bihar in 2000. Jharkhand is rich in mineral resources. It is famous for steel plants located in Bokaro and Jamshedpur (Tatanagar), owing to large deposits of iron ore and coalfields. Total population of Jharkhand is 26.9 million.
Uttar Pradesh
Uttar Pradesh (UP) borders on Nepal to the north. The area of 236,286 km2 is larger than that of Nepal. The Gangetic plain stretches across the entire length of UP from east to west. The Ganges River flows in the south from west to east. Often referred to as the “cow belt” or “Hindi belt”, Uttar Pradesh has been the most dominant state in Indian politics and culture since Independence. Agriculture is the major industry. There are many tourist attractions such as Taj Mahal in Agra, Varanasi, Allahabad, and so on. The population of UP is as large as 166 million.
Punjab
Punjab is the location of the Indus Valley Civilization. The state borders on Punjab State in Pakistan. Punjab is rich in agricultural product such as wheat and rice. The land is so
The Feasibility Study on The Development of Dedicated Freight Corridor for Delhi-Mumbai and Ludhiana-Sonnagar in India Final Report (Task 0&1)
Chapter 3 3-3
fertile that Punjab export agricultural products to other states. The population of Punjab is 24.4 million.
(2) Western Corridor
Haryana
Haryana borders on Delhi. Gurgaon and Faridabad are emerging satellite cities of Delhi as industrial centres for information technology. Haryana is an industrialized state, producing cars, motorcycles, steel, textile, and so on. Hero Honda, Maruti Udyog Limited, Alcatel, Sony India, and other famous industrial company’s are located in the state. On the other hand, agriculture has been the major industry of Haryana, exporting food production to other states. Wheat and rice are the major crops. The total population is 21.1 million.
Rajasthan
Rajasthan is the largest state of India, having an area of 342,239km2. With its rich historical and cultural heritages, there are many cities that attract tourists. Thar Desert covers western Rajasthan. The northwest tract is sandy and unproductive with little water. The Aravalli Range stretches in the east-south of the state. Agriculture is the main industry. The total population is 56.5 million.
Gujarat
Gujarat faces the Arabian Sea. The large peninsula of Kathiawar lies between the Gulf of Kutch and the Gulf of Khambhat. Gujarat is the most industrialized state in India. Gujarat is the largest producer of salt in India. Ahmedabad, the former state capital, is a big city with a population of 5.8 million, and plays an important role of the commercial centre of Gujarat. The population of Gujarat is 50.7 million.
Maharashtra
Maharashtra is located on the south of Gujarat, facing Arabian Sea. The gross state domestic product (GSDP) of Maharashtra is the largest in India, accounting for 13% of the gross domestic product (GDP). The state capital is Mumbai, the largest city in India with a population of about 12 million. Mumbai is not only the industrial centre, but also the commercial centre (Bombay Stock Exchange) and cultural centre (Bollywood). Having Mumbai Port and JNPT, Mumbai is the western gate of India for foreign trade. The population of Maharashtra is 96.8 million.
3.3 DEMOGRAPHIC CONDITION
The total population of the 10 states are more than 620 million. The population of Delhi grew by 47% for 10 years from 1991 to 2001. The increase rates of other states for the same period varies from 18% to 29%.
The increase rate of West Bengal was the lowest at about 18%. The increase rates of Punjab, Maharashtra, Gujarat, and Jharkhand were 20 – 25%, while those of Bihar, Haryana, Uttar Pradesh, and Rajasthan were 25 – 29%.
The sex ratio of India shows demographic imbalance between men and women. Female population is lower than male population in all the states along the Corridor. Migration of male labours to larges cities is only a small reason. It can be attributed to the discrimination that girl child faces and the consequential problems of poor health and nutritional status.
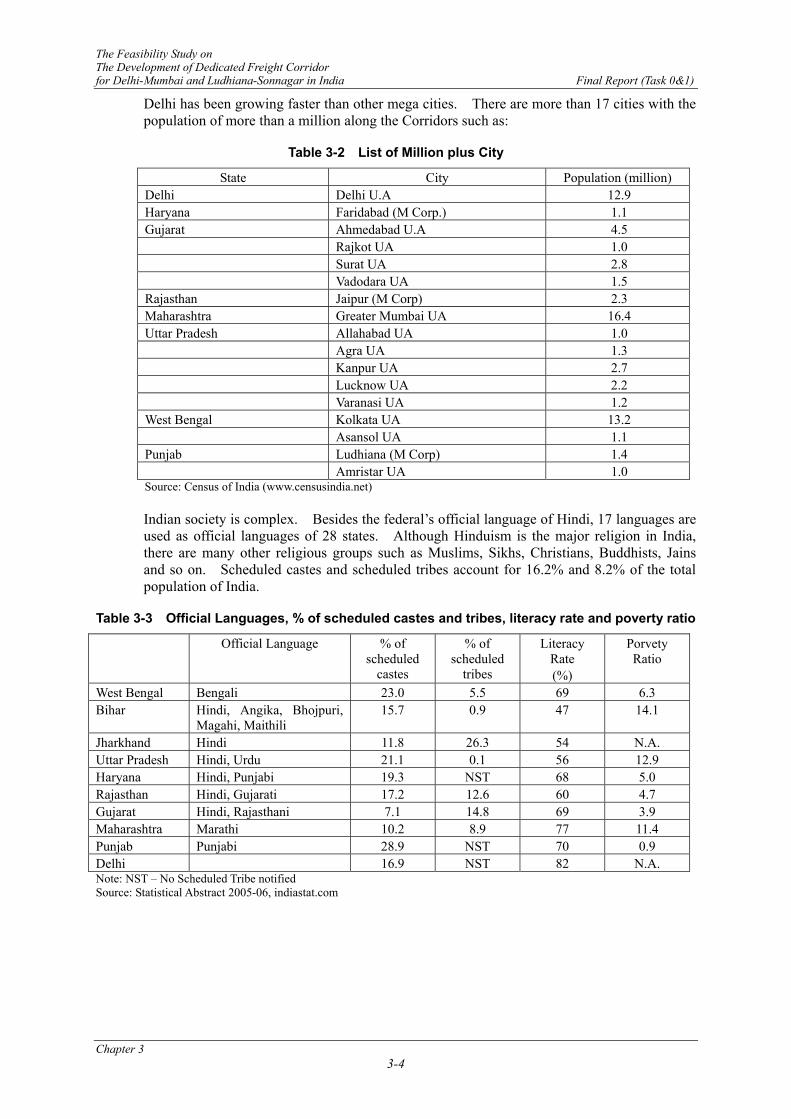
The Feasibility Study on The Development of Dedicated Freight Corridor for Delhi-Mumbai and Ludhiana-Sonnagar in India Final Report (Task 0&1)
Chapter 3 3-4
Delhi has been growing faster than other mega cities. There are more than 17 cities with the population of more than a million along the Corridors such as:
Table 3-2 List of Million plus City
State City Population (million) Delhi Delhi U.A 12.9 Haryana Faridabad (M Corp.) 1.1 Gujarat Ahmedabad U.A 4.5 Rajkot UA 1.0 Surat UA 2.8 Vadodara UA 1.5 Rajasthan Jaipur (M Corp) 2.3 Maharashtra Greater Mumbai UA 16.4 Uttar Pradesh Allahabad UA 1.0 Agra UA 1.3 Kanpur UA 2.7 Lucknow UA 2.2 Varanasi UA 1.2 West Bengal Kolkata UA 13.2 Asansol UA 1.1 Punjab Ludhiana (M Corp) 1.4 Amristar UA 1.0 Source: Census of India (www.censusindia.net)
Indian society is complex. Besides the federal’s official language of Hindi, 17 languages are used as official languages of 28 states. Although Hinduism is the major religion in India, there are many other religious groups such as Muslims, Sikhs, Christians, Buddhists, Jains and so on. Scheduled castes and scheduled tribes account for 16.2% and 8.2% of the total population of India.
Table 3-3 Official Languages, % of scheduled castes and tribes, literacy rate and poverty ratio
Official Language % of scheduled
castes
% of scheduled
tribes
Literacy Rate (%)
Porvety Ratio
West Bengal Bengali 23.0 5.5 69 6.3 Bihar Hindi, Angika, Bhojpuri,
Magahi, Maithili 15.7 0.9 47 14.1
Jharkhand Hindi 11.8 26.3 54 N.A. Uttar Pradesh Hindi, Urdu 21.1 0.1 56 12.9 Haryana Hindi, Punjabi 19.3 NST 68 5.0 Rajasthan Hindi, Gujarati 17.2 12.6 60 4.7 Gujarat Hindi, Rajasthani 7.1 14.8 69 3.9 Maharashtra Marathi 10.2 8.9 77 11.4 Punjab Punjabi 28.9 NST 70 0.9 Delhi 16.9 NST 82 N.A. Note: NST – No Scheduled Tribe notified Source: Statistical Abstract 2005-06, indiastat.com

The Feasibility Study on The Development of Dedicated Freight Corridor for Delhi-Mumbai and Ludhiana-Sonnagar in India Final Report (Task 0&1)
Chapter 3 3-5
3.4 ECONOMIC CONDITION
Figure 3-2 illustrates CAGRs of Gross Domestic Product (GSDP) for two periods of last 10 years. Economic growth of Delhi has been significant for the last 10 years. GSDP of Delhi doubled since 1994-05 at CAGR of more than 8%. West Bengal is also one of the fastest growing states. During the five years from 1994-05, GSRD of West Bengal grew at a CAGR of 7.3%, keeping the high growth during the five years from 1999-00 at a CAGR of 7.0%. Haryana and Gujarat also have performed high economic growth for the recent five years at a CAGR of 7%. Economic growth of Rajasthan and Maharashtra became slow from CAGRs of over 6% in the second half of 1990’s to those of about 5% in the first half of 2000’s.
0.0% 2.0% 4.0% 6.0% 8.0% 10.0%
West Bengal
Bihar
Jharkhand
Uttar Pradesh
Haryana
Rajasthan
Gujarat
Maharashtra
Punjab
Delhi
From 1999-00 to 2004-05 From 1994-05 to 1999-00
Note: Black bar indicates CAGR from 1990-00 to 2004-05, while grey bar indicates that from 1994-05 Source: CSO
Figure 3-2 Compound Annual Growth Rate (CAGR) of GSDP
Economic level is totally imbalanced among various states. Per Capita Net State Domestic Product (NSDP) of Bihar is very low at Rs. 5,772 (2004-05), which is one ninth of that of Delhi. Uttar Pradesh, Jarkhand, and Rajasthan belong to poorer group with Per Capita NSDP of Rs. 11,477, 13,013, and 16,212, respectively. Despite the continuous economic growth in the last 10 years, Per Capita NSDP of West Bengal is Rs. 22,497, which is lower than that of Gujarat (Rs. 28,355), Punjab (Rs. 30,701) and Maharashtra (Rs. 32,170).
3.5 INDUSTRY
3.5.1 Overview
Roughly, the major industry in eastern parts of the Eastern Corridor is heavy industry based on rich mineral resources such as coal and iron ore. Basically, northern area around Delhi is a rich agricultural area; however, the area has been rapidly industrialized recently with high-tech industry. Western area, around Mumbai and Ahmedabad, is the most industrialized area of India.
Figure 3-3 illustrates percentages of primary, secondary, and tertiary sector in terms of GSDP by state. Secondary sector accounts for about 30% in Jharkhand, Gujarat, Haryana, and Maharashtra. Although Maharashtra is highly industrialized state, the share of secondary sector is only 29% due to high production from the tertiary sector, which is contributed to

The Feasibility Study on The Development of Dedicated Freight Corridor for Delhi-Mumbai and Ludhiana-Sonnagar in India Final Report (Task 0&1)
Chapter 3 3-6
Mumbai. Primary sector accounts for about 35% in Punjab, Uttar Pradesh, Jharkhand, and Bihar. Mining and quarrying sub-sector accounts for 40% of the primary sector in Jharkhand. There are massive coalfields and depots of iron & ore in Jharkhand.
0% 20% 40% 60% 80% 100%
West Bengal
Bihar
Jharkhand
Uttar Pradesh
Haryana
Rajasthan
Gujarat
Maharashtra
Punjab
Delhi
Primary Seconday Tertiary
Note: % of domestic product (at current prices) in 2003-04 Source: CSO (mospi.gov.in)
Figure 3-3 State-wise Industrial Structure
The number of factories is largest in Maharashtra at 17,570 in 2002-03, followed by Gujarat at 13,180 as shown in Table 3-4. The growth rate of the number of enterprises was highest in Haryana at 6.5%, followed by Punjab at 5.9%
Table 3-4 Factories and Enterprises
No. of Factory (2002-03)
Net Value Added(Rs. Billion)
No. of Enterprises (‘000) in 2005
Growth in enterprises from 1998 to 2005
West Bengal 6,085 7,209 4,286 4.1 Bihar 1,403 855 1,290 3.1 Jharkhand 1,417 6,916 491 3.0 Uttar Pradesh 8,980 11,365 4,016 5.1 Haryana 4,437 7,657 828 6.5 Rajasthan 5,409 4,778 1,957 3.6 Gujarat 13,180 22,889 2,419 3.4 Maharashtra 17,570 34,919 4,375 4.4 Punjab 6,987 5,485 1,072 5.9 Delhi 3,436 2,527 754 1.4 Source: Statistical Abstract, Provisional Result of Economic Census 2005 3.5.2 Sectoral Profile
(1) Steel and Iron
India is the 9th largest producer of steel in the world. Most steel plants are located in eastern area of the Eastern Corridor. Major steel plants are shown in Table 3-5:
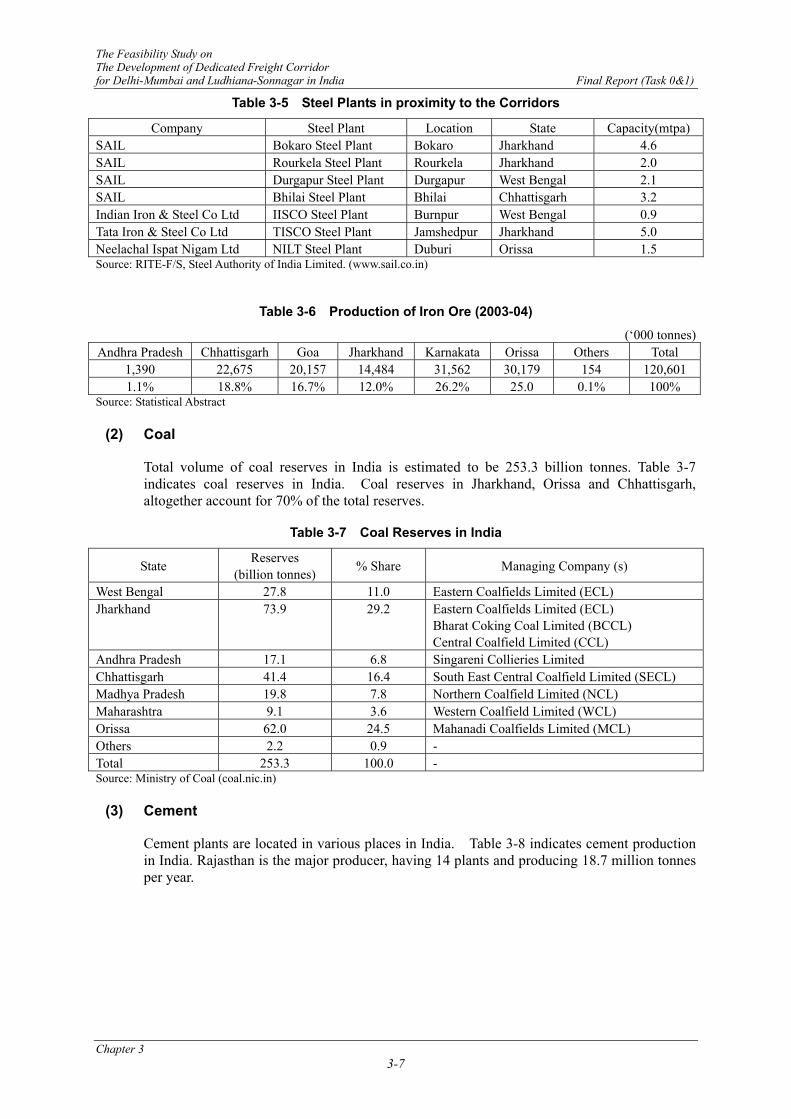
The Feasibility Study on The Development of Dedicated Freight Corridor for Delhi-Mumbai and Ludhiana-Sonnagar in India Final Report (Task 0&1)
Chapter 3 3-7
Table 3-5 Steel Plants in proximity to the Corridors
Company Steel Plant Location State Capacity(mtpa) SAIL Bokaro Steel Plant Bokaro Jharkhand 4.6 SAIL Rourkela Steel Plant Rourkela Jharkhand 2.0 SAIL Durgapur Steel Plant Durgapur West Bengal 2.1 SAIL Bhilai Steel Plant Bhilai Chhattisgarh 3.2 Indian Iron & Steel Co Ltd IISCO Steel Plant Burnpur West Bengal 0.9 Tata Iron & Steel Co Ltd TISCO Steel Plant Jamshedpur Jharkhand 5.0 Neelachal Ispat Nigam Ltd NILT Steel Plant Duburi Orissa 1.5 Source: RITE-F/S, Steel Authority of India Limited. (www.sail.co.in)
Table 3-6 Production of Iron Ore (2003-04)
(‘000 tonnes) Andhra Pradesh Chhattisgarh Goa Jharkhand Karnakata Orissa Others Total
1,390 22,675 20,157 14,484 31,562 30,179 154 120,601 1.1% 18.8% 16.7% 12.0% 26.2% 25.0 0.1% 100%
Source: Statistical Abstract
(2) Coal
Total volume of coal reserves in India is estimated to be 253.3 billion tonnes. Table 3-7 indicates coal reserves in India. Coal reserves in Jharkhand, Orissa and Chhattisgarh, altogether account for 70% of the total reserves.
Table 3-7 Coal Reserves in India
State Reserves (billion tonnes) % Share Managing Company (s)
West Bengal 27.8 11.0 Eastern Coalfields Limited (ECL) Jharkhand 73.9 29.2 Eastern Coalfields Limited (ECL)
Bharat Coking Coal Limited (BCCL) Central Coalfield Limited (CCL)
Andhra Pradesh 17.1 6.8 Singareni Collieries Limited Chhattisgarh 41.4 16.4 South East Central Coalfield Limited (SECL) Madhya Pradesh 19.8 7.8 Northern Coalfield Limited (NCL) Maharashtra 9.1 3.6 Western Coalfield Limited (WCL) Orissa 62.0 24.5 Mahanadi Coalfields Limited (MCL) Others 2.2 0.9 - Total 253.3 100.0 - Source: Ministry of Coal (coal.nic.in)
(3) Cement
Cement plants are located in various places in India. Table 3-8 indicates cement production in India. Rajasthan is the major producer, having 14 plants and producing 18.7 million tonnes per year.

The Feasibility Study on The Development of Dedicated Freight Corridor for Delhi-Mumbai and Ludhiana-Sonnagar in India Final Report (Task 0&1)
Chapter 3 3-8
Table 3-8 Cement Production in India
(million tonnes) Capacity Production Consumption No. of
Plants Location
West Bengal 3.13 3.12 6.22 4 Purulia, Durgapur, Sankrail Bihar 1.00 0.37 3.80 1 Bahjari Jharkhand 4.57 3.78 2.31 5 Chaibasa, Sindri, Singbhum, Khalari,
Japla Uttar Pradesh 7.31 4.23 14.12 8 Tikaria, Raebareli, Jhansi, Churk, Dalla,
Chunar, Sadva Khurd, Tanda Haryana 0.17 - 4.25 1 Charkhi-Dadri Rajasthan 18.83 18.66 6.97 14 Lakheri, Chittorgarh, Morak,
Shambhupura, Nimbahera, Mangrol, Sirohi Road, Udaipur, Pali, Beawar, Sirohi, Kota
Gujarat 17.58 11.72 8.71 11 Sikka, Ranavav, Vereval, Porbandar, Jafradad, Magdalla, Kodinar, Abdasa, Mithapur
Maharashtra 11.80 11.04 15.88 8 Chanda, Manikgarh, Hotgi, Chandrapur, Ratnagiri, Raigad, Jalgaon
Punjab 4.20 3.79 5.23 3 Ropar, Bhatinda Delhi 0.50 - 3.75 1 Delhi Source: Cement Manufactures’ Association (www.cmaindia.org)
(4) Fertilizer
India produces 15.3 million tonnes of fertilizers per year (2004-05) as shown in Table 3-9. Gujarat and Uttar Pradesh are the major producers along the Corridors.
Table 3-9 Production of Fertilizer (2004-05)
Production (‘000 tonnes) % Share West Bengal 331.0 2.2 Bihar - - Jharkhand 5.8 0.0 Uttar Pradesh 2,786.4 18.2 Haryana 244.5 1.6 Rajasthan 1,097.6 7.2 Gujarat 3,675.8 24.0 Maharashtra 1,115.0 7.3 Punjab 477.3 2.9 Delhi - - Other states 5,599.3 36.5 Total 15,332.7 100 Source: Fertilizer Association of India (www.faidelhi.org)
(5) Agriculture
Table 3-10 shows production of selected crops. Punjab and Uttar Pradesh are the major producers of wheat and rice. West Bengal is also one of the major producers of rice. Sugarcane is mainly produced in Uttar Pradesh.
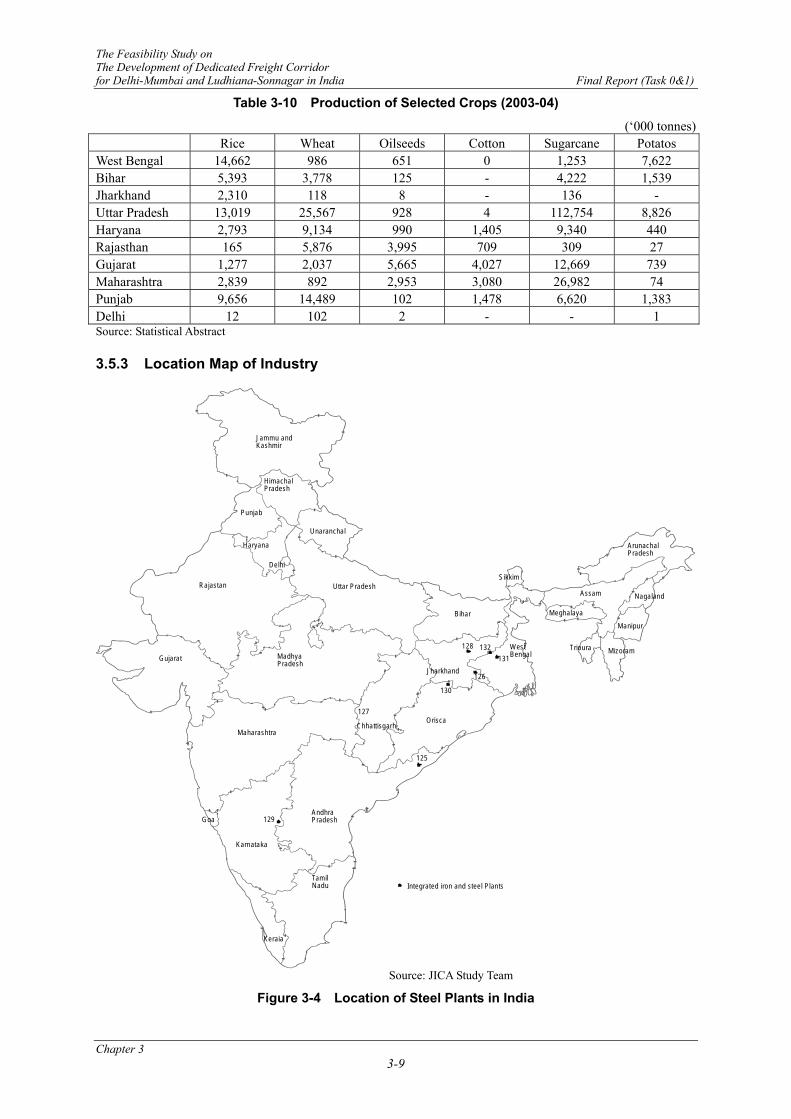
The Feasibility Study on The Development of Dedicated Freight Corridor for Delhi-Mumbai and Ludhiana-Sonnagar in India Final Report (Task 0&1)
Chapter 3 3-9
Table 3-10 Production of Selected Crops (2003-04)
(‘000 tonnes) Rice Wheat Oilseeds Cotton Sugarcane Potatos West Bengal 14,662 986 651 0 1,253 7,622 Bihar 5,393 3,778 125 - 4,222 1,539 Jharkhand 2,310 118 8 - 136 - Uttar Pradesh 13,019 25,567 928 4 112,754 8,826 Haryana 2,793 9,134 990 1,405 9,340 440 Rajasthan 165 5,876 3,995 709 309 27 Gujarat 1,277 2,037 5,665 4,027 12,669 739 Maharashtra 2,839 892 2,953 3,080 26,982 74 Punjab 9,656 14,489 102 1,478 6,620 1,383 Delhi 12 102 2 - - 1 Source: Statistical Abstract 3.5.3 Location Map of Industry
125
126
127
128
129
130
131132
Integrated iron and steel Plants
Jammu andKashmir
HimachalPradesh
Unaranchal
Punjab
Haryana
Rajastan
Gujarat
Uttar Pradesh
MadhyaPradesh
Maharashtra
Karnataka
Goa
Keraia
TamilNadu
AndhraPradesh
ChhattisgarhOrisca
Delhi
WestBengal
Jharkhand
Bihar
ArunachalPradesh
Sikkim
Assam
Meghalaya
Trioura Mizoram
Manipur
Nagaland
Source: JICA Study Team
Figure 3-4 Location of Steel Plants in India

The Feasibility Study on The Development of Dedicated Freight Corridor for Delhi-Mumbai and Ludhiana-Sonnagar in India Final Report (Task 0&1)
Chapter 3 3-10
138
139
140141142
143 144
145146
147
148149
150
151
152153
154155
156
157
158
Coalfields
Jammu andKashmir
HimachalPradesh
Unaranchal
Punjab
Haryana
Rajastan
Gujarat
Uttar Pradesh
MadhyaPradesh
Maharashtra
Karnataka
Goa
Keraia
TamilNadu
AndhraPradesh
ChhattisgarhOrisca
Delhi
WestBengal
Jharkhand
Bihar
ArunachalPradesh
Sikkim
Assam
Meghalaya
Trioura Mizoram
Manipur
Nagaland
Source: JICA Study Team
Figure 3-5 Location of Coalfields in India

The Feasibility Study on The Development of Dedicated Freight Corridor for Delhi-Mumbai and Ludhiana-Sonnagar in India Final Report (Task 0&1)
Chapter 3 3-11
12
3
45
67
8
910 1112
13 14
15
1617
18
19
20
21
22
23
24252627
28
29
30
31
32
33
343536
373839
40
41
42
43
44
45
4647
48
49
50
51
5253
54 56
5557
5859
60
61
62
63 6465
66676869
7071
72
73 7475
7677
78
79
80
81
8283
84
8586
8788
899091
92
93
94
95
96
9798
99
100
101
102103104
105
106
107
108109
110
111
112
113
114115
116
117
119 120
118 120
121122123
124
Cement Plants
Jammu andKashmir
HimachalPradesh
Unaranchal
Punjab
Haryana
Rajastan
Gujarat
Uttar Pradesh
MadhyaPradesh
Maharashtra
Karnataka
Goa
Keraia
TamilNadu
AndhraPradesh
ChhattisgarhOrisca
Delhi
WestBengal
Jharkhand
Bihar
ArunachalPradesh
Sikkim
Assam
Meghalaya
Trioura Mizoram
Manipur
Nagaland
Source: JICA Study Team
Figure 3-6 Location of Cement Plants in India
CHAPTER 4 STUDY OF THE PRESENT SITUATION
OF THE TARGET LINES
The Feasibility Study on The Development of Dedicated Freight Corridor for Delhi-Mumbai and Ludhiana-Sonnagar in India Final Report (Task 0&1)
Chapter 4 4-1
CHAPTER 4 STUDY OF THE PRESENT SITUATION OF THE TARGET LINES
4.1 PRESENT TRANSPORT SITUATION
In this section, train operation systems on the relevant lines are introduced and the present traffic and train operation conditions on the target lines are described in concrete terms.
In this project, the lack of line capacity on the target lines is one of the major topics to be addressed. Therefore, a close objective examination of the cause of the bottle necks that reduce line capacity is carried out.
A time table for freight train operation is not provided by Indian Railways. This is another topic to be studied indepth. The introduction of a time table for freight train operation is indispensable in enhancing the transport service level. This issue is addressed in the last part of this section.
4.1.1 Train operation systems on the relevant lines
(1) Planning and Control Organization for Train Operation
Indian Railways creates train operation plans at three levels: Railway Board, Zonal Railway and Divisional Railway, and uses these plans for controlling the operation. The former Japanese National Railways (JNR) also used to adopted this type of three-level management system. During the days of JNR, the diagram for the entire country was revised once every three years. At that time, it was very difficult work to make the adjustments among the organizations. Indian Railways is more than three times the size of JNR in terms of overall route length. Presently, Indian Railways does a good job of executing the entire operation of such a large network and organization.
Indian Railways has nearly the same amount of train kilometers per day as the former Japanese National Railways. It is forecasted that Indian Railways will operate even more trains in the future. If the organization and system of the Indian Railways for train operation remains at the same level as they are, it could be difficult to manage the future system at the existing level of efficiency. Indian Railways will need to be able to adapt and quickly respond to the change of requirements on the traffic service level that may occur in the times to come. From this point of view, it is thought that there is a need to improve the intangible measures, such as streamlining the transport system, and to construct new tangible items of the infrastructure, such as the DFC.
For example, in Japan, passenger trains on the section with small volume of passengers are operated within the section only. Trains through to another section are operated only on those sections with more number of passengers. This makes the transport system quite simple and the train operation is easy to create and control. It also helps to prevent the delay of a train in one section from affecting the schedule in another section, making it easy to improve transport quality. Of course, proper arrangement of connecting trains with other trains at junction stations is indispensable for passengers traveling over different rail sections.
(2) Train Operation and the Role of Stations
While the relevant lines along DFC are double-track, Indian Railways mainly uses an absolute block system.
The Feasibility Study on The Development of Dedicated Freight Corridor for Delhi-Mumbai and Ludhiana-Sonnagar in India Final Report (Task 0&1)
Chapter 4 4-2
The absolute block system is usually installed at stations on single track sections to enable trains to travel in different directions. Since the trains travel in the same direction on each side of the double-track sections, there is no need to provide a loop at the station for train to crossover. The main role of the station on double-track sections with an absolute block system is to facilitate the increase of the number of trains that can be operated simultaneously. At sections with automatic signals, equipment plays the role of stations. From the perspective of train operation, the role of a station in a section with automatic signals is to provide a loop for trains traveling in the same direction to pass another train.
Double tracks have always been adopted as a method for increasing the number of trains to be operated. In Japan, double-track sections have had automatic signals for a long time. Or, it may be said in another way, that there are many single-track sections that still use the absolute block system. However, this system has a train detection system that is essentially no different than an automatic signal system.
In Japan, sections with automatic signals often have a centralized traffic control system that allows the formation of routes, which was being traditionally carried out by the station staff, to be centralized in a train control center where dispatchers make routes for the trains. The installation of a centralized traffic control system makes it possible to know the latest traffic conditions, enabling more appropriate decisions to be made.
(3) Train Length and its Weight
However the question remains, as to how much actual increase in line capacity will be achieved if automatic signals are adopted in India. Hence the Study Team conducted the investigation into the parameters and performance of the various trains. The followings were the results based on that investigation.
- The length of the trains is determined by that of the loops (if the average effective loop length is 715 m, then the maximum train length is 686 m). It was realized that train length, for trains other than passenger trains, was arranged to be as close to the limit for effective loop length as possible.
For reference, the effective length of one of the most representative line in Japan, the Tokaido line, is 585 m and the maximum train length is 550 m.
- The maximum speed is based on the restriction of braking distance within 1,200 m under emergency brake. As a result, the maximum speed for passenger trains and container trains, which have lighter train weights, is higher than the other trains as shown on Table 4-1.

The Feasibility Study on The Development of Dedicated Freight Corridor for Delhi-Mumbai and Ludhiana-Sonnagar in India Final Report (Task 0&1)
Chapter 4 4-3
Table 4-1 Train Parameters and their Performance
Train Type Maximum
Speed A
Number of Wagon
(Including Brake Van)
B
Length per
Wagon C
Weight per
Wagon C
Total Weight E=B x D
(Including Locomotive)
Overall Length
F=B x C
Emergency Braking
Distance from Maximum
Speed
Passenger Train* (See Figure 4-1) 120km 24 wagons 22.3m
50 tons with AC 40 tons
without AC
1,320t 555m **1055 m
Container Train (See Figure 4-1) 100km 45wagons 13.7m 81.3t 3,500 t 647m ―
Wagon-Type Train (See Figure 4-1) 75km 58 wagons 10.7m 81.3t 4,836t 651m 1088 m
Other Types of Freight Trains (Using Vacuum Brakes)
65km 58 wagons 10.7m 81.3t 4,836t 651m ―
*This, as in the case of Shatabdis, excludes trains of which maximum speed has been increased by enhancing braking performance.
**21 passenger cars, on flat sections. This table was prepared based on the results of meetings with RITES.
Passenger train 24cars
(Express)
cars24 両× 22.3 m= 535.2 m t
t
Locomotiv 0 t
Total weight 1322 t
Container trains 45cars
Automatic couplerBLCA BLCB BLCB BLCB BLCA
fixed coupler
container(20ft)
BCLA(Container wagons with automatic couplers)
BCLB(Container wagons with fixed coupler)
Brake Ban ⑨ ⑧ ⑦ ⑥ ⑤ ④ ③ ② ①
20ftcontainr 90TEU40ft container 45 45 cars
75.2 t
3384 t122 t
Total weight 3506 t
Coal trains 58cars
Brake Ban
58 cars58 cars× 10.713 m= 621.4 m 81.28 t
4714 t122 t
Total weight 4836 tLocomotive
Weight of a car
Weight of a car
Weight of total wagonLocomotive
Number of cars
Weight of total wagon
Number of cars 24Weight of a car 5Total weight 120
Number of cars
EL
9units45cars 617.6m 20m
647m
68.627m
EL
20m
621.4m
68.627m BOXN10.713m
651m
BOXN10.713m10.713m
10.713m
EL
約20m
535m
約555m
22.3m 22.3m 22.3m22.3m
9.5m
9.5m
Figure 4-1 Figure of Trains
(4) Operating time between stations
In India, the operating time between stations is calculated by using the booked speed (90% of maximum speed) that has been calculated from the maximum operating speed and the distance between the relevant stations. If the train can pass through both stations, the resultant time is then used. If there are some sections that have special speed restrictions, increased operating time required due to the restriction is added.
The acceleration or deceleration time required for starting from or stopping at a station is then added to the time. (Refer to 4.1.3 for acceleration and deceleration time.)
The Feasibility Study on The Development of Dedicated Freight Corridor for Delhi-Mumbai and Ludhiana-Sonnagar in India Final Report (Task 0&1)
Chapter 4 4-4
In Japan calculations of the train operating time between stations is made based on the operating curve calculation system introduced by one of the Japanese expert at a technical seminar held in Delhi. Specifically, it is a calculation system that incorporates data about track conditions (curves, grades, speed restrictions at switches, etc.), rolling stock performance, and hauled freight car weight. India has been looking into this operating curve system, but has not actually implemented one yet.
4.1.2 Present situation of Traffic and Train Operation on the target lines
Generally speaking, the annual traffic trends for rail transport show little fluctuation. Hence, understanding the recent traffic movements is important for establishing a future plan. In this investigation, the route map of the metropolitan area was first drawn up (See Figure 4-2). Since the metropolitan area is large with complicated routes it becomes one of the major bottlenecks in the area of rail transportation.
It is pertinent to note that Indian Railways does not provide a timetable for freight trains. So the data for train operation have been obtained with the following ways.
1) Number of passenger and freight trains in each section
The train operation performance data found in the year 2004-05 line capacity statements provided by each of the Zonal Railways was condensed and arranged in the attached table (Table 4-2 to Table 4-4). In principle, the base data was collected for a six-month period from November 2004 to April 2005. The monsoon season was avoided, during which train operation gets frequently stopped.
It may be noted that in Japan, whenever the train operation diagram is modified, a table of the train numbers for each section is created to make it available for this line capacity statement. The operating schedules for freight trains in Japan are also fixed, so it is possible to create a table of the train numbers based on the information available at the planning stage. This table only shows the number of trains by each type and it does not show the line capacity.
2) Train Diagram
The train diagram with not only the passenger trains but also the freight trains are drawn based on the control chart that dispatchers create daily (Figure 4-3). The section from Vasai Road to Surat of the Western Railway was chosen as a trial section. On this train chart the planning chart are also drawn with dotted line and the train delay time can be obtained by comparing the actual train chart with the planned chart.
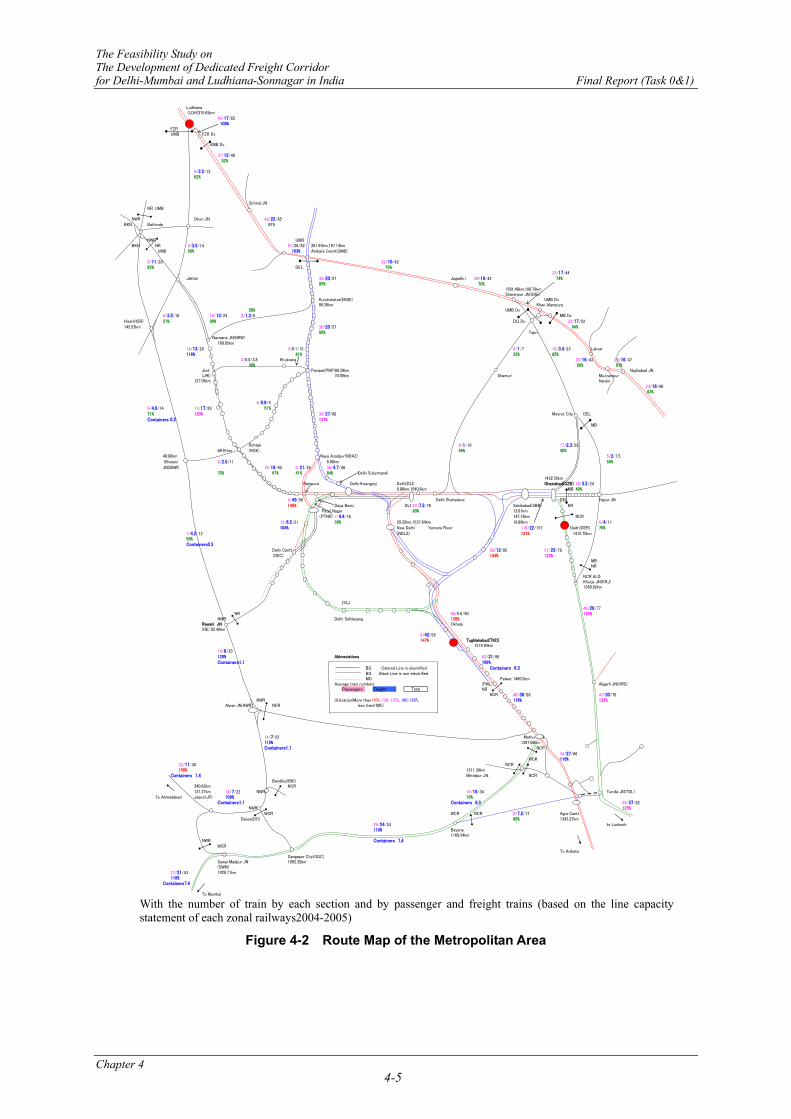
The Feasibility Study on The Development of Dedicated Freight Corridor for Delhi-Mumbai and Ludhiana-Sonnagar in India Final Report (Task 0&1)
Chapter 4 4-5
Ludhiana (LDH)375.65km
46/17/65 108%
FZRUMB FZR Dv
UMB Dv
37/12/49 82%
9/2.2/1282%
Sirhind JNNR UMB
NWR Dhuri JN 42/22/65BKN Bathinda 81%
NWR UMB BKN NR 9/3.5/14 51/26/82 261.93km,197.14km
UMB 58% 103% Ambara Cannt(UMB)
8/11/20 29/10/4282% DEL. 70%
23/17/44Jakhal 35/20/57 Jagadhri 29/10/42 74%
95% 70%1591.48km,180.79kmSharanpur JN(SRE)
Kurukshetra(KKDE) UMB Dv86.39km Khan Alampura
58% UMB Dv6/3.5/10 10/13/24 4/1.3/6 MB Dv
Hisar(HSR) 51% 98% DLI Dv 33/17/52142.52km 35/20/57 94%
95% Tapri Narwana JN(NRW)
160.85km14/13/28 3/8.1/12 6/1/7 18/3.4/23 Laksar118% 81% 32% 85%
3/0.5/3.8 Khukrana 25/16/43 29/16/4738% 89% 97%
Jind Panipat(PNP)88.29km Najibabad JN(JHI) 70.09km Shamuri Muzzampur
127.06km Narain23/16/40 83%
4/0.9/59/4.9/14 11/17/29 51%71% 120% 38/27/68 Meerut City DELContainers 0.3 123%
MB
Rohtak 9/1/10 17/2.3/2269.91km (ROK) 46% 40%
48.00km Naya Azadpur(NDAZ) 5/2/7.5 Bhiwani 8/2.5/11 8.90km 50%JN(BNW) 19/19/40 0/21/25 38/4.7/46
70% 67% 41% 84% Delhi Subzimandi1432.35km
Rampura Delhi Kisanganj Delhi(DLI) Ghaziabad(GZB) 19/3.5/240.00km,1540.8km MB 49%
4/45/56 Delhi Shahadora DEL Hapur JN146% Daya Basti DLI 63/7.3/76 Sahibabad(SBB) NR
Patel Nagar 90% 13.61km(PTNR) 7/4.4/16 147.19km NCR
13/6.2/21 39% 29.22km,1537.64km 19.88km 6/4/11104% New Delhi Yamuna River 116/22/157 Dadri(DER) 70%
7/4.2/12 (NDLS) 131% 1415.70km58%Containers0.3
Delhi Cantt 58/12/85 51/23/79(DEC) 144% 123%
MBNR
NCR ALDKhurja JN(KRJ)1369.82km
DSJ48/28/77
NR 66/5.6/90 120%NWR Delhi Safdarjang 135%
Rewari JN Okhala(RE) 82.48km
0/42/59147% Tughlakabad(TKD)
1519.90km14/8/23120% Abbreviations 62/31/98Containers1.1 109%
BG Colored Line is electrified Containers 6.3BG Black Line is non electrified
MG Palwar 1480.5kmAverage train numbers (PWL) Aligarh JN(HRS)
Passengers Freight NRNCR 48/38/88 47/30/78
NWR Utilization(More than130%, 120-130%, 100-120%, 116% 122%Alwar JN(AWR) NCR less than100%)
14/7/22 Mathura JN115% 1397.06kmContainers1.1 NCR
34/27/66WCR 116%
22/11/35 NCR150% 1211.39km
Containers 1.4 Bhratpur JN. NCRBandikui(BKI)
240.83km NCR131.27km 14/7/22 NWR 16/16/34 Tundla JN(TDL)
To Ahmedabad Jaipur(JP) 109% 70%Containers1.1 Containers 6.3 55/37/92
NWR 125%WCR WCR NCR 9/7.5/17 Agra Cantt
Dausa(DO) 86% 1343.27km26/24/53 to Lucknoh110% Bayana
1169.54kmNWR Containers 7.4
WCRTo Kolkata
Gangapur City(GGC)Sawai Madpur JN 1092.32km(SWM)
27/21/53 1028.71km110%
Containers7.4
To Mumbai
Total
With the number of train by each section and by passenger and freight trains (based on the line capacity statement of each zonal railways2004-2005)
Figure 4-2 Route Map of the Metropolitan Area
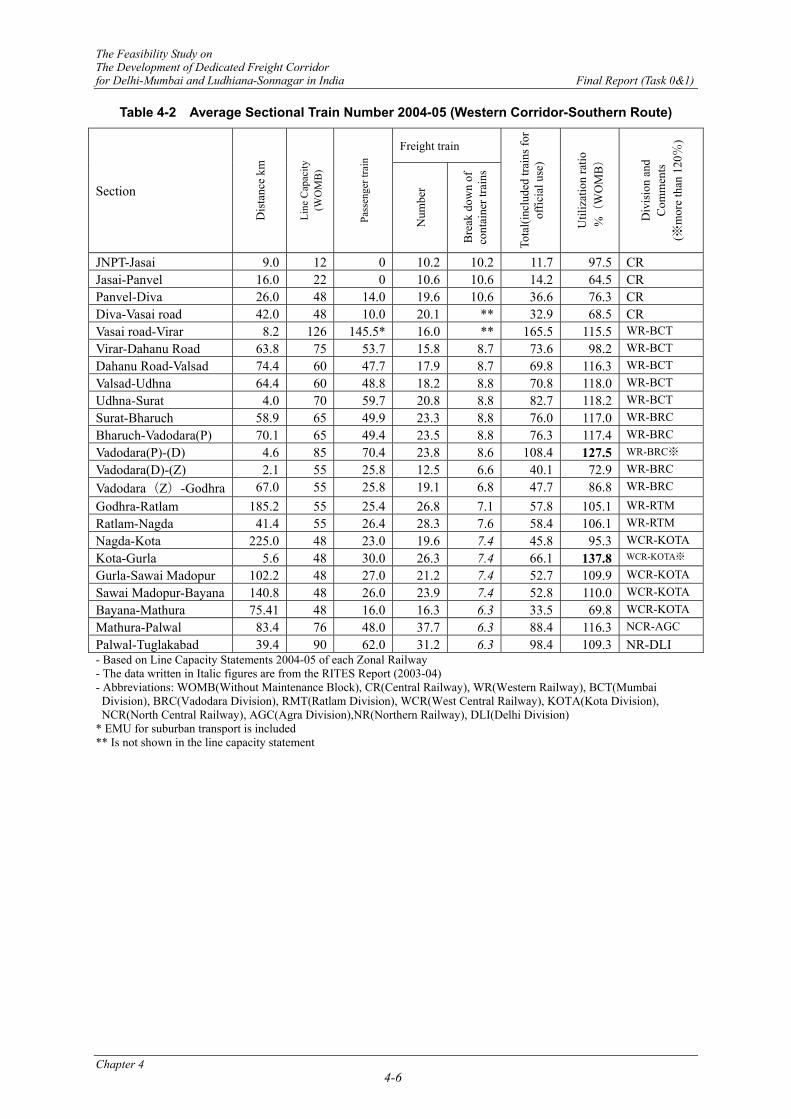
The Feasibility Study on The Development of Dedicated Freight Corridor for Delhi-Mumbai and Ludhiana-Sonnagar in India Final Report (Task 0&1)
Chapter 4 4-6
Table 4-2 Average Sectional Train Number 2004-05 (Western Corridor-Southern Route)
Freight train
Section
Dis
tanc
e km
Line
Cap
acity
(W
OM
B)
Pass
enge
r tra
in
Num
ber
Bre
ak d
own
of
cont
aine
r tra
ins
Tota
l(inc
lude
d tra
ins f
or
offic
ial u
se)
Util
izat
ion
ratio
%(
WO
MB)
Div
isio
n an
d C
omm
ents
(※
mor
e th
an 1
20%
)
JNPT-Jasai 9.0 12 0 10.2 10.2 11.7 97.5 CR Jasai-Panvel 16.0 22 0 10.6 10.6 14.2 64.5 CR Panvel-Diva 26.0 48 14.0 19.6 10.6 36.6 76.3 CR Diva-Vasai road 42.0 48 10.0 20.1 ** 32.9 68.5 CR Vasai road-Virar 8.2 126 145.5* 16.0 ** 165.5 115.5 WR-BCT Virar-Dahanu Road 63.8 75 53.7 15.8 8.7 73.6 98.2 WR-BCT Dahanu Road-Valsad 74.4 60 47.7 17.9 8.7 69.8 116.3 WR-BCT Valsad-Udhna 64.4 60 48.8 18.2 8.8 70.8 118.0 WR-BCT Udhna-Surat 4.0 70 59.7 20.8 8.8 82.7 118.2 WR-BCT Surat-Bharuch 58.9 65 49.9 23.3 8.8 76.0 117.0 WR-BRC Bharuch-Vadodara(P) 70.1 65 49.4 23.5 8.8 76.3 117.4 WR-BRC Vadodara(P)-(D) 4.6 85 70.4 23.8 8.6 108.4 127.5 WR-BRC※ Vadodara(D)-(Z) 2.1 55 25.8 12.5 6.6 40.1 72.9 WR-BRC
Vadodara(Z)-Godhra 67.0 55 25.8 19.1 6.8 47.7 86.8 WR-BRC
Godhra-Ratlam 185.2 55 25.4 26.8 7.1 57.8 105.1 WR-RTM Ratlam-Nagda 41.4 55 26.4 28.3 7.6 58.4 106.1 WR-RTM Nagda-Kota 225.0 48 23.0 19.6 7.4 45.8 95.3 WCR-KOTA Kota-Gurla 5.6 48 30.0 26.3 7.4 66.1 137.8 WCR-KOTA※
Gurla-Sawai Madopur 102.2 48 27.0 21.2 7.4 52.7 109.9 WCR-KOTA Sawai Madopur-Bayana 140.8 48 26.0 23.9 7.4 52.8 110.0 WCR-KOTA Bayana-Mathura 75.41 48 16.0 16.3 6.3 33.5 69.8 WCR-KOTA Mathura-Palwal 83.4 76 48.0 37.7 6.3 88.4 116.3 NCR-AGC Palwal-Tuglakabad 39.4 90 62.0 31.2 6.3 98.4 109.3 NR-DLI - Based on Line Capacity Statements 2004-05 of each Zonal Railway - The data written in Italic figures are from the RITES Report (2003-04) - Abbreviations: WOMB(Without Maintenance Block), CR(Central Railway), WR(Western Railway), BCT(Mumbai
Division), BRC(Vadodara Division), RMT(Ratlam Division), WCR(West Central Railway), KOTA(Kota Division), NCR(North Central Railway), AGC(Agra Division),NR(Northern Railway), DLI(Delhi Division)
* EMU for suburban transport is included ** Is not shown in the line capacity statement
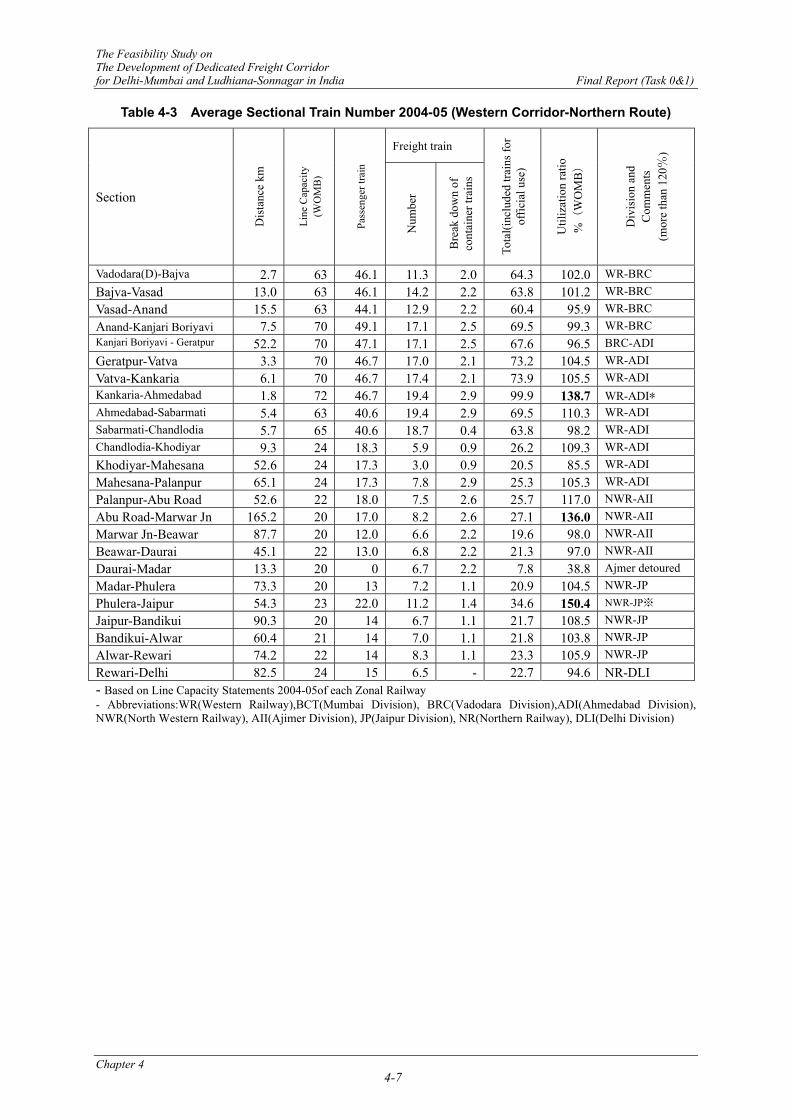
The Feasibility Study on The Development of Dedicated Freight Corridor for Delhi-Mumbai and Ludhiana-Sonnagar in India Final Report (Task 0&1)
Chapter 4 4-7
Table 4-3 Average Sectional Train Number 2004-05 (Western Corridor-Northern Route)
Freight train
Section
Dis
tanc
e km
Line
Cap
acity
(W
OM
B)
Pass
enge
r tra
in
Num
ber
Bre
ak d
own
of
cont
aine
r tra
ins
Tota
l(inc
lude
d tra
ins f
or
offic
ial u
se)
Util
izat
ion
ratio
%(
WO
MB)
Div
isio
n an
d C
omm
ents
(m
ore
than
120%
)
Vadodara(D)-Bajva 2.7 63 46.1 11.3 2.0 64.3 102.0 WR-BRC Bajva-Vasad 13.0 63 46.1 14.2 2.2 63.8 101.2 WR-BRC Vasad-Anand 15.5 63 44.1 12.9 2.2 60.4 95.9 WR-BRC Anand-Kanjari Boriyavi 7.5 70 49.1 17.1 2.5 69.5 99.3 WR-BRC Kanjari Boriyavi - Geratpur 52.2 70 47.1 17.1 2.5 67.6 96.5 BRC-ADI Geratpur-Vatva 3.3 70 46.7 17.0 2.1 73.2 104.5 WR-ADI Vatva-Kankaria 6.1 70 46.7 17.4 2.1 73.9 105.5 WR-ADI Kankaria-Ahmedabad 1.8 72 46.7 19.4 2.9 99.9 138.7 WR-ADI* Ahmedabad-Sabarmati 5.4 63 40.6 19.4 2.9 69.5 110.3 WR-ADI Sabarmati-Chandlodia 5.7 65 40.6 18.7 0.4 63.8 98.2 WR-ADI Chandlodia-Khodiyar 9.3 24 18.3 5.9 0.9 26.2 109.3 WR-ADI Khodiyar-Mahesana 52.6 24 17.3 3.0 0.9 20.5 85.5 WR-ADI Mahesana-Palanpur 65.1 24 17.3 7.8 2.9 25.3 105.3 WR-ADI Palanpur-Abu Road 52.6 22 18.0 7.5 2.6 25.7 117.0 NWR-AII Abu Road-Marwar Jn 165.2 20 17.0 8.2 2.6 27.1 136.0 NWR-AII Marwar Jn-Beawar 87.7 20 12.0 6.6 2.2 19.6 98.0 NWR-AII Beawar-Daurai 45.1 22 13.0 6.8 2.2 21.3 97.0 NWR-AII Daurai-Madar 13.3 20 0 6.7 2.2 7.8 38.8 Ajmer detoured Madar-Phulera 73.3 20 13 7.2 1.1 20.9 104.5 NWR-JP Phulera-Jaipur 54.3 23 22.0 11.2 1.4 34.6 150.4 NWR-JP※
Jaipur-Bandikui 90.3 20 14 6.7 1.1 21.7 108.5 NWR-JP Bandikui-Alwar 60.4 21 14 7.0 1.1 21.8 103.8 NWR-JP Alwar-Rewari 74.2 22 14 8.3 1.1 23.3 105.9 NWR-JP Rewari-Delhi 82.5 24 15 6.5 - 22.7 94.6 NR-DLI - Based on Line Capacity Statements 2004-05of each Zonal Railway - Abbreviations:WR(Western Railway),BCT(Mumbai Division), BRC(Vadodara Division),ADI(Ahmedabad Division), NWR(North Western Railway), AII(Ajimer Division), JP(Jaipur Division), NR(Northern Railway), DLI(Delhi Division)
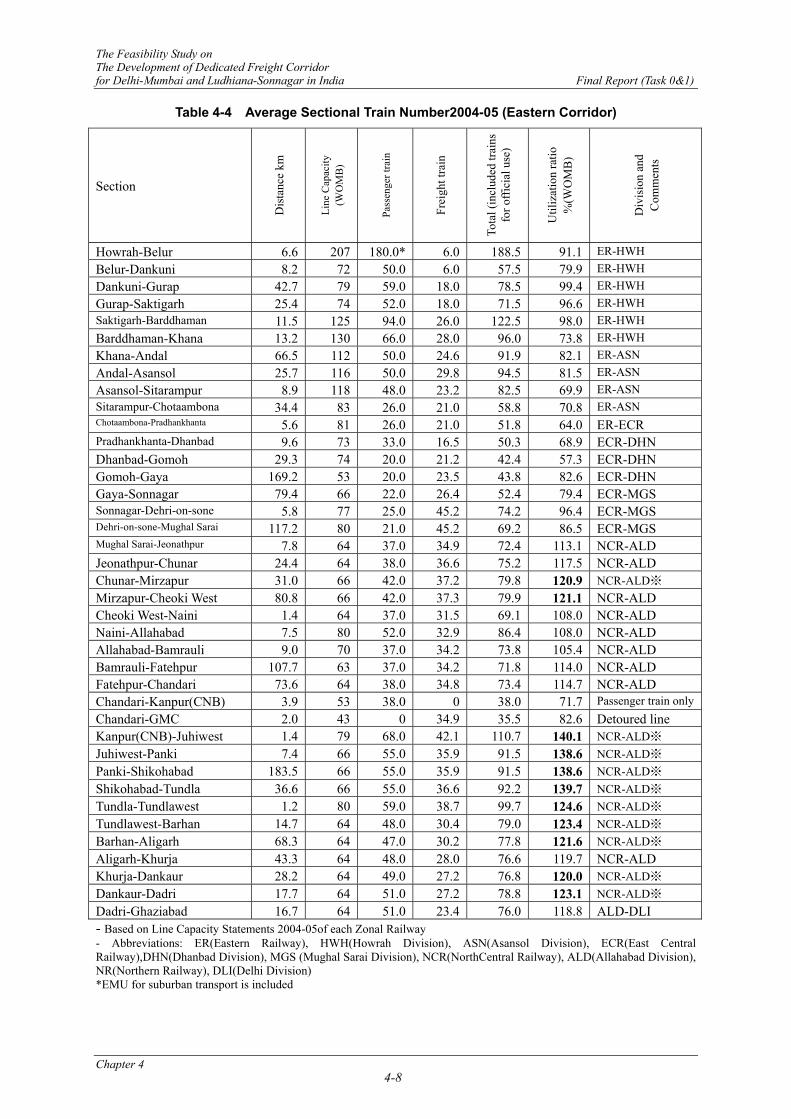
The Feasibility Study on The Development of Dedicated Freight Corridor for Delhi-Mumbai and Ludhiana-Sonnagar in India Final Report (Task 0&1)
Chapter 4 4-8
Table 4-4 Average Sectional Train Number2004-05 (Eastern Corridor)
Section
Dis
tanc
e km
Line
Cap
acity
(W
OM
B)
Pass
enge
r tra
in
Frei
ght t
rain
Tota
l (in
clud
ed tr
ains
fo
r offi
cial
use
)
Util
izat
ion
ratio
%
(WO
MB
)
Div
isio
n an
d C
omm
ents
Howrah-Belur 6.6 207 180.0* 6.0 188.5 91.1 ER-HWH Belur-Dankuni 8.2 72 50.0 6.0 57.5 79.9 ER-HWH Dankuni-Gurap 42.7 79 59.0 18.0 78.5 99.4 ER-HWH Gurap-Saktigarh 25.4 74 52.0 18.0 71.5 96.6 ER-HWH Saktigarh-Barddhaman 11.5 125 94.0 26.0 122.5 98.0 ER-HWH Barddhaman-Khana 13.2 130 66.0 28.0 96.0 73.8 ER-HWH Khana-Andal 66.5 112 50.0 24.6 91.9 82.1 ER-ASN Andal-Asansol 25.7 116 50.0 29.8 94.5 81.5 ER-ASN Asansol-Sitarampur 8.9 118 48.0 23.2 82.5 69.9 ER-ASN Sitarampur-Chotaambona 34.4 83 26.0 21.0 58.8 70.8 ER-ASN Chotaambona-Pradhankhanta 5.6 81 26.0 21.0 51.8 64.0 ER-ECR Pradhankhanta-Dhanbad 9.6 73 33.0 16.5 50.3 68.9 ECR-DHN Dhanbad-Gomoh 29.3 74 20.0 21.2 42.4 57.3 ECR-DHN Gomoh-Gaya 169.2 53 20.0 23.5 43.8 82.6 ECR-DHN Gaya-Sonnagar 79.4 66 22.0 26.4 52.4 79.4 ECR-MGS Sonnagar-Dehri-on-sone 5.8 77 25.0 45.2 74.2 96.4 ECR-MGS Dehri-on-sone-Mughal Sarai 117.2 80 21.0 45.2 69.2 86.5 ECR-MGS Mughal Sarai-Jeonathpur 7.8 64 37.0 34.9 72.4 113.1 NCR-ALD Jeonathpur-Chunar 24.4 64 38.0 36.6 75.2 117.5 NCR-ALD Chunar-Mirzapur 31.0 66 42.0 37.2 79.8 120.9 NCR-ALD※ Mirzapur-Cheoki West 80.8 66 42.0 37.3 79.9 121.1 NCR-ALD Cheoki West-Naini 1.4 64 37.0 31.5 69.1 108.0 NCR-ALD Naini-Allahabad 7.5 80 52.0 32.9 86.4 108.0 NCR-ALD Allahabad-Bamrauli 9.0 70 37.0 34.2 73.8 105.4 NCR-ALD Bamrauli-Fatehpur 107.7 63 37.0 34.2 71.8 114.0 NCR-ALD Fatehpur-Chandari 73.6 64 38.0 34.8 73.4 114.7 NCR-ALD Chandari-Kanpur(CNB) 3.9 53 38.0 0 38.0 71.7 Passenger train onlyChandari-GMC 2.0 43 0 34.9 35.5 82.6 Detoured line Kanpur(CNB)-Juhiwest 1.4 79 68.0 42.1 110.7 140.1 NCR-ALD※ Juhiwest-Panki 7.4 66 55.0 35.9 91.5 138.6 NCR-ALD※ Panki-Shikohabad 183.5 66 55.0 35.9 91.5 138.6 NCR-ALD※ Shikohabad-Tundla 36.6 66 55.0 36.6 92.2 139.7 NCR-ALD※ Tundla-Tundlawest 1.2 80 59.0 38.7 99.7 124.6 NCR-ALD※ Tundlawest-Barhan 14.7 64 48.0 30.4 79.0 123.4 NCR-ALD※ Barhan-Aligarh 68.3 64 47.0 30.2 77.8 121.6 NCR-ALD※ Aligarh-Khurja 43.3 64 48.0 28.0 76.6 119.7 NCR-ALD Khurja-Dankaur 28.2 64 49.0 27.2 76.8 120.0 NCR-ALD※ Dankaur-Dadri 17.7 64 51.0 27.2 78.8 123.1 NCR-ALD※ Dadri-Ghaziabad 16.7 64 51.0 23.4 76.0 118.8 ALD-DLI - Based on Line Capacity Statements 2004-05of each Zonal Railway - Abbreviations: ER(Eastern Railway), HWH(Howrah Division), ASN(Asansol Division), ECR(East Central Railway),DHN(Dhanbad Division), MGS (Mughal Sarai Division), NCR(NorthCentral Railway), ALD(Allahabad Division), NR(Northern Railway), DLI(Delhi Division) *EMU for suburban transport is included
The Feasibility Study on The Development of Dedicated Freight Corridor for Delhi-Mumbai and Ludhiana-Sonnagar in India Final Report (Task 0&1)
Chapter 4 4-9
It is easy to see by looking at these tables that the number of trains for each section of each track segment concurs with the logistical movements shown in the reports by the JICA preliminary investigation groups and the RITES Report. The details are shown below.
Eastern corridor
- Near Howrah and Bardhaman there are many trains that appear to be commuter trains. The number of trains here exceeds 100. These sections have four lines, which is why the number of trains is high.
- In the area of passenger trains, there are basically 40 trains in operation (with the exception of the section from Asansol to Mughal Sarai which has parallel routes). In particular, the section from Kanpur to Delhi has more than 55 passenger trains operating on it.
- In the area of freight trains, the section extending north from Dankuni has more than 20 trains per direction operating on it. And the route west of Sonnagar has a base of more than 30 trains. This is due to the transport of commodities such as coal and iron ore from the Sonnagar region in the east to the Ludhiana region in the north.
Western corridor
- Number of passenger trains per day per direction is about 20 trains though there are trains that enter and exit between Mumbai and Delhi. On the section from Vasai Road to Vadodara, there are many routes that go in all directions around Mumbai and the number of trains is increased to forty or fifty in this section. On the section from Mathura to Delhi, urban commuter rail traffic also gets added, increasing the number of trains to 40 or 60. A similar increase of the number of trains can be seen even in the area around Kota.
- The section from JNPT to Panvel is a dedicated freight track and it is only be used for container trains. The double-track construction for this section was completed in August 2006.
- Container trains already comprise about 30 to 40% of the freight train traffic. There are 9 to 10 trains that head from Mumbai to Delhi, but since some of these trains go to Ahmedabad and Vadodara, there are only 7 trains running to the north of Vadodara. After that, at Bayana, one train goes toward Agra while the remainder appears to go to Tuglakabad.
- Common freight trains enter on the routes going north from Surat. This pushes the number of freight trains up into the mid twenties. The flow of this traffic extends mainly to the Kota area.
Western route (Northern course)
- The number of both passenger and freight trains operating drops in half to the north of Chandlodia.
- Container freight trains from Mumbai come into this route at Ahmedabad.
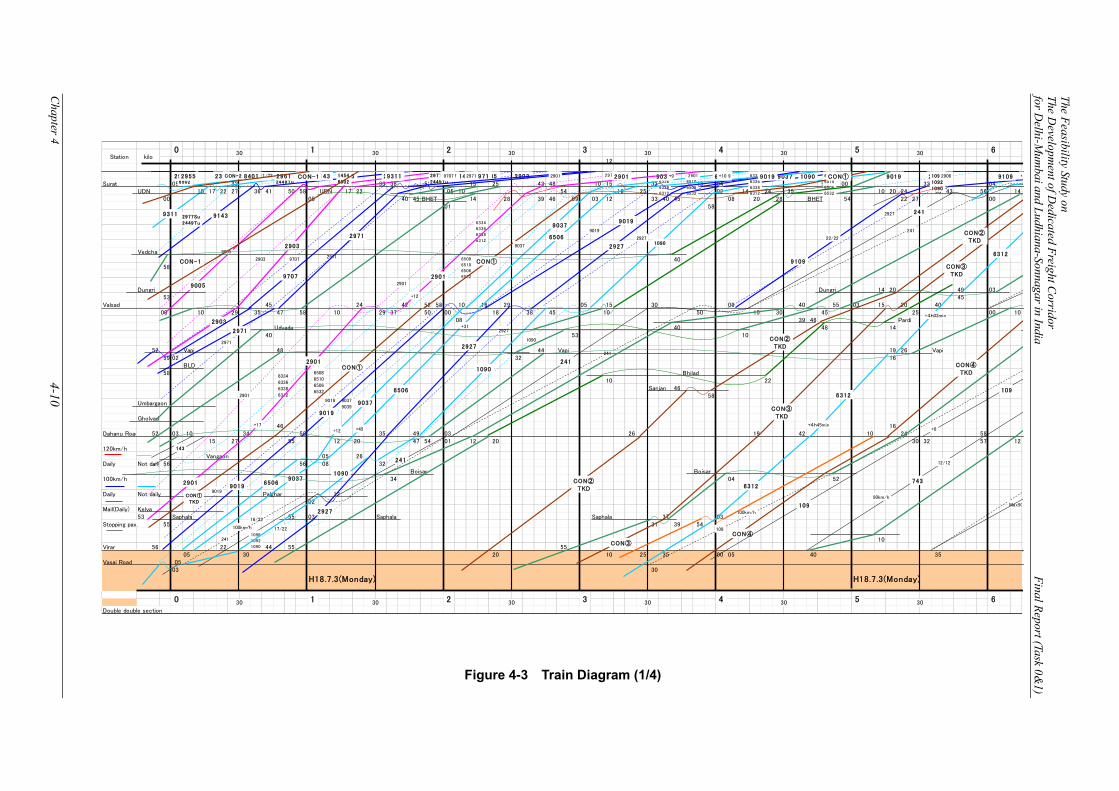
The Feasibility Study on The D
evelopment of D
edicated Freight Corridor
for Delhi-M
umbai and Ludhiana-Sonnagar in India
Final Report (Task 0&1)
Chapter 4
4-10
Figure 4-3 Train Diagram (1/4)
12
10Surat 05 32 33 38 52 57 15 25 43 48 10 15 32 53 04 50 00 33 04
UDN 10 17 22 27 36 41 50 58 UDN 17 22 05 10 54 16 25 47 02 14 24 35 10 20 24 40 43 56 1400 05 40 45 BHET 14 28 39 46 59 03 12 33 40 45 08 20 28 BHET 54 22 27 00
01 58
Vedcha40
58
Dungri Dungri 14 20 49 0353 45
Valsad 45 24 42 52 58 10 16 29 05 15 30 09 40 55 03 15 20 4000 10 29 35 47 58 10 29 37 50 00 18 38 45 10 50 15 30 45 25 00 10
08 39 46 PardiUdvada 40 48 14
40 53 10
52 Vapi 48 44 Vapi 19 26 Vapi59 02 32 16
BLD58 Bhilad
10 22Sanjan 46
58Umbargaon
Gholvad46 16
Dahanu Road 52 03 10 34 58 35 49 03 26 19 42 10 24 5815 27 55 12 20 47 54 01 12 20 30 32 57 12
120km/hVangaon 05 26
Daily Not daily 56 56 08 32Boisar Boisar
100km/h 34 04 52
Daily Not daily Palghar 1202
Mail(Daily) Kelva53 Saphala 55 03 Saphala Saphala 37 03
Stopping pax. 55 31 39 54
10Virar 56 22 44 55 55
05 30 20 10 25 35 00 05 40 35Vasai Road 05
03 30
H18.7.3(Monday) H18.7.3(Monday)
Double double section
0 1 2 330 30 30 4 5 630 30 30
0 1 2 3 4 5 6
Station kilo
30 30 30 30 30 30
109
100km/h
90km/h
743
Max90
12/12
100km/h
1096
1092
1090
16/22
17/22
2901
6334
6336
6338
6312
6508
6510
6506
6532
9037
9039
2927
1090
91432977Su
2449Tu
9311
6334
6336
6338
6312
6508
6510
6506
6532
9037
1090
9311 2977Su
2449Tu9143 9005 2903 6334
6336
6338
6312
9037 6508
6510
6506
6532
2927 1090 910921/221454
65022961 2961 1454
65029311 2977Su
2449Tu9143 9005 2903 9707 2971 2901 6334
6336
6338
6312
9037 6508
6510
6506
6532
9019 29271096
1092
1090
2392955
2901CON①
90199019
9019
9019
6506
6506
+45
+31
9037
9037
+12
241
241
241
241
1090
2927
2927
CON②TKD
CON②TKD
CON③
CON③TKD
6312
CON④
CON④TKD
6312
+4h45min
+4h03min
109
109
+8
2903 9707 2971
2971
2903
2971
2971
1090
2901
143
CON①
TKD
29012901
2927
2927
+17
+12
29719707 29719707
9707
2903
9005
9005
CON-1
CON-18401CON-2 29012901
CON①
9037
6506
+9 6506 CON①
9019
9019
90199019+10
2927
9109
22/22
241
241
+2906
CON②TKD
CON③TKD
6312
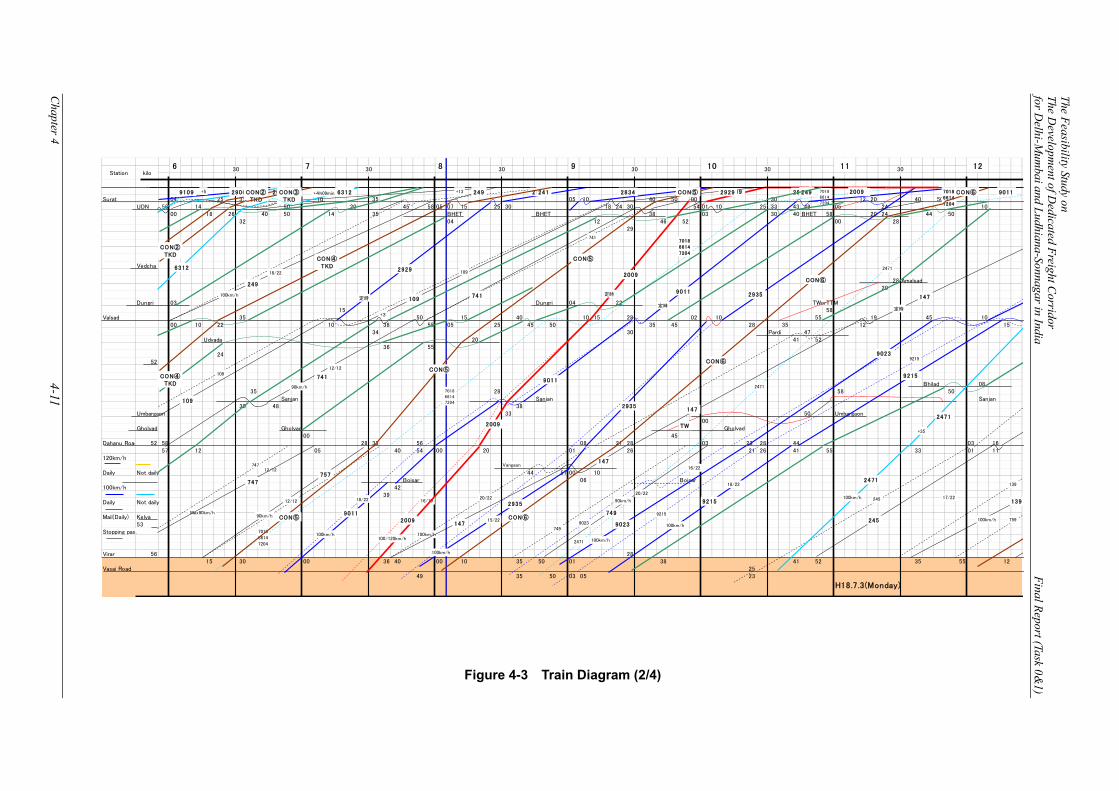
The Feasibility Study on The D
evelopment of D
edicated Freight Corridor
for Delhi-M
umbai and Ludhiana-Sonnagar in India
Final Report (Task 0&1)
Chapter 4
4-11
Figure 4-3 Train Diagram (2/4)
10Surat 04 25 35 45 10 35 05 10 40 50 00 30 12 20 40 50
UDN 56 14 50 20 45 58 05 07 15 25 30 18 24 30 54 01 10 25 33 43 49 05 24 1000 18 26 40 50 14 35 BHET BHET 38 03 30 40 BHET 58 20 24 44 50
32 04 12 46 52 00 2829
Vedcha
28 Amalsad20
Dungri 03 Dungri 04 22 TWorTTM15 58
Valsad 35 50 15 40 10 15 28 02 10 55 19 45 1000 10 22 10 38 55 05 25 45 50 35 45 28 35 12 15
34 30 Pardi 47Udvada 20 41 52
36 5524
52
Bhilad 0835 28 58 50
Sanjan Sanjan Sanjan30 48 38
Umbargaon 33 50 Umbargaon00
Gholvad Gholvad Gholvad00 45
Dahanu Road 52 58 28 33 56 08 21 28 03 23 28 44 03 1657 12 05 40 54 00 20 01 26 21 26 41 55 33 01 11
120km/hVangaon
Daily Not daily 44 57 00 10Boisar 06 Boisar
100km/h 4239
Daily Not daily
Mail(Daily) Kelva53
Stopping pax.
Virar 56 2815 30 00 36 40 00 10 35 50 01 38 41 52 35 55 12
Vasai Road 2549 35 50 03 05 23
H18.7.3(Monday)
11 1230108 96 7 30 30 3030 30Station kilo
Max90km/h
12/12
7018
6614
7204
16/1920/22
100km/h
17/22
109741
90km/h
12/12
7018
6614
7204
16/22
7018
6614
7204
2009
9011 2935 147
9109 241 2929 2834 2009 7018
6614
7204
9011 24717/20 261 9109 241 2929 2834 2009249 7018
6614
7204
9011
CON④TKD
+3
109
109
109
定時
747
747
757
12/12
90km/h CON⑤9011
18/22
100km/h
9011
2009
100/120km/h
2009
147
147
147
2935
2935
100km/h
15/22 CON⑥
CON⑥
90239023
9215
2471
245
100km/h
9023
9215
18/22
100km/h
9215
9215
2471
2471
2471
+35
2471
100km/h
245
139
100km/h
139
759
2929
CON⑤
TW
749
749
20/22
90km/h
定時+5 29062906 19/22
CON②TKD
CON②TKD
CON③TKD
6312
6312+4h09min
18/22
100km/h
249
+13 249
CON④TKD
定時
109
741
CON⑤
CON⑤
定時
CON⑥
CON⑥
定時
741
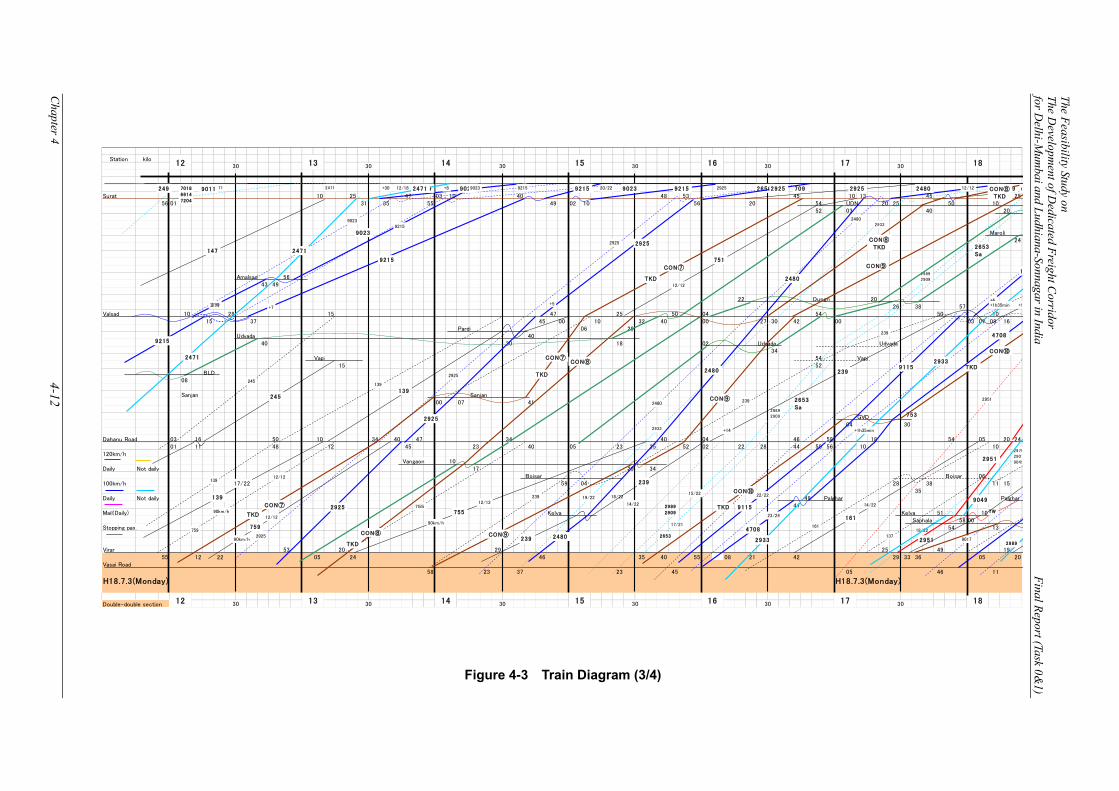
The Feasibility Study on The D
evelopment of D
edicated Freight Corridor
for Delhi-M
umbai and Ludhiana-Sonnagar in India
Final Report (Task 0&1)
Chapter 4
4-12
Figure 4-3 Train Diagram (3/4)
Station kilo
Surat 10 25 47 03 10 40 48 53 45 10 13 45 2556 01 31 35 55 49 02 10 56 20 54 UDN 20 25 50 10
52 03 40 20
Maroli24
Amalsad 5643 49
22 Dungri 2026 38 57
Valsad 10 28 15 47 25 50 04 54 50 1015 37 45 00 10 32 40 00 27 30 42 00 03 07 08 16
Pardi 06 29Udvada 40
40 30 18 02 Udvada Udvada34
Vapi 54 Vapi15 52
BLD08
Sanjan Sanjan00 07 41
GVD04 30
Dahanu Road 03 16 50 10 34 40 47 34 40 04 46 58 18 54 05 20 2401 11 48 12 45 23 40 05 23 35 52 02 22 28 44 50 56 10 10
120km/hVangaon 10
Daily Not daily 17 29 34Boisar Boisar 06
100km/h 59 04 28 38 11 1535
Daily Not daily 49 Palghar Palghar41
Mail(Daily) Kelva Kelva 51 10Saphala 58 00
Stopping pax. 54 13
Virar 53 20 29 25 49 1955 12 22 05 24 46 35 40 55 08 21 42 29 33 36 05 20
Vasai Road58 23 37 23 45 05 46 11
H18.7.3(Monday) H18.7.3(Monday)
Double-double section
17
30 30 30 30 30 30
30 1830 30 3014 15 1612 1330 30
12 13 14 15 16 17 18
90km/h
12/12
14/22
18/2219/2215/22
2989
2909
2653
17/21
2979
2907
9049
18/22
753
2933
2989
2909
2951
751
12/12
2933
2989
2909
2653Sa
2653Sa
2471 905912/18 265620/22 12/12 709 2480 293371112/1290117018
6614
7204
249 2471 9059 9023 9215 2656 2925 709
9215
9215
245
139
759
245
139
17/22
139
CON⑦
TKD
CON⑦
TKD
759
90km/h
12/12
2925
2925
2925
+5
2925
755
239
161
137 99017
2925
2925
CON⑧
TKD
CON⑧
CON⑧TKD
755
90km/h
12/12
CON⑨
CON⑨
239
239
2480
2480
CON⑩
TKD
CON⑩
TKD
9115
22/22
9115
23/24
4708
4708
2933
+1h35min
161
14/22
2951
9049
2951
TW
29332989
147
9023
9023
+8 9023
9215
9215
+7定時
2471
9023
2471
+30 2471 29252925
CON⑦
TKD
9215
2480
2480
2480
CON⑧TKD
CON⑨
C
+4
9
+1h35min
139
239
239
+14
239
+9
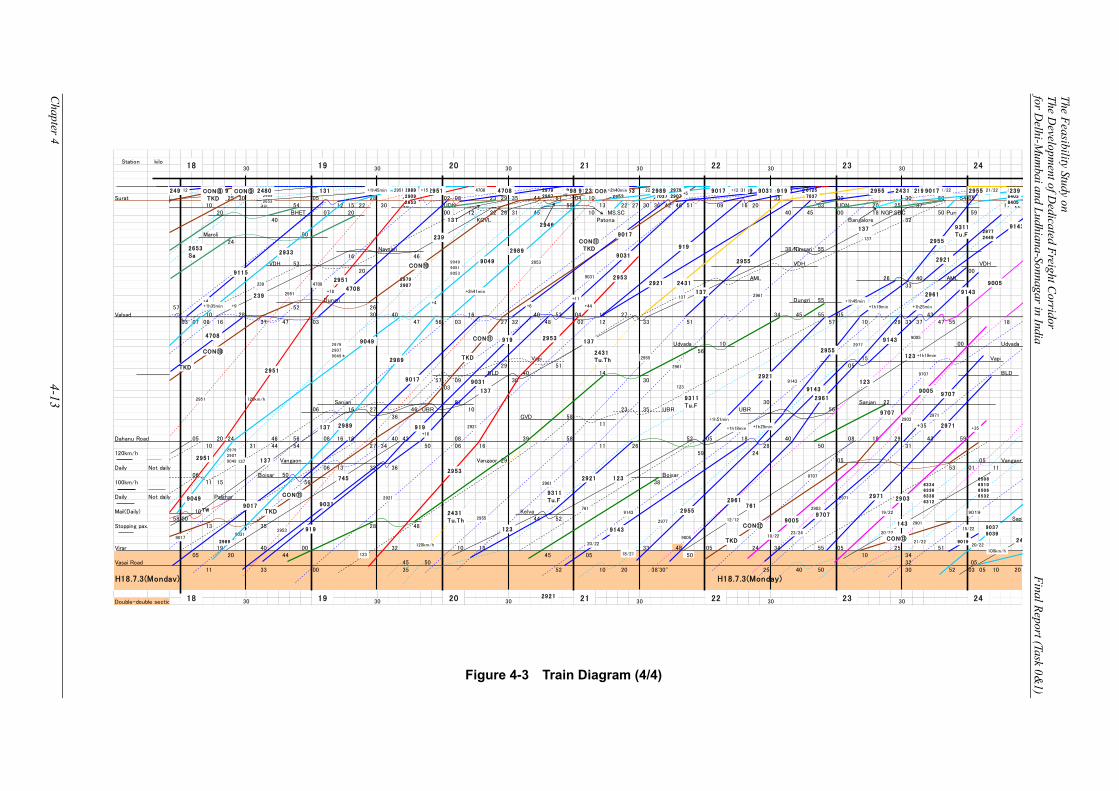
The Feasibility Study on The D
evelopment of D
edicated Freight Corridor
for Delhi-M
umbai and Ludhiana-Sonnagar in India
Final Report (Task 0&1)
Chapter 4
4-13
Figure 4-3 Train Diagram (4/4)
Station kilo
Surat 25 30 05 28 45 02 08 23 29 35 44 51 04 10 41 35 48 00 30 50 54 0510 35 54 12 15 22 30 43 UDN 55 13 22 27 30 36 42 46 51 09 16 20 53 UDN 20 25 37 17 22
20 BHET 07 20 00 12 22 26 31 45 10 MS.SC 40 45 00 18 NGP.SBC 50 Puri 5940 KCVL Patona Bangalore 32
Maroli 0024
Navsari 38 Navsari 5516 46
VDH 53 VDH VDH20 00
AML 26 40 AML33
Dungri Dungri 5557 52 26
Valsad 10 28 30 40 16 40 53 04 12 27 34 45 55 05 4303 07 08 16 37 47 03 47 56 03 27 32 48 02 12 33 51 57 10 29 33 37 47 55 18
Udvada 10 00 Udvada56
Vapi 15 Vapi29 51 05
BLD 40 14 BLD57 09 30 30
03
Sanjan 07 30 Sanjan 2206 16 27 46 UBR 10 23 35 UBR UBR 56
36 GVD 5811
Dahanu Road 05 20 24 46 56 08 16 18 40 43 08 39 58 52 05 18 40 08 18 29 43 5910 31 44 54 27 34 50 06 16 11 26 28 50 31
120km/h 59 24Vangaon Vangaon 29 05 05 Vangaon
Daily Not daily 06 13 32 36 53 01 1106 Boisar 50 Boisar
100km/h 11 15 56 38
Daily Not daily Palghar
Mail(Daily) 10 Kelva58 00 44 52 Saph
Stopping pax. 13 35 28 48
Virar 19 40 00 32 10 18 33 48 05 24 34 55 05 25 5105 20 44 45 05 50 10 34
Vasai Road 45 50 32 0511 33 00 35 52 10 20 38'30'' 25 40 50 30 52 03 05 10 20
H18.7.3(Monday) H18.7.3(Monday)
Double-double sectio 30 30 30 24
30 30
22 2330 30 30
30 30 3018 19 20 21 22 2330 24
20 2118 19
2979
2907
9049
2921
9311Tu.F
18/21
6334
6336
6338
6312
6508
6510
6506
6532
21/22
15/22 90379039
20/22
2951 120km/h
2979
2907
9049*
120km/h
9707
2653Sa
239
2979
2907
9049
9051
9053
2921 2431
2955
91432977
2449
9005
24
100km/h
293371112/12 2989
2909
2653
131 2979
29072953 6125
7037
22/22 2431 2955 2961
137
239 650221/22 8401
8403
8405
21/22249 709 2480 2989
2909
2653
711 2989 2909
26539115 2951 9115 4708 2979
29072953 6125
70372392431 9031 29559017
90319017
CON⑩
TKD
4708
137
2953
9049
2951
2951
TW
137
137
137
CON⑪
TKD
CON⑪
TKD
9049
9017
9017
2989
2989
2989
745
2921
123
2955
2953
2921
2961
2431Tu.Th
2953
2953
2953
+44
2431Tu.Th
137
761
2955
2961
123
9311Tu.F
123
123
+1h18min
123
2921
9311Tu.F
2921
9143
2977
9143
20/22
9143
9143
9143
9143
2977
2955
2955
+1h25min
+1h19min
2971
90192903
9707
9005
9005
2961
2961
+1h51min
29612961
123
761
12/12
CON⑫
TKD
9005
18/22
9005
2903
9707
2971
2901
9707
23/24
9707
2971
2971
2903
19/22
+35
143
20/22
CON⑬9019
+35
CON⑧TKD
CON⑨
+4
9115
+1h35min
2933
2933+1h45min
239
239
+9
+5239
47084708
CON⑩
2951+152951
2951 +18
2951
4708 4708
2946
CON⑩
131
+4
9049
2989
2989
+2h41min
+2h40min
CON⑪TKD
9017
9017
+6
+5
9031
9031
9031
9031
+11
9031+12 9031
+16
919
919
919
919
919
137
137
137
2921
+1h45min
2955
+1h19min +1h25min
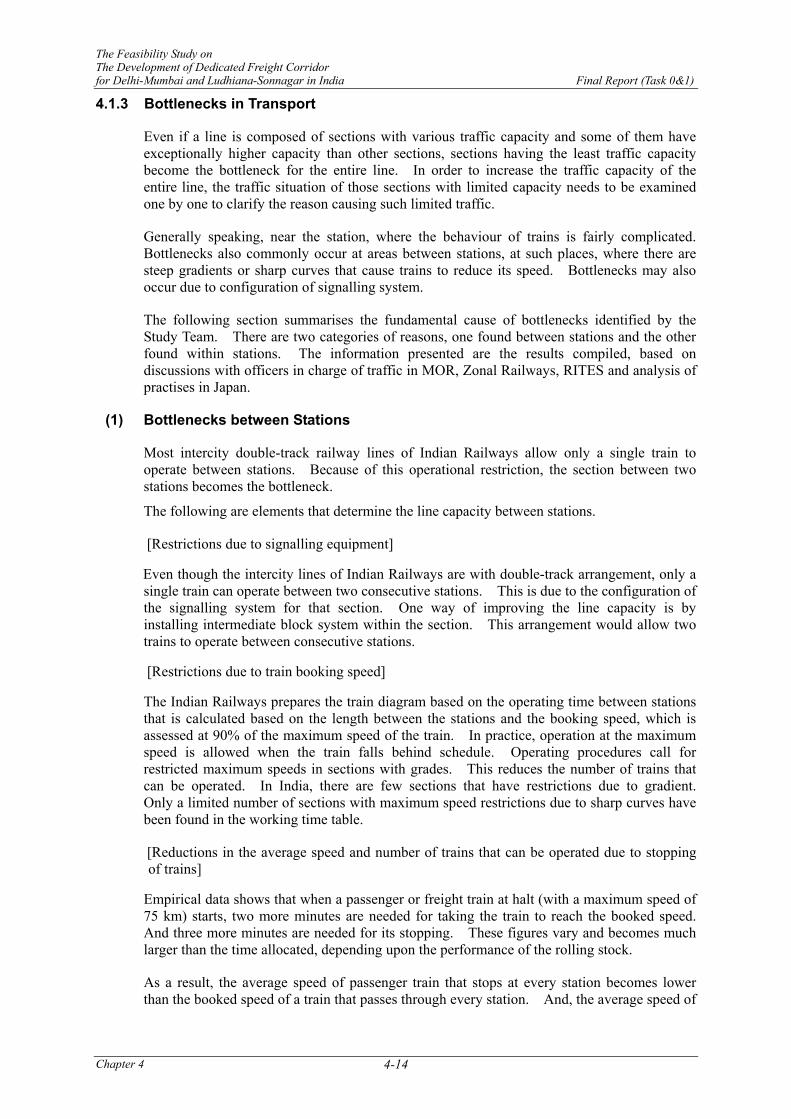
The Feasibility Study on The Development of Dedicated Freight Corridor for Delhi-Mumbai and Ludhiana-Sonnagar in India Final Report (Task 0&1)
Chapter 4 4-14
4.1.3 Bottlenecks in Transport
Even if a line is composed of sections with various traffic capacity and some of them have exceptionally higher capacity than other sections, sections having the least traffic capacity become the bottleneck for the entire line. In order to increase the traffic capacity of the entire line, the traffic situation of those sections with limited capacity needs to be examined one by one to clarify the reason causing such limited traffic.
Generally speaking, near the station, where the behaviour of trains is fairly complicated. Bottlenecks also commonly occur at areas between stations, at such places, where there are steep gradients or sharp curves that cause trains to reduce its speed. Bottlenecks may also occur due to configuration of signalling system.
The following section summarises the fundamental cause of bottlenecks identified by the Study Team. There are two categories of reasons, one found between stations and the other found within stations. The information presented are the results compiled, based on discussions with officers in charge of traffic in MOR, Zonal Railways, RITES and analysis of practises in Japan.
(1) Bottlenecks between Stations
Most intercity double-track railway lines of Indian Railways allow only a single train to operate between stations. Because of this operational restriction, the section between two stations becomes the bottleneck.
The following are elements that determine the line capacity between stations.
[Restrictions due to signalling equipment]
Even though the intercity lines of Indian Railways are with double-track arrangement, only a single train can operate between two consecutive stations. This is due to the configuration of the signalling system for that section. One way of improving the line capacity is by installing intermediate block system within the section. This arrangement would allow two trains to operate between consecutive stations.
[Restrictions due to train booking speed]
The Indian Railways prepares the train diagram based on the operating time between stations that is calculated based on the length between the stations and the booking speed, which is assessed at 90% of the maximum speed of the train. In practice, operation at the maximum speed is allowed when the train falls behind schedule. Operating procedures call for restricted maximum speeds in sections with grades. This reduces the number of trains that can be operated. In India, there are few sections that have restrictions due to gradient. Only a limited number of sections with maximum speed restrictions due to sharp curves have been found in the working time table.
[Reductions in the average speed and number of trains that can be operated due to stopping of trains]
Empirical data shows that when a passenger or freight train at halt (with a maximum speed of 75 km) starts, two more minutes are needed for taking the train to reach the booked speed. And three more minutes are needed for its stopping. These figures vary and becomes much larger than the time allocated, depending upon the performance of the rolling stock.
As a result, the average speed of passenger train that stops at every station becomes lower than the booked speed of a train that passes through every station. And, the average speed of
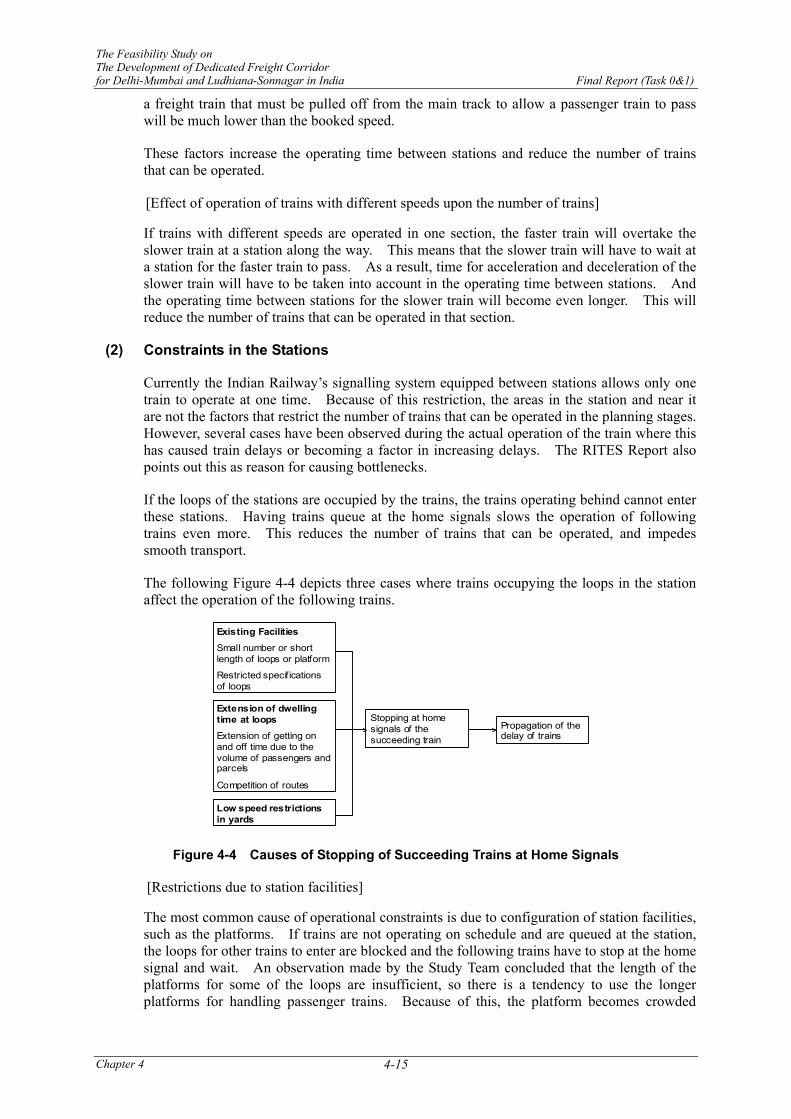
The Feasibility Study on The Development of Dedicated Freight Corridor for Delhi-Mumbai and Ludhiana-Sonnagar in India Final Report (Task 0&1)
Chapter 4 4-15
a freight train that must be pulled off from the main track to allow a passenger train to pass will be much lower than the booked speed.
These factors increase the operating time between stations and reduce the number of trains that can be operated.
[Effect of operation of trains with different speeds upon the number of trains]
If trains with different speeds are operated in one section, the faster train will overtake the slower train at a station along the way. This means that the slower train will have to wait at a station for the faster train to pass. As a result, time for acceleration and deceleration of the slower train will have to be taken into account in the operating time between stations. And the operating time between stations for the slower train will become even longer. This will reduce the number of trains that can be operated in that section.
(2) Constraints in the Stations
Currently the Indian Railway’s signalling system equipped between stations allows only one train to operate at one time. Because of this restriction, the areas in the station and near it are not the factors that restrict the number of trains that can be operated in the planning stages. However, several cases have been observed during the actual operation of the train where this has caused train delays or becoming a factor in increasing delays. The RITES Report also points out this as reason for causing bottlenecks.
If the loops of the stations are occupied by the trains, the trains operating behind cannot enter these stations. Having trains queue at the home signals slows the operation of following trains even more. This reduces the number of trains that can be operated, and impedes smooth transport.
The following Figure 4-4 depicts three cases where trains occupying the loops in the station affect the operation of the following trains.
Existing FacilitiesSmall number or short length of loops or platform
Restricted specif ications of loops
Extension of dwelling time at loopsExtension of getting on and off time due to the volume of passengers and parcels
Competition of routes
Low speed restrictions in yards
Stopping at home signals of the succeeding train
Propagation of the delay of trains
Figure 4-4 Causes of Stopping of Succeeding Trains at Home Signals
[Restrictions due to station facilities]
The most common cause of operational constraints is due to configuration of station facilities, such as the platforms. If trains are not operating on schedule and are queued at the station, the loops for other trains to enter are blocked and the following trains have to stop at the home signal and wait. An observation made by the Study Team concluded that the length of the platforms for some of the loops are insufficient, so there is a tendency to use the longer platforms for handling passenger trains. Because of this, the platform becomes crowded
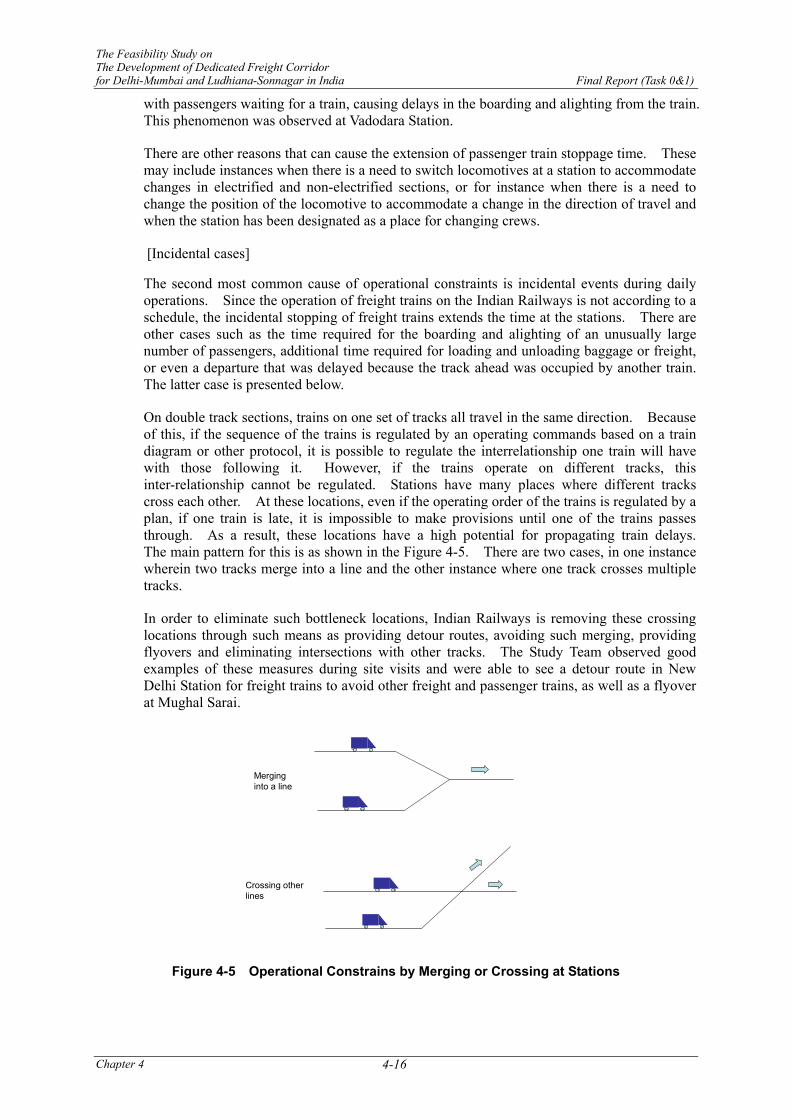
The Feasibility Study on The Development of Dedicated Freight Corridor for Delhi-Mumbai and Ludhiana-Sonnagar in India Final Report (Task 0&1)
Chapter 4 4-16
with passengers waiting for a train, causing delays in the boarding and alighting from the train. This phenomenon was observed at Vadodara Station.
There are other reasons that can cause the extension of passenger train stoppage time. These may include instances when there is a need to switch locomotives at a station to accommodate changes in electrified and non-electrified sections, or for instance when there is a need to change the position of the locomotive to accommodate a change in the direction of travel and when the station has been designated as a place for changing crews.
[Incidental cases]
The second most common cause of operational constraints is incidental events during daily operations. Since the operation of freight trains on the Indian Railways is not according to a schedule, the incidental stopping of freight trains extends the time at the stations. There are other cases such as the time required for the boarding and alighting of an unusually large number of passengers, additional time required for loading and unloading baggage or freight, or even a departure that was delayed because the track ahead was occupied by another train. The latter case is presented below.
On double track sections, trains on one set of tracks all travel in the same direction. Because of this, if the sequence of the trains is regulated by an operating commands based on a train diagram or other protocol, it is possible to regulate the interrelationship one train will have with those following it. However, if the trains operate on different tracks, this inter-relationship cannot be regulated. Stations have many places where different tracks cross each other. At these locations, even if the operating order of the trains is regulated by a plan, if one train is late, it is impossible to make provisions until one of the trains passes through. As a result, these locations have a high potential for propagating train delays. The main pattern for this is as shown in the Figure 4-5. There are two cases, in one instance wherein two tracks merge into a line and the other instance where one track crosses multiple tracks.
In order to eliminate such bottleneck locations, Indian Railways is removing these crossing locations through such means as providing detour routes, avoiding such merging, providing flyovers and eliminating intersections with other tracks. The Study Team observed good examples of these measures during site visits and were able to see a detour route in New Delhi Station for freight trains to avoid other freight and passenger trains, as well as a flyover at Mughal Sarai.
Merging into a line
Crossing other lines
Figure 4-5 Operational Constrains by Merging or Crossing at Stations
The Feasibility Study on The Development of Dedicated Freight Corridor for Delhi-Mumbai and Ludhiana-Sonnagar in India Final Report (Task 0&1)
Chapter 4 4-17
Figure 4-6 elaborates on the examples found in Figure 4-5 in which trains bound in different directions have a conflict.
Figure 4-6 summarizes the routes in the yard at Surat Station. This station also has a goods yard on one side of the station yard. The common loop is on the goods yard side of the station. In automatic double line the direction of the lines are normally fixed though trains can run in both directions in ABS mode. With this route alignment, a down train must cross the up main track when taking refuge on a common loop. This causes a route conflict for both down and up trains. Many of the down trains have to wait for long time at the outside of the home signal. The Study Team investigated the line capacity on the preconditions that these route conflicts among up and down trains are eliminated.
Route conflict
Route conflict
Route modification
Down
Down
Up
Up
Common loop
Common loop
Figure 4-6 Route Conflict for Up and Down Tracks and its Resolution
[Low in-yard transfer speed]
The third common cause of operational constraints is the low speed at which trains stopping at a station move through stations. Because the speed limit for trailing speed over a turnout is limited to 15 km/h, the operating speed throughout the entire station premise is dictated at a slower speed. As a result, it would have the same effect as the train retention time in a loop.
(3) Identification of Bottleneck Sections by Comparison of Actual Line Capacities
When the number of the trains of the line capacity and the actual train number are compared, it reveals the areas that are currently restricting traffic. Figure 4-7 to Figure 4-9 present the restricted situation of the traffic capacity between Dadri and Kanakpur on the Western route; near Kota, between Dahanu Road and Vadodara, Ratlam and Nagda, and Mathura and Tuglakabad on the Eastern route.
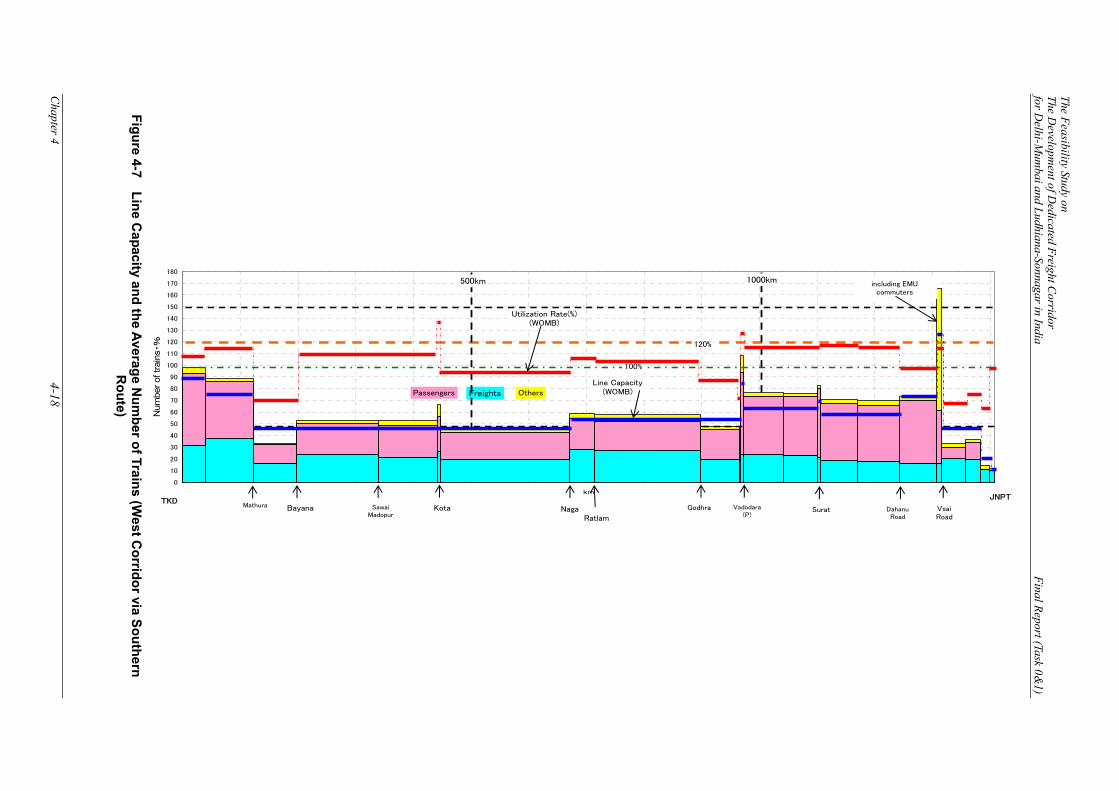
The Feasibility Study on The D
evelopment of D
edicated Freight Corridor
for Delhi-M
umbai and Ludhiana-Sonnagar in India
Final Report (Task 0&1)
Chapter 4
4-18
Figure 4-7 Line C
apacity and the Average Num
ber of Trains (West C
orridor via Southern R
oute)
0
10
20
30
40
50
60
70
80
90
100
110
120
130
140
150
160
170
180
km
Num
ber o
f tra
ins ・
%
TKDVsaiRoad
DahanuRoad
SuratVadodara(P)
Godhra
RatlamNagaSawai
MadopurBayanaMathura
JNPT
Kota
Line Capacity(WOMB)
Utilization Rate(%)(WOMB)
Passengers Freights Others
120%
100%
500km 1000km including EMUcommuters
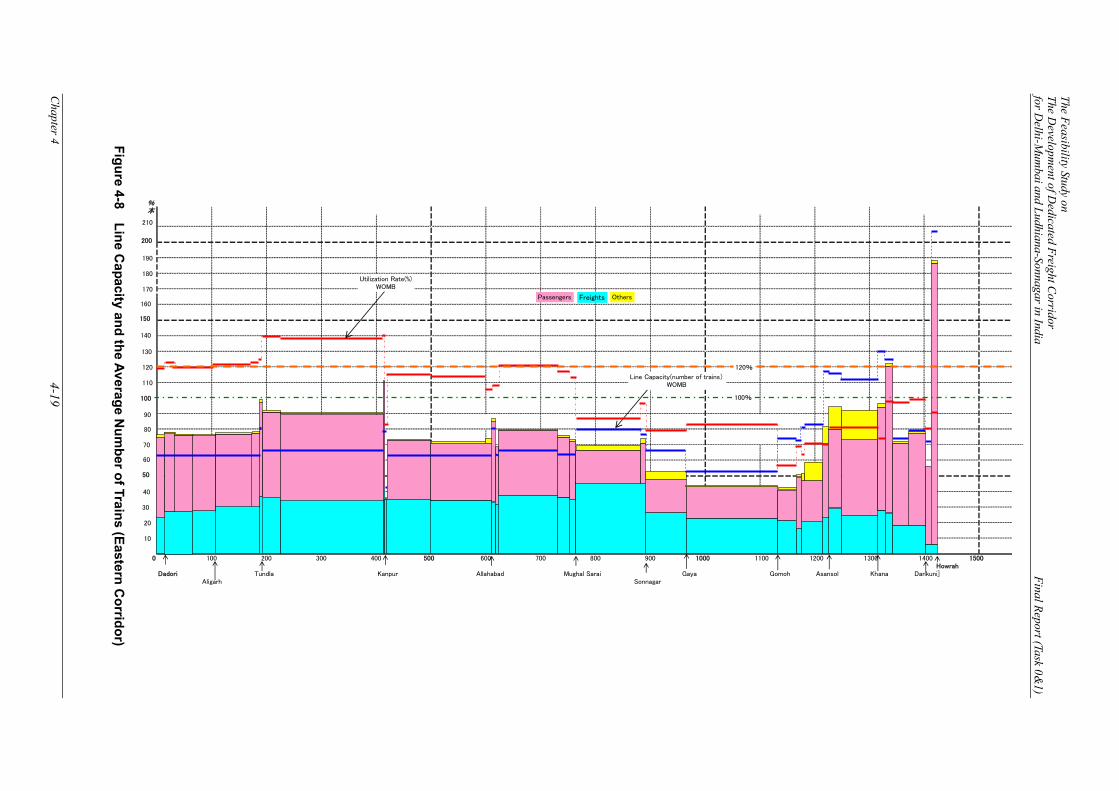
The Feasibility Study on The D
evelopment of D
edicated Freight Corridor
for Delhi-M
umbai and Ludhiana-Sonnagar in India
Final Report (Task 0&1)
Chapter 4
4-19
Figure 4-8 Line C
apacity and the Average Num
ber of Trains (Eastern Corridor)
%本
0 100 200 300 400 500 600 700 800 900 1000 1100 1200 1300 1400 1500Howrah
Dadori Tundla Kanpur Allahabad Mughal Sarai Gaya Gomoh Asansol Khana Dankuni]Aligarh Sonnagar
10
30
20
40
50
60
70
80
90
100
120
130
140
150
110
160
170
180
200
190
210
Utilization Rate(%)WOMB
Line Capacity(number of trains)WOMB
Passengers Freights Others
120%
100%
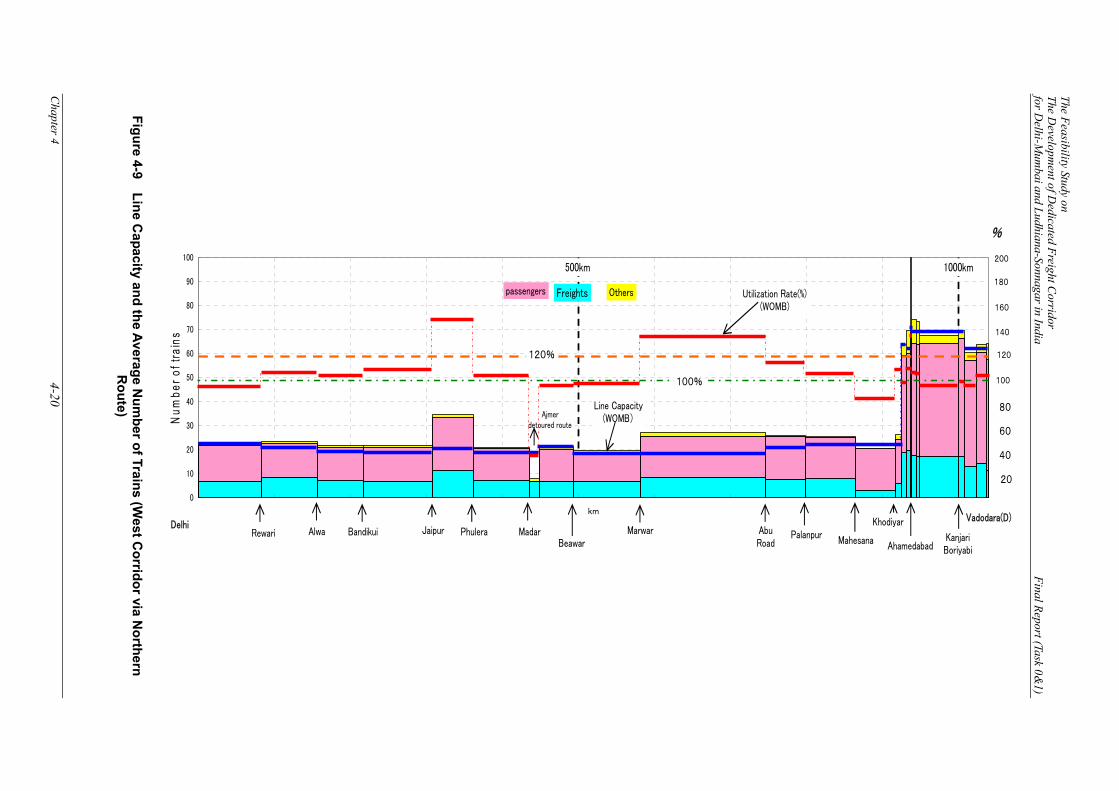
The Feasibility Study on The D
evelopment of D
edicated Freight Corridor
for Delhi-M
umbai and Ludhiana-Sonnagar in India
Final Report (Task 0&1)
Chapter 4
4-20
Figure 4-9 Line C
apacity and the Average Num
ber of Trains (West C
orridor via Northern
Route)
Khodiyar
0
10
20
30
40
50
60
70
80
90
100
km
Num
ber o
f tra
ins
MadarAlwaRewariDelhi
PhuleraBandikui PalanpurMarwarBeawar
100
80
60
40
20
180
160
140
120
200
%
passengers Freights Others
1000km500km
Utilization Rate(%)(WOMB)
Line Capacity(WOMB)Ajmer
detoured route
Vadodara(D)Jaipur Abu
Road Mahesana
Khodiyar
AhamedabadKanjariBoriyabi
100%
120%

The Feasibility Study on The Development of Dedicated Freight Corridor for Delhi-Mumbai and Ludhiana-Sonnagar in India Final Report (Task 0&1)
Chapter 4 4-21
4.1.4 Freight Train Diagrams and Traffic Control
(1) Freight trains without time table
No fixed schedules are made for freight trains in Indian Railways. In principle, once a freight train is loaded and ready to depart, it is operated during an interval in passenger train operation.
A major demerit of operating without a freight train schedule is that the date and time of arrival cannot be specified in advance.
(2) Organising schedules giving higher priority to freight trains
The Study Team has observed that on Indian Railway, a freight train never passes a passenger train on Indian Railways. The only exception is when a freight train passes a passenger train that is stopping at every station.
It is not uncommon for a freight train to be pulled off the main track at a station along the way, to allow a passenger train to pass. Freight trains have lower maximum speeds than passenger trains. Passenger trains have train schedules. This means that in order to maintain the schedule, the passenger train must overtake the slower freight operating ahead of it.
The punctual operation of the freight trains cannot be maintained due to this priority given to passenger trains.
It seems that when the freight trains are given the same priority as passenger trains, traffic control will be carried out from the standpoint of minimizing overall delay. When this occurs, delay causes such as the incidental refuge of freight trains to a loop to allow passenger trains pass will be drastically reduced.
(3) Freight Train Operation System with time table
Freight trains in India do not have a time schedule. The main reason behind it is that, perhaps Indian Railways assumes that there is no reason to operate a freight train if there is no freight to transport and if a station that normally does not have freight suddenly needs to ship freight, a train can be quickly arranged to do it. It is felt however, that it is still possible to respond in this manner, even if a train timetable is established for freight trains.
In Japan, all freight trains have operating schedules. Based on the experience in Japan to have a schedule for freight trains offers the following four merits.
1) It clarifies the arrival time of all trains.
2) It improves the utilization efficiency of the locomotives and crews.
3) It improves safety by providing advance notification of the operating schedule to track maintenance crews and level crossing attendants. (In practice, the intervals during which major maintenance can be carried out, is made clear in advance in India.)
4) Train delays causing problems in train operation can be identified and corrected based on this information. (Train delay suggests that there are some problems against normal train operation)
A master chart is created for counting the charted line capacities. The schedule for freight train operation is included in the master chart. On some Divisional Railways, train numbers and schedules for high-speed freight trains, such as container trains are fixed. In addition, at Tuglakabad, container trains arrive at approximately the same time every day. It is
The Feasibility Study on The Development of Dedicated Freight Corridor for Delhi-Mumbai and Ludhiana-Sonnagar in India Final Report (Task 0&1)
Chapter 4 4-22
envisioned that the time will come when operating schedules for freight trains will have to be created for the entire Indian Railways system.
4.2 STATIONS / YARDS
4.2.1 Role of stations/yards on existing trunk lines for freight traffic
The corridors of Delhi to Mumbai and Delhi to Howrah, Ludhiana to Khurja, include the most important routes for freight and passenger traffic on Indian Railways. Here two trunk lines pass through: Delhi-Mumbai Main Line (Delhi-Mathura-Kota-Vadodara-Vasai Rd.-Mumbai: 1,541 km) and Delhi-Howrah Main Line (Delhi-Tundla-Kanpur-Allahabad-Mughal Sarai-Sonnagar-Asansol-Howrah: 1,462 km). The traffic capacity on these trunk lines is being strained by the dramatic increase of volume of railway traffic brought on by remarkable economic growth of India.
This is particular in freight transport. Freight trains are being operated at the length of rakes close to the limit, which is the Indian Railways’ standard effective length of track (CSR), i.e. 686 m, and has no other way to accommodate the traffic demand other than to increase the operating number of trains.
Demand for passenger service, particularly demand for long-distance express trains that link major cities, has also increased to the point that it is difficult to get a reserved seat.
A careful examination of the current conditions of stations/yards that play an important role in the functioning of these trunk lines is undertaken, in order to identify the problems that are depleting the line capacity and the measures to be undertaken.
On these sections of lines there are various types of stations/yards. For the purpose of this study, they have been classified as follows: 1) large scale multifunction stations/yards, 2) marshalling yards, 3) medium scale stations/yards, 4) intermediate stations (with loops), 5) intermediate stations (without loops). (Note that these classifications are not the official classifications used by Indian Railways, but rather are classifications devised by the Study Team based on the actual function and scale of these facilities.).
4.2.2 Large-scale multifunction station/yards
Large-scale multifunction stations/yards are located in major cities and where trunk lines converge. Generally speaking, Indian Railways does not use separate stations for passenger and freight services. Nearly all of the major stations have large-scale multifunction stations/yards that include a combination of facilities such as the following: passenger station, freight station (loading/unloading sidings, including private sidings/lead-in tracks), locomotive depot, passenger car depot and freight wagon depot.
The location of these large-scale multifunction stations/yards is as follows. On the Delhi-Mumbai Main Line on the Western Corridor, they can be found at Delhi, New Delhi, Tuglakabad, Mathura, Kota, Ratlam, Vadodara, Mumbai Central and other stations. On the Delhi-Howrah Main Line on the Eastern Corridor they can be found at Delhi, Ghaziabad, Tundla, Kanpur, Allahabad, Mughal Sarai, Andal, Howrah and other locations. And there are several large-scale multifunction stations/yards on the northern route of the Western Corridor, such as at Ahmedabad and Sabarmati.
These large-scale multifunction stations/yards as well as the marshalling yards feature a long, vast yard with numerous turnouts that connect the tracks to the various facilities. The most common design is to have a passenger station section and a freight station section located in a long, linear configuration. Because of this, there are many cases where the combination of
The Feasibility Study on The Development of Dedicated Freight Corridor for Delhi-Mumbai and Ludhiana-Sonnagar in India Final Report (Task 0&1)
Chapter 4 4-23
the speed restrictions at the turnouts and the speed restrictions for design or maintenance reasons causes the overall speed in these locations to be 15 km/hr (some places it is even 10 km/hr), forcing trains to take a long time to pass through a station, delaying the arrival time of both freight and passenger trains and thereby reducing the line capacity. (More about the issue of speed restrictions at turnouts is presented later.) An example of this is the Allahabad station on the Eastern Corridor. It has a yard length of approximately 2.4 km and it takes 12 minutes for a 650 m freight train to pass through at a speed of 15 km/hr.
In addition interference due to level crossings caused by such as branching and leading into/out of reception/departure tracks etc. also reduces line capacity. The Indian Railways has many branch lines directly connected to these stations by level crossings. There are locations where the trunk lines are branched by grade separation, such as the one at Mughal Sarai, but such facilities are still rare.
Accordingly, the main issues faced by these large-scale multifunction stations/yards are the time required for passing through them and the interference due to the level crossings. Improving these issues will help to shorten travel time and increase line capacity.
Since these stations are quite large, it is not economically feasible to make radical improvements to them. Therefore, it is desirable that improvements be made to increase the efficiency effectively concerning the above issues. Compared to the time when these facilities were built, there have been many changes to the transport structure, such as those shown below.
- All freight transport is now done by unit trains. This makes it unnecessary for trains to stop and they can simply pass through stations except for occasions such as: when on the reception/departure track of the forwarding station and the receiving station, taking refuge, waiting for the clearance of the main track, changing locomotive(s), changing crews and for car examinations (when such examination has been planned for a mid-way station).
- As the unit train method is used, there is no coupling/uncoupling of a part of the train at an intermediate station.
- Passenger service has become mainly medium and long distance express trains linking major cities and commuter service in the large city areas. Transportation to local destinations has been taken over by automobiles and the role of railways for this service will be reduced.
It is therefore desirable to make improvements to meet these conditions. Improvements are mainly removal of disused items and replacing devices by better ones. Major restructuring has been avoided as much as possible.
- The role of each of the current stations/yards has to be re-examined so that unnecessary tracks can be eliminated, thereby reducing the number of turnouts.
- Routes that are not frequently used and those that can be re-routed should be eliminated, thereby reducing the number of turnouts.
- Double slip switches (DSS) that require cumbersome maintenance, on main tracks, should be eliminated as much as possible.
- The use of 1/8.5 turnouts which are on main tracks and auxiliary main tracks should be eliminated.
- It would be ideal if the level crossings at branch lines could be eliminated by converting them into grade-separated crossings. However, if this cannot be done, the tracks should be arranged so that there is no simultaneous interference to main tracks for both traffic directions. This can be accomplished by installing a loop between both the main tracks.

The Feasibility Study on The Development of Dedicated Freight Corridor for Delhi-Mumbai and Ludhiana-Sonnagar in India Final Report (Task 0&1)
Chapter 4 4-24
Since the planned diagram and actual operation for each direction on the main line is determined independently, it enables smooth operation on a double track.
- If the yard area is long, the yard can be divided into individual block sections and second home signals can be installed, enabling the following trains to approach.
This allows the relaxation of speed restrictions applied to the entire large-scale multifunction station/yard and limit the speed restrictions applied at specific areas.
Much of the freight being handled is bagged goods that are transferred to and from trucks at loading/unloading sidings, not only at large-scale multi-function station/yards, but also at medium-scale stations and intermediate stations. In the future, this should be changed to domestic container transport. Consolidation of these stations into a container terminal can be considered since goods are distributed/gathered by trucks, some distance of which is not a problem. This would also allow for a rearrangement of the loading/unloading siding and reception/departure tracks at many of the stations.
It should be noted that even if the current practice of loading and unloading at stations remains, it will enable the stations handling the freight to consolidate activities in consideration of the total volume of freight for the area. When the large-scale multifunction stations/yards are already located in densely populated areas with poor access due to traffic conditions, consolidating the loading/unloading sidings for these stations/yards outside the city would be effective for both streamlining yard operations and improving road traffic conditions.
4.2.3 Marshalling yards
In the era when freight was handled by marshalling yards and yard-to-yard operation systems, freight trains used to have the following flow of operations from the forwarding station to the receiving station.
- Forwarding station Marshalling yard in the vicinity of forwarding station Sorting by directions of travel Marshalling yard in the vicinity of receiving station Sorting by stations Receiving station.
At present, the Indian Railways applies the unit train method by which single train units are sent from the forwarding station to the receiving station directly. Because of this, the marshalling yards that were located throughout the country, one time, and played such an important role are no longer required. However, these spacious yards still exist to this day. A good example of this includes the Mughal Sarai Yard and Andal Yard on the Delhi-Howrah Main Line on the Eastern Corridor.
In the present time, marshalling yards do not play a role in sorting, but still function in much the same manner as large-scale multifunction stations/yards.
Among these marshalling yards is the Mughal Sarai eastbound yard located almost midway along the Eastern Corridor where empty wagons, mainly those wagons used by freight trains hauling coal from the east to west, pass through. This yard is now used as a coal wagon inspection station. In other words, inspection is performed on the eastbound returning empty coal wagons, and the wagons requiring repair are separated at sorting tracks from those not requiring repair and new rakes are assembled using wagons that were repaired and wagons that did not need repair.
While most of the marshalling yards no longer serve as sorting tracks, a major renovation is too costly to be performed.
The Feasibility Study on The Development of Dedicated Freight Corridor for Delhi-Mumbai and Ludhiana-Sonnagar in India Final Report (Task 0&1)
Chapter 4 4-25
It should be noted that since marshalling yards offer the same function as large-scale multifunction stations/yards, they include such facilities as passenger stations, freight stations (loading/unloading sidings, including private siding/lead-in tracks), multi-function depots of rolling stock.
The issues facing marshalling yards are basically the same as those for large-scale multifunction stations/yards, which was mentioned earlier. While major renovations are not economically feasible, it is inevitable to increase the speed of train movement in the yards by improving the track layout. The objective is to reduce the number of turnouts, and reinforcing the structures to enable these marshalling yards to take on a new role that has changed.
The land for sorting tracks that remains in the marshalling yards is an extremely valuable asset. It can be used as rolling stock depots, facility maintenance depots in future plans for fortifying traffic capacity, or even as land for the development of the much-anticipated Inland Container Depot (ICD), etc.
4.2.4 Medium scale station/yard
Medium-scale stations/yards generally offer facilities such as the following: refuge tracks, passenger platforms, freight facilities (reception/departure tracks, loading/unloading sidings and private sidings/lead-in tracks). The network of Indian Railways is developing in a web-like pattern that has many junctions. Most of these junctions are medium-scale station/yards. Like the large-scale multifunction station/yards, a respectable number of medium-scale station/yards have speed restrictions that cover the entire station premises.
While the issues facing these medium-scale stations/yards are basically the same as those for large-scale multifunction stations/yards, it also reduces the speed restrictions which are relatively easier since there are fewer turnouts.
4.2.5 Intermediate stations
In terms of the number of stations, intermediate stations (with loops) that have only refuge tracks (loops) and passenger platforms are the most common.
Nearly all stations on the Delhi-Mumbai Main Line on the Western Corridor and on the Delhi-Howrah Main Line on the Eastern Corridor have refuge tracks because of the heavy traffic on these lines. Only a few stations do not have refuge tracks.
Most of these stations have a loop on each side of the main tracks of a double track. Some stations have only one loop on one side or between each main track of the double track so that it can be used by trains on either direction.
Refuge tracks of intermediate stations function sufficiently on lines that have a large number of trains travelling at significantly different speeds, such as super express passenger trains, express passenger trains, local passenger trains (i.e., those that stop at every station), high-speed freight trains (i.e., trains made up of the new type container flat wagons that are capable of travelling at 100 km/hr), and regular freight trains. However, the important factors here are improvement of line capacity and reduction of the travel time of low-speed trains, especially freight trains. And even though the high-speed freight trains are capable of travelling at 100 km/hr while super express and express trains can travel at 110 to 130 km/hr, the heavy load of the freight train means it will have slow acceleration after each temporary stop, so there are still many instances for it to be overtaken despite its fast maximum speed. This underscores the importance of refuge tracks.

The Feasibility Study on The Development of Dedicated Freight Corridor for Delhi-Mumbai and Ludhiana-Sonnagar in India Final Report (Task 0&1)
Chapter 4 4-26
There are two issues facing the intermediate stations.
- Excessively long distance between successive refuge tracks on all routes needs to be eliminated.
- The turnout for refuge tracks should be replaced to those that allow higher speed entry and exit. (See 6.2.6 for more information about turnouts.)
Currently both main lines have refuge tracks that are basically satisfactory in condition. However, in order to realise smooth transport, there is a need to further improve them to improve the conditions referred above.
On the main lines, there are also some sections that have three or four tracks. However, since these sections have a number of trains operating on them, and since these trains travel at various speeds, there is clearly a need for properly arranging the refuge tracks. It should be noted that, even though there are three tracks, the main track in the middle cannot be used simultaneously for both directions of travel and the refuge tracks play a large role because the trains of one direction have to be constrained to travel on one track when both directions are occupied.
4.2.6 Travel speed at turnouts
Nearly all of the turnouts used by Indian Railways are either 1/12 or 1/8.5. The speed restrictions for these turnouts are set at 30 km/hr and 15 km/hr respectively. (When it is a straight point, 1/12 also has a speed restriction of 15 km/h.)
In addition, due to problems in maintenance, double slip switches (DSS) / single slip switches (SSS) and diamond crossings have 15 km/h speed restrictions. In practice, there are some locations where the restriction is 10 km/hr.
And, in most of the large-scale multifunction station/yards where turnouts and DSS/SSS are extensively used, the speed restrictions for the entire yard are set at 15 km/hr due to its complex arrangement and the necessity of maintenance.
The following improvement is needed in response to this.
- The speed restrictions for the turning sides of turnouts should be increased.
- Reduction of the continuous speed restrictions for the entire yard at large-scale multifunction station/yards.
The current 15 km/hr and 30 km/hr restrictions of trailing speed on the turning side of turnouts are considered to be too much restrictive. Since the Indian Railways uses a 1,676 mm broad-gauge track so this speed provides too much margin for excess centrifugal force, which is determined by the radius of the lead curve, for preventing an overturn or ride discomfort. Since the axle load is large and, therefore, large lateral thrust acts, there is a need to carefully investigate the amount of structural strength and the level of maintenance that will be required. The speed restrictions should be raised within the permissible range after taking into consideration of safety and economic factors (i.e., maintenance costs).
If the speed restrictions are viewed from the standpoint of economics, in which the opportunity cost incurred due to application of the excessively low trailing speed, particularly the 15 km/hr speed, is compared with the maintenance costs, the results cannot be ignored.


