Dear Shareholders, For the quarter ended March 31, 2018, the net asset value (“NAV”) per share of Gabelli Food of All Nations (“FOANC”) decreased 6.4% compared with a decrease of 7.1% for the Standard & Poor’s (“S&P”) 500 Consumer Staples Index. The Fund’s market price decreased 6.4%. See page 2 for additional performance information. First Quarter Results The first quarter was challenging for the consumer staples sector, (y)our Fund, and the broad market. The Fund declined 6.4% during the quarter, a disappointing result, though better than the decline of 7.1% for the S&P Consumer Staples Index. After rising in January, the S&P 500 fell sharply in February and ended the quarter down 0.8% for the quarter, its first quarterly decline since 2015. After over two years of nearly uninterrupted growth, this pullback was not unexpected, and more volatility is certainly possible going forward. Consumer staples stocks were especially pressured by the continued perception that big brands no longer have the pricing power that they once had in order to pass on rising costs to consumers, and will be increasingly squeezed as sales shift to Amazon and other e-commerce channels. It is our belief that strong brands, with the right management behind them, can not only survive, but thrive in a digital world. We also think consolidation within the food and beverage sector is ultimately inevitable in a world dominated by a few large retailers, whether those with physical stores or just an online presence. Top contributors included household product maker Energizer Holdings (2.0% of net assets as of March 31, 2018) (+25%), which rose largely due to the Federal Trade Commission allowing expiration of the waiting period under the Hart-Scott-Rodino Act for its pending acquisition of the battery business of Spectrum Brands, clearing the way for the transaction to close; bakery company Flowers Foods (2.2%) (+14%), which Gabelli Food of All Nations Shareholder Commentary March 31, 2018 Kevin V. Dreyer Portfolio Manager
Transcript
Dear Shareholders,
For the quarter ended March 31, 2018, the net asset value (“NAV”) per share of Gabelli Food of All
Nations (“FOANC”) decreased 6.4% compared with a decrease of 7.1% for the Standard & Poor’s (“S&P”) 500
Consumer Staples Index. The Fund’s market price decreased 6.4%. See page 2 for additional performance
information.
First Quarter Results
The first quarter was challenging for the consumer staples sector, (y)our Fund, and the broad market.
The Fund declined 6.4% during the quarter, a disappointing result, though better than the decline of 7.1% for
the S&P Consumer Staples Index. After rising in January, the S&P 500 fell sharply in February and ended the
quarter down 0.8% for the quarter, its first quarterly decline since 2015. After over two years of nearly
uninterrupted growth, this pullback was not unexpected, and more volatility is certainly possible going forward.
Consumer staples stocks were especially pressured by the continued perception that big brands no longer
have the pricing power that they once had in order to pass on rising costs to consumers, and will be
increasingly squeezed as sales shift to Amazon and other e-commerce channels. It is our belief that strong
brands, with the right management behind them, can not only survive, but thrive in a digital world. We also
think consolidation within the food and beverage sector is ultimately inevitable in a world dominated by a few
large retailers, whether those with physical stores or just an online presence.
Top contributors included household product maker Energizer Holdings (2.0% of net assets as of
March 31, 2018) (+25%), which rose largely due to the Federal Trade Commission allowing expiration of the
waiting period under the Hart-Scott-Rodino Act for its pending acquisition of the battery business of Spectrum
Brands, clearing the way for the transaction to close; bakery company Flowers Foods (2.2%) (+14%), which
Gabelli Food of All NationsShareholder Commentary
March 31, 2018
Kevin V. DreyerPortfolio Manager
2
We have separated the portfolio manager’s commentary from the financial statements and investment portfoliodue to corporate governance regulations stipulated by the Sarbanes-Oxley Act of 2002. We have done this toensure that the content of the portfolio manager’s commentary is unrestricted. Both the commentary and thefinancial statements, including the portfolio of investments, will be available on our website at www.gabelli.com.
Cumulative Returns through March 31, 2018 (a) (Unaudited)Since
InceptionQuarter 1 Year (2/14/17)———----- ————- ————-----
In the current prospectuses dated January 26, 2018, the net expense ratio for the Fund after contractualreimbursements by Gabelli Funds, LLC, (the “Adviser”) is 0.90%.
(a) Returns represent past performance and do not guarantee future results. Total returns and average annual returns
are historical and are calculated by determining the percentage change in net asset valve (NAV) or market price (as
applicable) with all distributions reinvested at NAV or closing market price (as applicable) on the payment date of the
distribution, and are net of management fees and other expenses. Investment returns and the principal value of an
investment will fluctuate. When shares are sold, they may be worth more or less than their original cost. Current
performance may be lower or higher than the performance data presented. The Fund's performance at market price
may differ from its results at NAV. Visit www.gabelli.com for performance information as of the most recent month end.
Returns would have been lower had the Adviser not reimbursed certain expenses of the Fund. Performance returns
for periods of less than one year are not annualized. Investors should carefully consider the investment objectives,
risks, charges, and expenses of the Fund before investing. The prospectus contains information about these and
other matters and should be read carefully before investing. To obtain a prospectus, please visit our website at
www.gabelli.com. The S&P 500 Consumer Staples Index is an unmanaged indicator of the food and staples retailing,food, beverage, tobacco, and household and personal products stock performance. Dividends are consideredreinvested. You cannot invest directly in an index.
(b) As an exchange-traded product, Gabelli Food of All Nations may trade at a value different from its NAV. The marketprice used to calculate the Market Value return is the midpoint between the highest bid and the lowest offer on theexchange on which the shares of the Fund are listed for trading as of the time that the Fund's NAV is calculated. Ifyou trade your shares at another time during the day, your return may differ.
NextSharesTM is a trademark of NextShares Solutions, LLC. Used with permission.
3
continues to see strong double digit growth in organic bread, with pricing contributing to margin improvement;
potato supplier Lamb Weston (4.3%) (+6%), which reported fiscal second quarter sales growth of 4% and
EBITDA growth of 12% driven by continued strong french fry demand with only limited incremental industry
capacity coming online; and brewer Heineken Holding (3.5%) (+5%), which rose as the company posted better
than expected 2017 earnings, along with speculation that the company may be looking to sell its Chinese
business to China’s largest brewer, China Resources Beer.
Detractors included food manufacturer Kraft Heinz (6.3%) (-18%), which reported a decline in sales and
disappointing growth in EBITDA in the fourth quarter, and went yet another quarter without announcing a major
acquisition; General Mills (GIS) (2.5%) (-23%), which posted continued challenged results and announced that
it agreed to acquire pet food producer Blue Buffalo (BUFF) for $40 per share in cash, a transaction that values
the target at 25x EBITDA and required the issuance of $1 billion of GIS equity; B&G Foods (1.9%) (-31%),
which reported lower than expected margins in the fourth quarter of 2017, though the company later
announced a $50 million share repurchase program; and Edgewell Personal Care (2.7%) (-18%), which
reported continued disappointing fiscal first quarter performance amid the ongoing price war initiated by its
primary men’s wet shaving competitor Gillette.
Conclusion
The consumer packaged goods sector continues to be out of favor with investors due to concerns over
pressure from Amazon and other retailers, sector rotation due to rising interest rates, shifting consumer
preferences, and possibly diminished pricing power. We view the sector as rich with stable and growing cash
generators; view current valuation levels as attractive, and believe that consolidation will accelerate in the
sector in 2018. We continue to seek to hold what we believe are the best positioned companies using our
Private Market Value with a CatalystTM approach.
April 16, 2018
Top Ten Holdings (Percent of Net Assets)
March 31, 2018
Conagra Brands Inc. 7.2%Mondelēz International Inc. 6.3%Kraft Heinz Co. 6.3%Post Holdings Inc. 5.5%Pinnacle Foods Inc. 4.9%
Diageo plc 4.6%Danone 4.5%Nestle SA 4.4%Kellogg Co. 4.4%Lamb Weston Holdings Inc. 4.2%
4
Note: The views expressed in this Shareholder Commentary reflect those of the Portfolio Manager only through
the end of the period stated in this Shareholder Commentary. The Portfolio Manager’s views are subject to
change at any time based on market and other conditions. The information in this Portfolio Manager’s
Shareholder Commentary represents the opinions of the individual Portfolio Manager and is not intended to be
a forecast of future events, a guarantee of future results, or investment advice. Views expressed are those of
the Portfolio Manager and may differ from those of other portfolio managers or of the Firm as a whole. This
Shareholder Commentary does not constitute an offer of any transaction in any securities. Any recommendation
contained herein may not be suitable for all investors. Information contained in this Shareholder Commentary
has been obtained from sources we believe to be reliable, but cannot be guaranteed.
www.gabelli.com
Please visit us on the Internet. Our homepage at www.gabelli.com contains information about GAMCO
Investors, Inc., the Gabelli/GAMCO Exchange Traded Managed Funds (ETMFs), IRAs, 401(k)s, current and
historical quarterly reports, closing prices, and other current news. We welcome your comments and questions
The Fund’s daily NAV is available each evening after 7:00 PM (Eastern Time) by calling 800-GABELLI
(800-422-3554). Please call us during the business day, between 8:00 AM – 7:00 PM (Eastern Time), for further
information.
You may sign up for our e-mail alerts at www.gabelli.com and receive early notice of quarterly report
availability, news events, media sightings, and mutual fund prices and performance.
5
This page was intentionally left blank.
6
About NextShares: Shares of NextShares funds are normally bought and sold in the secondary market
through a broker, and may not be individually purchased or redeemed from the fund. In the secondary market,
buyers and sellers transact with each other, rather than with the fund. NextShares funds issue and redeem
shares only in specified creation unit quantities in transactions by or through Authorized Participants. In such
transactions, a fund issues and redeems shares in exchange for the basket of securities, other instruments
and/or cash that the fund specifies each business day. By transacting in kind, a NextShares fund can lower its
trading costs and enhance fund tax efficiency by avoiding forced sales of securities to meet redemptions.
Redemptions may be affected partially or entirely in cash when in-kind delivery is not practicable or deemed
not in the best interests of shareholders. A fund’s basket is not intended to be representative of the fund’s
current portfolio positions and may vary significantly from current positions. As exchange-traded securities,
NextShares can operate with low transfer agency expenses by utilizing the same highly efficient share
processing system as used for exchange-listed stocks and ETFs.
Market trading prices of NextShares are linked to the fund’s next-computed net asset value (NAV) and will vary
from NAV by a market-determined premium or discount, which may be zero, and may vary significantly from
anticipated levels. Buyers and sellers of NextShares will not know the value of their purchases and sales until
after the fund’s NAV is determined at the end of the trading day. Market trading prices may vary significantly
from anticipated levels. Trading in Shares does not offer the opportunity to transact intraday based on current
(versus end-of-day) determinations of the Shares’ value. NextShares trade execution prices will fluctuate
based on changes in NAV. Although limit orders may be used to control trading costs, they cannot be used to
control or limit trade execution prices. As a new type of fund, NextShares have a limited operating history and
may initially be available through a limited number of brokers. There can be no guarantee that an active trading
market for NextShares will develop or be maintained, or that their listing will continue unchanged. Buying and
selling NextShares may require payment of brokerage commissions and expose transacting shareholders to
other trading costs. Frequent trading may detract from realized investment returns. The return on a
shareholder’s NextShares investment will be reduced if the shareholder sells shares at a greater discount or
narrower premium to NAV than he or she acquired the shares.
7
Gabelli Food of All NationsOne Corporate CenterRye, NY 10580-1422
Portfolio Manager Biography
Kevin V. Dreyer joined Gabelli in 2005 as a research analyst covering companies within the consumer sector.Currently he is a Managing Director and Co-Chief Investment Officer for GAMCO Investors, Inc.’s Value team.In addition, he currently serves as a portfolio manager of Gabelli Funds, LLC and manages several funds withinthe Gabelli/GAMCO Funds Complex. Mr. Dreyer received a BSE from the University of Pennsylvania and anMBA degree from Columbia Business School.
GABELLI FOOD OF ALL NATIONSOne Corporate CenterRye, NY 10580-1422
Net Asset Value per share available dailyby calling 800-GABELLI after 7:00 P.M.
BOARD OF TRUSTEESMario J. Gabelli, CFAChairman andChief Executive Officer,GAMCO Investors, Inc.Executive Chairman,Associated Capital Group Inc.
Anthony S. ColavitaAttorney,Anthony S. Colavita, P.C.
Frank J. Fahrenkopf, Jr.Former President &Chief Executive Officer,American Gaming Association
Michael J. MelarkeyOf Counsel,McDonald Carano Wilson LLP
Kuni NakamuraPresident,Advanced Polymer, Inc.
Salvatore M. Salibello, CPASenior Partner,Bright Side Consulting
OFFICERSAgnes MulladyPresident
Andrea R. MangoSecretary
John C. BallTreasurer
Bethany A. UhleinVice President
Richard J. WalzChief Compliance Officer
DISTRIBUTORG.distributors, LLC
CUSTODIAN, TRANSFERAGENT, AND DIVIDENDDISBURSING AGENTThe Bank of New York Mellon
LEGAL COUNSELPaul Hastings LLP
This report is submitted for the general information of the shareholders of Gabelli Food of All Nations NextShares. It is notauthorized for distribution to prospective investors unlesspreceded or accompanied by an effective prospectus.
GABELL IFOOD OFALL NATIONSNEXTSHARESTM
Shareholder CommentaryMarch 31, 2018
GAB5002Q118SC
1
Gabelli Food of All NationsSemiannual Report — March 31, 2018
Kevin Dreyer Portfolio Manager
BSE, University of Pennsylvania MBA, Columbia Business School
To Our Shareholders,
For the six months ended March 31, 2018, the net asset value (“NAV”) per share of Gabelli Food of All Nations (“FOANC”) decreased 0.4% compared with a decrease of 1.1% for the Standard & Poor’s (“S&P”) 500 Consumer Staples Index. The market price decreased 0.4%. See page 2 for additional performance information.
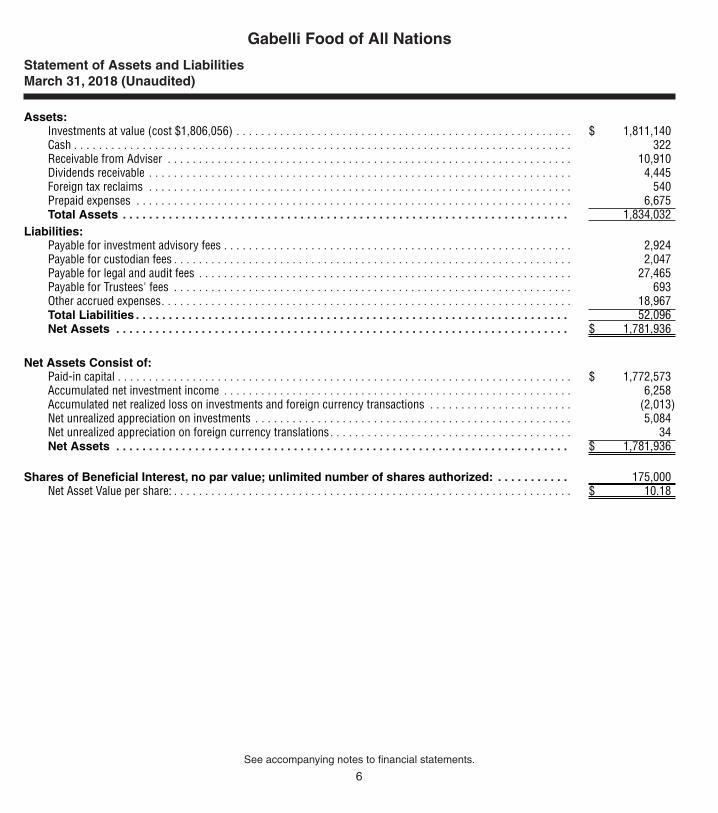
Enclosed are the financial statements, including the schedule of investments, as of March 31, 2018.
2
Comparative Results
Average Annual Returns through March 31, 2018 (a) (Unaudited)
Six Months 1 Year
Since Inception (2/14/17)
Gabelli Food of All Nations NextShares™ Fund at NAV .................................................................................................. (0.41)% 2.34% 3.44% Fund at Market Price(b) ................................................................................ (0.41) 2.34 3.44S&P 500 Consumer Staples Index .................................................................... (1.09) (0.89) 1.61
In the current prospectuses dated January 26, 2018, the net expense ratio for the Fund after contractual reimbursements by Gabelli Funds, LLC, (the “Adviser”) is 0.90%.
(a) Returns represent past performance and do not guarantee future results. Total returns and average annual returns are historical and are calculated by determining the percentage change in net asset valve (NAV) or market price (as applicable) with all distributions reinvested at NAV or closing market price (as applicable) on the payment date of the distribution, and are net of management fees and other expenses. Investment returns and the principal value of an investment will fluctuate. When shares are sold, they may be worth more or less than their original cost. Current performance may be lower or higher than the performance data presented. The Fund's performance at market price may differ from its results at NAV. Visit www.gabelli.com for performance information as of the most recent month end including historical trading premium/discounts relative to NAV. Returns would have been lower had the Adviser not reimbursed certain expenses of the Fund. Performance returns for periods of less than one year are not annualized. Investors should carefully consider the investment objectives, risks, charges, and expenses of the Fund before investing. The prospectus contains information about these and other matters and should be read carefully before investing. To obtain a prospectus, please visit our website at www.gabelli.com. The S&P 500 Consumer Staples Index is an unmanaged indicator of the food and staples retailing, food, beverage, tobacco, and household and personal products stock performance. Dividends are considered reinvested. You cannot invest directly in an index.
(b) As an exchange-traded product, Gabelli Food of All Nations may trade at a value different from its NAV. The market price used to calculate the Market Value return is the midpoint between the highest bid and the lowest offer on the exchange on which the shares of the Fund are listed for trading as of the time that the Fund's NAV is calculated. If you trade your shares at another time during the day, your return may differ.
Discount & Premium Information
Information regarding how often shares of the Fund traded on NASDAQ at a price above, i.e., at a premium, or below, i.e., at a discount, the Net Asset Value of the Fund can be found at www.nextshares.com.
NextShares™ is a trademark of NextShares Solutions, LLC. Used with permission.
Expense Table
3
Gabelli Food of All NationsDisclosure of Fund Expenses (Unaudited) For the Six Month Period from October 1, 2017 through March 31, 2018
We believe it is important for you to understand the impact of fees and expenses regarding your investment. All funds have operating expenses. As a shareholder of a fund, you incur two types of costs, transaction costs, which include brokerage commissions on purchases and sales of fund shares, and ongoing costs, which include costs for portfolio management, administrative services, and shareholder reports (like this one), among others. Operating expenses, which are deducted from a fund’s gross income, directly reduce the investment return of a fund. When a fund’s expenses are expressed as a percentage of its average net assets, this figure is known as the expense ratio. The following examples are intended to help you understand the ongoing costs (in dollars) of investing in your Fund and to compare these costs with those of other funds. The examples are based on an investment of $1,000 made at the beginning of the period shown and held for the entire period.
The Expense Table below illustrates your Fund’s costs in two ways:
Actual Fund Return: This section provides information about actual account values and actual expenses. You may use this section to help you to estimate the actual expenses that you paid over the period after any fee waivers and expense reimbursements. The “Ending Account Value” shown is derived from the Fund’s actual return during the past six months, and the “Expenses Paid During Period” shows the dollar amount that would have been paid by an investor who started with $1,000 in the Fund. You may use this information, together with the amount you invested, to estimate the expenses that you paid over the period.
To do so, simply divide your account value by $1,000 (for example, an $8,600 account value divided by $1,000 = 8.6), then multiply the result by the number given for your Fund under the heading “Expenses Paid During Period” to estimate the expenses you paid during this period.
Please note that the expenses shown in the table are meant to highlight your ongoing costs only, and do not reflect any transactional costs. Therefore, the second line in the table is useful in comparing ongoing costs only, and will not help you determine the relative total costs of owning different funds. In addition, if these transactional costs were included, your costs would have been higher.
Hypothetical 5% Return: This section provides information about hypothetical account values and hypothetical expenses based on the Fund’s actual expense ratio. It assumes a hypothetical annualized return of 5% before expenses during the period shown. In this case – because the hypothetical return used is not the Fund’s actual return – the results do not apply to your investment and you cannot use the hypothetical account value and expense to estimate the actual ending account balance or expenses you paid for the period. This example is useful in making comparisons of the ongoing costs of investing in the Fund and other funds. To do so, compare this 5% hypothetical example with the 5% hypothetical examples that appear in shareholder reports of other funds.
Please note that the expenses shown in the table are meant to highlight your ongoing costs only, and do not reflect any transactional costs such as sales charges (loads), redemption fees, or exchange fees, if any, which would be described in the Prospectus. If these costs were applied to your account, your costs would be higher. Therefore, the 5% hypothetical return is useful in comparing ongoing costs only, and will not help you determine the relative total costs of owning different funds.
Beginning Account Value
October 1, 2017
Ending Account Value March 31, 2018
Annualized Expense
Ratio
Expenses Paid During
Period(1)
Gabelli Food of All NationsActual Fund Return $ 1,000.00 $ 995.90 0.90% $ 4.48Hypothetical 5% Return $ 1,000.00 $ 1,020.44 0.90% $ 4.53
(1)Expenses are equal to the Fund’s annualized expense ratio for the last six months, multiplied by the average account value over the period, multiplied by the number of days in the most recent fiscal half year (182 days), then divided by 365.
4
Summary of Portfolio Holdings (Unaudited)
The following table presents portfolio holdings as a percent of net assets as of March 31, 2018:
The Fund files a complete schedule of portfolio holdings with the Securities and Exchange Commission (the “SEC”) for the first and third quarters of each fiscal year on Form N-Q. Shareholders may obtain this information at www.gabelli.com or by calling the Fund at 800-GABELLI (800-422-3554).The Fund’s Forms N-Q are available on the SEC’s website at www.sec.gov and may also be reviewed and copied at the SEC’s Public Reference Room in Washington, DC. Information on the operation of the Public Reference Room may be obtained by calling 800-SEC-0330.
Proxy Voting
The Fund files Form N-PX with its complete proxy voting record for the twelve months ended June 30, no later than August 31 of each year. A description of the Fund’s proxy voting policies, procedures, and how the Fund voted proxies relating to portfolio securities is available without charge, upon request, by (i) calling 800-GABELLI (800-422-3554); (ii) writing to The Gabelli Funds at One Corporate Center, Rye, NY 10580-1422; or (iii) visiting the SEC’s website at www.sec.gov.
5See accompanying notes to financial statements.
Gabelli Food of All NationsSchedule of Investments — March 31, 2018 (Unaudited)
† Total return represents aggregate total return of a hypothetical $1,000 investment at the beginning of the period and sold at the end of the period, including reinvestment of distributions. Total return for a period of less than one year is not annualized.
(a) The Fund commenced investment operations on February 14, 2017.(b) Per share data are calculated using the average shares outstanding method.(c) Annualized.
10
Gabelli Food of All NationsNotes to Financial Statements (Unaudited)
1. Organization. The Gabelli NextShares Trust (the “Trust”) was organized on March 20, 2015 as a Delaware statutory trust and Gabelli Food of All Nations (the “Fund”) commenced investment operations on February 14, 2017. The Fund is a non-diversified open-end management investment company registered under the Investment Company Act of 1940, as amended (the “1940 Act”). The Fund’s primary investment objective is to provide capital appreciation.
2. Significant Accounting Policies. As an investment company, the Fund follows the investment company accounting and reporting guidance, which is part of U.S. generally accepted accounting principles (“GAAP”) that may require the use of management estimates and assumptions in the preparation of its financial statements. Actual results could differ from those estimates. The following is a summary of significant accounting policies followed by the Fund in the preparation of its financial statements.
Security Valuation. Portfolio securities listed or traded on a nationally recognized securities exchange or traded in the U.S. over-the-counter market for which market quotations are readily available are valued at the last quoted sale price or a market’s official closing price as of the close of business on the day the securities are being valued. If there were no sales that day, the security is valued at the average of the closing bid and asked prices or, if there were no asked prices quoted on that day, then the security is valued at the closing bid price on that day. If no bid or asked prices are quoted on such day, the security is valued at the most recently available price or, if the Board of Trustees (the “Board”) so determines, by such other method as the Board shall determine in good faith to reflect its fair market value. Portfolio securities traded on more than one national securities exchange or market are valued according to the broadest and most representative market, as determined by Gabelli Funds, LLC (the “Adviser”).
Portfolio securities primarily traded on a foreign market are generally valued at the preceding closing values of such securities on the relevant market, but may be fair valued pursuant to procedures established by the Board if market conditions change significantly after the close of the foreign market, but prior to the close of business on the day the securities are being valued. Debt obligations for which market quotations are readily available are valued at the average of the latest bid and asked prices. If there were no asked prices quoted on such day, the security is valued using the closing bid price. Such debt obligations are valued through prices provided by a pricing service approved by the Board. Certain securities are valued principally using dealer quotations.
Securities and assets for which market quotations are not readily available are fair valued as determined by the Board. Fair valuation methodologies and procedures may include, but are not limited to: analysis and review of available financial and non-financial information about the company; comparisons with the valuation and changes in valuation of similar securities, including a comparison of foreign securities with the equivalent U.S. dollar value American Depositary Receipt securities at the close of the U.S. exchange; and evaluation of any other information that could be indicative of the value of the security.
The inputs and valuation techniques used to measure fair value of the Fund’s investments are summarized into three levels as described in the hierarchy below:
● Level 1 — quoted prices in active markets for identical securities; ● Level 2 — other significant observable inputs (including quoted prices for similar securities, interest rates,
prepayment speeds, credit risk, etc.); and
11
Gabelli Food of All NationsNotes to Financial Statements (Unaudited) (Continued)
● Level 3 — significant unobservable inputs (including the Board’s determinations as to the fair value of investments).
A financial instrument’s level within the fair value hierarchy is based on the lowest level of any input both individually and in the aggregate that is significant to the fair value measurement. The inputs or methodology used for valuing securities are not necessarily an indication of the risk associated with investing in those securities. The summary of the Fund’s investments in securities by inputs used to value the Fund’s investments as of March 31, 2018 are as follows:
Valuation Inputs
INVESTMENTS IN SECURITIES:Level 1
Quoted PricesTotal Market Value
at 03/31/18ASSETS (Market Value):Common Stocks(a) $ 1,710,418 $ 1,710,418 Money Market Fund 100,722 100,722 TOTAL INVESTMENTS IN SECURITIES – ASSETS $ 1,811,140 $ 1,811,140
(a) Please refer to the Schedule of Investments for the industry classifications of these portfolio holdings.
The Fund did not have transfers between Level 1 and Level 2 during the period ended March 31, 2018. The Fund’s policy is to recognize transfers among Levels as of the beginning of the reporting period.
There were no Level 2 or Level 3 investments held at March 31, 2018.
Additional Information to Evaluate Qualitative Information
General. The Fund uses recognized industry pricing services – approved by the Board and unaffiliated with the Adviser – to value most of its securities, and uses broker quotes provided by market makers of securities not valued by these and other recognized pricing sources. Several different pricing feeds are received to value domestic equity securities, international equity securities, preferred equity securities, and fixed income securities. The data within these feeds are ultimately sourced from major stock exchanges and trading systems where these securities trade. The prices supplied by external sources are checked by obtaining quotations or actual transaction prices from market participants. If a price obtained from the pricing source is deemed unreliable, prices will be sought from another pricing service or from a broker/dealer that trades that security or similar securities.
Fair Valuation. Fair valued securities may be common or preferred equities, warrants, options, rights, or fixed income obligations. Where appropriate, Level 3 securities are those for which market quotations are not available, such as securities not traded for several days, or for which current bids are not available, or which are restricted as to transfer. When fair valuing a security, factors to consider include recent prices of comparable securities that are publicly traded, reliable prices of securities not publicly traded, and the use of valuation models, current analyst reports, valuing the income or cash flow of the issuer, or cost if the preceding factors do not apply. A significant change in the unobservable inputs could result in a lower or higher value in Level 3 securities. The circumstances of Level 3 securities are frequently monitored to determine if fair valuation measures continue to apply.
12
Gabelli Food of All NationsNotes to Financial Statements (Unaudited) (Continued)
The Adviser reports quarterly to the Board the results of the application of fair valuation policies and procedures. These may include back testing the prices realized in subsequent trades of these fair valued securities to fair values previously recognized.
Foreign Currency Translations. The books and records of the Fund are maintained in U.S. dollars. Foreign currencies, investments, and other assets and liabilities are translated into U.S. dollars at current exchange rates. Purchases and sales of investment securities, income, and expenses are translated at the exchange rate prevailing on the respective dates of such transactions. Unrealized gains and losses that result from changes in foreign exchange rates and/or changes in market prices of securities have been included in unrealized appreciation/depreciation on investments and foreign currency translations. Net realized foreign currency gains and losses resulting from changes in exchange rates include foreign currency gains and losses between trade date and settlement date on investment securities transactions, foreign currency transactions, and the difference between the amounts of interest and dividends recorded on the books of the Fund and the amounts actually received. The portion of foreign currency gains and losses related to fluctuation in exchange rates between the initial purchase trade date and subsequent sale trade date is included in realized gain/(loss) on investments.
Foreign Securities. The Fund may directly purchase securities of foreign issuers. Investing in securities of foreign issuers involves special risks not typically associated with investing in securities of U.S. issuers. The risks include possible revaluation of currencies, the inability to repatriate funds, less complete financial information about companies, and possible future adverse political and economic developments. Moreover, securities of many foreign issuers and their markets may be less liquid and their prices more volatile than securities of comparable U.S. issuers.
Foreign Taxes. The Fund may be subject to foreign taxes on income, gains on investments, or currency repatriation, a portion of which may be recoverable. The Fund will accrue such taxes and recoveries as applicable, based upon its current interpretation of tax rules and regulations that exist in the markets in which it invests.
Restricted Securities. The Fund may invest up to 10% of its net assets in securities for which the markets are restricted. Restricted securities include securities whose disposition is subject to substantial legal or contractual restrictions. The sale of restricted securities often requires more time and results in higher brokerage charges or dealer discounts and other selling expenses than does the sale of securities eligible for trading on national securities exchanges or in the over-the-counter markets. Restricted securities may sell at a price lower than similar securities that are not subject to restrictions on resale. Securities freely saleable among qualified institutional investors under special rules adopted by the SEC may be treated as liquid if they satisfy liquidity standards established by the Board. The continued liquidity of such securities is not as well assured as that of publicly traded securities, and accordingly the Board will monitor their liquidity. At March 31, 2018, the Fund did not hold any restricted securities.
Securities Transactions and Investment Income. Securities transactions are accounted for on the trade date with realized gain/(loss) on investments determined by using the identified cost method. Interest income (including amortization of premium and accretion of discount) is recorded on an accrual basis. Premiums and discounts on debt securities are amortized using the effective yield to maturity method. Dividend income is recorded on the ex-dividend date, except for certain dividends from foreign securities that are recorded as soon after the ex-dividend date as the Fund becomes aware of such dividends.
13
Gabelli Food of All NationsNotes to Financial Statements (Unaudited) (Continued)
Calculation of Expenses. Certain administrative expenses are common to, and allocated among, various affiliated funds. Such allocations are made on the basis of each fund’s average net assets or other criteria directly affecting the expenses as determined by the Adviser pursuant to procedures established by the Board.
Distributions to Shareholders. Distributions to shareholders are recorded on the ex-dividend date. Distributions to shareholders are based on income and capital gains as determined in accordance with federal income tax regulations, which may differ from income and capital gains as determined under GAAP. These differences are primarily due to differing treatments of income and gains on various investment securities held by a Fund and timing differences. These book/tax differences are either temporary or permanent in nature. To the extent these differences are permanent, adjustments are made to the appropriate capital accounts in the period when the differences arise. These reclassifications have no impact on the NAVs of the Fund.
The tax character of distributions, if any, will be determined at the end of the current fiscal year.
Provision for Income Taxes. The Fund intends to qualify as a regulated investment company under Subchapter M of the Internal Revenue Code of 1986, as amended (the “Code”). It is the policy of the Fund to comply with the requirements of the Code applicable to regulated investment companies and to distribute substantially all of the Fund’s net investment company taxable income and net capital gains. Therefore, no provision for federal income taxes is required.
As of September 30, 2017 the components of accumulated earnings/losses on a tax basis were as follows:
The Fund is permitted to carry capital losses forward for an unlimited period. Capital losses that are carried forward will retain their character as either short term or long term capital losses.
At September 30, 2017, the temporary differences between book basis and tax basis unrealized appreciation/depreciation on investments was primarily due to deferral of losses from wash sales for tax purposes and mark-to-market adjustments on investments in passive foreign investment companies.
The following summarizes the tax cost on investments and the net unrealized appreciation/depreciation at March 31, 2018:
The Fund is required to evaluate tax positions taken or expected to be taken in the course of preparing the Fund’s tax returns to determine whether the tax positions are “more-likely-than-not” of being sustained by the applicable tax authority. Income tax and related interest and penalties would be recognized by the Fund as tax
14
Gabelli Food of All NationsNotes to Financial Statements (Unaudited) (Continued)
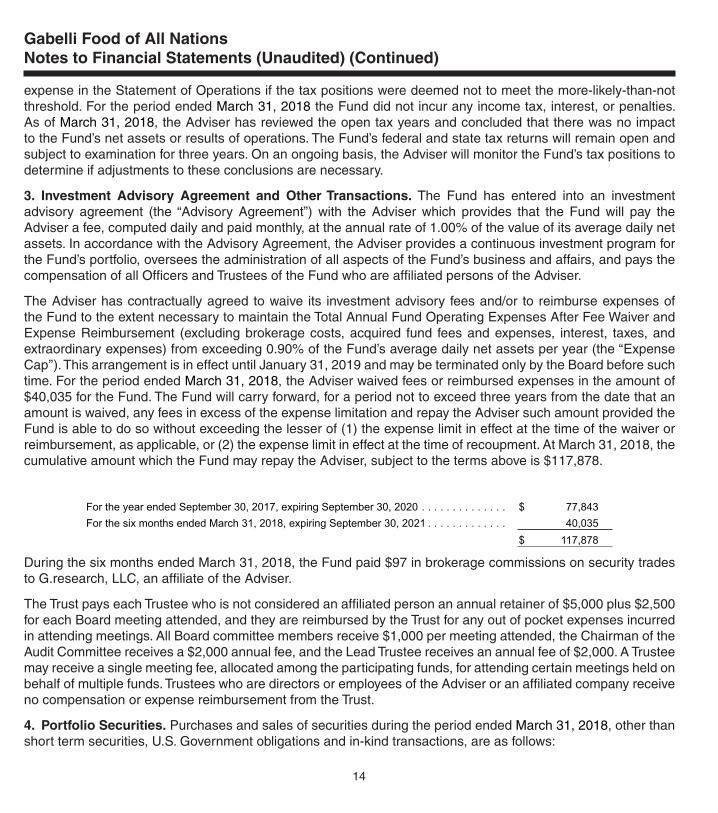
expense in the Statement of Operations if the tax positions were deemed not to meet the more-likely-than-not threshold. For the period ended March 31, 2018 the Fund did not incur any income tax, interest, or penalties. As of March 31, 2018, the Adviser has reviewed the open tax years and concluded that there was no impact to the Fund’s net assets or results of operations. The Fund’s federal and state tax returns will remain open and subject to examination for three years. On an ongoing basis, the Adviser will monitor the Fund’s tax positions to determine if adjustments to these conclusions are necessary.
3. Investment Advisory Agreement and Other Transactions. The Fund has entered into an investment advisory agreement (the “Advisory Agreement”) with the Adviser which provides that the Fund will pay the Adviser a fee, computed daily and paid monthly, at the annual rate of 1.00% of the value of its average daily net assets. In accordance with the Advisory Agreement, the Adviser provides a continuous investment program for the Fund’s portfolio, oversees the administration of all aspects of the Fund’s business and affairs, and pays the compensation of all Officers and Trustees of the Fund who are affiliated persons of the Adviser.
The Adviser has contractually agreed to waive its investment advisory fees and/or to reimburse expenses of the Fund to the extent necessary to maintain the Total Annual Fund Operating Expenses After Fee Waiver and Expense Reimbursement (excluding brokerage costs, acquired fund fees and expenses, interest, taxes, and extraordinary expenses) from exceeding 0.90% of the Fund’s average daily net assets per year (the ‘‘Expense Cap’’). This arrangement is in effect until January 31, 2019 and may be terminated only by the Board before such time. For the period ended March 31, 2018, the Adviser waived fees or reimbursed expenses in the amount of $40,035 for the Fund. The Fund will carry forward, for a period not to exceed three years from the date that an amount is waived, any fees in excess of the expense limitation and repay the Adviser such amount provided the Fund is able to do so without exceeding the lesser of (1) the expense limit in effect at the time of the waiver or reimbursement, as applicable, or (2) the expense limit in effect at the time of recoupment. At March 31, 2018, the cumulative amount which the Fund may repay the Adviser, subject to the terms above is $117,878.
For the year ended September 30, 2017, expiring September 30, 2020 . . . . . . . . . . . . . . $ 77,843 For the six months ended March 31, 2018, expiring September 30, 2021 . . . . . . . . . . . . . 40,035
$ 117,878
During the six months ended March 31, 2018, the Fund paid $97 in brokerage commissions on security trades to G.research, LLC, an affiliate of the Adviser.
The Trust pays each Trustee who is not considered an affiliated person an annual retainer of $5,000 plus $2,500 for each Board meeting attended, and they are reimbursed by the Trust for any out of pocket expenses incurred in attending meetings. All Board committee members receive $1,000 per meeting attended, the Chairman of the Audit Committee receives a $2,000 annual fee, and the Lead Trustee receives an annual fee of $2,000. A Trustee may receive a single meeting fee, allocated among the participating funds, for attending certain meetings held on behalf of multiple funds. Trustees who are directors or employees of the Adviser or an affiliated company receive no compensation or expense reimbursement from the Trust.
4. Portfolio Securities. Purchases and sales of securities during the period ended March 31, 2018, other than short term securities, U.S. Government obligations and in-kind transactions, are as follows:
15
Gabelli Food of All NationsNotes to Financial Statements (Unaudited) (Continued)
Purchases SalesGabelli Food of All Nations NextShares . . . . . . . . . $ 105,974 $ 215,357
5. Capital Share Transactions. Capital shares are issued and redeemed by the Fund only in aggregations of a specified number of shares or multiples thereof (“Creation Units”) at NAV, in return for securities, other instruments, and/or cash (the “Basket”). Except when aggregated in Creation Units, shares of the Fund are not redeemable. Transactions in capital shares for the Fund are disclosed in detail in the statement of changes in net assets. Purchasers and redeemers of Creation Units are charged a transaction fee to cover the estimated cost to the Funds of processing the purchase or redemption, including costs charged to it by the NSCC or DTC, and the estimated transaction costs (e.g., brokerage commissions, bid-ask spread, and market impact trading costs), incurred in converting the Basket to or from the desired portfolio composition. The transaction fee is determined daily and will be limited to amounts approved by the Board and determined by the Adviser to be appropriate to defray the expenses that the Fund incurs in connection with the purchase or redemption. The Fund’s transaction fees will be available on the Fund’s website each day. The purpose of transaction fees is to protect the Fund’s existing shareholders from the dilutive costs associated with the purchase and redemption of Creation Units. The amount of transaction fees will differ among the Fund depending on the estimated trading costs for portfolio positions and Basket processing costs and other considerations. Transaction fees may include fixed amounts per creation or redemption transactions, amounts varying with the number of Creation Units purchased or redeemed, and amounts varying based on the time an order is placed. A fund that substitutes cash for Basket instruments may impose higher transaction fees on the substituted cash amount. Higher transaction fees may apply to purchases and redemptions through the DTC than through the NSCC.
6. Subsequent Events. Management has evaluated the impact on the Fund of all subsequent events occurring through the date the financial statements were issued and has determined that there were no subsequent events requiring recognition or disclosure in the financial statements.
Gabelli/GAMCO Funds and Your Personal Privacy
Who are we?
The Gabelli/GAMCO Funds are investment companies registered with the Securities and Exchange Commission under the Investment Company Act of 1940. We are managed by Gabelli Funds, LLC and GAMCO Asset Management Inc., which are affiliated with GAMCO Investors, Inc. that is a publicly held company with subsidiaries and affiliates that provide investment advisory services for a variety of clients.
What kind of non-public information do we collect about you if you become a fund shareholder?
If you apply to open an account directly with us, you will be giving us some non-public information about yourself. The non-public information we collect about you is:
● Information you give us on your application form. This could include your name, address, telephone number, social security number, bank account number, and other information.
● Information about your transactions with us, any transactions with our affiliates, and transactions with the entities we hire to provide services to you. This would include information about the shares that you buy or redeem. If we hire someone else to provide services — like a transfer agent — we will also have information about the transactions that you conduct through them.
What information do we disclose and to whom do we disclose it?
We do not disclose any non-public personal information about our customers or former customers to anyone other than our affiliates, our service providers who need to know such information, and as otherwise permitted by law. If you want to find out what the law permits, you can read the privacy rules adopted by the Securities and Exchange Commission. They are in volume 17 of the Code of Federal Regulations, Part 248. The Commission often posts information about its regulations on its website, www.sec.gov.
What do we do to protect your personal information?
We restrict access to non-public personal information about you to the people who need to know that information in order to provide services to you or the fund and to ensure that we are complying with the laws governing the securities business. We maintain physical, electronic, and procedural safeguards to keep your personal information.
This page was intentionally left blank.
Gabelli Food of All NationsAdditional Disclosure
About NextShares: Shares of NextShares funds are normally bought and sold in the secondary market through a broker, and may not be individually purchased or redeemed from the fund. In the secondary market, buyers and sellers transact with each other, rather than with the fund. NextShares funds issue and redeem shares only in specified creation unit quantities in transactions by or through Authorized Participants. In such transactions, a fund issues and redeems shares in exchange for the basket of securities, other instruments and/or cash that the fund specifies each business day. A fund’s basket is not intended to be representative of the fund’s current portfolio positions and may vary significantly from current positions. By transacting in kind, a NextShares fund can lower its trading costs and enhance fund tax efficiency by avoiding forced sales of securities to meet redemptions. Redemptions may be effected partially or entirely in cash when in-kind delivery is not practicable or deemed not in the best interests of shareholders. As exchange-traded securities, NextShares can operate with low transfer agency expenses by utilizing the same highly efficient share processing system as used for exchange-listed stocks and ETFs. Market trading prices of NextShares are linked to the fund’s next-computed net asset value (NAV) and will vary from NAV by a market-determined premium or discount, which may be zero, and may vary significantly from anticipated levels. Buyers and sellers of NextShares will not know the value of their purchases and sales until after the fund’s NAV is determined at the end of the trading day. Market trading prices may vary significantly from anticipated levels. Trading in NextShares does not offer the opportunity to transact intraday based on current (versus end-of-day) determinations of the fund value. NextShares trade execution prices will fluctuate based on changes in NAV. Although limit orders may be used to control trading costs, they cannot be used to control or limit trade execution prices. As a new type of fund, NextShares have a limited operating history and may initially be available through a limited number of brokers. There can be no guarantee that an active trading market for NextShares will develop or be maintained, or that their listing will continue unchanged. Buying and selling NextShares may require payment of brokerage commissions and expose transacting shareholders to other trading costs. Frequent trading may detract from realized investment returns. The return on a shareholder’s NextShares investment will be reduced if the shareholder sells shares at a greater discount or narrower premium to NAV than he or she acquired the shares.
GABELLI FOOD OF ALL NATIONSOne Corporate CenterRye, NY 10580-1422
Portfolio Manager’s Biography
Kevin Dreyer joined Gabelli in 2005 as a research analyst covering companies within the consumer sector. Currently he is a Managing Director and Co-Chief Investment Officer for GAMCO Investors, Inc.’s Value team. In addition, he serves as a portfolio manager of Gabelli Funds, LLC and manages several funds within the Gabelli/GAMCO Funds Complex. Mr. Dreyer received a BSE from the University of Pennsylvania and an MBA degree from Columbia Business School.
We have separated the portfolio manager’s commentary from the financial statements and investment portfolio due to corporate governance regulations stipulated by the Sarbanes-Oxley Act of 2002. We have done this to ensure that the contents of the portfolio manager’s commentary are unrestricted. Both the commentary and the financial statements, including the portfolios of investments, will be available on our website at www.gabelli.com.
GABELLI FOOD OF ALL NATIONS NEXTSHARESTM
Semiannual ReportMarch 31, 2018
GAB5002Q118SR
GABELLI NEXTSHARES TRUST GABELLI FOOD OF ALL NATIONS
Net Asset Values per share available daily by calling 800-GABELLI after 7:00 P.M.
BOARD OF TRUSTEES
Mario J. Gabelli, CFAChairman andChief Executive Officer,GAMCO Investors, Inc. Executive Chairman,Associated Capital Group Inc.
Anthony S. ColavitaAttorney,Anthony S. Colavita, P.C.
Frank J. Fahrenkopf, Jr.Former President & ChiefExecutive Officer,American Gaming Association
Michael J. MelarkeyOf Counsel,McDonald Carano Wilson LLP
Kuni NakamuraPresident,Advanced Polymer, Inc.
Salvatore M. SalibelloSenior Partner,Bright Side Consulting
OFFICERS
Agnes MulladyPresident
John C. BallTreasurer
Andrea R. MangoSecretary
Richard J. WalzChief Compliance Officer
Bethany A. UhleinVice President
DISTRIBUTOR
G.distributors, LLC
CUSTODIAN, TRANSFER AGENT, AND DIVIDEND DISBURSING AGENT
The Bank of New York Mellon
LEGAL COUNSEL
Paul Hastings LLP
This report is submitted for the general information of the shareholders of Gabelli Food of All Nations. It is not authorized for distribution to prospective investors unless preceded or accompanied by an effective prospectus.