CHARACTERIZATION OF THE OFF-ROAD EQUIPMENT POPULATION ARB Contract No. 04-315 Final Report Prepared for: California Air Resources Board and the California Environmental Protection Agency Prepared by: Rick Baker, Principal Investigator Eastern Research Group, Inc. December 2008
Transcript
CHARACTERIZATION OF THE OFF-ROAD EQUIPMENT POPULATION
ARB Contract No. 04-315
Final Report
Prepared for:
California Air Resources Board and the
California Environmental Protection Agency
Prepared by:
Rick Baker, Principal Investigator
Eastern Research Group, Inc.
December 2008
Disclaimer The statements and conclusions in this Report are those of the contractor and not necessarily those of the California Air Resources Board. The mention of commercial products, their source, or their use in connection with materials reported herein is not to be construed as actual or implied endorsement of such products.
Acknowledgements The contributions of the California Air Resources Board staff, particularly Dr. Tao Huai and Dorothy Shimer, who made invaluable suggestions as Project Officers were greatly appreciated.
We thank the Ag Tech Advisory Committee, including the following individuals: Manuel Cunha, Jr., Roger Isom, Shirley Batchman, Karla Kay Fullerton, and Cynthia Corey, for their input and support. We also wish to thank Western Engineering Contractors and CSI Construction for their cooperation with the instrumentation portion of the study.
We wish to acknowledge the California Cotton Ginners and Growers Associations, the Nisei Farmers League, the California Grape & Tree Fruit League, the California Citrus Mutual, and the Fresno County Farm Bureau for encouraging their membership to participate in the survey effort.
The instrumentation portion of the project could not have been completed without the generous cooperation of the following off-road equipment fleet operators: City of Davis, City of Woodland, Sacramento County, City of Fresno, City of Clovis, Tiechert Construction, Doug Veerkamp General Engineering, City of Folsom, Western Engineering, and CSI Construction.
Finally, we thank Scott Rowland and Francine Baker of ARB’s Mobile Source Control Division, and Michael Benjamin, David Chou, and Debbie Futaba of ARB’s Planning and Technical Support Division, who were instrumental in reviewing findings, commenting, and providing supporting data throughout the project.
This Report was submitted in fulfillment of ARB contract number 04-315, “Characterization of the Off-Road Equipment Population,” by Eastern Research Group, Inc., NuStats, LLC, and SDV-ACCI under the sponsorship of the California Air Resources Board. Work was completed as of June 17, 2008.
i
Table of Contents Abstract ...................................................................................................................v Executive Summary ...................................................................................................................1 1.0 Introduction ...................................................................................................................3 2.0 Materials and Methods......................................................................................................6 2.1 Equipment Characterization Survey .....................................................................6 2.1.1 Sample Frame Development.....................................................................6 2.1.2 Survey and Sample Size Determination ...................................................9 2.1.3 Survey Instrument Design.......................................................................12 2.1.4 Updates to Phase I Study Design ............................................................12 2.2 Equipment Instrumentation.................................................................................13 2.2.1 Data Logger Characteristics....................................................................13 2.2.2 Sensor Installation...................................................................................14 2.2.3 Logger Installation and Removal Procedures .........................................16 2.2.4 Equipment Sample..................................................................................16 3.0 Results .................................................................................................................23 3.1 Equipment Survey Results..................................................................................23 3.1.1 Post-Processing and Quality Assurance..............................................................23 3.1.2 Survey Rates .....................................................................................................31 3.1.3 Respondent Profiles ............................................................................................33 3.1.4 Response Weightings..........................................................................................40 3.1.5 Equipment Inventory Findings ...........................................................................44 3.2 Equipment Instrumentation Results....................................................................84 3.2.1 Instrumentation Data Processing ........................................................................84 3.2.2 Operation Profiles ...............................................................................................85 4.0 Analysis and Discussion .................................................................................................93 4.1 Statewide Equipment Profile Development........................................................93 4.1.1 Identification and Selection of Surrogates..............................................93 4.1.2 Statewide Equipment Population Estimates ...........................................98 4.1.3 Statewide Equipment Activity Profiles.................................................123 4.1.4 Statewide Equipment HP Profiles.........................................................126 4.2 Uncertainty Analysis and Confidence Intervals ...............................................130 4.2.1 Activity Estimates.................................................................................131 4.2.2 Equipment HP Estimates ......................................................................133 4.2.3 Equipment Population Estimates ..........................................................135 4.3 Preemption Analysis .........................................................................................138 4.4 Instrumentation Data.........................................................................................145 5.0 Summary and Conclusions ...........................................................................................146 6.0 Recommendations.........................................................................................................149 References ...............................................................................................................151 Glossary of Terms, Abbreviations, and Symbols .....................................................................152 Appendix A Crop Type Assignments for Agriculture Sector...................................................153 Appendix B SIC Codes by Survey Sector ................................................................................158 Appendix C- Questionnaire Designed for Telephone Administration ....................................161 Appendix D Logger Installation and Retrieval Procedure........................................................171
ii
Appendix E Public Fleets Contacted for Participation .............................................................177 Appendix F Instrumented Vehicle Exhaust Gas Temperature Profiles ....................................182
List of Figures
Figure 1. Location of Recreational Target Sub-Strata ................................................................... 9 Figure 2. Clēaire Data Logger System (Source: Clēaire) ............................................................ 14 Figure 3. Hall-Effect Sensor Installed in Bell-Housing of Engine .............................................. 15 Figure 4. Idler Pulley/Hall-Effect Sensor Assembly .................................................................... 15 Figure 5. Equipment Instrumentation Sites (www.google.com).................................................... 18 Figure 6. Calendar Showing Days of Logger Operation ............................................................. 19 Figure 7. Agricultural Sector Population Distribution (w/out tractors)* ..................................... 45 Figure 8. Construction and Mining Sector Population Distribution (w/out Electric
Equipment*)...................................................................................................................... 47 Figure 8. Construction and Mining Sector Population Distribution Continued .......................... 48 Figure 9. Residential Sector Equipment Population Distribution................................................ 49 Figure 9. Residential Sector Equipment Population Distribution Continued.............................. 50 Figure 10. Residual Sector Equipment Population Distribution.................................................. 52 Figure 11. Model Year Distribution – Diesel Agricultural Tractors ........................................... 82 Figure 12. Diesel Agricultural Tractor Hrs/Yr vs. Age ............................................................... 82 Figure 13. Number of Equipment Pieces vs. Reported Acreage, Non-CAFO/Dairy
Agricultural Sector Respondents ...................................................................................... 94 Figure 14. Number of Equipment Pieces vs. Reported Acreage, Construction/Mining Sector
Respondents ...................................................................................................................... 96 Figure 15. Number of Equipment Pieces vs. Reported Acreage, Residual Sector Respondents.. 96
List of Tables Table 1. Pilot and Full Study Completes By Sample Type and Sub-Strata..................................9 Table 2. Estimated Number of Sample Records Needed to Meet Survey Targets .....................10 Table 3. Target Construction Equipment Categories for Instrumentation.................................17 Table 4. Instrumented Equipment Detail ...................................................................................20 Table 5. Electric Equipment Type Descriptions by Survey Sector ...........................................24 Table 6. Respondent Equipment Types and Corresponding ARB Equipment Type
Assignments .................................................................................................................26 Table 7. Basis and Count of Excluded Records.........................................................................31 Table 8. Call Summary – Second Round Call-backs.................................................................31 Table 9. Completed Questionnaires by Sample Type.................................................................32 Table 10. Final Dispositions for Final Off-road Sample ............................................................32 Table 11. Completed Surveys by SSI Crop/Service Type – Agricultural Sector ......................33 Table 12. Completed Surveys by SIC Group – Construction and Mining Sector .....................34 Table 13. Completed Surveys by Region – Residential Sector .................................................34 Table 14. Completed Surveys by SIC Group – Residual Sector ...............................................34 Table 15. Completed Agricultural Surveys by Self-Reported Crop Type.................................35 Table 16. Completed Surveys and Associated Acreage by County – Ag. Sector .....................35
iii
Table 17. Completed Surveys by County – Construction and Mining Sector...........................37 Table 18. Completed Surveys by County – Residential Sector .................................................37 Table 19. Completed Surveys by County – Residual Sector .....................................................38 Table 20. Agricultural Respondent Mean Acreage by Crop Type ............................................38 Table 21. Agricultural Respondent Pieces of Equipment by Crop/Service Type......................39 Table 22. Construction and Mining Respondent Pieces of Equipment by Service Type ..........39 Table 23. Residential Respondent Pieces of Equipment by Region..........................................39 Table 24. Residual Respondent Pieces of Equipment by Service Type ....................................39 Table 25. Distribution of Completed Surveys by Sample Type – Unweighted..........................40 Table 26. Commercial Surveys by Sample Type – Sample Frame ............................................41 Table 27. Sample Type, Sample Frame and Corresponding SIC Grouping – Commercial
Sectors .................................................................................................................41 Table 28. Relative Survey and Sample Size Proportions w/ Response Weightings...................42 Table 29. Weighted Survey Response Totals .............................................................................43 Table 30. Equipment Categories and Counts Reported by Agricultural Region.......................53 Table 31. Weighted Fuel Type Distribution – Agricultural Sector ............................................53 Table 32. Weighted Fuel Type Distribution – Construction/Mining Sector .............................54 Table 33. Weighted Fuel Type Distribution – Residential Sector ..............................................55 Table 34. Weighted Fuel Type Distribution – Residual Sector ..................................................56 Table 35. Application Type Distribution – Agricultural Sector, All Equipment........................58 Table 36. Application Type Distribution – Construction/Mining Sector, All Equipment .........58 Table 37. Application Type Distribution – Residential Sector, All Equipment .........................58 Table 38. Application Type Distribution – Residual Sector, All Equipment .............................59 Table 39. Seasonal Activity Distribution by Survey Sector .......................................................59 Table 40. Weighted Annual Average Hours/Year – Agricultural Sector ...................................60 Table 41. Weighted Equipment Activity Distribution – Agricultural Sector (Hr/Yr) ................62 Table 42. Average Annual Activity by Region for Diesel Agricultural Tractors.......................64 Table 43. Weighted Annual Average Hours/Year – Construction and Mining Sector ..............64 Table 44. Weighted Equipment Activity Distribution – Construction and Mining
Sector (Hr/Yr) .................................................................................................................66 Table 45. Weighted Annual Average Hours/Year – Residential Sector.....................................68 Table 46. Weighted Equipment Activity Distribution – Residential Sector (Hr/Yr) .................69 Table 47. Weighted Annual Average Hours/Year – Residual Sector.........................................70 Table 48. Weighted Equipment Activity Distribution – Residual Sector (Hr/Yr) .....................72 Table 49. Weighted Equipment HP Distribution – Agricultural Sector .....................................75 Table 50. Weighted Equipment HP Distribution – Construction and Mining Sector ................77 Table 51. Weighted Equipment HP Distribution – Residential Sector.......................................79 Table 52. Weighted Equipment HP Distribution – Residual Sector...........................................80 Table 53. Model Year Distribution for Selected Equipment – Agricultural Sector ..................81 Table 54. Model Year Distribution for Selected Equipment – Construction and
Mining Sector .................................................................................................................83 Table 55. Model Year Distribution for Selected Equipment – Residential Sector....................83 Table 56. Model Year Distribution for Selected Equipment – Residual Sector........................84 Table 57. Instrumented Vehicle Daily Activity Profiles ............................................................86 Table 58. Fraction of Time at Load and Idle based on RPM......................................................91 Table 59. Surrogate Totals – Survey and Statewide Values for Agricultural Sector ................94
iv
Table 60. SSI Employee Size Bins and Assumed Point Estimates – Construction/Mining and Residual Sectors..............................................................................................................95
Table 61. Surrogate Totals – Survey and Statewide Values for Construction/Mining Sector ..97 Table 62. Residual Sector SIC Groupings by Survey Strata ......................................................97 Table 63. Surrogate Totals – Survey and Statewide Values for Residual Sector .......................97 Table 64. Surrogate Totals – Survey and Statewide Values for Residential Sector ...................97 Table 65. Equipment Type Incidence per 1,000 Acres – Agricultural Sector............................98 Table 66. Equipment Type Incidence per 1,000 Establishments – Construction/
Agricultural Sector........................................................................................................110 Table 74. County Level Equipment Population Surrogates (# Employees) and Allocation
Factors – Construction/Mining Sector ..........................................................................112 Table 75. County Level Equipment Population Surrogates (# Employees) and Allocation
Factors – Residual Sector..............................................................................................114 Table 76. County Level Equipment Population Surrogates (# Households) and Allocation
Factors – Residential Sector..........................................................................................116 Table 77. Estimated Statewide Off-road Equipment Population – All Sectors........................117 Table 78. “Other” Equipment Category Assignments..............................................................119 Table 79. Comparison of Selected Agricultural Equipment Estimates with Agricultural
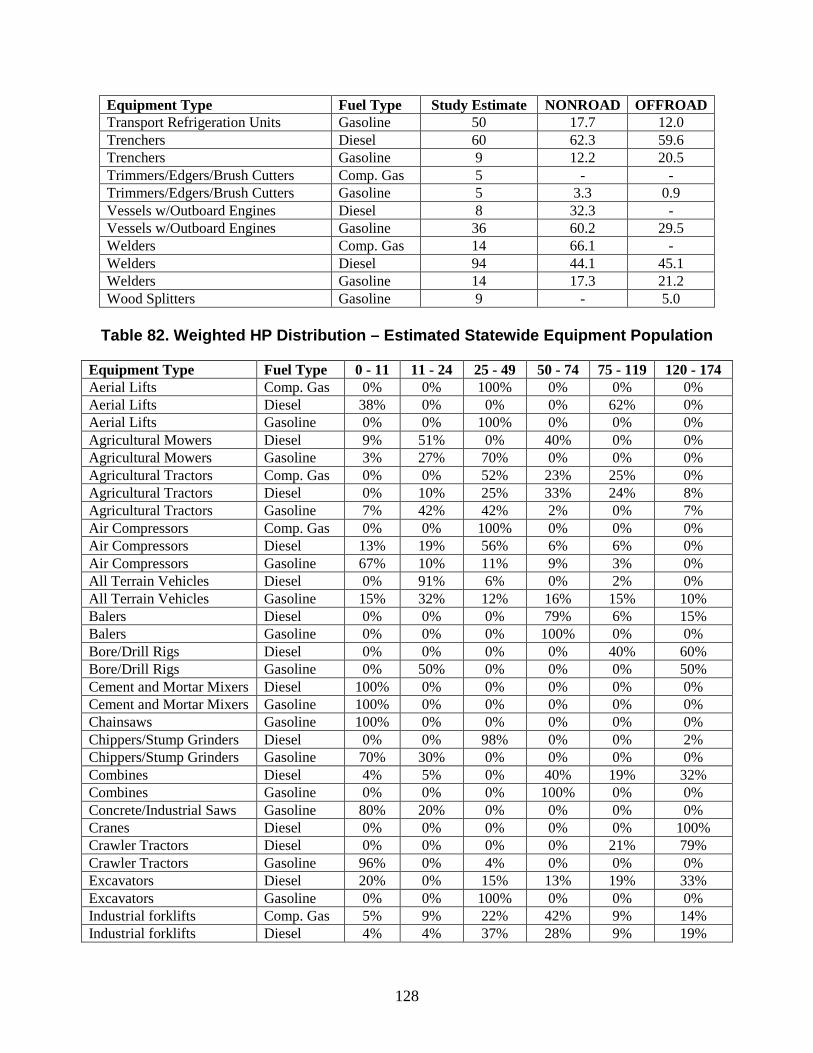
Census Values ...............................................................................................................121 Table 80. Average Annual Activity – Estimated Statewide Equipment Population (Hrs/Yr)..123 Table 81. Weighted Average HP – Estimated Statewide Equipment Population.....................126 Table 82. Weighted HP Distribution – Estimated Statewide Equipment Population...............128 Table 83. 95% Confidence Intervals - Estimated Statewide Activity Estimates.....................131 Table 84. 95% Confidence Intervals - Estimated Statewide HP Estimates.............................133 Table 85. 95% Confidence Intervals - Estimated Statewide Equipment Population...............137 Table 86. Current ARB List to Determine Preempt Off-road Applications ............................138 Table 87. Equipment Population and Activity Distributions by Application Category for
Off-road equipment is a major contributor to pollution levels in California, generating ozone precursors, particulate matter, toxics, and carbon dioxide. These equipment are found in a wide variety of applications, including lawnmowers, bulldozers, aircraft support equipment, and portable generators, among other categories. Off-road equipment is used in essentially all types of businesses, as well as in residential applications. Given the large number of engines involved, and the highly diverse set of operators, off-road engines have proven more difficult to characterize and control than many other emission categories.
In order to develop a more comprehensive and consistent data set of engine characteristics and activity, ARB contracted with Eastern Research Group (ERG) to conduct a study of off-road engines less than 175 horsepower operating in the state. The study was conducted in two phases, with equipment operator surveys and equipment instrumentation techniques developed and tested under Phase I, and full scale data collection and analysis taking place under Phase II. The study results include detailed information on equipment characteristics and activity, including application type, horsepower, and hours per year of use. Surrogates were developed to extrapolate the survey data to statewide totals, as well as to allocate equipment populations to the county level. Instrumentation of data loggers was also performed to collect engine-on time, in-use RPM and exhaust gas temperature data for different types of construction equipment. Based on the study findings, recommendations are provided for updating the current OFFROAD emission factor model, as well as the list of federally preempted off-road equipment in California.
1
Executive Summary
Background
Off-road internal combustion engines are significant contributors to fine particulate matter, air toxics, and ozone precursor emission inventories in California. Their widespread use across many applications requires they receive detailed assessment for both emissions inventory improvement and potential regulatory development in California. The study described in this report was implemented to develop a comprehensive and consistent profile of off-road equipment applications, end-users, populations, and activity patterns for equipment less than 175 horsepower (hp), for the range of different equipment operators across California. The resulting equipment inventory and instrumentation data can be used to: improve current off-road equipment counts and emission inventory estimates; determine if the current list of preempted off-road equipment should be updated; and obtain in-use equipment activity data to help identify equipment types that may be amenable to various control strategy options.
Methods
The study was conducted in two phases, with Phase I involving a small-scale pilot test of the data collection effort. The Phase II study (the subject of this report) implemented the survey and equipment instrumentation methodology developed under Phase I as a full-scale data collection effort. Data collection relied on self-reported information from a representative sample of off-road equipment operators across the state, using questionnaires administered by phone. Working closely with ARB and key stakeholders, the survey study design was developed by identifying the businesses and residences to be included in the study, the equipment types, and the data elements to be collected (e.g., fuel type, annual hours of operation, hp, and how the equipment is used, among others). After completion, survey responses were quality assured, and the equipment population and activity estimates extrapolated to the state level. The effectiveness of the survey was evaluated in terms of the level of uncertainty associated with the final fleet estimates, such as average hp and average hours per year.
In a parallel task construction equipment were selected for data logger instrumentation to collect temporal operation profiles, engine RPM, and exhaust gas temperature. Loggers were installed on each unit for one week. These data provide daily hours of use as well as inferred operation mode (idle versus load) for different equipment types and applications. Such data may be used to help establish operational profiles for emissions estimation and/or control assessments.
Results
The equipment operator survey provided an extensive data set for various off-road equipment/fuel type combinations, including a number of different equipment characteristic and operation parameters. Factors were identified and applied to the reported equipment counts to develop statewide equipment population and activity profiles. An error analysis of the profiles found the confidence levels for average hp and average hours of operation were relatively precise for several key equipment categories. Although equipment population estimates had significantly greater uncertainty, reasonably accurate population, hp, and activity estimates were obtained for diesel agricultural tractors, compressed gas industrial forklifts, and assorted
2
residential lawn and garden equipment. Activity and hp data may also be utilized for other equipment categories.
OFFROAD model year distributions may be updated for some of the most common equipment such as agricultural tractors and compressed gas industrial forklifts. The age distribution for agricultural tractors was heavily weighted toward older units, with the median age more than 20 years old. Fuel type distributions could also provide useful model updates, particularly for diesel all terrain vehicles (ATVs), which are not listed in the current model, and for gasoline agricultural tractors, which were much more prevalent than assumed. Seasonality data indicate a substantial variation in activity levels over the year among agricultural, recreational, and lawn and garden equipment, and could provide a basis for updating the seasonal allocation factors within the model. Geographic allocation factors were also developed for the distribution of statewide populations to the county level.
Comparison of the study’s equipment population estimates with independent data sources indicates a systematic under-reporting of many construction and recreational equipment types. In addition, several specialty equipment categories were identified by a very low number of respondents, or not at all by the survey. More notable examples include: airport GSE, rough terrain forklifts, and TRU. In addition, certain end-user groups appear to be under-represented, namely commercial lawn and garden companies and public sector fleets. As such, alternative data sources are likely needed for these equipment types and end users.
Uncertainty associated with both equipment populations and activity levels make preemption determinations difficult for the different equipment categories. While most activity distributions appear consistent with ARB’s current preemption list, a few exceptions were identified. ATVs merit particular evaluation to determine if they should be included with agricultural equipment.
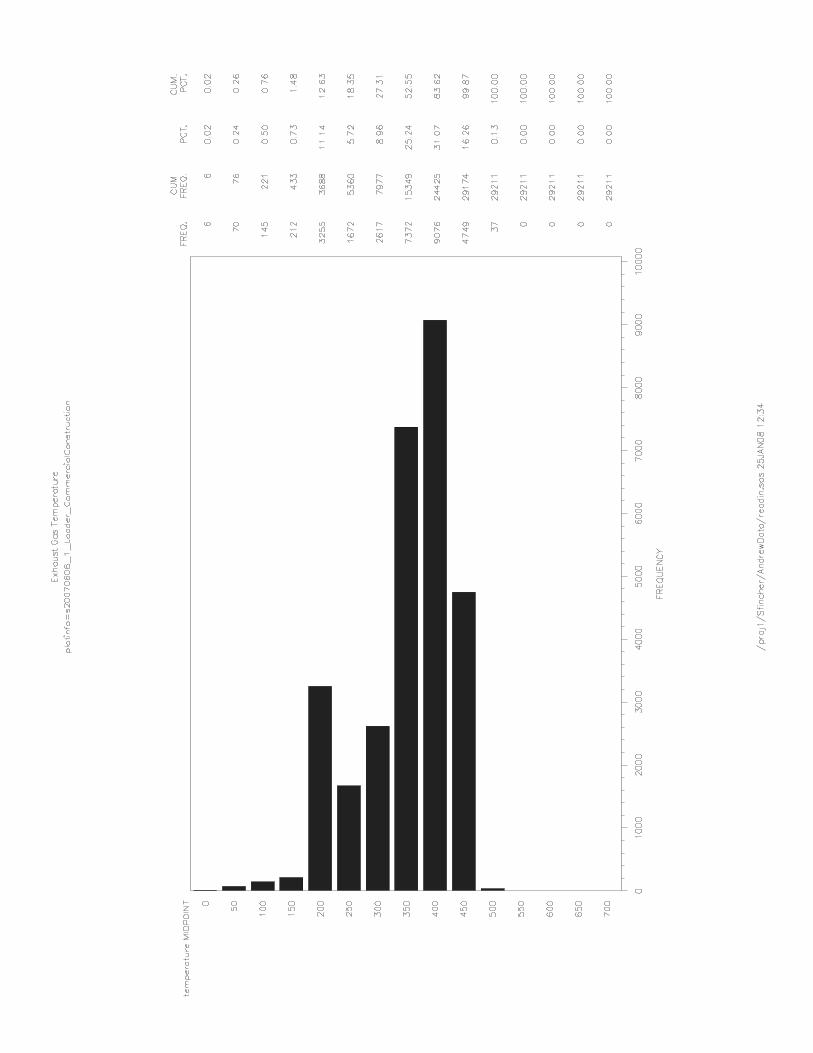
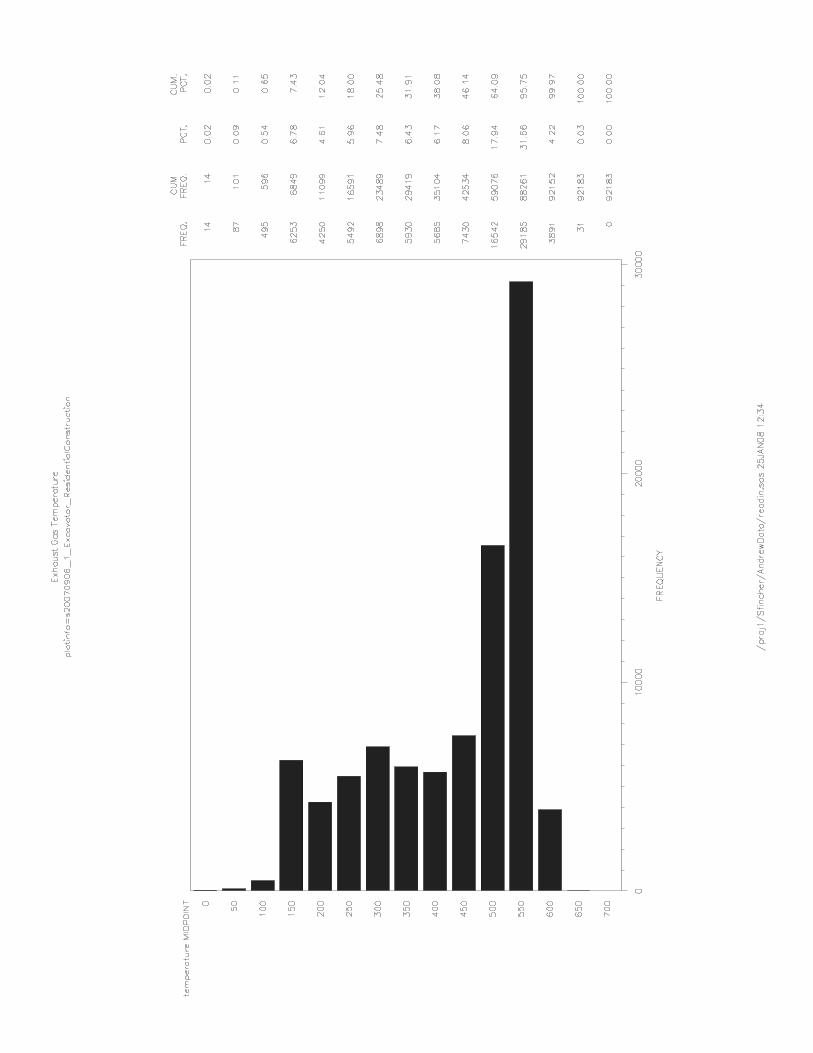
Engine RPM and exhaust gas temperature data were collected on over 70 pieces of construction equipment. Equipment types included backhoes, loaders, and excavators in both public and private operation. Engine on-time covered a broad range, from a few hours per week, to heavy use five or more days per week. Exhaust gas temperature profiles were also highly variable, even within the same equipment category. Accordingly, generalizations about operation time and exhaust gas temperature distributions could not be made regarding the construction fleet in California, or even regarding the specific equipment types instrumented for this survey.
Conclusions
The equipment operator survey successfully collected extensive information on the targeted equipment fleet operating in California, including data on populations, fuel type, hp and model year distributions, annual hours of operation, seasonal activity, and user applications. Much of the equipment population and activity data collected may be integrated into ARB’s OFFROAD model, thereby improving the state’s emissions estimates for off-road sources. Application data may also be used to update ARB’s list of preempted off-road equipment less than 175 hp. Engine instrumentation data may also help design future studies to assess retrofit potentials for construction equipment operating across the state. Recommendations for additional research include conducting targeted assessments of construction and recreational equipment using alternative data sources, and further evaluation of ATV uses for preemption determination.
3
1.0 Introduction
Project Background
Off-road internal combustion engines are significant contributors to the fine particulate matter, air toxics, and ozone precursor emission inventories in California. These sources operate in a broad range of applications for an extremely diverse set of industrial and residential end users, from manufacturing and warehousing companies to recreational boaters. As such, off-road engines have proven more difficult to characterize and regulate than many other emission categories such as on-road mobile and major stationary sources. Nevertheless, their widespread use across so many applications requires they receive detailed assessment for both emissions inventory improvement and potential regulatory development in California.
The California Air Resources Board (ARB) has been at the forefront of emissions inventory and regulatory development in the off-road sector with initiatives such as the Small Off-Road Engine (SORE) rulemaking, and the recently completed residential lawn and garden equipment survey.(1) In addition, in many ways the California OFFROAD emissions model provides more detailed data on a broad range of off-road engine categories than does the U.S. Environmental Protection Agency’s (EPA’s) NONROAD model.
However, much of the equipment population and activity data used in the latest version of OFFROAD are obtained from a host of different data sources, each with its own advantages and disadvantages. For example, the MacKay and Company and Power Systems Research (PSR) data sets used to compile much of the construction, light commercial, and industrial equipment category information are based on nationwide surveys, allocated to California using varying adjustment factors. On the other hand, while the U.S. Department of Agriculture’s (USDA) Agricultural Census data are specific to agricultural equipment in California, the Census does not cover all equipment types in this category. Also, the Portable Equipment Database, which is the basis for certain portable engine information, relies on voluntary registration and therefore underestimates equipment counts to some degree. Finally, for many of these data sources the level of information regarding specific equipment applications and end-users is inadequate for ARB’s needs.
Ideally all the source category information used in OFFROAD and ARB’s regulatory development efforts would be based on comprehensive, bottom-up survey data from across California. In recent years, ARB has taken steps to initiate this process, including development of an inventory for public sector fleets,(2) the residential and commercial/institutional lawn and garden survey and instrumentation studies, and the survey of Transportation Refrigeration Unit (TRU) vendors,(3) among others. In addition, locality-specific inventory information for other source categories such as aircraft ground support equipment (GSE) is sometimes provided at the air district level, in this case often utilizing the Federal Aviation Administration’s (FAA’s) Emission Dispersion and Modeling System (EDMS).
In August 2005, Eastern Research Group (ERG) was selected to conduct continuing research into the characteristics of California’s off-road equipment fleet. The study was conducted in two phases. Phase I covered the tasks associated with planning and designing the study: defining the equipment types for inclusion, defining the data to be collected on the equipment types,
4
developing a survey plan, and creating a survey instrument and sample. Phase I also included a small-scale pilot test of data collection and field instrumentation methods to assess their effectiveness and efficiency. Phase I concluded with documentation of all activities through the pilot test, with recommendations on methodology refinements for the full-scale study.
The full-scale, Phase II study began after submittal of the Phase I report and written authorization by ARB. Minor changes to the equipment operator survey and instrumentation procedures were implemented to improve data collection accuracy and efficiency. The study results include detailed information on equipment characteristics and activity, including application type, horsepower, and hours per year of use. Surrogates were developed to extrapolate the survey data to statewide totals, as well as to allocate equipment populations to the county level. Instrumentation of data loggers was also performed to collect engine-on time, in-use RPM and exhaust gas temperature data for different types of construction equipment. Operator surveys were completed in June of 2007, and equipment instrumentation was completed in November of 2007. Data post-processing, quality assurance and statistical analyses were conducted on the resulting data sets. Based on the study findings recommendations were developed for updating the current OFFROAD emission factor model, as well as the list of federally preempted off-road equipment in California.
This report summarizes the methodology and findings of Phase II of the study.
Project Objectives
Through this study, ARB desired to develop a comprehensive and consistent profile of off-road equipment applications, end-users, populations, and activity patterns for the range of different industrial, public, and residential equipment operators across California. The focus was on off-road equipment less than 175 horsepower (hp). Data collection relied on self-reported information from a stratified random sampling of off-road equipment operators across the state, using questionnaires administered by phone. Additional in-use activity data was collected through the deployment and retrieval of data loggers in the field. This approach, utilizing California-specific, “bottom-up” data collection, was assumed to provide a more reliable characterization of equipment types and use patterns than prior “top-down” efforts, which commonly rely on national data combined with regional allocation routines.
The resulting equipment inventory and instrumentation data was developed to serve the following purposes:
• Create and/or use an equipment categorization scheme consistent with ARB’s OFFROAD model conventions to facilitate the improvement of the emission inventory and regulatory development;
• Characterize equipment populations in the various categories and types by fuel type, engine size, age, annual hours and seasons of use, and the applications of the equipment;
• Obtain in-use data on equipment activity which can be used by ARB to identify types of equipment that are amenable to various control strategy options;
• Provide equipment counts that can be used to estimate total numbers of the equipment at the state and county levels; and,
5
• Determine if the current list of preempted off-road equipment should be updated. Report Organization
The following sections of this report document the study methodology followed for conducting the Phase II data collection, and presents the operator survey and equipment instrumentation results. A discussion of the results, including a statistical analysis and assessment of data set completeness is then presented. A summary of the major findings of the study are presented next, along with recommendations regarding potential updates to the OFFROAD model and the off-road equipment preemption list. Utilization of equipment instrumentation data is also discussed. Finally, recommendations for future refinement of the resulting data set are provided.
6
2.0 Materials and Methods
Overview
The purpose of the Phase II study was to implement the survey and equipment instrumentation methodology developed under Phase I as a full-scale data collection effort. Working closely with ARB and key stakeholders, the Phase I study design was updated to improve survey response rates and data collection efficiency.
The survey study design was then developed by defining the sample frame (e.g., the commercial businesses and residences to be included in the study), equipment types, and the data elements to be collected. Next steps included designing the corresponding survey instrument to collect the required data elements, as well as other survey materials (e.g., survey instructions and advance letter), and programming the survey questionnaire for data collection via telephone.
The Phase II study data collection effort was conducted from February 23, 2007 through May 25, 2007 using telephone interviewing. In order to obtain missing demographic data in the Residential Sector for weighting purposes, a small additional data collection effort was conducted from June 12, 2007 through July 9, 2007 for residential respondents.
Once complete, survey responses were quality assured and otherwise evaluated for reasonableness. The effectiveness of the survey was also evaluated in terms of overall response rates, non-response for individual questions, and other factors that could bias the results of the full-scale survey.
In addition to the survey effort, a parallel task was undertaken to identify candidates for data logger instrumentation, in order to collect temporal operation profiles, engine RPM, and exhaust gas temperature. During Phase II, data loggers were installed on pieces of construction equipment for a period of one week. These data allow for the estimation of daily hours of use as well as inferred mode (idle versus load) for a range of different equipment types and applications. Such data can be used to help establish detailed operational profiles for emissions estimation and/or control assessments.
The following sections of this report document the data collection methods for the survey as well as the instrumentation tasks.
2.1 Equipment Characterization Survey
2.1.1 Sample Frame Development
At the onset of the survey planning process, three broad categories, or sample frames, were identified to characterize the range of possible off-road equipment operators. Samples of potential equipment operators would then be derived from these three distinct sampling frames:
• Agricultural frame, to characterize the agricultural industry, consisting of all farmers and farm management companies in the State of California that report income from the sale of their crops and/or management services;
7
• Commercial frame, consisting of California businesses and public entities. This frame was further disaggregated, using SIC codes, into the following strata for purposes of manageability and subsequent application of surrogates: Construction/Mining, and Other Commercial/Government entities (referred to as the “Residual” sample in this report);
• Residential frame, consisting of listed and unlisted non-business telephone exchanges in the state of California.
After consultation with ARB, stakeholder groups, and sample providers, it was determined during Phase I that additional sample stratification would be necessary to collect sufficiently detailed data for the different sectors. Agricultural entities were identified by crop type as reported to the Federal Census Bureau. The following provides a list of the final agricultural sample strata.1 For a detailed list of all crop types included in each agricultural stratum, please see Appendix A.
• Nut • Row Crop • Tree Fruit • Other • CAFO/Dairy • Farm Management2
During Phase I study design planning, agricultural stakeholders raised concerns regarding how the survey would capture equipment data from farms with “absentee” owners (farm owners that do not reside on the property in question and use a farm management company for all operations), as well as from farms which contract out some, but not all, of their operations to another local farmer (who is not considered a farm management company). These issues were explored further during the Phase I pilot study through interviews with farmers that provide services to, or receive services from, other farmers in their community. To ensure equipment used in these instances was properly captured, farm management firms were included in the sample frame as a separate category.3 Further, the questionnaire was designed to capture equipment owned or leased by individuals (i.e., not farm management companies) who provided agricultural services on land owned by other farmers in addition to their own. To collect this information, the questionnaire asked farmers/operators about the equipment they own and operate in California, as opposed to the equipment used specifically on their farm. “Now, this
1 In order to stratify at this level of detail, the project team used an agricultural database maintained by the US Department of Agriculture (USDA). The sample was purchased through a third party that pays a subscription service for access to the database. The project team received a summary report of crop types grown in California and aggregated them into the categories shown above. 2 Farm management entities are defined as businesses that perform agricultural activities (such as harvesting, plowing, etc.) for other farmers for a fee, as their primary activity. 3 Farm management entities were subsequently re-assigned to one of the remaining strata based on their reported activity type for the purposes of surrogate expansion.
8
next series of questions will focus only on the equipment contained in your current inventory of owned or leased equipment that operates in California” [from telephone interview script].4
Agricultural sample frames were subsequently developed using existing databases maintained by the following commercial sources.
• For non-farm management agricultural entities, the sample frame consisted of an agriculture database maintained by the US Department of Agriculture (USDA), subscribed to by Survey Sampling International (SSI), a commercial survey sample vendor. This database contains nationwide coverage for growers of agricultural crops. In addition to administrative data such as name, address and phone number, the database lists the following for each grower: crop type, acreage, and reported annual income from sale of crop.
• For farm management entities, the sample frame was based on the Standard Industrial Classification (SIC) database maintained by Dunn and Bradstreet. The SIC used is a four-digit code that identifies the primary industry sector of which the company is a member.
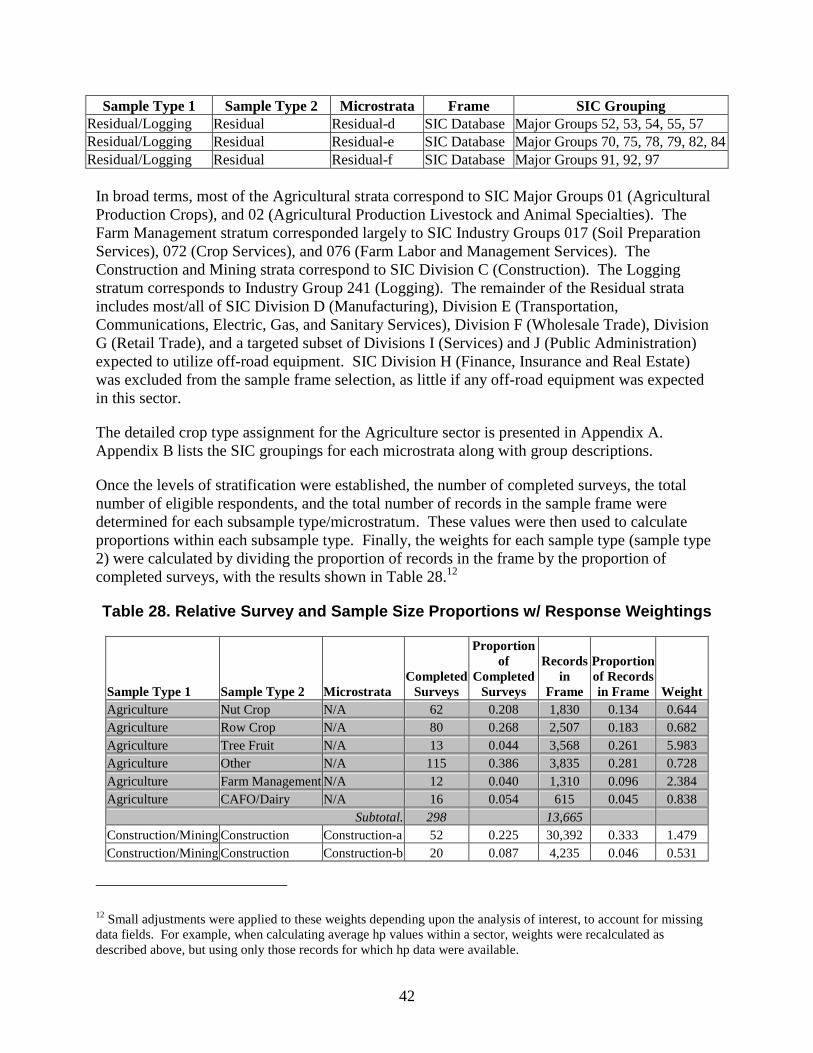
Additional sub-stratification was deemed necessary for the remaining user categories. Mining, logging, and “recreational” sub-strata were defined within the Construction, Residual, and Residential strata, respectively, in order to ensure data collection on specialty equipment types. For further detail on the specific SICs selected for the Agricultural, Construction, and Residual sample frames see Appendix B.
The Residential frame was partitioned into Recreational (or “Target”) and Other (or “Non-Target”), with the Recreational sample defined as households that live in close proximity to recreational areas, such as a major lake or national recreational area. After consultation with ARB staff, the following counties were included in the recreational target substratum: El Dorado, Imperial, Lake, Merced, Napa, and Placer. The areas selected as the basis for the Recreational sub-strata are also shown in Figure 1.
Although households located in other areas of the state may travel to the designated Recreational area counties and use their off-road equipment there from time to time, no attempt was made by the survey to characterize the transient movement of equipment to other regions. This was true for other survey sectors as well. Therefore equipment identified through the surveys was assumed to be operated in the county where the associated respondent was located.
4 One option for collecting information on equipment used on a property but is not owned or leased by the owner/farmer is to obtain a referral of the name of the operator/service provider, and then conduct a subsequent survey with this additional contact. ARB decided against this option for several reasons, including the potential response error resulting from service providers inaccurately reporting annual/seasonal activity data for equipment used on a particular farm, as well as the overall increase in data collection costs to pursue potentially multiple referrals for a single farm.
9
Figure 1. Location of Recreational Target Sub-Stra ta
2.1.2 Survey and Sample Size Determination
A total of 1,200 completed surveys were originally planned for the full-scale study. Table 1 presents the goals of the study for the total number of completed interviews, taking into consideration the surveys completed in the Phase I pilot study. The table first presents the original study goals followed by the revised study goals based upon the pilot results. The precision estimates refer to the confidence interval for the total number of completes at the 95% confidence level.
Table 1. Pilot and Full Study Completes By Sample T ype and Sub-Strata
Original Full Study Revised Full Study
Sample Type
Phase I Pilot
Completes Full Study Total
Pilot + Full Precision Full Study Total Pilot + Full Precision
The total completed surveys were reduced from 1,200 to 1,100 as a result of the response rates in the Phase I pilot study. However, perhaps due to the changes made to the survey procedure based on ARB and stakeholder input, interviewing productivity was higher than anticipated and the revised study goals were exceeded for all Sample Types (see Table 9 for details).
At the onset of a survey study it is generally unknown how many sample records would be required to obtain the target number of survey completions for each strata and sub-strata. “Ineligible” sample can arise for a number of reasons – establishments are no longer in business; they have moved operations out of state; the business was bought out and now is listed under a new owner or name; etc. Moreover, not all establishments will operate off-road equipment. Finally, not all establishments will ultimately cooperate with the study. For these reasons it is important to obtain substantially more sample than the targeted number of completed surveys.
The sample needs estimated for the full study are presented in Table 2. Estimates are based on SIC lists obtained from Dunn and Bradstreet for the State of California, US Census data, past survey experience using listed and unlisted sample, and Phase I survey results including contact and non-contact rates, screening response rates, eligibility and survey completion rates.
Table 2. Estimated Number of Sample Records Needed to Meet Survey Targets
Sample Type Sub-strata Minimum Quota Assumed Completes
Completion Rate
Total Sample
Nut Crop 34 Row Crop 45 Tree Fruit 29 Other Crop 46 CAFO/DAIRY 12
Agriculture
Farm Management 7
275 3.5% 7,000
Construction 210 Construction
Mining* 5 225 2.4% 9,000
Logging* 5 Residual
Other 258 275 4.0% 6,500
Recreational* 75 Residential
Other 145 325 2.7% 11,500
Total 1,100 3.1% 34,000 *The universe totals for these sub-strata are low and minimum quotas could not be applied to the corresponding sample types.
Completion rates refer to the fraction of all respondents in the sample that are eligible to participate and actually complete the survey. Response rates refer to the fraction of eligible respondents that actually participate in the survey. Surveys are adjusted for low/high response rates using analytic weights, as discussed in Section 3.1.4.
Table 2 also shows target quotas by sample subtype. Setting minimum quotas ensures that the sample is representative of all the sample subtypes. Minimum quotas were set such that they met the following criteria:
11
• The minimum quotas for each sample subtype should be proportional to the distribution of the count of completes by sample subtypes within a sample type.
• The sum of the minimum quotas by sample subtypes within a sample type should represent 70% of completes required for that sample type. This will ensure that the sample type is well represented within each sample subtype.
When the minimum quota level defined above is reached for each sample subtype, the remaining completes required for the full study could be met by completes from sample subtypes that are easier to obtain. This approach ensured that the sample is well represented within each sample type and within the available budget. In addition, since the actual call lists were developed randomly from within each sample subtype, and since response weights were ultimately used to adjust for non-response bias (see Section 3.1.4), the final weighted data set was also representative of the sample universe as a whole. Maintaining this representativeness in the final data set was a primary goal of the study methodology itself. This methodology works well for strata that are characterized by robust universe counts such as Agriculture. However, when this methodology is applied to strata with small universe counts (particularly Mining and Logging), the resulting minimum quotas are too small to ensure any type of statistical validity. As such, in lieu of using the same method for establishing minimum quotas for these substrata, a different approach was necessary, as described below.
1) Construction and Mining Stratum. This stratum is characterized by one substratum that has a very high universe count (Construction) and one substratum that has a very low universe count (Mining). As such, applying the “minimum quota” methodology would result in a minimum quota of 1 for the Mining substratum, which is not recommended. Rather, known sample performance parameters from the pilot survey and known universe counts were used to identify a quota of 5 completed surveys for the Mining substratum, with the balance coming from the Construction substratum (210).
2) Residual Stratum. Similar to Construction and Mining, this stratum is characterized by one substratum that has a very low universe count (Logging) and one substratum that has a very high universe count (Residual). To prevent a very small cell size for the Logging substratum, known sample performance parameters from the pilot survey and known universe counts were used to identify a quota of 5 completed surveys for the Logging substratum, with the balance coming from the Residual substratum (258).
3) Residential Stratum. This stratum is fundamentally different from the others since the sampling element is a household, not a commercial establishment. Similar to the method implemented with the Agriculture Stratum, a Residential minimum quota was established for the Residential substratum such that the minimum quota represented 70% of the completes required for that sample type. Upon review of pilot sample performance parameters, it was decided to have one third of the minimum quota come from the Recreational target substratum, with the balance coming from the remainder of the residential substratum.
12
The generation of SIC-based samples involved providing a list of appropriate SIC codes to SSI for each sample type, as well as the number of requested sample records. Samples were then randomly selected from the SIC database by SSI and delivered electronically for further processing. SSI generated the non-farm management agriculture sample in a similar manner by randomly querying the USDA database until the specified number of records by crop type and farm size had been generated. The files were then delivered electronically.
Upon receipt, the electronic sample was processed for dialing by partitioning the sample into “replicates,” or subsamples, of the main sample. Each replicate ranged in size from 67 to 250 sample pieces, with each replicate containing sample of the same sample strata. The database contained non-address related information (except first and last name), phone number and geographic identifier (census tract). The database also contained a unique sample number to link each record between databases and track each record throughout the survey process.
2.1.3 Survey Instrument Design
The survey instrument (or questionnaire) contained approximately 20 questions. The first series of questions establishes eligibility (owning and/or leasing at least one piece of off-road equipment with a maximum horsepower rating of less than 175), then proceeds with the substantive part of the data collection effort. In addition to collecting details on the numbers and types of equipment contained in a respondent’s inventory, the survey also asks respondents for the seasonal and annual use of each piece of equipment, as well as details on fuel type, horsepower and displacement, etc. These data fields were selected to be consistent with the key data needs of the OFFROAD model. Information on primary and secondary applications of the equipment was gathered as well, to assess the accuracy of ARB’s current off-road equipment preemption list.
Cognitive testing5 of a draft version of the questionnaire was conducted during Phase I. Minor adjustments to question wording and flow were made based on the cognitive test results. In addition, to facilitate respondent completion, the survey instrument was tailored to each specific Sample Type. For instance, example equipment categories were made appropriate for construction, residential, and agricultural respondents.
2.1.4 Updates to Phase I Study Design
Based on the findings of the Phase I study it was determined that the advance letter and mail out/internet version of the survey were not effective in improving response rates, and were withdrawn from the Phase II study design. In addition, a number of edits were made to the questionnaire to improve organization and comprehensibility, including the following:
5 A cognitive interview is a preliminary test of a draft survey questionnaire with persons that possess similar characteristics to the survey’s intended audience, involving in-person interviewing. The testing objectives are related to the question-answering process for potentially complex questions, assessing the respondents’ ability to provide an answer by examining their comprehension of questions, and their ability to retrieve relevant information from memory. Cognitive interviews are also used to assess the adequacy of the questionnaire flow (structure and design).
13
• The screening questions were rearranged and restructured so that eligibility would be established at the onset of the survey;
• The definition of target equipment was refined to read “Off-road Vehicle or Off-road Equipment means any non-stationary device used off the highways and powered by an internal combustion engine or electric motor, including equipment such as portable generators”;
• Two questions were deleted because the pilot study revealed that the flagging for large and small inventories was unnecessary. Not a single “large inventory” respondent opted to complete the survey using an alternative survey approach;
• Text was added to prompt respondents to confirm seemingly anomalous equipment application types (e.g., recreational equipment claimed to be used in agricultural activities); and,
• References to “compressed natural gas” were changed to “natural gas”. In addition, based on input from the agricultural stakeholder group nurseries were moved from the Agricultural to the Residual sample frame (see next section), and CAFO/Dairy respondents were asked for the number of head of cattle rather than acreage (to facilitate more accurate surrogate expansion of the results).
A copy of the final survey instrument is provided in Appendix C.
2.2 Equipment Instrumentation
As part of the effort to characterize off-road engine operation, data loggers were to be installed to record selected engine parameters on pieces of equipment operated in the construction and mining sector in California. At the start of the study, ARB determined to limit instrumentations to equipment in the construction and mining sector. This limitation was made in part due to the extremely diverse equipment and application types within the agricultural and residual sectors. In addition, the construction and mining sector is heavily dominated by large diesel equipment, and therefore is a predominant contributor to total nitrogen oxide (NOx) emissions from off-road engines.
In Phase I of this assessment, data loggers were installed on two pieces of construction equipment, one with a mechanically controlled diesel engine, and one with a computer controlled diesel engine, for a period of one week in order to establish instrumentation and data processing protocols. At the request of ARB, ERG modified the Phase I instrumentation protocol to incorporate collection of exhaust gas temperature data in addition to engine on-time and RPM under Phase II for more than 70 pieces of construction equipment. The resulting operation profile can be used to help assess the potential effectiveness of various retrofit options (e.g., diesel particulate filters and diesel oxidation catalysts).
2.2.1 Data Logger Characteristics
During Phase I a data logger made by Clēaire was chosen to log engine parameters. The Clēaire logger was selected because it is normally used to monitor diesel engine parameters, as well as to operate emissions control systems that can be retrofit onto diesel vehicles. Therefore it has many more capabilities than simply recording RPM data. The main parts of the Clēaire logger system
14
are shown in Figure 2. The gray box contains the logic and memory of the data logger. The various black and blue umbilicals connected to the gray box are used to transmit engine data, emission control system data, and to power the logger. In Phase II three umbilicals were always used, one to transmit the RPM signal to the logger, one to power the logger, and one to transmit exhaust temperature. The unused umbilicals were secured safely out of the way during data logging operations.
Figure 2. Cl ēaire Data Logger System (Source: Cl ēaire)
2.2.2 Sensor Installation
RPM was recorded using two methods. The preferred method utilized a Hall-effect sensor installed in the bell-housing of the engine to sense the teeth of the flywheel as they pass the sensor during engine operation (see Figure 3). Since the flywheel is directly connected to the crank-shaft of the engine, its rate of spin is directly proportional to the RPM of the engine. This method required an accessible, threaded port of the proper size in the engine’s bell-housing.
Unfortunately, such a port was often not available. Accordingly, a second method of RPM detection used the Hall-effect sensor to determine the rate of spin of an idler pulley on the alternator belt of the engine. Since the alternator belt is driven by the crank-shaft of the engine, its speed is also directly proportional to the RPM of the engine. The idler pulley was fashioned like the rubber wheel of an in-line skate, with shielded ball bearings that come with the wheel, and a bolt (used as a shaft for the pulley). Heavy upholstery tacks were pushed into the rubber wheel in a symmetric pattern to provide the Hall-effect sensor moving metal objects to sense as the wheel rolled on the belt. An installed idler pulley RPM sensor is shown in Figure 4.
15
Figure 3. Hall-Effect Sensor Installed in Bell-Hou sing of Engine
RPM was calibrated in the field using the RPM readout and the engineering judgment of the installers (both of whom were mechanical engineers). This method was considered adequate to differentiate between engine idle and loaded modes of operation. A more precise calibration of RPM would have been required in order to fully quantify engine load, however.
Exhaust temperature was typically monitored at the exit of the exhaust pipe. A thermocouple (type K) was inserted into the exhaust stream, approximately 3-inches into the exhaust pipe. The end of the thermocouple was kept from touching the interior of the exhaust pipe by rigidly securing the base of the thermocouple to a spring ‘stand-off’ on the exterior of the pipe, then bending the thermocouple into a ‘U’ shape so it extended into the exhaust pipe without touching the interior wall. In some cases, exhaust temperature thermocouples were already installed in the exhaust system (for example, when a particulate filter system had been retrofitted onto the vehicle). In these instances, ERG simply tapped into the existing exhaust thermocouple.
2.2.3 Logger Installation and Removal Procedures
ERG developed a standard procedure to ensure consistent quality of the installation and resulting data. To begin installation, the installer familiarized himself with the vehicle and, if necessary, had an operator demonstrate safe engine starting and stopping procedures. Then the data logger, sensors, and signal and power wires were laid out and loosely attached to temporarily secure them. Then the system was tested to ensure all components were working properly. The calibrated RPM was required to fall between 650 and 850 at idle, and between 1,500 and 3,000 at maximum governed engine speed. The thermocouple reading had to be reasonable when held in ambient conditions, with the exhaust above 200 degrees C at high RPM. After RPM and temperature readings had been quality assured in the field, the installer secured all connections, wires, and the logger and connections safely out of the way of all engine operations and maintenance.
When possible the installer would periodically check active data logging systems already on the engine to determine if any repairs or recalibrations were necessary. In the cases where a logger system failed, ERG would diagnose the problem and re-start the logging. At least one week of logging was required before a system was removed. In those cases where a system had to be removed in less than one week, another piece of equipment was found and the logging process was re-started.
A copy of the field installation and retrieval procedure is provided in Appendix D.
2.2.4 Equipment Sample
ARB specified a list of equipment types for instrumentation during Phase II. This list was based upon a review of previous off-road equipment surveys and internal discussions among ARB staff.(4) The preferred equipment list is shown in Table 3. Three age bins were specified as desirable: 1995 and older, 1996 to 2001, and 2002 and newer, although no specific quotas were established for the different bins.
17
Table 3. Target Construction Equipment Categories for Instrumentation
ERG negotiated with many fleet owners to identify equipment for instrumentation. With a few notable exceptions, publicly owned fleets tended to be the most cooperative and willing to participate. A list of the publicly owned fleets contacted for this study is shown in Appendix E.
The three private fleets participating in the study were owned by Teichert Construction, Doug Veercamp Construction, and Hobday Equipment Rental. Twelve other private fleet owners were contacted for participation in the study and either did not have equipment needed for the study or were unwilling to participate.
Most installations occurred in the Sacramento area. However, installation locations ranged from Woodland in the north to Fresno in the south, and from Rescue in the east to Vacaville in the west. Figure 5 indicates the areas where installations were performed. Areas of installation are indicated by red, dashed ovals. All but one area (Stockton) resulted in at least one calendar week of contiguous logging.
The original logging schedule was scheduled for the summer of 2007. However, various logistical, equipment, and participant issues resulted in significant delays to the schedule. As a result, logger installations occurred from the beginning of April until the end of November of 2007. Figure 6 shows the days during which loggers were operational.
19
Figure 6. Calendar Showing Days of Logger Operatio n
2007 Mo Tu We Th Fr Sa Su Mo Tu We Th Fr Sa Su Mo Tu We Th Fr Sa Su Mo Tu We Th Fr Sa Su Mo Tu We Th Fr Sa Su Mo Tu
A total of 75 pieces of equipment had an operational logger installed for a contiguous week. Table 4 summarizes the pieces of equipment successfully instrumented for this project. The Unit ID corresponds to the date of installation. If more than one piece was installed on a given day, the serial number at the end of the ID differentiates between them. The “Activity Days” column lists the dates which produced activity data for the piece of equipment. Unit Type was assigned using the nomenclature provided by ARB. Only a few pieces were operated every day during the 7 days of installation. However, most pieces operated during 3 or more days of the week. This sample may have been biased toward equipment that operates less frequently than average. Fleet operators may have directed ERG installers to the less active pieces to minimize disruptions in their schedules.
As seen in the table there was substantial sampling on loaders, backhoes, and compactors due to their relative abundance and availability during the project. Unfortunately, no snow graders, rollers, pavers, or trenchers were successfully instrumented.
A more detailed discussion of the data logger findings is provided in Section 3.2.
20
Table 4. Instrumented Equipment Detail
Unit ID Install Start Activity Days Install End Uni t Type Make Model Engine Year
20070401-1 4/1/2007 1,2 4/7/2007 Loader Caterpillar IT 38G 2004
20070503-1 5/3/2007 3,4,8,9 5/9/2007 Loader Case W11 1981
The findings for the equipment survey and instrumentation tasks under Phase II of the study are presented below.
3.1 Equipment Survey Results
The data collected during the survey effort provides detailed information for a wide variety of off-road equipment types and end-users. The following sections provide general descriptive statistics as well as in-depth statistical analyses regarding equipment populations and characteristics directly influencing emissions estimates, including fuel types, activity profiles, hp distributions, and age distributions, among other factors.
3.1.1 Post-Processing and Quality Assurance
Once the survey results were compiled, formatted, and cleaned by the data collection subcontractor, the equipment data were subjected to additional range checks and quality assurance measures to ensure the quality and accuracy of the data set. Evaluations focused on assuring accurate assignment of equipment to appropriate OFFROAD model equipment categories, identification of missing hp values, refinement of equipment application assignments, excluding any non-target equipment, and identification and treatment of suspected outliers. The following describes the various quality assurance measures applied to the survey data set.
Equipment Category Assignments
ERG used the equipment list in ARB’s OFFROAD equipment file to map respondent equipment descriptions to the standardized equipment listing. Assignments were based on the contractor’s familiarity with off-road equipment types as well as web searches. There were many instances where a corresponding equipment type could not be found in ARB’s OFFROAD file. In these instances, the original respondent equipment type description was retained. Another exception involved equipment that was electrically powered or manually operated. In these cases, regardless of equipment type, an equipment type of “Electric” or “Manual” was assigned and these records were set aside from the rest of the data tables for later ARB evaluation. Table 5 summarizes the electric equipment type descriptions reported by survey sector.
Table 6 provides a list of unique respondent equipment types and the corresponding ARB equipment type. Non-electric equipment for which no clear category match was established were subsequently grouped together in “Miscellaneous” categories, as discussed later in this report (see Table 7).
24
Table 5. Electric Equipment Type Descriptions by S urvey Sector
Harvester(s) Combine(s) Underground Saw Saw* Hedge Trimmer Trimmers/Edgers/Brush Cutters Vacuum Vacuum* High Ranger Bucket Truck Aerial Lifts Vacuum Cleaner Vacuum* Hot Tar Pump Pumps Vacuum Vacuum*
Hunter Alignment Rack Hunter Alignment Rack* Vacuum Pot Holing (Excavating) Vacuum Pot Holing (excavating) *
Hydro Power Unit(s) Hydro Power Units Vertical Milling Machine Milling Machine
Hydropump Hydro Power Units Wacker Trimmers/Edgers/Brush Cutters
Ice-Machines Ice Machine* Water Boiler Boiler* Industrial Tractor(s) Rubber Tired Loaders Water Extractor Water Extractor* Irrigation Set(s) Irrigation Sets* Wave Rider Personal Water Craft
Jack Hammer Jack Hammer* Weed Eater Trimmers/Edgers/Brush Cutters
Jet Skies Personal Water Craft Weed Wacker Trimmers/Edgers/Brush Cutters
John Deere Unknown John Deere* Weed Whacker Trimmers/Edgers/Brush Cutters
In cases where the respondent did not provide a specific horsepower value for a piece of equipment, horsepower assignments were made based on the following decision rules, presented in order of precedence.
A. Where equipment make and model were provided, web searches were utilized to find hp information when available.
B. Where a hp range was provided, the average of the minimum and maximum horsepower range was used. Standard hp ranges provided to respondents included:
The survey included several standardized use categories including:
• Agricultural production and harvesting; • Automotive; • Building or construction; • Industrial; • Other (e.g., cleaning or maintenance) – to be specified; • Personal or residential; • Recreational; and • Warehousing.
In some instances when a respondent selected the “Other” category, the additional description provided by the respondent fit within one of the standardized uses originally presented to them. In these instances, the use was changed from “Other, specify” to the appropriate use from the standardized list. The most common reassignments moved “lawn care,” “lawn maintenance,” “yard care,” and “gardening” to the Personal/Residential category.
Excluded Records
Some records were excluded from the data set based on answers indicating they were ineligible for inclusion in the study. The number of non-electric records excluded from analyses, and on what basis they were excluded, are summarized in Table 7.
31
Table 7. Basis and Count of Excluded Records
Reason for Exclusion # of Records Zero Hours Operation 133 On-road Equipment 14 Outside hp Range 15 Manual Operation 3 Pneumatic Equipment 1 Refusal to Provide Equipment Info6 1 Total Records 167
Outlier/Anomaly Identification
Some respondent answers for horsepower and/or activity were identified as outliers, either too high or too low, based on: horsepower ranges presented in ARB’s OFFROAD model, hp ranges presented in EPA’s NONROAD2005 model,(7) comparison with other respondent answers, known acceptable fuel types for specific equipment types, or, in the case of activity, the number of hours in a year. In consultation with ARB the contractor flagged suspect values for further investigation. In these instances, the data collection subcontractor made an initial round of call-backs to obtain clarification. Later, the contractor attempted to contact remaining respondents for clarification. A summary of the second round of survey call-backs is presented in Table 8.
Table 8. Call Summary – Second Round Call-backs
Number of Respondents Identified for Call-backs 162 Number of Records with Outliers/Anomalies 392 Number of Call-backs Attempted 119
No Answer 16 Left Message 51 Fax Number 3 Disconnected Number 4 Other Miscellaneous Responses 9
Number of Respondents without Contact Information 6 Number of Respondents Identified - Not Called* 39 Number of Records Updated 27 Number of Records Verified as Correct 19 *These represent records in the construction sector that had a seemingly low horsepower or activity upon initial QA. After several phone calls to these types of outliers within this sector, it became apparent that these low numbers were acceptable due to very limited use. 3.1.2 Survey Rates
As shown in Table 9, the combined results from the pilot and full-study totaled 1,164 completed surveys, exceeding the study goal of 1,100.
6 Respondent indicating owning/operating a piece of covered equipment but would not specify type or other data.
32
Table 9. Completed Questionnaires by Sample Type
Sample Type Target # of Completes Actual # of Completes Percent Actual Agriculture 275 298 26% Construction and Mining 225 246 21% Residuals 275 293 25% Residential 325 327 28% Total 1,100 1,164 100%
Surveys that were completed over and above the expected number were the result of the mixed-mode administration of the survey (i.e., additional mail-in questionnaires were received after telephone interviews were conducted).
In order to determine how the survey “performed” for each sample type, disposition tables were developed to provide results for all sample records identified for the pilot survey, as well as assorted survey response parameters. Table 10 provides a description of the final dispositions for all sample records that were used during the pilot and full-study surveys, by response sector.
Table 10. Final Dispositions for Final Off-road Sam ple
The great majority of the sample was of unknown eligibility, meaning that either contact was never made with that record or the call resulted in a callback or a soft refusal prior to eligibility being determined.7 Overall, once contact was made with an eligible equipment operator the vast majority of operators went on to complete the survey (1,164 of 1,468).8 A large number of phone contacts were made with ineligible parties (i.e., entities that did not own/operate any off-road equipment < 175 hp.) The incidence rate (the ratio of ineligible to eligible respondents) was
7 A soft refusal is someone who initially says they won't participate in the survey. They are called back until they make it clear they have no intention to participate. 8 Eligible respondents responded “yes” to the questions: (1) do you own or lease at least one piece of off-road equipment, and (2) does that equipment have a maximum horsepower rating of less than 175?
33
highest for the Agricultural Sector, at 50%. The incidence rates for the remaining three sectors were all quite close, between 23% and 24%.
The differences in incidence rates are also reflected by the “completes per hour” values shown in Table 10. These data indicate a substantial increase in data collection efficiency for the full study compared with the Phase I pilot.
3.1.3 Respondent Profiles
Profiles were developed to broadly characterize the survey respondents, in order to qualitatively demonstrate broad representativeness of off-road equipment operators as a whole. Detailed statistical analyses, including confidence intervals, are presented in Section 4 for each equipment/fuel type combination.
Because of the extreme variation within the agricultural industry (e.g., types of crop, acreage range), the agriculture sample was further broken down into six segments to ensure representation within the industry’s multiple crops: Tree Fruit (apricots, peaches, lemons, etc), Row Crops, Nut Crops, and Other Crops (including vineyards), Farm Management Companies and CAFO/Dairy.9 For a complete listing of crop category assignments, see Appendix A.
Tables 11 thru 14 summarize the number of completes by respondent type within the Agriculture, Construction and Mining, Residential, and Residual Sectors, respectively. Completed surveys for the Agriculture sector in Table 11 are also reported by geographic area, distinguishing respondents within the San Joaquin Valley (SJV) from those in the rest of the state.10 SIC breakouts for the Construction and Residential sectors were selected to reflect different equipment utilization patterns, based on contractor experience.
Table 11. Completed Surveys by SSI Crop/Service Ty pe – Agricultural Sector
Completed Surveys Crop/Service Type SJV Other Areas
Total Percentage
Tree Fruit 3 10 13 4% Row Crop 38 42 80 27% Nut Crop 49 13 62 21% Other Crop 41 74 115 39% Farm Management 8 4 12 4% CAFO/Dairy 2 14 16 5% Total 141 157 298 100%
9 CAFO – Concentrated Animal Feeding Operations. 10 SJV consisting of Fresno, Kern, Kings, Madera, Merced, San Joaquin, Stanislaus, and Tulare counties.
34
Table 12. Completed Surveys by SIC Group – Constru ction and Mining Sector
SIC Group Description SIC Total Heavy-Highway 1611, 1622 13 Other Heavy Construction 1629 5 Utility 1623 2 Residential Buildings 1521, 1522, 1531 42 Other Buildings 1541, 1542 10 Special Trades - Excavation 1794 10 Special Trades - Other - all other 1700s (less 1794) 149 Mining 1000s, 1200s, 1400s 15 Total 246
Table 12 indicates a predominance of respondents in the residential building and “special trades – other” category.
Table 13. Completed Surveys by Region – Residentia l Sector
Residence Area Total Percentage Non Target 240 73% Target 87 27%
Total 327 100%
Table 14. Completed Surveys by SIC Group – Residua l Sector
SIC Group Description SIC Total
Division A - Non Agricultural 100s – 999, excluding 0711, 0721, 0722,
Total 293 The respondents in the Residual sector were relatively dispersed across a wide range of SIC groupings, although only a small number fell in the government category (i.e., public administration).
The respondent categories listed in Table 11 were obtained directly from SSI, the sample provider for the Agricultural Sector. Eligible respondents were subsequently asked to categorize their operations by crop type, as shown in Table 15. This crop type categorization, based on stakeholder recommendations, provides slightly more detail than the SSI categories. In addition, respondents reporting to provide Farm Management services (39 of the 298 completes) also reported the crop type they typically service: citrus, one; CAFO/dairy, two; nut, 10; row, 12; other tree fruit, eight; and vineyards/other, six.
35
Table 15. Completed Agricultural Surveys by Self-R eported Crop Type
Crop Type Completes - SJV Completes – Other Areas Total Completes Tree Fruit (non citrus) 18 36 54 Row Crop 26 36 62 Nut Crop 40 14 54 Vineyard/Other Crop 29 42 71 Citrus 15 16 31 CAFO/Dairy 13 13 26 Total 141 157 298
This study assumed the self-reported crop type provides a more accurate representation of respondent operations than the sample frame categories, and was used for subsequent analyses.
Table 16 provides a detailed breakout of the acreage covered by county for the acreage covered by the survey. The table also provides the total acreage in farms by county from the 2002 Agricultural Census (8). Survey coverage appears broadly representative of the state, with 55% of surveyed acreage occurring within the SJV which contains 50% of the state’s agricultural land.
Table 16. Completed Surveys and Associated Acreage by County – Ag. Sector
* Does not include responses or acreage from CAFO/Dairy ^ SJV counties
Tables 17, 18, and 19 present the number of completed surveys by county for the Construction and Mining, Residential, and Residual sectors, respectively.
37
Table 17. Completed Surveys by County – Constructi on and Mining Sector
County # Completes County # Completes Alameda 6 Riverside 11 Butte 1 Sacramento 6 Calaveras 1 San Benito 1 Colusa 1 San Bernardino 13 Contra Costa 5 San Diego 12 El Dorado 3 San Francisco 2 Fresno 10 San Joaquin 8 Glenn 2 San Luis Obispo 8 Imperial 2 San Mateo 3 Inyo 1 Santa Barbara 3 Kern 7 Santa Clara 7 Kings 2 Santa Cruz 3 Los Angeles 40 Shasta 3 Madera 4 Siskiyou 4 Marin 3 Solano 1 Mendocino 3 Sonoma 8 Merced 1 Stanislaus 6 Monterey 5 Tehama 1 Napa 4 Tulare 5 Nevada 1 Tuolumne 1 Orange 21 Ventura 6 Placer 8 Yolo 3 Total 246
Table 18. Completed Surveys by County – Residentia l Sector
County # Completes County # Completes Alameda 8 Placer 18 Amador 1 Riverside 15 Butte 7 Sacramento 5 Calaveras 1 San Bernardino 13 Colusa 1 San Diego 17 Contra Costa 11 San Joaquin 7 El Dorado 6 San Luis Obispo 5 Fresno 9 San Mateo 3 Glenn 1 Santa Barbara 6 Humboldt 4 Santa Clara 10 Imperial 11 Santa Cruz 6 Kern 9 Shasta 4 Kings 1 Siskiyou 2 Lake 61 Solano 3 Los Angeles 22 Sonoma 5 Marin 1 Stanislaus 6 Mendocino 1 Sutter 2 Merced 3 Tulare 6
38
County # Completes County # Completes Monterey 7 Tuolumne 1 Napa 7 Ventura 4 Nevada 4 Yolo 3 Orange 9 Yuba 1 Total 327
Table 19. Completed Surveys by County – Residual S ector
County # Completes County # Completes Alameda 9 Sacramento 14 Butte 1 San Bernardino 13 Calaveras 1 San Diego 19 Colusa 2 San Francisco 2 Contra Costa 5 San Joaquin 8 El Dorado 2 San Luis Obispo 4 Fresno 11 San Mateo 4 Glenn 2 Santa Barbara 4 Humboldt 2 Santa Clara 14 Imperial 2 Santa Cruz 5 Kern 7 Shasta 2 Kings 2 Sierra 1 Los Angeles 48 Siskiyou 3 Madera 1 Solano 6 Mariposa 1 Sonoma 8 Mendocino 9 Stanislaus 12 Merced 2 Tehama 3 Monterey 2 Trinity 2 Napa 1 Tulare 4 Nevada 1 Tuolumne 2 Orange 22 Ventura 9 Placer 4 Yolo 5 Riverside 11 Yuba 1 Total 293
Agriculture respondents other than CAFO/Dairy were also asked to provide information on their associated total acreage. The average acreage per farm for each crop type is provided in Table 20, with row crops having the largest average size and tree fruit the smallest.
Table 20. Agricultural Respondent Mean Acreage by Crop Type
Crop Type Mean Acreage Owned or Leased SJV Other Areas Nut Crop 340 186 Row Crop 192 266 Tree Fruit (non-citrus) 90 144 Citrus 110 93 Vineyard/Other 450 173
39
Tables 21, 22, 23, and 24 summarize the average, minimum, and maximum number of pieces of equipment owned or operated by the respondents for each of the survey sectors. These summary tables provide a general indication of the variability in fleet sizes for the different sectors.
Table 21. Agricultural Respondent Pieces of Equipm ent by Crop/Service Type
Crop/Service Type Number of Pieces of Equipment/Respondent SJV Other Areas Avg. Min Max Variance Avg. Min Max Variance Nut Crop 5.4 1 23 28.8 3.9 1 8 5.9 Row Crop 3.2 1 7 3.8 3.9 1 17 12.9 Tree Fruit (non-citrus) 3.1 1 10 4.9 3.3 1 15 13.1 Citrus 3.3 1 11 6.8 3.3 1 9 8.2 Vineyard/Other 8.2 1 65 151.0 4.1 1 19 23.4 CAFO/Dairy 3.5 1 6 1.6 3.8 1 10 6.5
The variance of the distribution is also shown, indicating a relatively wide distribution across fleet size for the vineyard/other category in the SJV. Much of this variation is due to a single respondent operating 65 pieces of equipment, with the next largest fleet consisting of only 25 units.
Table 22. Construction and Mining Respondent Pieces of Equipment by Service Type
Service Type Average Min Max Variance Construction 2.9 1 30 15.0 Mining 4.1 1 20 25.5
The construction and mining respondents show a somewhat wider distribution in fleet
sizes relative to most of the agricultural crop/service type fleet.
Table 23. Residential Respondent Pieces of Equipme nt by Region
Respondent Area Average Min Max Variance Non Target 2.2 1 14 3.4 Target 2.2 1 9 2.7
The residential sector exhibits the tightest distribution of the four survey sectors, as expected.
Table 24. Residual Respondent Pieces of Equipment by Service Type
Service Type Average Min Max Variance Logging 6.2 1 23 47.2 Residual 2.9 1 130 70.6
40
Not surprisingly the residual sector shows the widest variance in fleet sizes of the four survey sectors, likely due to the variety of SICs included in this sector.
3.1.4 Response Weightings
After the survey data had been quality assured and cleaned, analytic weights were developed to reflect selection probabilities as well as to adjust for potential non-response bias. For example, it is possible that businesses with larger equipment inventories may not participate at the same rate as businesses that use little or no eligible equipment. Such differential non-response could bias the results of the survey because the commercial distribution of surveyed off-road equipment users would not represent the population distribution of businesses using off-road equipment. To illustrate, if businesses with only one piece of eligible off-road equipment participated in the survey at twice the rate as businesses with two or more pieces of eligible equipment, then the estimated total pieces of equipment based only on the survey data (i.e., without adjustment) would understate the actual population total. For this reason analytic weights were developed to correct for this type of bias for both the residential and commercial samples, as discussed below.
A total of 1,164 completed surveys of eligible respondents were collected. Table 25 summarizes the distribution of these surveys across sample type. In this case Agricultural sample types refer to SSI categorizations rather than self-reported crop types (see Table 11).
Table 25. Distribution of Completed Surveys by Samp le Type – Unweighted
Sample Type 1 Sample Type 2 Frequency Agriculture Nut Crop 62 Agriculture Row Crop 80 Agriculture Tree Fruit 13 Agriculture Other 115 Agriculture Farm Management 12 Agriculture CAFO/Dairy 16 Construction/Mining Construction 231 Construction/Mining Mining 15 Residual/Logging Logging 13 Residual/Logging Residual 280 Residential Target 87 Residential Non-target 240
Total 1,164 As discussed above, two separate sample frames were used for the selection of the commercial (non-residential) sample data. The first source was an agriculture database maintained by SSI. In addition to administrative data such as name, address and phone number, the full-coverage nationwide database of farmers contains crop type and reported income from the sale of crops. The second source was SSI’s B2B database, which contains a comprehensive list of nationwide
41
businesses based on the Dunn and Bradstreet SIC code database.11 Table 26 identifies the sample frame from which each commercial sample type was drawn.
Table 26. Commercial Surveys by Sample Type – Sampl e Frame
Sample Type 1 Sample Type 2 Frame Agriculture Nut Crop Agriculture Database Agriculture Row Crop Agriculture Database Agriculture Tree Fruit Agriculture Database Agriculture Other Agriculture Database Agriculture Farm Management SIC Database Agriculture CAFO/Dairy Agriculture Database Construction/Mining Construction SIC Database Construction/Mining Mining SIC Database Residual/Logging Logging SIC Database Residual/Logging Residual SIC Database
Weights were created at the subsample level (sample type 2) for the agricultural sector. Due to the large number of completed surveys collected within the construction sector, and the wide range of establishment types present (and corresponding wide range of SIC codes), the construction category was further stratified into three microstrata (construction-a, construction-b, construction-c). Similarly, the residual category was stratified into six microstrata (residual-a through residual-f). Each construction and residual microstratum represents a grouping of similar establishment types (based on SIC division and/or major group). Table 27 provides a detailed breakdown of corresponding SIC grouping by various levels of stratification.
Table 27. Sample Type, Sample Frame and Correspondi ng SIC Grouping – Commercial Sectors
Sample Type 1 Sample Type 2 Microstrata Frame SIC Grouping Agriculture Nut Crop N/A Ag. Database Codes 0173, 0179 (partial) Agriculture Row Crop N/A Ag. Database Industry Group 011, 013 Agriculture Tree Fruit N/A Ag. Database Codes 0174, 0175, 0179 (partial) Agriculture Other N/A Ag. Database Codes 0161, 0171, 0172, 0191 Agriculture Farm Management N/A SIC Database Codes 0711, 0721, 0722, 0762 Agriculture CAFO/Dairy N/A SIC Database Industry Group 021, 024 Construction/Mining Construction Construction-a SIC Database Major Group 15 Construction/Mining Construction Construction-b SIC Database Major Group 16 Construction/Mining Construction Construction-c SIC Database Major Group 17 Construction/Mining Mining N/A SIC Database Major Groups 10, 12, 14 Residual/Logging Logging N/A SIC Database Industry Group 241 Residual/Logging Residual Residual-a SIC Database Division A - Non Ag Residual/Logging Residual Residual-b SIC Database Divisions D, E Residual/Logging Residual Residual-c SIC Database Division F
11 Dunn and Bradstreet is the industry standard for drawing samples of establishments for commercial surveys.
42
Sample Type 1 Sample Type 2 Microstrata Frame SIC Grouping Residual/Logging Residual Residual-d SIC Database Major Groups 52, 53, 54, 55, 57 Residual/Logging Residual Residual-e SIC Database Major Groups 70, 75, 78, 79, 82, 84 Residual/Logging Residual Residual-f SIC Database Major Groups 91, 92, 97 In broad terms, most of the Agricultural strata correspond to SIC Major Groups 01 (Agricultural Production Crops), and 02 (Agricultural Production Livestock and Animal Specialties). The Farm Management stratum corresponded largely to SIC Industry Groups 017 (Soil Preparation Services), 072 (Crop Services), and 076 (Farm Labor and Management Services). The Construction and Mining strata correspond to SIC Division C (Construction). The Logging stratum corresponds to Industry Group 241 (Logging). The remainder of the Residual strata includes most/all of SIC Division D (Manufacturing), Division E (Transportation, Communications, Electric, Gas, and Sanitary Services), Division F (Wholesale Trade), Division G (Retail Trade), and a targeted subset of Divisions I (Services) and J (Public Administration) expected to utilize off-road equipment. SIC Division H (Finance, Insurance and Real Estate) was excluded from the sample frame selection, as little if any off-road equipment was expected in this sector.
The detailed crop type assignment for the Agriculture sector is presented in Appendix A. Appendix B lists the SIC groupings for each microstrata along with group descriptions.
Once the levels of stratification were established, the number of completed surveys, the total number of eligible respondents, and the total number of records in the sample frame were determined for each subsample type/microstratum. These values were then used to calculate proportions within each subsample type. Finally, the weights for each sample type (sample type 2) were calculated by dividing the proportion of records in the frame by the proportion of completed surveys, with the results shown in Table 28.12
Subtotal. 298 13,665 Construction/Mining Construction Construction-a 52 0.225 30,392 0.333 1.479 Construction/Mining Construction Construction-b 20 0.087 4,235 0.046 0.531
12 Small adjustments were applied to these weights depending upon the analysis of interest, to account for missing data fields. For example, when calculating average hp values within a sector, weights were recalculated as described above, but using only those records for which hp data were available.
Total 1,164 489,586 Note: The proportions for each shaded/non-shaded region sum to 1. * Residential proportions derived from relative number of households in Target and Other Residential area counties. These weights were applied to the data when conducting analyses at the sector level. Table 29 provides the resulting weighted frequency distribution by sample type.
Table 29. Weighted Survey Response Totals
Sample Type 1 Sample Type 2 Microstrata Final Weight Completed Surveys - Weighted Agriculture Nut Crop N/A 0.644 40 Agriculture Row Crop N/A 0.682 55 Agriculture Tree Fruit N/A 5.983 78 Agriculture Other N/A 0.728 84 Agriculture Farm Management N/A 2.384 29 Agriculture CAFO/Dairy N/A 0.838 13 Construction/Mining Construction a 1.479 77 Construction/Mining Construction b 0.531 11 Construction/Mining Construction c 0.901 143 Construction/Mining Mining N/A 1 15 Residual/Logging Logging N/A 1 13 Residual/Logging Residual a 1.082 24 Residual/Logging Residual b 1.070 85 Residual/Logging Residual c 1.339 55 Residual/Logging Residual d 0.974 49 Residual/Logging Residual e 0.774 66 Residual/Logging Residual f 0.840 3 Residential Target N/A 0.127 11 Residential Other Residential N/A 1.317 316
Total 1,164* * Summation (1,167) difference due to rounding error
44
3.1.5 Equipment Inventory Findings
The following provides descriptive statistics for a variety of survey parameters, including equipment and fuel type distributions, activity profiles and application types, and hp and model year distributions. The analysis excludes electric equipment from all but the equipment type distribution analysis. These profiles are provided at the sector level – a detailed statistical analysis is provided for the statewide equipment population as a whole in Section 4.
Equipment Type Distributions
Weighted equipment counts were tallied for each equipment type identified by survey respondents. For this summary, equipment types are not differentiated by fuel or application type. For example, lawn mowers are reported in the Agricultural Sector totals, although this equipment was almost exclusively designated as “personal/residential” use. Fuel type and application distributions are discussed separately below, and in more detail in the Preemption Analysis in Section 4.
The reported equipment type distribution within the Agricultural sector is presented in Figure 7. Forty two separate equipment types were reported altogether, for a total weighted equipment count of 1,183. Note that agricultural tractors were by far the most common piece of equipment reported, and are not presented in the figure due to scale considerations. Of the remaining equipment types, ATVs were the next most prevalent, followed closely by sprayers. Although with substantially lower totals, industrial equipment such as forklifts, construction equipment such as rubber tire loaders and tractor/loader/backhoes, and lawn and garden equipment such as trimmers and lawn mowers are fairly common as well. The Miscellaneous category included a wide variety of equipment types, none of which totaled more than three observations. These included generators sets, balancers, and tillers, among others, with 18 individual equipment categories included in all. The majority of the remaining units consisted of a number of specialty agricultural equipment. Miscellaneous equipment categories in this sector are listed below, along with their weighted population counts.
Figure 7. Agricultural Sector Population Distribut ion (w/out tractors)*
72
60
28 2722
19 1612 12 11 10 10 9 8 7 7 6 6 4 1
0
10
20
30
40
50
60
70
80
ATVs
Spray
ers
Misc
. Equ
ipmen
tFor
klifts
Ag Sw
eepe
rHarve
sters
Balers
Rubbe
r Tire
d Lo
ader
s
Agricu
ltura
l Mow
ers
Trimm
ers/E
dger
s/Bru
sh C
utte
rsElec
tric
Sprea
der
Tracto
rs/L
oade
rs/Bac
khoe
sSha
ker
Swathe
rs
Woo
d Spli
tters
Fron
t/Rid
ing M
ower
sLa
wn M
ower
sPum
psIrr
igatio
n Set
s
Equipment Type
Wei
ghte
d S
urve
y C
ount
s
* 837 ag tractors
N = 1,183 weighted units
46
The low number of pumps and irrigation sets reported in this sector was unexpected and may be indicative of under-reporting on the part of survey respondents rather than actual low population counts. Specifically, we suspect that respondents may not have considered these equipment types to be “off-road” even though agricultural pumps were explicitly included in the list of example equipment for this sector.
Figure 8 presents the weighted distribution of equipment types reported within the Construction and Mining sector. A broad range of reported equipment types are included, covering 42 categories, for a total of 641 weighted pieces of equipment. Electric equipment was by far the most common category at 188 pieces, and is excluded from the chart due to scale. Of the remaining equipment types, generator sets, air compressors, and tractor/loader/backhoes are ubiquitous within this sector. Although substantially less common, skid steer loaders and industrial forklifts are the next most common types.
Heavier pieces of equipment such as excavators and crawler tractors/dozers are much less common in the Construction and Mining sector, perhaps because units less than 175 hp are relatively uncommon for these categories. The most common construction equipment categories are represented to some degree however, with the exception of rough terrain forklifts and surfacing equipment. Thirteen equipment categories were included in the Miscellaneous category, with none having greater than five observations. These included assorted lawn and garden equipment, unspecified vacuums, and various specialty equipment (e.g., pipe threaders). Miscellaneous equipment categories in this sector are listed below, along with their weighted population counts.
• Tillers (1) • Vessels w/ outboard engines (1) • Storm grinders (<1) • Chippers/stump grinders (<1) • Material handling - other (<1) • Water truck (<1)
Figure 9 summarizes the equipment distribution reported for the Residential sector. This sector reported the lowest number of discrete equipment categories with 27. The total weighted equipment count for this sector came to 704 units. Lawn mowers, electric equipment, trimmers/edgers/brushcutters, and chainsaws were pervasive within this sector. Perhaps unexpected, agricultural tractors were reported with some frequency. Alternatively, certain types of recreational equipment were reported only infrequently (e.g., personal watercraft and minibikes). Miscellaneous equipment categories in this sector are listed below, along with their weighted population counts.
Figure 8. Construction and Mining Sector Populatio n Distribution (w/out Electric Equipment*)
86 84 81
2921 18 17 17 16
12 11 10
0
10
20
30
40
50
60
70
80
90
100
Gener
ator
Set
sAir
Compr
esso
rs
Trac
tors
/Loa
ders/
Backh
oes
Skid S
teer
Loa
ders
Fork
lifts
Misc
Equ
ipment
Press
ure
Was
hers
Rubber
Tire
d Lo
ader
s
Rollers
Bore/D
rill R
igs
Excav
ator
s
Spraye
rs
Equipment Type
N = 641 weighted units
* 188 electric pcs
48
Figure 8. Construction and Mining Sector Populatio n Distribution Continued
8
55 5 5 4
4 4
3
21 1 1
1 1
0
1
2
3
4
5
6
7
8
9
Pumps
Grade
rs
Concre
te/In
dustr
ial S
aws
Fron
t Mow
ersCra
wler T
racto
rs
Cement a
nd M
ortar M
ixers
Aerial
Lifts
Weld
ers
Crane
sPav
ing E
quipm
ent
Scrap
ers
Signal
Board
sTr
ench
ers
Paver
sPlat
e Com
actor
Equipment Type
Wei
ghte
d S
urve
y C
ount
49
Figure 9. Residential Sector Equipment Population Distribution
245
144
9071
33 26 19 16 13 10
0
40
80
120
160
200
240
280
Lawn
Mow
ers
Electri
c
Trim
mer
s/Edg
ers/B
rush
Cut
ters
Chains
aws
Leaf
Blower
s/Vac
uum
sFr
ont/R
iding
Mower
sOff-
Road M
otor
cycle
sAgr
icultu
ral T
racto
rs
Tille
rs
ATVs
Equipment Type
Wei
ghte
d S
urve
y C
ount
N = 704 weighted units
50
Figure 9. Residential Sector Equipment Population Distribution Continued
5
5 44 4
33
3 3
1
0
1
2
3
4
5
6
Press
ure W
ashe
rs
Vesse
ls w/O
utboar
d Eng
ines
Gener
ator
Set
sChi
pper
s/Stu
mp
Grinde
rsPer
sona
l Water
Cra
ft
Misc
equ
ipmen
t
Shred
ders
Golf C
arts
Specia
lty V
ehicl
es C
arts
Mini
bikes
Equipment Type
Wei
ghte
d S
urve
y C
ount
51
Figure 10 presents the equipment distribution for the Residual sector. This sector reported the greatest number of equipment types at 48, with 860 weighted units. This finding is not surprising since this sector covers the broadest range of applications (commercial, other than agricultural and construction/mining).
Electric equipment is by far the most common, followed by industrial forklifts. The high number of transportation refrigeration units (TRUs) appears to be an anomalous result, with all units being reported by a single respondent – no other TRUs were reported among any other respondent in any sector.
The remainder of the reported categories in the Residual sector consisted largely of various agricultural, construction, and lawn and garden equipment. The Miscellaneous category consisted of a very wide range of equipment types (31 total), with none having more than 3 observations. The following equipment types were included in the Miscellaneous category for this sector, along with their weighted populations.
While this sector reported a very diverse range of equipment categories, several specialty pieces of equipment were not identified (e.g., ground support equipment, or “GSE”), due to the overall rarity of such equipment, and the limited sample size in this sector.
A geographic breakdown was also prepared for the Agricultural sector, differentiating between equipment operated in the San Joaquin Valley (SJV) and other areas of the state. Table 30 summarizes the non-electric equipment categories and weighted equipment counts for all equipment reported by Agricultural sector respondents, broken out by production region. (Note that all equipment and fuel type data presented in this and subsequent tables refer to non-electric equipment, unless otherwise noted.)
52 Figure 10. Residual Sector Equipment Population Di stribution
283
192
145
46 4225 20 19 15 13 12 11 10 10 6 6 6
0
50
100
150
200
250
300
Electri
cFo
rklift
s
Trans
port R
efrig
erati
on U
nits
Agricu
ltura
l Tra
ctors
Misc
. Equ
ipmen
t
Trac
tors
/Loa
ders/
Backh
oes
Gener
ator
Set
s
Trim
mer
s/Edg
ers/B
rush
Cut
ters
Fron
t/Rid
ing M
owers
Rubbe
r Tire
d Lo
ader
sCha
insaw
s
Agricu
ltura
l Mow
ers
Air Com
pres
sors
ATVs
Pumps
Tille
rs
Leaf
Blower
s/Vac
uum
s
Equipment Type
Wei
ghte
d S
urve
y C
ount
N = 860 weighted units
53
Table 30. Equipment Categories and Counts Reported by Agricultural Region
Region Reported Equipment Categories Weighted Equipment Count SJV 26 639 Other Areas 31 534 Total 42 1,173
Fuel Type Distributions
Fuel type was specified for all but 35 pieces of equipment (~1% of non-electric equipment records). Fuel type assignments for these units were made allocating them proportionally among other units in the same equipment category. Fuel type distributions were calculated for the weighted equipment counts, by survey sector. Percentages are provided for gasoline, diesel, and compressed gas (including LPG and natural gas). All equipment categories are presented, regardless of the number of observations - a formal uncertainty analysis is performed for unique equipment/fuel type combination in Section 4.
Table 31 presents the weighted fuel type distributions for the Agricultural sector. Notably, 94% of agricultural tractors were diesel powered, with the remainder powered by gasoline. Similarly, most traditional agricultural equipment was predominantly diesel, including balers, combines, shakers, and swathers. Notable exceptions include agricultural mowers and sprayers, which are predominately gasoline powered. Gasoline engines were also predominant among lawn and garden equipment and generator sets. The majority of industrial forklifts were powered by compressed gas (specifically LPG), although significant numbers were also powered by gasoline and diesel as well. Some unusual equipment/fuel type combinations are also seen, including compressed gas spreaders and welders, although these distributions are likely not representative of the equipment population as a whole given the low observation count for these pieces.
Table 31. Weighted Fuel Type Distribution – Agricul tural Sector
Table 32 presents the weighted fuel type distributions for the Construction and Mining sector. All of the larger construction equipment categories are dominated by diesel engines, including bore/drill rigs, cranes, crawler tractors, excavators, graders, loaders, rollers, skid steers, and backhoes. Gasoline engines are more common in smaller equipment, including air compressors, cement and mortar mixers, saws, generator sets, pressure washers, pumps, sprayers, and assorted lawn and garden equipment. Industrial forklifts were again predominately powered by LPG.
Table 32. Weighted Fuel Type Distribution – Constr uction/Mining Sector
Table 33 presents the weighted fuel type distributions for the Residential sector. This sector is populated almost exclusively with gasoline powered equipment, with minor exceptions for ATVs and outboard engines.
Table 33. Weighted Fuel Type Distribution – Residen tial Sector
Table 34 presents the weighted fuel type distributions for the Residual sector. Among the equipment categories with significant observations, agricultural tractors, skidders, and heavy construction equipment accounted for most of the diesel engines. Gasoline engines predominated in agricultural mowers and other smaller equipment, including ATVs, generator sets, pumps, and lawn and garden equipment. Compressed gas was the predominant fuel type for industrial forklifts, with small contributions among air compressors and generator sets.
Table 34. Weighted Fuel Type Distribution – Residua l Sector
* 1 aerial lift, 3 car lifts, 1 tire balancer and 1 tire changer had no fuel type reported, and are excluded from the table. ^ 1% reported “dual fuel – gasoline/propane”
Application Distributions
Survey respondents characterized the percent of time each piece of equipment was used for the following applications:
• Agricultural production, harvesting, or processing; • Automotive; • Building or construction; • Industrial uses; • Personal or residential; • Recreational; • Warehousing; • Other, such as cleaning or maintenance (to be specified by respondent).
Application type distributions were provided for over 98% of non-electric equipment records. The following tables summarize the fraction of time attributed to each of the application types listed above for each sector, averaged across all equipment types. (A detailed analysis of applications at the equipment/fuel type level is presented in the Preemption Analysis in Section 4.) Note that no attempt was made to determine the cause of any apparent discrepancies (e.g., construction sector respondents reporting recreational equipment use), although such responses were confirmed during the survey call.
Summary tables were prepared for each sector using the equipment records with reported application type distributions. Table 35 presents the results for the Agricultural sector. Over 97% of all equipment activity in this sector is attributed to agricultural uses, with personal/residential uses having the next highest percentage. A small number of “other” applications included beekeeping and delivery activities.
58
Table 35. Application Type Distribution – Agricultu ral Sector, All Equipment
Use Category Reported Utilization Agricultural production, harvesting or processing 97.09% Automotive 0.08% Building or construction 0.23% Other such as cleaning or maintenance 0.75% Personal or residential 1.30% Recreational 0.05% Warehousing 0.51%
Table 36 presents the findings for the Construction and Mining sector. Although over 78% of all activity was identified as construction-related, non-trivial activity was also reported for the Other category, as well as industrial, agricultural, personal, and warehousing. “Other” category descriptions included pool cleaning, boat building, general painting, and delivery, among others.
Table 36. Application Type Distribution – Construct ion/Mining Sector, All Equipment
Use Category Reported Utilization Agricultural production, harvesting or processing 3.72% Automotive 0.19% Building or construction 78.56% Industrial 3.80% Other such as cleaning or maintenance 7.39% Personal or residential 3.33% Recreational 0.76% Warehousing 2.24%
Table 37 presents the findings for the Residential sector. In this case almost 85% of all equipment use was deemed for personal or residential purposes. The next highest utilization was for recreational purposes, at ~8%. “Other” applications listed included fire protection and care of pastures. No responses were provided for industrial or warehousing applications.
Table 37. Application Type Distribution – Residenti al Sector, All Equipment
Use Category Reported Utilization Agricultural production, harvesting or processing 3.23% Automotive 0.08% Building or construction 1.41% Other such as cleaning or maintenance 2.70% Personal or residential 84.65% Recreational 7.94%
Table 38 presents the findings for the Residual sector. This sector displayed the most diverse range of applications, as expected, with industrial applications having the highest percentage. Agricultural applications had the next highest percentage, followed closely by warehousing and “other” uses. “Other” applications were numerous (41 distinct descriptions), and included
59
characterizations (e.g., “commercial use”) as well as highly specific descriptions (e.g., grave digging).
Table 38. Application Type Distribution – Residual Sector, All Equipment
Use Category Reported Utilization Agricultural production, harvesting or processing 20.11% Automotive 4.75% Building or construction 3.55% Industrial 35.01% Other such as cleaning or maintenance 13.13% Personal or residential 6.30% Recreational 0.66% Warehousing 16.49%
Seasonal Activity Distributions
Survey respondents estimated the percentage of time each piece of equipment was operated by season. Seasonal allocation estimates were provided for approximately 78% of all equipment records. For those records with seasonal distribution estimates, reported annual hours for each piece of equipment were allocated across the four seasons and summed across all non-electric equipment types to obtain total hours of activity by season for each sector. The final distributions are reported for each sector in Table 39.
Table 39. Seasonal Activity Distribution by Survey Sector
Sector Winter Spring Summer Fall Agricultural 15% 28% 32% 25% Construction & Mining 23% 25% 28% 24% Residential 11% 29% 40% 21% Residual 23% 26% 27% 24%
As anticipated, the Agricultural and Residential sectors experience their lowest activity levels in the winter and their highest levels in the summer, with the extremes more pronounced for the Residential sector. The activity distributions for the Residual and Construction/Mining sectors are effectively level across all four seasons.
Average Annual Activity
Annual activity for the 2007 calendar year was specified for 83% of non-electric equipment records. Annual activity averages were calculated using weighted equipment counts, by survey sector. All equipment categories are presented, regardless of the number of observations - a formal uncertainty analysis is performed for unique equipment/fuel type combinations in Section 4.
Table 40 presents the average hours per year for the Agricultural sector, along with the weighted number of units without a reported hour per year value. Diesel agricultural tractors had by far the highest number of observations, followed by gasoline powered ATVs and gasoline powered
60
tractors. Note that only 12 equipment/fuel type combinations had 10 or more weighted counts. Of these, only three equipment categories were estimated to operate more than about 500 hours per year in this sector (compressed gas forklifts, gasoline ATVs and rubber tire loaders). Table 41 presents the corresponding weighted activity distribution for equipment in this sector.
Table 40. Weighted Annual Average Hours/Year – Agri cultural Sector
As a point of reference, a comparison was also made between activity in the SJV region and the rest of the state for diesel agricultural tractors, as shown in Table 42. As seen, activity levels are similar across regions.
Table 42. Average Annual Activity by Region for Die sel Agricultural Tractors
Region Weighted Count* Average Hrs/Yr Diesel Ag. Tractors – SJV^ 444 370 Diesel Ag. Tractors - Other areas^ 330 418
* Weighted counts only provided for equipment categories with hours per year. ^ One SJV region observation with missing hr/yr response; eight missing hr/yr responses from other areas.
Table 43 presents the average hours per year for the Construction and Mining sector. Diesel backhoes and gasoline generator sets had the most observations, followed by gasoline air compressors and LPG industrial forklifts. Nine equipment/fuel type combinations had 10 or more weighted counts. Of these, diesel backhoes, diesel bore/drill rigs and compressed gas industrial forklifts averaged greater than 1,000 hours per year, while the remainder averaged approximately 600 hours per year or less. Table 44 provides the corresponding weighted activity distribution for this sector.
Table 45 presents the average hours per year for the Residential sector. Common lawn and garden equipment including lawn mowers, trimmers/edgers/brushcutters, chainsaws, and leaf blowers/vacuums had the highest number of observations. Eight equipment/fuel type combinations had 10 or more observations. Of these, all averaged less than 100 hours per year of activity. The corresponding activity distribution for this sector is presented in Table 46. From this table it is clear that the vast majority of all equipment use in this sector is less than 100 hours per year.
Table 43. Weighted Annual Average Hours/Year – Cons truction and Mining Sector
Table 47 presents the average hours per year for the Residual sector. Gasoline TRUs and LPG industrial forklifts were by far the most common, followed by assorted agricultural, lawn and garden, construction, and general industrial equipment. Eleven equipment categories featured 10 or more observations. Of these, the gasoline TRUs had the highest average activity at 2,300 hours/year, followed by diesel backhoes and LPG industrial forklifts at 1,130 and 1,056 hours/ year, respectively. Of the remaining eight units with 10 or more observations, none exceeded 650 hours/year. Table 48 provides the corresponding activity distribution for this sector.
Table 47. Weighted Annual Average Hours/Year – Resi dual Sector
For this analysis point estimates were derived from the hp bins by taking the midpoint of the range, shown in parentheses above.
For many of those equipment records without a hp estimate, ERG was able to identify a hp value based on equipment make, model, and model year data provided by the respondent. After gap filling in this manner, approximately 89% of all equipment records were assigned a hp estimate.
Weighted population counts were tallied for equipment/fuel type combinations within each sector to estimate average hp values as well as distributions across the different hp bins. However, due to limited sample sizes and granularity in the data, only those equipment categories with the largest number of observations may accurately represent the population’s true hp distribution. A more detailed evaluation of average hp for the statewide fleet is included in Section 4, including quality assurance assessments.
Tables 49 thru 52 present the hp distributions for the Agricultural, Construction and Mining, Residential, and Residual sectors, respectively.
75
Table 49. Weighted Equipment HP Distribution – Agri cultural Sector
Model years were provided by survey respondents for roughly one half of the non-electric equipment records. ERG was able to identify additional model year estimates for many units based on reported make and model from vendor references. In these cases ERG assigned model year based on the midpoint of the manufacturing period range. Once gap filling was complete 65% of all equipment records had a model year assignment.
Nevertheless, the majority of equipment categories did not have enough observations to provide a meaningful model year distributions. Therefore model year distributions were only developed for selected equipment/fuel type combinations, using weighted equipment counts for each sector. The model year bins presented in the tables below vary by equipment category in order to illustrate the distribution in the most appropriate fashion. However, with the possible exception of diesel agricultural tractors, the data sets for even these equipment categories are relatively thin, and data smoothing would be needed in order to estimate actual distributions for use in the OFFROAD model.
Table 53 presents the model year distribution for the most prevalent equipment/fuel type combinations in the Agricultural sector. Both gasoline and diesel agricultural tractors are heavily weighted toward the oldest model year bin. Gasoline sprayers also appear to be substantially weighted toward the older model year bins. Diesel combines and balers, on the other hand, appear to be more uniformly distributed across the range of model years.13 Finally, gasoline powered ATVs tended to have the newest model year distribution, which may reflect their increasing popularity in agricultural applications.
Table 53. Model Year Distribution for Selected Equ ipment – Agricultural Sector
* Weighted counts only provided for equipment categories with model year Figure 11 provides a detailed breakout of the weighted model year distribution for diesel agricultural tractors.
13 The limited number of observations, coupled with one respondent having purchased five diesel balers in 1998, causes a spike in the baler distribution in the 1995 – 1999 bin that is likely not representative of the population as a whole.
82
Figure 11. Model Year Distribution – Diesel Agricu ltural Tractors
0
5
10
15
20
25
30
35
1935
1947
1952
1958
1962
1966
1969
1972
1975
1978
1981
1984
1987
1990
1993
1996
1999
2002
2005
Model Year
Wei
ghte
d T
otal
Given the high age of many of the agricultural tractors recorded in the survey, a separate analysis was conducted to determine if there was an inverse correlation between equipment age and activity for this equipment category, under the assumption that older equipment requires more maintenance and is slowly phased out in favor of newer equipment. However, Figure 12 indicates no clear relationship between age and utilization for diesel agricultural tractors.
Figure 12. Diesel Agricultural Tractor Hrs/Yr vs. Age
y = -7.9893x + 514.42
R2 = 0.0989
-500
0
500
1000
1500
2000
2500
3000
0 10 20 30 40 50 60 70 80
Age (Yrs)
Hrs
/Yr
Table 54 presents the model year distribution for the most common equipment/fuel type combinations in the Construction and Mining sector. In general, the smaller equipment categories (air compressors, generator sets, and skid steer loaders) appear to have newer age distributions than heavier equipment (loaders and backhoes). Granularity is again a concern, with spikes appearing in the 2005 – 2006 period for diesel air compressors and gasoline generator sets, due to a small number of respondents making multiple equipment purchases in
83
the same year (with one respondent purchasing five diesel air compressors in 2005, and two respondents purchasing 13 gas generator sets in 2006.) Nevertheless, the overall trend toward newer equipment is evident compared to the agricultural equipment presented in Table 53.
Table 54. Model Year Distribution for Selected Equ ipment – Construction and Mining Sector
Equipment Type Fuel Type
Weighted Count*
Missing Obs.
(Weighted) Pre-97
97 - 98
99 - 00
01 - 02
03 - 04
05 - 06
Air Compressors Diesel 17 11 18% 18% 5% 0% 12% 47% Air Compressors Gasoline 31 23 7% 7% 25% 7% 24% 31% Generator Sets Gasoline 57 23 7% 5% 15% 10% 21% 43% Rubber Tired Loaders Diesel 17 0 33% 7% 15% 20% 0% 24% Skid Steer Loaders Diesel 19 10 10% 26% 7% 13% 23% 22% Tractors/Loaders/Backhoes Diesel 47 34 40% 2% 13% 10% 10% 25% * Weighted counts only provided for equipment categories with model year Table 55 presents the model year distribution for the most common equipment/fuel type combinations in the Residential sector. The equipment in this sector is highly weighted toward newer model years, relative to the other sectors, with approximately 50% of units being five years of age or less.
Table 55. Model Year Distribution for Selected Equ ipment – Residential Sector
* Weighted counts only provided for equipment categories with model year Table 56 presents the model year distribution for the most common equipment/fuel type combinations in the Residual sector. Separate model year bins are used for gasoline equipment compared to diesel and compressed gas, to reflect the relatively shorter lifespan of gasoline engines. Overall, similar patterns hold as described above, with smaller gasoline units being newer than larger diesel units. The distribution for compressed gas industrial forklifts is roughly evenly distributed across the different model year bins. Again, the relatively high percentages in the 1999 – 2001 bin for chainsaws and trimmers/edgers/brushcutters is due to single respondents purchasing relatively large numbers of units in a single year (seven chainsaws and 14 trimmers in 2000).
84
Table 56. Model Year Distribution for Selected Equ ipment – Residual Sector
* Weighted counts only provided for equipment categories with model year 3.2 Equipment Instrumentation Results
The engine operation data collected on in-use construction equipment was processed and evaluated to provide basic descriptive statistics regarding engine on time, operation mode (inferred idle vs. load), and exhaust gas temperature distributions for each piece of equipment instrumented in the study, as described below. Although the data collected cover a diverse group of equipment categories and applications, the study did not attempt to provide comprehensive coverage of the significant equipment use patterns in the construction industry. Since the engine selection process itself was not based on a statistically-based sampling plan, the subsequent data analysis does not aggregate the results across equipment categories or application types in order to estimate average hours per day or representative exhaust gas temperature profiles for the construction sector as a whole. Nevertheless, the disaggregated, equipment-specific data presented below provides an informative set of “snap-shots” of some of the more common construction equipment types and applications.
3.2.1 Instrumentation Data Processing
ERG processed engine data downloaded from the Cleaire data loggers to compile and assess activity and exhaust temperature from the equipment described in Table 4 (see Section 2.2.4). To do so, each raw engine file was input into a Statistical Analysis Software (SAS) dataset. The raw data consisted of header information, followed by rows of observations, each containing a date, time, RPM, and temperature (in deg C) for a 2-second interval. Occasionally, a record would contain a flag indicating the engine was starting or ending its recording of information.
The data provided was fairly uniform, although some files used an alternative date format. Using the information provided in Table 4, locations and equipment descriptions were appended to the raw data.
85
Note that a very small fraction of observations, (those with RPM readings < 400) were removed from the data for the analysis assuming actual idle operation does not occur below this level.
3.2.2 Operation Profiles
As each record represents two seconds of operating time, the number of observations for each piece of equipment on a given day can be used to calculate hourly activity. Table 57 presents the daily activity information calculated from the data. (The number of days the engine was actually operated over the seven day instrumentation period ranged from as few as one to as many as seven, as seen in Table 4). Hours per day values varied dramatically, even for the same piece of equipment on different days. Daily engine on time varied from just a few minutes to over 11 hours a day.
Histograms showing exhaust gas temperature distributions (in bins of 50 degrees C) were created for each individual data file, and are presented in Appendix F. These data show a wide variety of operation temperature patterns, with modal temperature bins (i.e., “peaks”) ranging from as low as 100 degrees C to as high as 550 degrees C. Temperature ranges can be narrow, as is the case with several backhoes with min/max ranges less than 200 degrees. Other engines demonstrate a very broad operational range, commonly operating as low as 200 degrees but reaching temperatures above 550 degrees C. The temperature distributions themselves often have a single peak, although a limited number demonstrated bi-modal distributions, indicative of possible “low” and “high” modes of operation.
In order to estimate approximate percentages for engine idle/loaded operation modes, histograms of RPM data were evaluated to determine an approximate baseline idle RPM for each piece of equipment. Scatter plots of RPM versus time clearly showed a lower bound to the operating RPM of each engine, although the specific lower bounds could vary markedly across engines. SAS routines were then used to determine the percentage of observations falling within the designated RPM “band” (assumed to represent idle operation), and the remaining, higher RPM values (assumed to represent loaded operation).14 The calculated fraction of time at load and idle for each file are presented in Table 58. Although substantial variation is evident, most of the equipment instrumented for this study appears to be operating under some sort of load for the majority of their engine-on time.
14 RPM by itself cannot be used to definitely identify engine load. For example, high idle events can occur while engines are not under load. However, direct measurement of engine load was beyond the scope and resources of this effort.
86
Table 57. Instrumented Vehicle Daily Activity Profi les
Equipment ID
Observations (2-second intervals) Hours/day Unit Description
s20070401_1 7,951 4.42 Loader
s20070503_1 400 0.22 Loader
s20070503_1 1,329 0.74 Loader
s20070503_1 820 0.46 Loader
s20070503_1 615 0.34 Loader
s20070508_1 5,148 2.86 Backhoe
s20070508_1 3,437 1.91 Backhoe
s20070508_1 2,625 1.46 Backhoe
s20070508_1 4,076 2.26 Backhoe
s20070515_1 6,690 3.72 Backhoe
s20070515_1 2,378 1.32 Backhoe
s20070515_1 1,803 1 Backhoe
s20070515_1 517 0.29 Backhoe
s20070515_2 10,615 5.9 Grinder
s20070515_2 10,844 6.02 Grinder
s20070515_2 7,701 4.28 Grinder
s20070515_2 6,288 3.49 Grinder
s20070515_2 11,793 6.55 Grinder
s20070515_3 1,351 0.75 Loader
s20070515_3 610 0.34 Loader
s20070515_3 3,562 1.98 Loader
s20070516_1 316 0.18 Loader
s20070516_1 1,341 0.75 Loader
s20070516_1 909 0.51 Loader
s20070517_1 111 0.06 Backhoe
s20070517_1 242 0.13 Backhoe
s20070517_1 2,035 1.13 Backhoe
Equipment ID
Observations (2-second intervals) Hours/day Unit Description
s20070521_1 10,339 5.74 Compactor
s20070521_1 17,994 10 Compactor
s20070521_1 13,870 7.71 Compactor
s20070522_1 7,646 4.25 Screener
s20070522_1 4,984 2.77 Screener
s20070522_1 11,865 6.59 Screener
s20070522_1 6,134 3.41 Screener
s20070522_1 5,066 2.81 Screener
s20070522_2 1,004 0.56 Backhoe
s20070522_2 8,405 4.67 Backhoe
s20070522_2 8,812 4.9 Backhoe
s20070522_2 5,310 2.95 Backhoe
s20070523_1 271 0.15 Loader
s20070524_1 2,129 1.18 Backhoe
s20070524_1 4,496 2.5 Backhoe
s20070524_1 2,299 1.28 Backhoe
s20070526_1 166 0.09 Loader
s20070526_1 1,592 0.88 Loader
s20070529_1 6,231 3.46 Grinder
s20070529_1 11,498 6.39 Grinder
s20070529_1 8,009 4.45 Grinder
s20070529_1 6,596 3.66 Grinder
s20070529_1 5,263 2.92 Grinder
s20070529_2 17,065 9.48 Compactor
s20070529_2 18,245 10.14 Compactor
s20070529_2 20,290 11.27 Compactor
s20070529_2 18,161 10.09 Compactor
87
Equipment ID
Observations (2-second intervals) Hours/day Unit Description
s20070529_2 5,547 3.08 Compactor
s20070530_1 9,602 5.33 Grader
s20070530_1 9,385 5.21 Grader
s20070530_1 13,095 7.28 Grader
s20070530_1 5,273 2.93 Grader
s20070530_1 10,864 6.04 Grader
s20070530_1 11,650 6.47 Grader
s20070530_1 8,977 4.99 Grader
s20070530_2 6,337 3.52 Loader
s20070530_2 10,818 6.01 Loader
s20070530_2 10,668 5.93 Loader
s20070530_2 5,409 3.01 Loader
s20070530_2 7,145 3.97 Loader
s20070530_2 19 0.01 Loader
s20070531_1 4,623 2.57 Backhoe
s20070531_1 3,520 1.96 Backhoe
s20070531_1 5,649 3.14 Backhoe
s20070531_1 2,958 1.64 Backhoe
s20070601_1 537 0.3 Backhoe
s20070602_1 830 0.46 Backhoe
s20070602_1 10,590 5.88 Backhoe
s20070602_1 1,562 0.87 Backhoe
s20070602_2 3,522 1.96 Loader
s20070602_2 10,840 6.02 Loader
s20070602_2 14,116 7.84 Loader
s20070602_2 13,346 7.41 Loader
s20070602_2 10,659 5.92 Loader
s20070602_2 15,559 8.64 Loader
s20070604_1 18,458 10.25 Dozer
Equipment ID
Observations (2-second intervals) Hours/day Unit Description
s20070604_1 18,413 10.23 Dozer
s20070604_1 14,262 7.92 Dozer
s20070604_1 9,705 5.39 Dozer
s20070604_1 5,980 3.32 Dozer
s20070605_1 10,590 5.88 Screener
s20070605_1 1,562 0.87 Screener
s20070605_2 10,100 5.61 Compactor
s20070605_2 12,791 7.11 Compactor
s20070605_2 5,273 5.96 Compactor
s20070605_2 12,655 7.03 Compactor
s20070605_2 13,183 7.32 Compactor
s20070605_2 7,441 4.13 Compactor
s20070605_3 1,133 0.63 Backhoe
s20070605_3 1,136 0.63 Backhoe
s20070605_3 4,993 2.77 Backhoe
s20070605_3 3,785 2.1 Backhoe
s20070606_1 6,776 3.76 Loader
s20070606_1 12,901 7.17 Loader
s20070606_1 2,423 1.35 Loader
s20070606_1 7,111 3.95 Loader
s20070606_2 5,077 2.82 Rubber Wheel Loader
s20070606_2 10,659 5.92 Rubber Wheel Loader
s20070606_2 15,559 8.64 Rubber Wheel Loader
s20070606_2 12,001 6.67 Rubber Wheel Loader
s20070606_2 12,430 6.91 Rubber Wheel Loader
s20070607_1 3,037 1.69 Backhoe
s20070609_1 12,001 6.67 Loader
s20070609_1 12,430 6.91 Loader
s20070609_1 10,719 5.96 Loader
88
Equipment ID
Observations (2-second intervals) Hours/day Unit Description
s20070609_1 16,310 9.06 Loader
s20070609_1 14,004 7.78 Loader
s20070609_1 11,377 6.32 Loader
s20070609_1 13,622 7.57 Loader
s20070612_1 3,278 1.82 Backhoe
s20070614_1 11,377 6.32 Dozer
s20070614_1 13,622 7.57 Dozer
s20070614_1 10,433 5.8 Dozer
s20070614_1 10,015 5.56 Dozer
s20070614_1 7,779 4.32 Dozer
s20070614_1 739 0.41 Dozer
s20070614_1 6,754 3.75 Dozer
s20070615_1 10,983 6.1 Loader
s20070615_1 154 0.09 Loader
s20070615_1 1,150 0.64 Loader
s20070615_1 7,742 4.3 Loader
s20070615_1 10,701 5.95 Loader
s20070615_1 5,947 3.3 Loader
s20070615_1 6,770 3.76 Loader
s20070616_1 10,433 5.8 Loader
s20070616_1 10,015 5.56 Loader
s20070616_1 7,779 4.32 Loader
s20070616_1 739 0.41 Loader
s20070616_1 6,593 3.66 Loader
s20070622_1 9,697 5.39 Loader
s20070622_1 10,366 5.76 Loader
s20070622_1 7,214 4.01 Loader
s20070622_1 14,236 7.91 Loader
s20070622_1 2,447 1.36 Loader
Equipment ID
Observations (2-second intervals) Hours/day Unit Description
s20070624_1 12,312 6.84 Loader
s20070624_1 11,808 6.56 Loader
s20070628_1 139 0.08 Backhoe
s20070628_1 8,349 4.64 Backhoe
s20070628_1 6,969 3.87 Backhoe
s20070628_1 8,162 4.53 Backhoe
s20070705_1 5,608 3.12 Backhoe
s20070705_1 2,648 1.47 Backhoe
s20070705_1 776 0.43 Backhoe
s20070705_1 7,818 4.34 Backhoe
s20070705_1 10,182 5.66 Backhoe
s20070705_1 5,715 3.18 Backhoe
s20070705_1 5,413 3.01 Backhoe
s20070709_1 10,719 5.96 Rubber Wheel Loader
s20070709_1 16,310 9.06 Rubber Wheel Loader
s20070709_1 14,004 7.78 Rubber Wheel Loader
s20070716_1 1,150 0.64 Loader
s20070716_1 10,701 5.95 Loader
s20070716_1 5,947 3.3 Loader
s20070718_1 682 0.38 Loader
s20070718_1 14,153 7.86 Loader
s20070718_1 14,674 8.15 Loader
s20070718_1 13,031 7.24 Loader
s20070718_1 15,584 8.66 Loader
s20070718_1 7,189 3.99 Loader
s20070718_1 12,147 6.75 Loader
s20070729_1 5,909 3.28 Backhoe
s20070729_1 8,850 4.92 Backhoe
s20070729_1 2,440 1.36 Backhoe
89
Equipment ID
Observations (2-second intervals) Hours/day Unit Description
s20070729_1 1,464 0.81 Backhoe
s20070729_1 246 0.14 Backhoe
s20070803_1 6,900 3.83 Wheel Loader
s20070803_1 13,254 7.36 Wheel Loader
s20070803_1 5,750 3.19 Wheel Loader
s20070803_1 9,270 5.15 Wheel Loader
s20070803_1 82 0.05 Wheel Loader
s20070823_1 153 0.09 Backhoe
s20070823_1 1,217 0.68 Backhoe
s20070823_1 1,636 0.91 Backhoe
s20070823_1 3,635 2.02 Backhoe
s20070824_1 642 0.36 Wheel Loader
s20070824_1 5,386 2.99 Wheel Loader
s20070824_1 2,637 1.47 Wheel Loader
s20070824_2 1,495 0.83 Scraper
s20070824_2 3,465 1.93 Scraper
s20070824_2 5,867 3.26 Scraper
s20070824_2 5,140 2.86 Scraper
s20070824_2 4,814 2.67 Scraper
s20070824_2 6,865 3.81 Scraper
s20070824_3 1,772 0.98 Dozer
s20070824_3 7,927 4.4 Dozer
s20070824_3 400 0.22 Dozer
s20070824_3 4,964 2.76 Dozer
s20070826_1 12,677 7.04 Compactor
s20070826_1 5,212 2.9 Compactor
s20070830_1 266 0.15 Backhoe
s20070830_1 669 0.37 Backhoe
s20070830_1 4,147 2.3 Backhoe
Equipment ID
Observations (2-second intervals) Hours/day Unit Description
s20070831_1 8,183 4.55 4WD Tractor Root Plow
s20070831_1 6,622 3.68 4WD Tractor Root Plow
s20070831_1 8,210 4.56 4WD Tractor Root Plow
s20070831_1 8,207 4.56 4WD Tractor Root Plow
s20070831_1 4,441 2.47 4WD Tractor Root Plow
s20070831_2 1,457 0.81 Wheel Loader
s20070831_2 5,256 2.92 Wheel Loader
s20070831_3 5,229 2.91 Scraper
s20070831_3 4,762 2.65 Scraper
s20070831_3 8,390 4.66 Scraper
s20070831_3 6,739 3.74 Scraper
s20070831_3 5,815 3.23 Scraper
s20070831_4 6,958 3.87 Dozer
s20070831_4 99 0.06 Dozer
s20070831_4 4,304 2.39 Dozer
s20070831_4 4,784 2.66 Dozer
s20070906_1 5,544 3.08 Excavator
s20070906_1 15,464 8.59 Excavator
s20070906_1 14,333 7.96 Excavator
s20070906_1 13,926 7.74 Excavator
s20070906_1 14,269 7.93 Excavator
s20070906_1 14,173 7.87 Excavator
s20070906_1 14,474 8.04 Excavator
s20070907_1 7,285 4.05 Claw Tractor/Loader
s20070907_1 11,117 6.18 Claw Tractor/Loader
s20070907_1 8,343 4.64 Claw Tractor/Loader
s20070907_1 9,949 5.53 Claw Tractor/Loader
s20070907_1 9,442 5.25 Claw Tractor/Loader
s20070913_1 13,857 7.7 Excavator
90
Equipment ID
Observations (2-second intervals) Hours/day Unit Description
s20070913_1 14,262 7.92 Excavator
s20070913_1 14,202 7.89 Excavator
s20070917_1 11,091 6.16 Claw Tractor/Loader
s20070917_1 742 0.41 Claw Tractor/Loader
s20070917_1 75 0.04 Claw Tractor/Loader
s20070917_1 163 0.09 Claw Tractor/Loader
s20070919_1 14,225 7.9 Excavator
s20070919_1 12,922 7.18 Excavator
s20070919_1 14,441 8.02 Excavator
s20070919_1 11,799 6.56 Excavator
s20070923_1 12,196 6.78 Compactor
s20070923_1 9,665 5.37 Compactor
s20070926_1 182 0.1 Claw Tractor/Loader
s20070926_1 102 0.06 Claw Tractor/Loader
s20070926_1 35 0.02 Claw Tractor/Loader
s20070930_1 6,786 3.77 Wheel Loader
s20070930_1 8,724 4.85 Wheel Loader
s20070930_1 4,638 2.58 Wheel Loader
s20071004_1 12,036 6.69 Claw Tractor/Loader
s20071004_1 11,523 6.4 Claw Tractor/Loader
s20071004_1 11,631 6.46 Claw Tractor/Loader
s20071004_1 12,008 6.67 Claw Tractor/Loader
s20071004_1 5,681 3.16 Claw Tractor/Loader
s20071010_1 8,173 4.54 Rubber Wheel Loader
s20071010_1 10,237 5.69 Rubber Wheel Loader
s20071010_1 12,039 6.69 Rubber Wheel Loader
s20071018_1 12,663 7.04 Rubber Wheel Loader
Equipment ID
Observations (2-second intervals) Hours/day Unit Description
s20071018_1 9,469 5.26 Rubber Wheel Loader
s20071018_1 7,713 4.29 Rubber Wheel Loader
s20071018_1 1,544 0.86 Rubber Wheel Loader
s20071018_1 16,026 8.9 Rubber Wheel Loader
s20071018_1 12,362 6.87 Rubber Wheel Loader
s20071025_1 441 0.25 Compactor
s20071025_1 12,525 6.96 Compactor
s20071101_1 468 0.26 Compactor
s20071101_1 1,972 1.1 Compactor
s20071101_1 8,724 4.85 Compactor
s20071108_1 711 0.4 Compactor
s20071108_1 2,226 1.24 Compactor
s20071108_1 3,513 1.95 Compactor
s20071112_1 9,529 5.29 Rubber Wheel Loader
s20071112_1 75 0.04 Rubber Wheel Loader
s20071112_1 17,156 9.53 Rubber Wheel Loader
s20071112_1 14,616 8.12 Rubber Wheel Loader
s20071115_1 3,403 1.89 Compactor
s20071115_1 9,817 5.45 Compactor
s20071115_1 945 0.53 Compactor
s20071115_1 2,742 1.52 Compactor
s20071115_1 10,696 5.94 Compactor
s20071124_1 562 0.31 Compactor
s20071124_1 446 0.25 Compactor
91
Table 58. Fraction of Time at Load and Idle based o n RPM
The equipment characterization survey results and instrumentation findings were analyzed to determine equipment population and operation characteristics. Survey data were first extrapolated to generate state level equipment population estimates and operation profiles using appropriate surrogates. Statistical and quality assurance analyses were then performed to assess the overall representativeness and uncertainty associated with the state level projections. In addition, a detailed analysis was performed on the projected state level profiles to assess equipment preemption status with respect to federal requirements for construction and agricultural equipment less than 175 hp. Finally, a more qualitative analysis was conducted using the equipment instrumentation data to broadly characterize engine operating times and exhaust gas temperature distributions.
4.1 Statewide Equipment Profile Development
The survey data provided the basis for estimating statewide equipment populations, average hours of activity, and hp distributions for targeted off-road equipment/fuel type combinations less than 175 hp. Expansion of the survey data involved several steps, as described below.
4.1.1 Identification and Selection of Surrogates
In order to make inferences regarding the off-road equipment population as a whole in California based on sample data taken from that population, the sample results must be expanded upward using a reliable surrogate. Surrogates may then be used to allocate the statewide totals down to smaller geographic regions such as counties. The surrogates selected must be readily tied to the available survey data fields. For example, based on the survey results we know the percentage of occupied households that reported owning a lawn mower. Therefore the total number of residential lawn mowers in the state could be estimated by multiplying the ownership percentage derived from the survey data by the total number of occupied households in California. In this case the chosen surrogate is the number of occupied households in California. While personal income might prove to be more closely correlated with lawn mower ownership and hence a better expansion surrogate, it could not be applied to the data since the personal income of individual survey respondents was not available from the survey data.
The potential surrogates for this study varied across the different sectors. Possible surrogates for the Agricultural sector included the number of farms, total acreage, and total head of cattle (for the CAFO/diary strata). Potential surrogates for the Construction and Mining, and Residual sectors included number of employees and the number of establishments. The preferred surrogate for the Residential sector was the number of occupied households, since other demographic data was not available for the respondents.
Agricultural Sector Surrogates
Survey data from within the Agricultural sector were investigated to determine if a positive relationship existed between non-electric equipment counts and acreage among respondents. To the extent that larger establishments tend to have more equipment, acreage will be preferred as a surrogate over the total number of establishments. Figure 13 shows the relationship between
94
reported acreage and total pieces of equipment within the sector for non-CAFO/Dairy respondents. Although the relationship between the two parameters is not strong (with an r-square value of 0.31, it demonstrates a positive correlation. For this reason reported acreage was selected as the preferred surrogate for this sector.
Figure 13. Number of Equipment Pieces vs. Reported Acreage, Non-CAFO/Dairy Agricultural Sector Respondents
y = 0.0051x + 3.0983
R2 = 0.3125
0
10
20
30
40
50
60
70
0 1000 2000 3000 4000 5000 6000
# Acres
# P
cs
Harvested acreage was compiled for each survey strata in the Agricultural sector from the 2002 California Agricultural Census.(8) Table 59 presents the acreage totals for the surveyed respondents as well as state totals. Survey totals include both eligible and ineligible respondents.15 Note that number of head are provided as the surrogate for the CAFO/Dairy strata, also obtained from the 2002 Census.16 The table also indicates survey coverage for each stratum as a percent of the total state.
Table 59. Surrogate Totals – Survey and Statewide Values for Agricultural Sector
15 Ineligible respondents consisted of establishments that were within the Agricultural sample frame but did not operate any targeted off-road equipment. 16 Number of head of cattle did not show any clear relationship to the reported number of equipment pieces within the CAFO/Dairy stratum. Although this surrogate may not provide any improvement over the simple number of CAFO/Dairy establishments, number of head (as determined from the 2002 Agricultural Census) was selected as the surrogate to be consistent with the approach adopted for the remainder of the Agricultural sector.
95
Note that no data were available regarding total acres harvested during 2007 as of this writing, so adjustments could not be made to the surrogates for the base inventory year for this sector.
Construction/Mining and Residual Surrogates
SSI provided an estimate of the number of people employed by each of the respondents in the Construction and Mining, and Residual sectors. The SSI sample records provided employee bin sizes rather than point estimates. ERG assumed midpoint values for each SSI employee size bin, as shown in Table 60. For this analysis a point value of 1,500 employees was assumed for the largest SSI size bin.
Table 60. SSI Employee Size Bins and Assumed Point Estimates – Construction/Mining and Residual Sectors
The relationship between the estimated number of employees and the number of pieces of equipment owned/operated by each respondent was evaluated, as shown in Figures 14 and 15 for the Construction/Mining and Residual sectors, respectively. In both cases the relationship between number of employees and equipment totals is very weak. For this reason the simple number of establishments was selected as the surrogate for these sectors. However, employee count data from the California Regional Economies Employment (CREE) series was ultimately used to allocate state equipment populations to the county level, however, as described below.(9)
96
Figure 14. Number of Equipment Pieces vs. Reported Acreage, Construction/Mining Sector Respondents
y = 0.077x + 2.3055
R2 = 0.1244
0
5
10
15
20
25
30
35
0 50 100 150 200
# employees
# pc
s
Figure 15. Number of Equipment Pieces vs. Reported Acreage, Residual Sector Respondents
y = 0.0357x + 2.2496
R2 = 0.0852
0
5
10
15
20
25
30
35
40
0 50 100 150 200
# Employees
# P
cs
USA Data maintains a comprehensive listing of business establishments operating across the country for survey sampling purposes.(10) The USA Data database was queried to obtain the number of establishments at the state level in different SIC groups corresponding to the Construction and Mining, and Residual sectors. Table 61 provides the query results, along with the total number of survey respondents, for the Construction and Mining sector. Again, respondent totals include both eligible and ineligible establishments.
97
Table 61. Surrogate Totals – Survey and Statewide Values for Construction/Mining Sector
# Establishments Construction-a Construction-b Construction-c Mining SIC Range 1500s 1600s 1700s 1000s - 1400s Survey 311 46 684 61 State 39,777 4,920 69,752 487 Percent Coverage 0.8% 0.9% 1.0% 12.5%
Table 62 provides the SICs included in the query for the Residual sector, and Table 63 provides the corresponding query results and respondent totals.
Table 62. Residual Sector SIC Groupings by Survey S trata
US Census data on households were obtained at the state and county level for 2006, the most recent year available.(11) Household counts were adjusted downward by 7.8% to adjust for unoccupied households.(12) Occupied household totals were then increased by 0.26%, the estimated statewide population increase from 2006 to 2007, to obtain a final estimate of occupied households in the 2007 survey year.(13) Occupied household totals for the survey and state are provided in Table 64 for the target and other area strata for the Residential sector.
Table 64. Surrogate Totals – Survey and Statewide V alues for Residential Sector
# Occupied Households Target Other Areas Survey 265 1,302 State 378,301 10,850,415 Percent Coverage 0.070% 0.012%
98
4.1.2 Statewide Equipment Population Estimates
Once surrogates were identified and obtained for each survey stratum and sector, they were applied to the weighted survey equipment counts to estimate statewide population totals. The following steps were executed in this process:
1. For each sector and stratum, the total number of equipment pieces were summed for each equipment/fuel type combination;
2. Equipment/fuel type totals were then divided by the appropriate survey surrogate totals to obtain a frequency measure. For example, there was an average of 4.0 diesel agricultural tractors reported per 1,000 acres within the row crop stratum;
3. The resulting frequency proportions were multiplied by the corresponding statewide surrogate value to estimate state level equipment population totals.
Equipment Incidence Rates
Tables 65 through 68 present the equipment frequency proportions by survey strata for each sector.
Table 65. Equipment Type Incidence per 1,000 Acres – Agricultural Sector
Equipment Type Fuel Type Citrus CAFO/ Dairy* Nut Row
Application of Population Surrogates – Sector Level Equipment Totals
Tables 69 through 72 present the corresponding estimated statewide equipment totals by sector. Discussion of the reasonableness of these estimates is provided in “Statewide Equipment Population Estimates and Quality Assurance” below.
Once statewide populations were developed for each sector, selected surrogates were applied to allocate populations to the county level. County-level acreage and head counts compiled from the 2002 Agricultural Census are shown in Table 73, along with the corresponding allocation fractions. These fractions can be applied directly to the statewide equipment totals in Table 69 to obtain county-level population estimates for the Agricultural sector. Note that these surrogate data are for 2002 production, and may need to be updated once 2007 production data becomes available.
County-level establishment counts were not readily available for the Construction and Mining or Residual sectors. Therefore county-level employment data obtained from the CREE data set for 2005 were used to geographically allocate statewide equipment population totals for these sectors. County-level employment surrogates and corresponding allocation factors are provided for the Construction and Mining sector in Table 74, and for the Residual sector in Table 75. If substantial employment shifts have occurred between 2005 and 2007, these factors may merit adjustment.
Table 76 presents county-level household counts, the surrogate for the Residential sector. Note that counties located in the “target” stratum are listed in bold. As noted above, these data are for 2006 and would need to be adjusted if significant population shifts took place in 2007.
110 Table 73. County Level Equipment Population Surroga tes and Allocation Factors - Agricultural Sector
Total 2,540 20,485 2,044,925 680,528 1,189,456 954,730 2,451,421
116
Table 76. County Level Equipment Population Surroga tes (# Households) and Allocation Factors – Residential Sector
County # Households Fraction County # Households Fraction Alameda 516,035 0.0425 Placer 131,068 0.0108 Alpine 1,575 0.0001 Plumas 13,595 0.0011 Amador 15,781 0.0013 Riverside 675,317 0.0556 Butte 86,436 0.0071 Sacramento 500,184 0.0412 Calaveras 24,603 0.0020 San Benito 16,434 0.0014 Colusa 6,792 0.0006 San Bernardino 616,244 0.0507 Contra Costa 358,750 0.0295 San Diego 1,038,012 0.0855 Del Norte 10,110 0.0008 San Francisco 328,665 0.0271 El Dorado 75,390 0.0062 San Joaquin 206,013 0.0170 Fresno 276,233 0.0227 San Luis Obispo 105,338 0.0087 Glenn 9,742 0.0008 San Mateo 245,577 0.0202 Humboldt 53,989 0.0044 Santa Barbara 139,101 0.0115 Imperial 47,565 0.0039 Santa Clara 562,189 0.0463 Inyo 8,369 0.0007 Santa Cruz 94,393 0.0078 Kern 242,127 0.0199 Shasta 69,783 0.0057 Kings 37,850 0.0031 Sierra 2,093 0.0002 Lake 31,824 0.0026 Siskiyou 21,571 0.0018 Lassen 11,723 0.0010 Solano 137,241 0.0113 Los Angeles 3,094,557 0.2548 Sonoma 180,592 0.0149 Madera 43,954 0.0036 Stanislaus 157,919 0.0130 Marin 99,563 0.0082 Sutter 30,385 0.0025 Mariposa 8,929 0.0007 Tehama 23,847 0.0020 Mendocino 35,649 0.0029 Trinity 7,607 0.0006 Merced 74,739 0.0062 Tulare 121,910 0.0100 Modoc 4,451 0.0004 Tuolumne 27,842 0.0023 Mono 12,334 0.0010 Ventura 249,543 0.0205 Monterey 127,911 0.0105 Yolo 65,166 0.0054 Napa 48,645 0.0040 Yuba 24,960 0.0021 Nevada 45,415 0.0037 Total 12,146,777 Orange 943,148 0.0776
Statewide Equipment Population Estimates and Qualit y Assurance
Equipment/fuel type combinations were aggregated across sectors for a final statewide population total, as shown in Table 77. Some minor adjustments were made to the sector level totals presented in Tables 69 thru 72, aggregating certain specialty equipment into “Other” categories, and allocating a small number of equipment categories without a reported fuel type to specific fuel categories, as discussed in Section 3.1.4. Population totals are also provided from the current OFFROAD and NONROAD models for comparison as well. Many of the model values were developed using top-down estimation methods, for example allocating national totals obtained from surveys to the state level. In fact, the lack of bottom-up survey data was a main impetus for this study, and the substantial differences between the study estimates and model values reflect the differences in the methodologies used to obtain them.
117
Table 77. Estimated Statewide Off-road Equipment Po pulation – All Sectors
Equipment Type Fuel Type Study Estimate NONROAD OFFROAD Welders Comp. Gas 214 1,159 - Welders Diesel 110 24,842 11,576 Welders Gasoline 1,060 23,386 36,064 Wood Splitters Gasoline 364 - 206,535 Table 78 lists the equipment types assigned to the various “Other” categories indicated above. None of these equipment types were explicitly included in the standard OFFROAD model equipment list. Assignments to Agricultural, Construction, General Industrial, and Lawn and Garden categories were based on expert judgment, utilizing make and model information (where available) and application type descriptions. The Agricultural sector had by far the greatest number of specialty equipment assigned in this manner, as shown below.
Other Construction Equipment “Champ”, Pipe Threader, Unspecified “Off-road truck”, Unspecified “Vacuum”
Other General Industrial Equipment Car Lift, Alignment Rack, Vacuum Pot Holer Other Lawn and Garden Equipment “Dirt Remover”, Thatcher, “Yard Burn”
A limited number of equipment/fuel type combinations could not be matched to existing OFFROAD categories, but were deemed inappropriate for assignment to the “other” categories. Several cases involved existing equipment categories without a corresponding fuel type. Specifically, the following equipment/fuel type combinations were reported and confirmed by survey respondents, although they are not currently included in the OFFROAD model population listing. With the exception of diesel powered ATVs, each of these combinations were reported by no more than two respondents. Accordingly, statewide populations of these equipment types are expected to be very low. (A detailed statistical analysis describing the relationship between survey response rates and resulting population uncertainty is provided in Section 4.2).
17 Attempts were made to obtain clarification on “unspecified” equipment descriptions without success.
120
• Compressed gas tractor/loader/backhoes; and, • Compressed gas welders
In addition, certain specialty equipment categories found in the OFFROAD model were not reported by survey respondents. Of those OFFROAD equipment categories with more than 1,000 units estimated at the state level, the following were not identified during the survey (with OFFROAD population estimates for all fuel types provided in parentheses):
GSE and commercial turf equipment are likely absent from the survey data set since airports and commercial lawn and garden companies were not explicitly targeted for survey. In addition, the relative scarcity of dumpers/tenders and off-highway tractors may explain their absence from the final survey findings as well. Also, it is quite possible that some fraction of residential lawn and garden tractors were misclassified by respondents and included under the Front/Riding mower category. However, specific survey strata were designed to capture logging, construction, and recreational equipment, and the reason for the absence of the remaining categories (fellers/bunchers, lawn tractors, rough terrain forklifts, sailboat auxiliary engines, and surfacing equipment) is unknown.
As shown in Table 77, statewide population estimates are provided for equipment less than 175 hp, from both the OFFROAD model and EPA’s NONROAD model. While not definitive, since neither data source has been independently validated, these alternative data sources provide an independent point of reference for assessing the validity of the study’s population estimates. A qualitative comparison among the three sets of numbers yields the following observations. (A quantitative uncertainty assessment follows in Section 4.2).
1. Most agricultural equipment estimates are roughly consistent with, or somewhat higher than, OFFROAD and NONROAD estimates. This holds true for all but the gasoline agricultural mower category, which is substantially higher than the OFFROAD value (5,663 compared to 1,996), and the diesel swather category, which at 1,122 is substantially lower than the OFFROAD estimate of 7,681 (but closer to the NONROAD estimate of 1,673).
As an additional check, selected agricultural equipment types were compared with population estimates obtained from the 2002 Agricultural Census, as shown in Table 79. The projections for agricultural tractors and combines are quite similar for both sources, although baler totals for this study are substantially lower than those from the Agricultural Census. (Note that Agricultural Census equipment
121
data is not broken out by fuel type, so estimates have been aggregated accordingly.)
Table 79. Comparison of Selected Agricultural Equip ment Estimates with Agricultural Census Values
Equipment Category Population Estimate Ag Census Estimate Agricultural Tractors 200,081 184,981 Balers 2,275 4,836 Combines 2,097 2,540
However, while total agricultural tractor estimates from the study are comparable to Agricultural Census Estimates, and slightly higher than the OFFROAD estimates (~200,000 vs. 155,000), the tractor fuel type distribution is significantly different than expected, with a much larger fraction of tractors being powered by gasoline than is assumed in the OFFROAD model. As seen in Table 71, the vast majority of gasoline agricultural tractors were actually attributable to the Residential rather than the Agricultural sector. While there were only 13 (unweighted) gasoline agricultural tractors reported in the Residential sector survey, the very large surrogate multipliers associated with this sector result in correspondingly large statewide population estimates.
Further investigation using web searches definitively confirmed a gasoline engine type and the agricultural tractor category for nine of the 13 units reported for this sector.18 In addition, none of the units were reported to be newer than the 1961 model year. Also, 10 of the 13 units were reported to be used primarily for “Personal or Residential” or “Recreational” purposes, with an unweighted average utilization of 39 hours per year. From this limited data set it appears these units may be considered “antique” and/or “novelty” equipment with very low activity levels.
Finally, eight of the 13 units reported in this sector were owned by a single respondent. While extensive efforts were made to obtain a representative survey sample in all sectors, this particular respondent may be considered an “outlier,” which if true would substantially overestimate the resulting statewide equipment population estimates. (For example, assuming that all Residential sector operators of gasoline agricultural tractors own just a single unit reduces population estimates by over 60%). However, given the stratified random sampling methodology adopted for the survey, such a bias cannot be determined definitively.
2. The majority of construction equipment category totals are consistently lower than OFFROAD and NONROAD. This observation holds for both small construction equipment such as concrete saws and tampers/rammers, as well as larger categories such as crawler tractors and excavators. Construction equipment
18 Data for make and model year were missing for the remaining four units, making independent confirmation of equipment and fuel type not possible.
122
categories with estimates roughly similar to those in OFFROAD include bore/drill rigs, cranes, graders, plate compactors, loaders, scrapers and tractors/loaders/backhoes.
3. Industrial forklift population estimates are substantially higher than estimated by OFFROAD. Aside from generator sets, industrial forklifts are estimated to be the most common type of industrial off-road equipment in use (as per OFFROAD, NONROAD, and the study projections themselves). While population estimates for gasoline powered industrial forklifts were similar between the study values and OFFROAD, the study estimates for diesel and LPG powered units were two to three times the corresponding OFFROAD values. NONROAD estimates for LPG industrial forklifts were substantially closer to the study values, however.
4. Estimates for many other common industrial and recreational equipment categories were consistently lower than model values. Study estimates for air compressors were substantially lower than OFFROAD as well as NONROAD estimates, while projections for generator sets, pumps, and welders were dramatically lower – close to an order of magnitude for diesel units and even more for gasoline pumps. Pressure washer estimates were quite similar however. While ATV, golf cart, off-road motorcycle, and minibike estimates were somewhat lower than OFFROAD values (but reasonably close to NONROAD estimates), other recreational equipment estimates appear to be far lower than corresponding model values – approximately an order of magnitude for outboard engines and personal watercraft. This finding may reflect a systematic response bias wherein respondents did not associate watercraft with “off-road” equipment, even though these were explicitly mentioned as example equipment types during Residential sector interviews.
5. Estimates for transportation refrigeration units (TRUs) are most likely skewed very high. One survey respondent in the Residual sector reported having 130 gasoline powered TRUs. No other respondent reported a single TRU throughout the rest of the study. Applying the selected surrogates to this one respondent’s data results in an estimate more than an order of magnitude above the projected OFFROAD value. Accordingly, we recommend dropping this observation from the data set as unrepresentative of the population of TRUs as a whole.
6. Residential lawn and garden equipment estimates fall consistently between the corresponding NONROAD and OFFROAD estimates. In almost all cases, the study population estimates for these equipment types are lower than the corresponding OFFROAD values (typically three to five times lower), and substantially higher than the corresponding NONROAD values (commonly three to five times higher). The largest percentage discrepancy occurs in the wood splitter category, with the study estimates almost two orders of magnitude lower than OFFROAD estimates. The second largest discrepancy with OFFROAD values occurs with the chipper/stump grinder and shredder categories. In this case, however, the study estimate for chippers/grinders is an order of magnitude higher than those for OFFROAD. On the other hand, estimates for shredders are roughly an order of magnitude lower than the corresponding OFFROAD values. Some of
123
this discrepancy may be due to respondents mistakenly assigning shredders to the chipper category.
4.1.3 Statewide Equipment Activity Profiles
Sector level activity totals and equipment populations were combined across all sectors to determine average annual activity for each equipment/fuel type combination at the state level. Table 80 presents the statewide average hours per year for each equipment category, as well as the corresponding estimates from the OFFROAD and NONROAD models. Note that activity values for lawn and garden equipment were based on residential rather than commercial values, since the vast majority of the surveyed equipment originated in the Residential sector.
Table 80. Average Annual Activity – Estimated State wide Equipment Population (Hrs/Yr)
Equipment Type Fuel Type Study Estimate NONROAD OFFROAD Swathers Diesel 133 110 110 Swathers Gasoline 35 95 95 Tampers/Rammers Gasoline 10 160 182 Tillers Gasoline 83 43 18 Tractors/Loaders/Backhoes Diesel 1,085 1,135 942 Tractors/Loaders/Backhoes Gasoline 1,378 870 870 Transport Refrigeration Units Gasoline 2,300 605 750 Trenchers Diesel 250 593 618 Trenchers Gasoline 4 402 402 Trimmers/Edgers/Brush Cutters Gasoline 46 9 22 Vessels w/Outboard Engines Gasoline 22 35 48 Welders Diesel 107 643 643 Welders Gasoline 66 408 208 Wood Splitters Gasoline 8 76 1 ^ 30 hours per year when adjusted for likely outlier (see Section 4.3 for discussion) Unlike the population analysis presented in section 4.1.2, activity values in the OFFROAD and NONROAD models tend to be quite similar. A qualitative comparison across the study, OFFROAD and NONROAD model estimates yields the following observations.
1. No systematic pattern is evident among agricultural equipment, with activity estimates ranging well above and below OFFROAD estimates.
2. In general, construction equipment estimates are systematically lower than corresponding model estimates. Activity estimates for construction equipment clearly follow this pattern, with the following exceptions: tractors/loaders/backhoes have similar activity estimates, as do skid steer loaders to a lesser extent; and cement and mortar mixers, as well as bore/drill rigs have substantially higher activity estimates than OFFROAD.
3. Industrial equipment activity values are similar to, or somewhat lower than, corresponding model estimates. While aerial lifts, air compressors, and welders have distinctly lower activity values than OFFROAD, values for generator sets, pressure washers and pumps are reasonably similar. In addition, activity estimates for industrial forklifts of all fuel types are lower than corresponding OFFROAD values. However, the estimates for LPG industrial forklifts compare quite favorably with an independent estimate of industrial forklift activity in the Dallas/Fort Worth area developed for the Texas Commission on Environmental Quality (TCEQ) - 975 hrs/yr vs. 1,124 hrs/yr for the TCEQ study.(13)
4. Residential lawn and garden activity estimates are systematically higher than OFFROAD model estimates. With the exception of chippers and stump grinders which have lower activity values, these equipment types all have substantially higher activity estimates than the corresponding OFFROAD values.
5. Recreational equipment estimates are systematically lower than corresponding OFFROAD estimates. With the exception of golf carts, which have similar
126
activity values to those in OFFROAD, these equipment types all have substantially lower hour per year estimates than OFFROAD.
4.1.4 Statewide Equipment HP Profiles
Sector level hp values and equipment populations were combined across all sectors to determine average hp for each equipment/fuel type combination at the state level. Table 81 presents the statewide average hp estimates for each equipment category, as well as the associated estimates from the OFFROAD and NONROAD models less than 175 hp. Table 82 presents the corresponding distributions by hp bin for the projected statewide equipment population.
Table 81. Weighted Average HP – Estimated Statewide Equipment Population
Equipment Type Fuel Type 0 - 11 11 - 24 25 - 49 50 - 74 75 - 119 120 - 174 Tampers/Rammers Gasoline 100% 0% 0% 0% 0% 0% Tillers Gasoline 100% 0% 0% 0% 0% 0% Tractors/Loaders/Backhoes Diesel 0% 8% 42% 14% 36% 1% Tractors/Loaders/Backhoes Gasoline 0% 81% 4% 15% 0% 0% Transport Refrigeration Units Gasoline 0% 0% 0% 100% 0% 0% Trenchers Diesel 0% 0% 0% 100% 0% 0% Trenchers Gasoline 62% 38% 0% 0% 0% 0% Trimmers/Edgers/Brush Cutters Comp. Gas 100% 0% 0% 0% 0% 0% Trimmers/Edgers/Brush Cutters Gasoline 93% 7% 0% 0% 0% 0% Vessels w/Outboard Engines Diesel 100% 0% 0% 0% 0% 0% Vessels w/Outboard Engines Gasoline 22% 0% 57% 21% 0% 0% Welders Comp. Gas 0% 100% 0% 0% 0% 0% Welders Diesel 0% 7% 0% 0% 93% 0% Welders Gasoline 41% 49% 10% 0% 1% 0% Wood Splitters Gasoline 100% 0% 0% 0% 0% 0% Several observations can be made based on the Table 81 data. First, in qualitative terms, there is greater consistency between the study average hp values and those in OFFROAD and NONROAD, compared with the population and activity values. Second, there is broad general agreement among several key equipment categories, including diesel powered agricultural tractors, diesel and gasoline generator sets, and compressed gas industrial forklifts. Third, construction equipment hp averages appear to be systematically lower than the corresponding OFFROAD model estimates, with the exception of bore/drill rigs and signal boards, which have substantially higher hp than the model values. Finally, residential lawn and garden equipment and recreational equipment appear to have substantially higher hp averages than OFFROAD, often by 100 percent or more. In absolute terms the differences for lawn and garden equipment are relatively small though, corresponding to a few hp in most cases.
4.2 Uncertainty Analysis and Confidence Intervals
An analysis was conducted to determine the error bounds associated with the population, average hours per year, and average hp estimates developed for the statewide equipment profiles presented in Section 4.1. The error bounds take into account both the number of observations for a particular parameter, as well as the variability of the response itself. For example, an average hp value based on three responses covering a wide range will be much more uncertain than an average based on 50 responses covering a narrow range. The resulting error estimates can be used by ARB to determine which equipment profile parameters are deemed acceptable for inclusion in the OFFROAD model, and which parameters should be based on alternative data sources.
The following analyses assume that the estimates of the mean for a given distribution (e.g., average equipment ownership per respondent, average activity, and average hp) are normally
131
distributed. Accordingly, the confidence interval associated with any particular mean value can be calculated as a function of the sample size and the standard deviation of the distribution, as shown in Equation 1.
Equation 1. CIp = tn-1 * σ / √n
Where: CI = Confidence Interval p = Selected probability level tn-1 = t-value of student’s t-test distribution with n-1 degrees of freedom σ = standard deviation of the distribution n = number of observations in distribution
For this analysis error bounds are reported at the 95% level of confidence (p = 0.05).
4.2.1 Activity Estimates
Confidence intervals were calculated for annual activity estimates for each equipment/fuel type combination, and are presented as a percent of the statewide average in Table 83. Equipment categories for which confidence intervals could not be calculated (having only one observation in the survey data set) are not presented.
* unweighted counts of records with activity data – all survey sectors
133
Several observations can be made based on the above table.
1. Equipment categories with confidence intervals equal to 0% of the mean activity level are not likely representative of the actual fleet. 0% intervals were found for compressed gas combines and gasoline TRUs – in other words all units within these equipment types were reported to have the same annual activity levels. In both cases the units were operated by a single respondent. For this reason extrapolations to the remainder of the fleet are deemed unreliable.
2. 95% confidence intervals are relatively large, even for equipment categories with substantial numbers of observations. In general, activity distributions had large variances resulting in corresponding large confidence intervals. For example, even though activity data were obtained for 72 gasoline agricultural tractors, the resulting uncertainty is still ± 34%.
3. Of the equipment categories with non-zero confidence intervals, 16 had intervals less than or equal to 50% of the mean value. These equipment types tended to be those with the greatest number of observations, such as diesel agricultural tractors, compressed gas industrial forklifts, ATVs, and lawn mowers. Agricultural, lawn and garden, and larger construction equipment were most common in this group.
4. Many equipment categories with a limited number of observations yielded confidence intervals greater than 100% of the mean value. Twenty seven of the 66 categories in the table had intervals above 100%. Of these only two had more than 10 observations in the survey data set (off-road motorcycles and leaf blowers/vacuums). The actual lower bound activity values for these units are unknown, but obviously greater than zero.
4.2.2 Equipment HP Estimates
Confidence intervals were calculated for equipment hp estimates for each equipment/fuel type combination, and are presented as a percent of the statewide averages in Table 84. Equipment categories for which confidence intervals could not be calculated (having only one observation in the survey data set) are not presented.
Table 84. 95% Confidence Intervals - Estimated Sta tewide HP Estimates
Equipment Type Fuel Type # Survey
Observations*
Weighted Average
HP 95% Interval
(% of Average) Aerial Lifts Diesel 2 49 1,099%
Agricultural Mowers Diesel 6 33 63%
Agricultural Mowers Gasoline 17 22 17%
Agricultural Tractors Compressed Gas 4 56 67%
Agricultural Tractors Diesel 845 63 3%
Agricultural Tractors Gasoline 73 35 17%
134
Equipment Type Fuel Type # Survey
Observations*
Weighted Average
HP 95% Interval
(% of Average) Air Compressors Diesel 26 33 30%
Air Compressors Gasoline 69 17 30%
All Terrain Vehicles Diesel 6 19 88%
All Terrain Vehicles Gasoline 71 48 26%
Balers Diesel 15 72 25%
Bore/Drill Rigs Diesel 10 127 15%
Bore/Drill Rigs Gasoline 2 82 1,000%
Cement and Mortar Mixers Gasoline 4 6 50%
Chainsaws Gasoline 88 5 7%
Chippers/Stump Grinders Diesel 2 39 679%
Chippers/Stump Grinders Gasoline 4 8 54%
Combines Diesel 21 125 20%
Concrete/Industrial Saws Gasoline 5 6 119%
Cranes Diesel 3 150 0%
Crawler Tractors Diesel 11 147 12%
Crawler Tractors Gasoline 2 7 994%
Excavators Diesel 21 85 32%
Industrial forklifts Compressed Gas 154 61 10%
Industrial forklifts Diesel 28 70 23%
Industrial forklifts Gasoline 28 74 17%
Front/Riding Mowers Diesel 4 22 43%
Front/Riding Mowers Gasoline 41 15 17%
Generator Sets Compressed Gas 2 6 0%
Generator Sets Diesel 8 46 86%
Generator Sets Gasoline 98 12 24%
Golf Carts Gasoline 2 23 141%
Graders Diesel 12 88 20%
Irrigation Sets Diesel 2 143 245%
Lawn Mowers Gasoline 196 5 4%
Leaf Blowers/Vacuums Gasoline 33 7 29%
Minibikes Gasoline 2 19 930%
Off-Road Motorcycles Gasoline 15 44 40%
Personal Water Craft Gasoline 4 139 20%
Pressure Washers Gasoline 24 7 31%
Pumps Diesel 9 81 44%
Pumps Gasoline 17 8 25%
Rollers Diesel 16 49 40%
Rollers Gasoline 4 5 7%
Rubber Tired Loaders Diesel 47 82 10%
135
Equipment Type Fuel Type # Survey
Observations*
Weighted Average
HP 95% Interval
(% of Average) Rubber Tired Loaders Gasoline 4 24 35%
Scrapers Diesel 3 133 45%
Shredders Gasoline 6 6 58%
Skid Steer Loaders Diesel 28 62 13%
Skidders Diesel 7 147 11%
Snowblowers Gasoline 6 8 31%
Snowmobiles Gasoline 4 40 0%
Specialty Vehicles Carts Gasoline 2 77 1,181%
Sprayers Diesel 19 76 20%
Sprayers Gasoline 33 26 47%
Swathers Diesel 5 112 27%
Tillers Gasoline 18 6 11%
Tractors/Loaders/Backhoes Diesel 117 59 7%
Tractors/Loaders/Backhoes Gasoline 7 19 69%
Transport Refrigeration Units Gasoline 130 50 0%
Trenchers Gasoline 3 9 84%
Trimmers/Edgers/Brush Cutters Gasoline 102 5 15%
Vessels w/Outboard Engines Gasoline 6 36 63%
Welders Diesel 2 94 892%
Welders Gasoline 8 14 93%
Wood Splitters Gasoline 2 9 684% * unweighted counts of records with hp data – all survey sectors
As discussed with the activity data, a few equipment/fuel type combinations had no variation in reported hp values. These included categories with a small number of observations in the survey data: diesel cranes, compressed gas generator sets, and gasoline snowmobiles. The 130 TRUs reported by a single respondent were also identical in hp. Considering these factors confidence intervals cannot be accurately determined for these equipment categories.
The variance in hp values was generally smaller than found for reported activity values. Accordingly, a substantially higher number of equipment categories had 95% confidence intervals less than or equal to 50% of the mean value (41 of 66 categories). Similarly, only 11 categories had confidence intervals greater than 100%, none of which had more than 10 observations in the data set. Again, the actual lower bound hp for these equipment types is unknown.
4.2.3 Equipment Population Estimates
Confidence intervals were calculated for the estimated average number of equipment pieces owned or operated per establishment (or other appropriate surrogate value), for each of the four survey sectors, based on the equipment counts reported by each respondent. Average ownership rates (per thousand units) are provided in Tables 65 – 68, and account for establishments that did
136
not own or operate targeted equipment types as well as those that did. As seen in these tables, the average number of equipment pieces per acre, establishment, or household (depending upon the sector), are quite low, typically a fraction much less than one. In other words, the peak of the equipment count distribution for any particular equipment/fuel type combination was almost always zero, with a sharp drop off for successively higher equipment counts.
Given the highly skewed nature of the equipment count distributions, the above stated assumption regarding normality of the estimated means is uncertain. It is common for distributions involving counts to follow a Poisson distribution.(15) If it were determined that the reported equipment counts followed a Poisson distribution then adjustments could be made to the data to correct for non-normality, allowing us to continue to use Equation 1 in the determination of confidence intervals. Several key equipment types were evaluated to determine if their count distributions could be approximated by a Poisson function (diesel agricultural tractors, LPG industrial forklifts, gasoline generator sets, among others).19 However, tests for these data clearly indicated that they were not approximated by Poisson distributions. No other non-normal distributions were evaluated, and the analysis proceeded under the assumption of normality for the mean equipment count estimates.
Since equipment count frequency varies substantially across survey sectors, 95% confidence intervals were calculated individually for each sector. Confidence intervals could not be calculated for equipment/fuel type combinations with only one observation within a sector, since the degrees of freedom for the t-test value equals zero. Accordingly, these equipment categories were assumed to have de minimus populations within that sector.
Once confidence intervals were calculated, sector-level population estimates from Tables 59, 61, 63 and 64 were applied to establish upper and lower bound population estimates for each sector. Because average population counts were so close to zero for most equipment categories, the calculated confidence interval was often greater than 100% of the mean, resulting in a negative population estimate for the lower bound. In these cases the lower population bound was set to zero for the purposes of statewide aggregation.
The upper and lower bound equipment counts were then summed across sectors in order to provide a final statewide equipment count interval. Upper and lower bounds for the statewide population estimates are provided in Table 85 for those equipment types for which sector-level confidence intervals could be calculated. Aggregated lower bound confidence intervals with zero values are not appropriate and are not reported in the table. Note that the final confidence intervals are not necessarily symmetrical, even for those equipment types with positive lower bound estimates, since lower bounds within certain sectors may have been set to zero.
19 Poisson distributions have the interesting property that the variance is equal to the mean, allowing for relatively straightforward identification of these distributions.
137
Table 85. 95% Confidence Intervals - Estimated Sta tewide Equipment Population
As indicated in the table, only eight equipment/fuel type categories had 95% confidence intervals less than 50%. These included diesel agricultural tractors, chainsaws, compressed gas and gasoline industrial forklifts, gasoline front/riding mowers, lawn mowers, leaf blowers and vacuums, and trimmers/edgers/brushcutters. On the other hand, 30 of the 62 equipment categories with adequate numbers of observations had upper bound confidence intervals greater than 100%.
4.3 Preemption Analysis
The 1990 amendments to the federal Clean Air Act preempt California control of emissions from new farm and construction equipment under 175 horsepower. These equipment types are defined as follows: 1) Construction equipment or vehicle means any internal combustion engine-powered machine primarily used in construction and located on commercial construction sites; 2) Farm equipment or vehicle means any internal combustion engine-powered machine primarily used in the commercial production and/or commercial harvesting of food, fiber, wood, or commercial organic products or for the processing of such products for further use on the farm.
The Air Resources Board has developed a detailed list of off-road equipment types under 175 hp that are considered to be construction or farm equipment.(16) As such, these equipment categories are federally preempted from emission control requirements by the state. Table 86 presents ARB’s current list to determine preempt applications, which has been approved by the U.S. EPA.
Table 86. Current ARB List to Determine Preempt Of f-road Applications
Equipment with Engines < 25 hp, including: Aerial devices: vehicle mounted Asphalt recycler/reclaimer, sealer Augers: earth Back-hoe Backpack Compressors Baler Boring machines: portable line Breakers: pavement and/or rock
139
Equipment with Engines < 25 hp, including: Brush cutters/Clearing saws 40 cc and above (blade capable only) Burners: bituminous equipment Cable layers Chainsaws 45 cc and above Chippers Cleaners: steam, sewer, barn Compactor: roller/plate Compressors Concrete buggy, corer, screed, mixer, finishing equipment Continuous Digger Conveyors: portable Crawler excavators Crushers: stone Cultivators: powered Cutting machine Debarker Detassler Drills Dumper: small on-site Dusters Elevating work platforms Farm loaders: front end Feed conveyors Fertilizer spreader Forage box/Haulage and loading machine Forklifts: diesel and/or rough terrain Harvesters, crop Jackhammer Light towers Mixers: mortar, plaster, grout Mowing equipment: agricultural Mud jack Pavers: asphalt, curb and gutter Pipe layer Plows: vibratory Post hole diggers Power pack: hydraulic Pruner: orchard Pumps 40 cc and above Rollers: trench Sawmill: portable Saws: concrete, masonry, cutoff Screeners Shredder/grinder Signal boards: highway Silo unloaders Skidders Skid-steer loaders Specialized fruit/nut harvester
140
Equipment with Engines < 25 hp, including: Sprayers: bituminous, concrete curing, crop, field Stump cutters, grinders Stumpbeater Surfacing equipment Swathers Tampers and rammers Tractor: compact utility Trenchers Troweling machines: concrete Vibrators: concrete, finisher, roller Welders Well driller: portable Wheel loaders All equipment > = 25 hp, excluding: Aircraft Ground Power Baggage Handling Forklifts that are neither rough terrain nor powered by diesel engines Generator Sets Mining Equipment not otherwise primarily used in the construction industry Off-Highway Recreational Vehicles Other Industrial Equipment Refrigeration Units less than 50 horsepower Scrubbers/Sweepers Tow/Push Turf Care Equipment
The application categories reported by survey respondents (see Tables 35 thru 38) were combined with activity and population projections to estimate the total number of equipment pieces by application type, as well as the total hours per year each equipment category participated in agricultural, construction, and other activities. Consistent with the definition of preempted equipment types, ATVs and off-road motorcycles that were identified as being used for management of agricultural properties were re-assigned to the Other category since management is not a production, harvesting, or processing activity. Similarly, a small number of welders were re-assigned from the Agricultural category to Other, and tampers/rammers were re-assigned to Construction applications, based on ERG’s familiarity with these equipment types.
Statewide equipment counts were first grouped by preemption category, as shown in the “Population Basis” columns of Table 87. These columns indicate the percentage of the statewide equipment population reported to be engaged in agricultural, construction, or other activities, respectively. The “Activity Basis” columns show the results of summing total equipment hours across sectors and fuel types.
The final two columns in Table 87 provide the 95% confidence intervals (upper and lower bounds) for the annual activity estimates. Confidence intervals were calculated at the equipment type level by aggregating upper and lower bound ranges across the different fuel categories shown in Table 83. (As discussed above, confidence intervals are not necessarily symmetric
141
about the mean.) These estimates are shown to provide an indication of the uncertainty associated with the application distribution percentages shown in the Activity Basis columns.
Evaluating application distributions by population counts as well as by total hours of use allows us to identify those equipment types that may have a “bi-modal” use pattern. For example, from Table 87 it can be seen that the majority of generator sets are used in non-preempted applications (predominantly in the Residential sector). On the other hand, generator sets in the Residential sector are only operated 45 hours per year on average (see Table 45), while generator sets in the Construction sector average 345 hours per year (see Table 47). This disparity in use patterns depending upon the application results in higher total hours of use in the Construction sector, even though equipment counts are substantially higher in the Residential sector. A similar pattern of ownership and use may be found in the pump category, in this case with the majority of the activity occurring in the Agricultural rather than the Construction sector. Thus, by first evaluating preemption status on an equipment count basis we can identify certain equipment categories (such as generator sets) that are predominantly outside the preempted categories, even though determinations based on total hours of use would indicate otherwise.
In the majority of instances the population and activity-based application distributions are consistent with one another, as well as with the existing preemption list. For example, several specialty agricultural and construction equipment categories indicate 100% of their activity occurs in their respective sectors, including balers, combines, irrigation sets and swathers (for agricultural applications); concrete/industrial saws, pavers and paving equipment, rollers, and signal boards (for construction applications). Other currently preempted equipment was found to have very high agricultural or construction application percentages, on both a population and application basis (e.g., excavators at 95%+ construction application). Similarly, currently non-preempted equipment categories frequently had very high percentages in the “Other” category, corresponding to high ownership and/or utilization in non-preempted business or residential applications. These include industrial forklifts, TRUs, and essentially all lawn and garden and recreational equipment categories.20
20 A small number of chainsaws were reported to be used in agricultural applications, which may be used in logging. These units may correspond to the preempted chainsaws greater than 45 cc, as shown in Table 86, although the study survey did not obtain adequate responses regarding engine displacement in order to make this determination.
142 Table 87. Equipment Population and Activity Distri butions by
Application Category for Estimated Statewide Equipm ent Totals
Population Basis Activity Basis Equipment Type Ag. Const. Other Ag. Const. Other
However, in addition to the generator sets discussed above, disparities were found between the population and activity-based application distributions for other equipment categories. Bore/drill rigs, cement and mortar mixers, and scrapers were all estimated to have the majority of their equipment in non-preempted applications, although the vast majority of their hours of use were dedicated to construction activities. (The author of this report has encountered small cement and mortar mixers in the Residential sector, used for home projects such as patio or walkway installation. Though anecdotal, such uses may explain the high population/low utilization pattern for this equipment in the “Other” application category. Similarly, bore/drill units are also commonly used for non-construction activities such as water well drilling, telephone pole installation, mining, and oil and gas exploration support. The author is not aware of possible uses for scrapers outside the construction industry, however.)
Other equipment categories also showed discrepancies between the population and activity-based preemption assessments, leading to unexpected conclusions. For instance, while the tractors/loaders/backhoes category had the majority of its population in preempted categories, the majority of its activity was estimated to occur outside the construction and agricultural sectors. In addition, agricultural mowers, which show only a slight population majority in actual Agricultural applications, conversely show a slight majority in non-preempted applications when assessed on an activity basis. However, in this case the shift is quite small in relative terms, swinging by only three percentage points. Final determinations regarding these and other equipment categories should be made in light of uncertainty analysis results, as discussed below.
While their ultimate preemption status would remain unaffected, a small number of application distributions indicated unexpected or anomalous use patterns. For example, skidders were found to have non-trivial use in non-Agricultural applications (40% on a population basis). Skidders are specialty logging equipment (included under Agricultural production). While this equipment could be used for land clearing purposes, the author is not aware of other uses outside of the logging industry. Other equipment categories with an unexpectedly high Agricultural application contribution included rubber tire loaders (at 86% of total activity), and trenchers (at 100% of activity). Since these equipment categories are commonly used in construction activities, this result is most likely due to the low response rates and correspondingly high uncertainty for these categories. Finally, while skid steer loaders did have the majority of their population and activity in preempted categories, a substantial amount was also estimated for non-preempted applications. This may result for skid steer use in applications such as landscaping and material handling, commonly found by the author in other studies.
Four equipment categories currently on the preemption list were estimated to have the majority of their population and activity in non-preempted applications. These include aerial lifts, chippers/stump grinders, shredders, and welders. While aerial lifts are estimated to have a substantial fraction of their population and activity within the Construction sector (28% and 31%, respectively), the majority of units and hours of use are estimated to occur in non-preempted applications. However, the number of aerial lifts reported in the actual survey was very small (four units, unweighted), and the corresponding activity uncertainty is very large – over 400% for the 95% upper confidence interval. As such, no definitive conclusion can be drawn regarding the actual application distribution for this equipment category.
145
The same situation holds for welders as well, which are estimated to have the majority of their population and hours of use in non-preempted applications. Unlike aerial lifts though, the confidence interval associated with the welders’ average activity estimate is relatively tight (~ 15%). However, very few welders were actually reported by survey respondents, and the corresponding population confidence interval is 100% or more (see Table 85). Accordingly, the actual application distribution for welders is highly uncertain.
The application distributions for chippers/stump grinders and shredders are even more skewed, with 100% of their populations and hours of use estimated to occur in non-preempted categories. Again, both of these categories had very low survey incidence rates, as reflected in the population uncertainty estimates in Table 85, where both equipment types have confidence intervals of approximately 100%. Therefore any inferences regarding the preemption status of these equipment types is also highly uncertain.
Wood splitters were unique, having 100% of their population and activity assigned to agricultural production, even though this equipment category is not on the current preemption list. However, the extremely low number of wood splitters reported in the study survey lead to very high population uncertainty estimates. Activity data for this equipment was so limited that uncertainty could not even be estimated for total hours of use. Therefore the actual exemption status for wood splitters remains unknown.
Upon closer inspection of Table 86, a number of equipment categories had so few survey responses that uncertainty estimates could not even be calculated for hours or use. These include minibikes, pavers, paving equipment, signal boards, specialty vehicles/carts, tampers/rammers, TRUs, and wood splitters. An even larger number had upper bound confidence intervals of over 100%, including aerial lifts, concrete/industrial saws, cranes, crawler tractors, golf carts, graders, irrigation sets, leaf blowers/vacuums, off-road motorcycles, scrapers, shredders, swathers, trenchers, and recreational marine vessels. While many of these equipment types may be safely categorized based on common knowledge, the study results themselves cannot be used to confidently support a preemption determination for them.
Finally, the limitations of the survey data are also apparent in the complete absence of some common construction equipment categories such as rough terrain forklifts and surfacing equipment. A host of low population specialty equipment currently included in the preemption list were not observed either, including mud jacks, dusters, pruners, among dozens of others. Obviously preemption determinations cannot be made regarding these equipment types.
4.4 Instrumentation Data
As discussed in Section 3.2.2, instrumentation data was not collected according to a predetermined statistical sampling plan. As such, a formal statistical analysis of the data was not conducted, and no generalizations can be made regarding exhaust gas temperature distributions or equipment retrofit potentials for the construction fleet as a whole.
The cleaned electronic data from the instrumentation loggers has been provided to ARB for additional review and analysis at their discretion.
146
5.0 Summary and Conclusions
This study surveyed the off-road equipment fleet operating in California, collecting bottom-up information on equipment populations, fuel type, hp and model year distributions, annual hours of operation, seasonal activity distributions, and user applications. It is expected that much of this data, reflecting California-specific fleet and operating conditions, will provide a substantial improvement over the existing equipment and activity data developed using top-down estimation methods. Therefore much of the equipment population and activity profile data collected during the study may be integrated into ARB’s OFFROAD emissions model, replacing the default data and thereby improving the state’s emissions estimates for off-road sources. The equipment application data collected in the survey may also be used to update ARB’s list of preempted off-road equipment types less than 175 hp. Finally, the engine instrumentation data collected during the project may serve as the basis for designing future studies to assess retrofit potentials among construction equipment operating in different applications across the state.
Initial identification of survey targets, as well as design and testing of a pilot survey mechanism were executed in Phase I of this study, with the findings detailed in the Phase I report.
Design and execution of the Phase II equipment survey and analysis of the results presented unique challenges. First, low ownership rates for many off-road equipment types made it difficult to identify large numbers of equipment pieces. (Low numbers of observations in turn increase the uncertainty associated with the equipment type profiles developed from the survey data.) Once eligible participants were identified, great care was taken to describe the survey clearly to respondents in order to encourage high levels of participation, as well as complete reporting of targeted equipment types. In addition, equipment category naming conventions proved difficult to standardize, given the number of different ways an end user may refer to their equipment. Extensive post-processing and QA were conducted, relying on make/model descriptions and expert judgment to assign equipment to appropriate OFFROAD categories, and to screen out those categories not included in the target survey population.
Nevertheless, an extensive data set was developed for various equipment/fuel type combinations, including a number of different equipment characteristic and operation parameters. Surrogates were identified for each survey sector and applied to the reported equipment counts to develop statewide equipment population and activity profiles. A detailed error analysis of the resulting profiles found the 95% confidence intervals for average hp and hours of operation were relatively tight for several key equipment categories. Although equipment population estimates had significantly greater uncertainty, reasonably accurate population, hp, and activity estimates may be obtained for diesel agricultural tractors, compressed gas industrial forklifts, and assorted residential lawn and garden equipment (chainsaws, lawn mowers, leaf blowers/vacuums, and trimmers/edgers/brushcutters.) Activity and hp data may be utilized for a number of other equipment categories as well, depending upon what confidence intervals are deemed acceptable by ARB.
Model year distributions may be updated based on the findings for some of the most common equipment types such as agricultural tractors and compressed gas industrial forklifts. The age distribution for diesel, and especially gasoline, agricultural tractors was particularly skewed toward older units, with the median age being more than 20 years old.
147
The fuel type distribution data may also provide useful updates to OFFROAD defaults. For example, diesel ATVs, which are not listed in OFFROAD, were clearly identified in multiple survey sectors, and subsequently confirmed via manufacturer websites. In addition, the prevalence of gasoline agricultural tractors apparent from the survey data is not reflected in the current OFFROAD values. For example, the gasoline fraction estimated for the Agricultural sector is about 10%, compared to less than 1% in OFFROAD.
The seasonality data collected during the survey indicated a substantial variation in activity levels over the year among agricultural, recreational, and lawn and garden equipment, and may provide a basis for updating the seasonal allocation factors within OFFROAD in the future. Geographic allocation factors have also been identified and developed to allow for the proportional distribution of statewide population estimates to the county level.
Comparison of the study’s equipment population estimates with independent data sources (such as OFFROAD and EPA’s NONROAD model estimates for California) led to the conclusion that there was a systematic under-reporting of many construction and recreational equipment categories. For example, of the more common construction equipment types, only rubber tire loaders and tractors/loaders/backhoes had population estimates 50% or more of that found in the emissions models. In addition, while certain industrial equipment categories appear well-represented (e.g., pressure washers and air compressors), others such as generator sets and welders appear to be substantially under-reported.
In addition, several specialty equipment categories were identified by a very low number of respondents, or not at all by the survey. More notable examples include: airport GSE, rough terrain forklifts, TRU, and surfacing equipment. In addition, certain end-user groups appear to be under-represented, namely commercial lawn and garden companies and public sector fleets. For instance, only four pieces of off-road equipment were identified in the entire public sector stratum within the Residual sector. As such, alternative data sources are likely needed for these equipment types and end users.
Uncertainty associated with both equipment populations and average activity levels make preemption determinations difficult for the different off-road equipment categories. While the majority of population and activity distributions appear consistent with ARB’s current preemption list, a number of exceptions and issues were identified.
Procedures were developed to collect engine RPM and exhaust gas temperature data on over 70 pieces of construction equipment. Data loggers were installed in the field for a period of one week for each piece of equipment included in the study. Common equipment types included backhoes, loaders, and excavators in both public and private operation. Engine on-time covered a broad range, from a few hours on a single day, to heavy use over five or more days during the week. Exhaust gas temperature profiles were highly variable as well, even within the same equipment category. Modal values for exhaust temperature ranged from approximately 200 to over 500 degrees Celsius. Temperature distributions also varied, with some equipment operated over a tight range, while others exhibited broad, even bimodal profiles. Accordingly, generalizations about engine operation time and exhaust gas temperature distributions could not be made regarding the construction fleet in California, or even regarding the specific equipment
148
types instrumented for this survey. However, the data may be used to screen for candidates for further testing in the future.
149
6.0 Recommendations
ERG developed a list of recommendations for utilizing and building upon the findings of this study, as described below.
1. Integrate the population, activity, and hp distribution data for diesel agricultural tractors, compressed gas industrial forklifts, and possibly other equipment categories with robust response rates into the OFFROAD model. The current data set most likely contains the most comprehensive profile of in-use diesel agricultural tractors in the country, and should be utilized to the greatest extent possible. While not as extensive, large numbers of observations are also available for compressed gas industrial forklifts, residential lawn mowers, residential chainsaws, air compressors, tractors/loaders/backhoes, ATVs, sprayers, and generator sets.
2. Review confidence interval by equipment category for average hp and activity estimates. ARB should establish reasonable limits for 95% confidence intervals and adopt the average hp and activity estimates within those limits.
3. Consider adopting model year distributions for diesel and gasoline agricultural tractors. The large number of agricultural tractor observations in the data set should allow for an accurate age profile to be developed at the state level. Smoothing of the model year data may still be required in order to obtain a reasonably continuous scrappage function. Development of a unique scrappage curve for agricultural tractors should be performed to account for their extreme age compared with other equipment types.
4. Conduct a targeted assessment of construction equipment populations and activity profiles. ERG has found the construction industry to be consistently difficult to profile through standard phone surveys. Alternative strategies should be investigated, including use of UCC-1 equipment sales transaction data to estimate hp and model year distributions, and possibly in-use populations for this equipment. Activity data may be obtained from engine clock hour data available from shop records and/or rental companies.
5. Conduct a similar targeted assessment for recreational equipment populations and activity profiles. Alternative strategies for these equipment types might include evaluation of recreational marine equipment registration data, or boat launch observations at selected locations across the state. This equipment is also particularly likely to be used in areas of the state different from where they are domiciled. Therefore these surveys should inquire specifically about use locations as well.
6. Utilize the findings from other studies of specialty equipment categories and/or end-user categories. We recommend integrating the findings from several previous studies to supplement the findings from the current effort. Such studies have been performed by ARB and others for TRUs, agricultural pumps, commercial lawn and garden equipment, publicly-operated off-road fleets, and possibly GSE.
150
7. Adopt the geographic allocation factors developed for the different survey sectors. Geographic allocation factors have been tailored to the different survey sectors and represent the most up-to-date data available concerning the distribution of surrogates at the county level.
8. Consider adopting seasonal allocation factors for agricultural and residential lawn and garden equipment. These data are likely representative of high-level activity patterns in these different sectors, and could be applied to multiple equipment/fuel type combinations.
151
References
1. Eastern Research Group, “Acquisition and Analysis of Commercial and Institutional Lawn and Garden Population and Activity Data,” Final Report, prepared for the California Air Resources Board, August 8, 2006.
2. TIAX LLC, “California Public Fleet Heavy-Duty Vehicle and Equipment Inventory,” prepared for the California Air Resources Board, March 17, 2003.
3. Kidd, Sandee. “OFFROAD Modeling Change Technical Memo: Revisions to the Diesel Transport Refrigeration Units (TRU) Inventory,” Preliminary Draft, California Air Resources Board, July 18, 2003.
4. Debbie Futuba, ARB PTSB, personal communication, May 1, 2007. 5. www.spec-check.com/quickfinder-results.cfm 6. www.tractordata.com 7. US EPA NONROAD2005 Emission Factor Model, obtained from
http://www.epa.gov/oms/nonrdmdl.htm. 8. National Agricultural Statistics Service, USDA, “2002 Census of Agriculture: Volume 1,
Chapter 2: California County Level Data,” obtained from http://www.nass.usda.gov/census/census02/volume1/ca/index2.htm.
9. California Workforce Investment Board, California Regional Economies Employment Series, 2005, obtained from http://www.labormarketinfo.edd.ca.gov/cgi/databrowsing/?PageID=173.
10. USA Data on-line query, February 11, 2005, obtained from http://usapub.usadata.com/portal.aspx?datasource=BUSINESS&referrer=http://www.usadata.com.
11. U.S. Census Bureau, Housing Unit Estimates April 1, 2000 to July 1, 2006, obtained from http://www.census.gov/popest/housing/HU-EST2006-4.html.
12. U.S. Census Bureau, Fact Sheet: California, obtained from U.S. Census Bureau, http://factfinder.census.gov/servlet/ACSSAFFFacts?_event=Search&geo_id=&_geoContext=&_street=&_county=&_cityTown=&_state=04000US06&_zip=&_lang=en&_sse=on&pctxt=fph&pgsl=010.
13. U.S. Census Bureau, State and County QuickFacts: California, obtained from http://quickfacts.census.gov/qfd/states/06000.html.
14. Eastern Research Group, “Nonroad Industrial Equipment Inventory for the Dallas/Fort Worth Area,” prepared for the Texas Commission on Environmental Quality, August 31, 2004.
15. University of Edinburgh School of Biological Sciences, “Poisson Distribution for Count Data”, obtained from http://www.biology.ed.ac.uk/research/groups/jdeacon/statistics/tress10.html.
16. California ARB, “List to Determine Preempt Off-Road Applications,” May 22, 2007, obtained from www.arb.ca.gov/msprog/offroad/preempt.htm.
152
Glossary of Terms, Abbreviations, and Symbols
ARB – Air Resources Board ATV – All Terrain Vehicle CAFO – Concentrated Animal Feeding Operation(s) CREE - California Regional Economies Employment series EDMS - Emission Dispersion and Modeling System EPA – Environmental Protection Agency ERG – Eastern Research Group (prime contractor) FAA - Federal Aviation Administration GSE – Ground Support Equipment HP – Horsepower LPG – Liquefied Petroleum Gas (Propane) NONROAD – USEPA emission factor model for off-road equipment NOx – Nitrogen Oxides OFFROAD – California ARB emission factor model for off-road equipment PSR – Power Systems Research RPM – engine Revolutions per Minute SAS – Statistical Analysis Software SIC – Standard Industrial Classification SJV – San Joaquin Valley SORE – Small Off-road Engine rulemaking SSI – Survey Sampling International TCEQ – Texas Commission on Environmental Quality TRU – Transportation Refrigeration Unit UCC-1 – Uniform Commercial Code (equipment sales record required for all financed
transactions in the U.S.) USDA – United States Department of Agriculture
153
Appendix A Crop Type Assignments for Agriculture Sector
154
Crop Crop Type Almonds Nut Crop Chestnuts Nut Crop Macadamia Nut Crop Nuts (S) Nut Crop Nuts Other/Non-Specific Nut Crop Pecans Nut Crop Pistachios Nut Crop Walnuts Nut Crop (Turf and Ornamental) Golf Course - Military Other Crop (Turf and Ornamental) Golf Course - Private Other Crop (Turf and Ornamental) Golf Course - Public Other Crop (Turf and Ornamental) Golf Course - Resort Other Crop (Turf and Ornamental) Landscape - Contract Other Crop (Turf and Ornamental) Landscape - Architect Other Crop (Turf and Ornamental) Lawn Maintenance Other Crop (Turf and Ornamental) Memorial Park Other Crop Berries Other/Non-Specific Other Crop Blackberries Other Crop Blueberries Other Crop Cascadeberries Other Crop Cranberries Other Crop Foliage Other Crop Fruit (S) Other Crop Fruit Other/Non-Specific Other Crop Gooseberries Other Crop Grass Other Crop Huckleberries Other Crop Loganberries Other Crop Marionberries Other Crop Mushrooms Other Crop Nurseries Other/Non-Specific Other Crop Nurseries Retail Other Crop Nurseries Wholesale Other Crop Office Park Other Crop Oil Crops (S) Other Crop Oil Crops Other/Non-Specific Other Crop Passion Fruit Other Crop Raspberries Other Crop Seed Other Crop Sod & Sodding Service Other Crop Strawberries Other Crop Tropical Fruit (S) Other Crop Tropical Fruit Other/Non-Specific Other Crop Turf & Ornamental (S) Other Crop Turf & Ornamental Other/Nonspecific Other Crop Alfalfa Row Crop
Soybeans Row Crop Specialty Hay Row Crop Spinach Row Crop Squash Row Crop Sugarbeets Row Crop Sugarcane Row Crop Sunflower Row Crop Sweet Corn Row Crop Timothy Row Crop Tomatoes Row Crop Turnips Row Crop Vegetables (S) Row Crop Vegetables Other/Non-Specific Row Crop Vetch Row Crop Wheat Row Crop Yams/Sweet Potatoes Row Crop Apples Tree Crop Apricots Tree Crop Avocados Tree Crop Bananas Tree Crop Cherries Tree Crop Citrus (S) Tree Crop Citrus Other/Non-Specific Tree Crop Dates Tree Crop Figs Tree Crop Grapefruit Tree Crop Guava Tree Crop Kiwi Tree Crop Kumquat Tree Crop Lemons Tree Crop Limes Tree Crop Mangos Tree Crop
157
Crop Crop Type Nectarines Tree Crop Olives Tree Crop Oranges Tree Crop Papaya Tree Crop Peaches Tree Crop Pears Tree Crop Persimmons Tree Crop Pineapple Tree Crop Pome Fruit (S) Tree Crop Pome Fruit Other/Non-Specific Tree Crop Pomegranate Tree Crop Prunes Tree Crop Quince Tree Crop Stone Fruit (S) Tree Crop Stone Fruit Other/Non-Specific Tree Crop Tangelos Tree Crop Tangerines Tree Crop Tree Fruit (S) Tree Crop Tree Fruit Other/Non-Specific Tree Crop
158
Appendix B SIC Codes by Survey Sector
159
Agricultural – Row Crops SIC Code Text Description 011 Cash Grains 013 Field Crops, Except Cash Grains
Agricultural – Nut Crops 0173 Tree Nuts 0179 (partial) Fruits and Tree Nuts, Not Elsewhere Classified Agricultural – Tree Fruit 0174 Citrus Fruits 0175 Deciduous Tree Fruits 0179 (partial) Fruits and Tree Nuts, Not Elsewhere Classified Agricultural – Other 0161 Vegetables and Melons 0171 Berry Crops 0172 Grapes 0191 General Farms, Primary Crop Agricultural – CAFO/Dairy 021 Livestock, except Dairy and Poultry 024 Dairy Farms Agricultural - Farm Management 0711 Soil Preparation Services 0721 Crop Planting, Cultivating and Protecting 0722 Crop Harvesting, Primarily by Machine 0762 Farm Management Services Construction 15 Building construction general contractors and operative builders 16 Heavy construction other than building construction contractors 17 Construction special trade contractors Mining 10 Metal Mining 12 Coal Mining 14 Mining and Quarrying of nonmetallic minerals except fuels Logging 241 Logging Residual (other) Every SIC not grouped in Ag_Farm Management, Construction, Mining or Logging AND not in
160
one of the SICs listed below 4724 Travel Agencies 4725 Tour Operators 482: Telegraph And Other Message Communications 483: Radio And Television Broadcasting Stations 5441 Candy, Nut, and Confectionery Stores 5461 Retail Bakeries 5499 Miscellaneous Food Stores Major Group 56: Apparel And Accessory Stores 5719 Miscellaneous home furnishings Stores 5735 Record and Prerecorded Tape Stores 5736 Musical Instrument Stores Major Group 58: Eating And Drinking Places Major Group 59: Miscellaneous Retail (EXCEPT INDUSTRY GROUP 598 - FUEL DEALERS) Division H - Finance, Insurance, and Real Estate - Major Groups 60-65, 67) Major Group 72: Personal Services (EXCEPT 7216 Drycleaning Plants) Major Group 73: Business Services (EXCEPT Industry Group 734: Services To Dwellings And Other Buildings, AND Industry Group 735: Miscellaneous Equipment Rental And Leasing 7521 Automobile Parking Major Group 76: Miscellaneous Repair Services Industry Group 783: Motion Picture Theaters Industry Group 784: Video Tape Rental 793: Bowling Centers 792: Theatrical Producers (except Motion Picture), 791: Dance Studios, Schools, And Halls 7993 Coin-Operated Amusement Devices Major Group 80: Health Services Major Group 81: Legal Services Major Group 83: Social Services 8412 Museums and Art Galleries Major Group 86: Membership Organizations Major Group 87: Engineering, Accounting, Research, Management, And Related Services Major Group 89: Miscellaneous Services Industry Group 921: Courts 9222 Legal Counsel and Prosecution Major Group 93: Public Finance, Taxation, And Monetary Policy Major Group 94: Administration Of Human Resource Programs Major Group 95: Administration Of Environmental Quality And Housing Programs Major Group 96: Administration Of Economic Programs 9111 Executive Offices 9121 Legislative Bodies 9131 Executive and Legislative Offices Combined
161
Appendix C- Questionnaire Designed for Telephone Administration
162
TELEPHONE QUESTIONNAIRE
INTRO 1
Hi, my name is [NAME] and I’m calling on behalf of NuStats. May I speak with [NAME OF CONTACT]? INTRO 2
Hi my name is [NAME] and I’m calling on behalf of NuStats. We are conducting a survey with <business owners in the [Agriculture, Construction, Mining, Commercial] industry about the off-road equipment and off-road vehicles they use in their operations> OR <residents about the off-road equipment they own.> The information collected in the survey will provide more accurate data on off-road equipment used in California so that state air quality estimates can be updated. By off-road equipment or off-road vehicles, I mean any non-stationary device used or driven off the highways and powered by an internal combustion engine or electric motor including portable generators, as well as electric equipment, with a motor that is not typically driven on the road and is self-propelled. Other examples include: [READ EXAMPLES FROM LIST FOR SAMPLE TYPE]. <FOR AG SAMPLE TYPE ONLY: The Air Resources Board: with industry support from the California Cotton Ginners and Growers Associations, Nisei Farmers League, California Grape & Tree Fruit League, California Citrus Mutual, and the Fresno County Farm Bureau> is conducting this study. <Your business or your household> has been randomly selected at random to participate in this study. We would like to talk to the person <in your company or in your household> who is most knowledgeable about the off-road equipment you own or lease. Are you that person? [IF YES, PROCEED; IF NO, ASK: CAN YOU REFER ME TO THE PERSON MOST KNOWLEDGEABLE ABOUT YOUR OFF-ROAD EQUIPMENT? WHEN CONTACT MADE WITH MOST KNOWLEDGEABLE PERSON START WITH INTRO 3] INTRO 3—use if referred by owner/operator as “most knowledgeable person.”
Hi my name is [NAME] and I’m calling on behalf of NuStats. We are conducting a survey with <business owners in the [Agriculture, Construction, Mining, Commercial] industry about the off-road equipment and machinery they use in their operations> OR <residents about the off-road equipment they own. The information collected in the survey will provide more accurate data on off-road equipment used in California so that state air quality estimates can be updated. <Name of Referral/Resident> is participating in this study and s/he referred us to you because are the person most knowledgeable about the off-road equipment owned or leased by <your company or
ALL TEXT IN CAPS ARE PROGRAMMING OR INTERVIEWER NOT ES AND ARE NOT READ TO THE RESPONDENT
163
your household>. By off-road equipment or off-road vehicles, I mean any non-stationary device used or driven off the highways and powered by an internal combustion engine or electric motor including portable generators. Other examples include: [USE EXAMPLES FROM SIDE BAR FOR SAMPLE TYPE]. <FOR AG SAMPLE TYPE ONLY: The Air Resources Board with industry support from the California Cotton Ginners and Growers Associations, Nisei Farmers League, California Grape & Tree Fruit League, California Citrus Mutual, and the Fresno County Farm Bureau> is conducting this study. START SURVEY.
SCREENING INTERVIEW Sample (S) = A1 = Agriculture grower/farmer First, I have a few general questions for you.
S1. How many pieces of motorized equipment do you own or lease that do not operate on the road? Examples include [USE EXAMPLES FROM SIDEBAR].
RECORD TOTAL_______ 1
NONE 2 TERMINATE
DK 9998 ASK FOR MORE KNOWLEGEABLE R AND REPEAT INTRO 2
S2. Does at least one of the pieces of equipment, whether owned or rented, have a maximum horsepower rating of less than 175hp?
YES 1
NO 2 TERMINATE
DK 9998 ASK FOR MORE KNOWLEGEABLE R AND REPEAT INTRO 2
S3. ONLY ASK IF S=A1. How would you describe your primary Agriculture business activity?
Nut Crop 1
Row Crop 2
Tree Fruit (apricots, peaches) 3
Citrus Fruit (lemons, oranges, tangerines) 4
CAFO/diary 5
Vineyards 6
164
DK 9998 ASK FOR MORE KNOWLEGEABLE R AND REPEAT INTRO 2
S4. ASK IF S = A1. What is the total acreage of the land owned or leased by you?
OPEN RESPONSE: [RANGE = 0-99,999 ACRES]
S5. ASK IF S=A1.Would you consider your business to be a Farm Management Company?
YES 1
NO 2
DK 9998
RF 9999
EQUIPMENT AND USAGE
1. So that we have a complete list of the different types of equipment you own or lease, I’d like you to list each type and the number of each type you have. IF NEEDED< REFER TO EXAMPLES OF EQUIPMENT FOR SAMPLE TYPE]
SPECIFY TYPE AND NUMBER OF EACH TYPE
DK 9998
Now, for this last series of questions, I’m going to ask you about each type of equipment you just listed to me. This will take <INSERT TIME>
PROGRAMMER—THE FOLLOWING TIMES CORRESPOND THE NUMBER OF EQUIPMENT TYPES LISTED IN 1:
1 – 5 Less than 5 minutes
6-10 Less than 10 minutes
11-15 About 12 - 15 minutes
16 – 20 About 20 minutes
21 – 25 About 25 minutes
>26 – 30 About 30 minutes or longer
2. Let’s start off with [EQUIPMENT TYPE].
A. What is the make of [EQUIPMENT TYPE] that you use the (next) most often?
165
OPEN RESPONSE
DK 9998
RF 9999
B. And what is the model name or number?
OPEN RESPONSE
DK 9998
RF 9999
C. How many [MAKE/MODEL] do you have? OPEN RESPONSE [RANGE 1-999]
DK 9998
RF 9999
D. a. What work is the main type of work or activity you do with this type of equipment? [PROGRAMMER NOTE: ROTATE RESPONSES]
Agricultural production, harvesting or processing 1
Building or construction 2
Warehousing 3
Automotive 4
Industrial 5
Recreational 6
Personal or residential 7
Other such as cleaning or maintenance (SPECIFY) 9997
DK 9998
RF 9999
b. Okay, what percentage would that be, then?
SPECIFY PERCENTAGE [PROGRAMMER NOTE: IF MORE THAN ONE ALTERNATIVE ACTIVITY IS MENTIONED, CONTINUE ASKING Q.2D a AND b UNTIL PERCENTAGES ADD UP TO 100%. ONCE PERCENTAGE EQUALS 100% CONTINUE TO Q.4.F]
166
DK 9998
RF 9999
E. Okay, now let’s focus on only your [MAKE/MODEL EQUIPMENT TYPE]. What is the model year you use the (next) most often?
OPEN RESPONSE
DK 9998
RF 9999
F. Now I’d like to know what is the horsepower and/or displacement?
a. Horsepower unit [SPECIFY UNIT] SKIP TO Fc. DK 9998
RF 9999
b. We don’t need to know exactly, but just roughly, could you tell me if the equipment horsepower is….
c. Now, how about the displacement? That would be in either cc’s, liters, or cubic inches.
SPECIFY UNIT
DK 9998
RF 9999
G. And the fuel type? [NOTE TO INTERVIEWER: ELECTRIC EQUIPMENT IS INCLUDED IN THE SURVEY]
Diesel 1
Gasoline 2
167
Natural Gas 3
Propane 4
Electric 5
Other (SPECIFY) 9997
DK 9998
RF 9999
H. During 2005, how many hours did you operate the [MODEL/YEAR EQUIPMENT TYPE]? An estimate is okay.
OPEN RESPONSE
DK 9998
RF 9999
I. Now, I’d like you to estimate the percentage of time you use it on a seasonal basis. You said the total annual hours in 2005 were [2H RESPONSE], what would be the percentage of time you use it in Winter…..[INTERVIEWER: ASSIST WITH CALCULATING TO 100%; ON FALL, GIVE THEM THE FINAL PERCENTAGE. REPEAT ALL PERCENTAGES AND ASK FOR VERIFICATION.]
Winter—Jan-Feb-Mar (SPECIFY PERCENTAGE)
Spring—Apr-May-June (SPECIFY PERCENTAGE)
Summer—July-Aug-Sept (SPECIFY PERCENTAGE)
Fall—Oct-Nov-Dec (SPECIFY PERCENTAGE)
DK 9998
RF 9999
J. [PROGRAMMER NOTE: INCLUDE FOR ALL SEASONS RECORDED IN I] On average, how many days per week, do you typically use [MODEL/YEAR EQUIPMENT TYPE] during the [SEASON]? An estimate is okay. [INTERVIEWER MAY NEED TO PROMPT RESPONDENT THIS INCLUDES WEEKENDS FOR A POSSIBLE TOTAL OF 7 DAYS.
SPECIFY NUMBER [RANGE 1-7]
DK 9998
RF 9999
168
K. Is [MODEL YEAR EQUIPMENT TYPE] portable? That is, is the [MODEL YEAR EQUIPMENT TYPE] moved more than one per year, but is not self propelled? YES 1
NO 2
DK 9888
RF 9999
L. Does that piece of equipment have wheels or is it a “crawler?” WHEELED 1
CRAWLER 2
NEITHER 3
DK 9998
RF 9999
PROGRAMMER NOTE: WHEN INVENTORY FOR EACH EQUIPMENT TYPE AND MAKE/MODEL IS COMPLETED. GO TO TERMINATION 1.
TERMINATION: Thank you. That’s all the questions I have for you today.
ASK IF SAMPLE = CONSTRUCTION INDUSTRY We are also conducting a follow up study during which participants will agree to attach a recording device on one or more pieces of their off-road equipment for one week. The device measures activity and usage of the equipment by hour of the day and day of week and will be installed and removed by a trained technician.
I-1. May we call you about this follow up study?
YES 1 CONFIRM NAME/PHONE
NO 2
169
Sample List of Off-road Equipment Types
1 2-wheel tractor(s)
2 Agricultural mower(s)
3 Agricultural tractor(s)
4 Air compressor(s)
5 All terrain vehicle(s)
6 Backhoe(s)
7 Bailer(s)
8 Brush cutter(s)
9 Bulldozer(s)
10 Chainsaw(s)
11 Chainsaw(s) (LT 5 hp)
12 Combine(s)
13 Drill(s)
14 Excavator(s)
15 Industrial forklift(s)
16 Generator set(s)
17 Grader(s)
18 Harvester(s)
19 Lawn edger(s)
20 Lawn mower(s) (walk behind)
21 Leaf blower(s) (back pack)
22 Loader(s)
23 Outboard engines
24 Panel Saw
25 Paving Equipment
26 Pipe Threading Machine
27 Pruning Tower
28 Pump(s)
29 Riding lawn mower(s)
170
30 Skid steer Loader(s)
31 Skidder(s)
32 Sprayer(s)
33 Snow blowers
34 Snow Mobiles
35 Sweeper(s)/Scrubber(s)
36 Table Saw
37 Tiller(s)
38 Tractor(s)
39 Transportation Refrigeration Unit(s)
40 Vertical Milling Machine
41 Vacuum
42 Water Truck(s)
43 Welder(s)
44 Other
171
Appendix D Logger Installation and Retrieval Procedure
172
Procedures for Proper Cleaire MLC (Logger) Installa tion
GENERAL (updated Sep 2, 2007)
• Have trained operator demonstrate proper and safe engine startup and shutdown • Ensure all necessary tools and consumables are at hand. (See list) • Ensure MLC is complete (See list) • Ensure the laptop available will communicate with the MLC properly.
Hardware Installation
• Find appropriate locations for all wiring, sensors and the MLC. o Does not hinder normal operation of equipment o Will not be damaged during normal operation o Does not impede operator vision o Does not look precarious or dangerous o Allows for laptop hookup to dongle on MLC in final installed location o Allows cable routing within length limitations of wiring harness o Allows safe cable routing. o Allows proper fastening of all wiring, sensors and MLC that withstand vibration
of normal engine operation • Always use Backpressure for 0-5 V analog (if needed).
Recommended Hardware installation order:
1. Install exhaust temperature sensor (T1) • Always use T1 for exhaust temperature sensing and T2 for ambient. • Secure exhaust thermocouple using wire and spring arrangement. Thermocouple
should not touch inner wall of exhaust pipe and should enter into the pipe about 3 or 4 inches
• Ensure un-insulated wire is far enough from hot exhaust. Use springs as standoffs, if necessary.
2.a. Install Idler Pulley RPM sensor (if no appropriate port exists in bell-housing of engine)
• Use RPM sensing wheel with dead-shaft and hall-effect sensor. • Mount hinge with two large hose clamps around alternator. Use flat metal stock to
reinforce hinge at contact surface with alternator. • Make sure hinge rotates smoothly and • Ensure sensor wheel contacts alternator belt as close to center of belt as possible.
Adjust wheel offset if possible to center sensor wheel on belt. • Ensure sensor wheel spins freely but adjust hall-effect sensor offset from wheel
until sensor wheel indexes because of magnetic field of hall-effect sensor on metal tacks in sensor wheel.
2.b. Install Fly-Wheel RPM sensor • Remove dust cap from threaded port in bell housing of engine. Store it in a safe
spot on the vehicle where it can be retrieved during removal of the logger. Make not of the location of the plug in the installation sheet.
173
• Use a fine-thread bolt to clean any burrs from the port threads. • Install the hall-effect sensor into the port and screw it gently in until it bottoms
against the fly-wheel. Screw it back out ¼ turn (CCW). The body of the sensor much softer than the bell housing material and is easily cross-threaded.
• Temporarily connect the sensor to the MLC and check its signal when the engine is on. Disconnect the sensor from the MLC.
3. Pick MLC location with wire routing in mind. 4. Route wiring and connectors. 5. Connect power wires to battery.
• Use crimp on eyelets. • Make sure positive lead has a 5amp fuse. Connect negative first. • Test voltage to eyelets after installing power wires.
6. Loosely zip tie components to allow safe initial testing of MLC and installed sensors. • Secure data logger with large zip ties in appropriate location. Leave loose until
installation is QA’d. • Secure all wiring with zip ties. Leave loose until installation is QA’d. • Test vibration response of all equipment and wiring. • Ensure all equipment including wiring is out of the way of any moving or hot
parts. 7. Run engine and use laptop to calibrate MLC rpm scale. 8. ”Commission” the datalogger with appropriate information and configuration settings.
Test setup with Software section of this SOP before “clean up” and tightening of hardware installation. Make appropriate changes if necessary (e.g., swap thermocouples or wires)
9. Finish install by adding and/or tightening zip ties and ensuring all wires and components are secured.
Software If necessary, create a folder where data will be downloaded when this unit is de-installed. Save pictures and other files related to this install there. Use MLinC program to setup up the logging session. Remember to click “send to MLC” after changing information. Enter the following information (and write down for entry into spreadsheet):
• ‘Engine Info’ tab o Vehicle ID -- unique vehicle ID (e.g., owner ID number or engine number from
emissions label.) o Customer – site name or vehicle owner (e.g., Davis, city of) o Product – Vehicle make & model (e.g., JD 310sg) o Technician Name – Your initials o Engine Hrs or Miles – engine hours from hour meter (typically in the cab) o Set Time and Date – set if necessary o Set RPM Scale – run the engine and compare reading to actual RPM. Adjust scale
factor to ensure most accurate reading over entire engine RPM range. Use three RPM test points to calibrate; idle, midrange and maximum engine RPM. Record these data points in table provided on install form. Suggested scale factor of 22.
• ‘Log’ tab – If necessary o Fast download – to save data to laptop that is currently stored in MLC
174
o View the Instant Report. Save this information as a text file into the folder where data will be downloaded for this vehicle.
Using hyperterminal set these options with the ‘config’ command
• 1 Log Update Secs 2 � set to 2 • 2 Logging Enabled 1 � ensure logging enabled • 3 Logging Verbose 1 � use to test logging, not necessary if sensor
reading confirmed in prior step with MLinC program • 4 EV Logging Verbose 0 • 10 RPM Scale Factor 22 � Set this in here. Use number found in MLinC
software under ‘Set RPM scale’. Hyperterminal will reliably save scale factor. Suggested scale factor 22.
• 11 RPM Log Threshold 200 � adjust this only if using RPM log control • 12 Log Turnoff Secs 10 • 13 Algorithm Select 0 � not important for logging-only • 16 T1 Log Threshold 60 � set to 60 • 18 Log Control, 0-RPM, 1-T1 1 � Use T1 for log control • 19 Engine Disp 10 x L ## � based on current engine displacement
After settings set with ‘configx yy’ then save all settings with ‘cfgsave’. Close hyperterminal window and reopen to confirm config settings saved. Type “config” and “status” commands. Save the results to a file named 2007mmddInstallConfig.txt” in the same folder where the data will be downloaded after the de-installation. Maintain an active connection between the hyper terminal and the MLC to verify logging begins when engine is started. Start engine and wait for data to be logged. This should appear automatically if verbose logging is enabled. Run engine at idle for 30 seconds and then shut off. Watch data to make sure it seems reasonable.
Indicated RPM Calibration Curve Data Target Engine RPM Actual Engine
Checking an Installation Visually inspect the RPM and thermocouple sensors. Establish communications with the MLC and watch the live data as the engine is running. Trouble shoot any problems. If de-installation is necessary before a 7 contiguous calendar days of proper logging, any vehicle should be found to replace the unfinished one. The replacement vehicle should be installed as if the unfinished vehicle had never been logged.
175
Hardware Un-install After 7 contiguous calendar days of proper logging, begin un-install by downloading data from MLC to laptop. (Note: 7 days with engine activity are not required. The logger need only be installed for 7 days of proper logger installation and logger operation.)
1. Open MlinC program. 2. First ensure a working connection with the MlinC by reading both temperature readings
in the “engine info” tab. Click the “read MLC” button a few times if necessary. 3. Check RPM sensor signal by spinning RPM sensor wheel by hand while watching for a
reading on the “engine info” tab. a. If not reading any RPM signal; download data without un-installing physical
system. Review data and insure one full calendar week of data that includes RPM readings.
b. If there is one week of ‘good’ data; continue to step 4 of this un-install procedure. c. If there is not one week of ‘good’ data, replace RPM sensor with a known
working sensor and follow install procedure to ensure a proper RPM reading. Do not un-install the system. Leave the system installed to get a complete week of data collection (including the good RPM data already collected).
4. Open MlinC program. Click on “log” tab. Then click on “fast download” button. While download is taking place (approx. 15 minutes ), physically remove sensors and wiring. Be sure to leave the MLC connected to the battery while downloading data.
1. Start with exhaust temperature sensor. Clip/cut the metal cable that secures the retaining springs to the exhaust pipe. Save springs for a later install.
2. Clip/cut all zip ties that secure the wiring. 3. Remove the rpm sensor second. While removing the large hose clamps from the
alternator, be sure not to touch any exposed “positive” metal, wire, or bolts on the alternator.
After download is complete, convert the binary file into a text file using the MLinC software. 1. On the “log” tab, click the “view binary” button. 2. In the proceeding popup window (titled “Convert Binary to Text”), click the “browse”
button. 3. Another popup window will open. Navigate to and select the .bin file of the recently
downloaded data. Press the “open” button and the popup window will close. 4. Once a binary file is selected, press the “convert” button in the “Convert Binary to Text”
popup window. The conversion takes about a minute and two text files will open when the conversion is finished.
5. Review the Text file with the time stamped raw sensor readings to ensure good RPM readings right up to the last logging time. Some judgment should be exercised to evaluate the information and to assume the information contains a week of “useful” data.
After checking the downloaded data log, finish physical un-installation by disconnecting the MLC from the battery. Be careful not to ground out the Positive battery terminal or wires with your tools or your body. Remove any remaining components of the Cleaire data logging system from the vehicle and collect all trash (e.g. zip tie or wire tie pieces). Try to clean the wiring harness and the MLC before packing neatly back in the supplied box.
176
As soon as possible send a copy of the data to [email protected] or save to another location, such as a flash drive. Suggested Tools
- Wrenches (various sizes, ¼ to ¾ inch, open end) - Wire cutters (nippers) - Adjustable pliers and ‘monkey’ wrench - Flat head and Philips screwdriver - Utility knife - Wire terminal crimp tool - Multimeter with Ohms, VDC at least - ¾ inch, fine thread bolt to clean out bell-housing port for RPM transducer - 5/8 inch, fine thread bolt to clean out bell-housing port for RPM transducer
Consumables for Install
- Zip ties various sizes - Locktite (non-permanent) - Wire ringlet terminals for power/ground (male, female plug type and ring type) - Electrical tape - Springs (to secure exhaust temp thermocouple) - Tie wire, metal braided (to secure exhaust temp thermocouple) - Hose clamps for securing RPM sensor to alternator
MLC Logger Parts List
- MLC in box - Umbilical for sensors with connectors for TC1, TC2, RPM, and MAP - Umbilical for power with power terminals and serial data connector - RPM sensors (1 and at least 1 back-up) - Thermocouples (2 and at least 1 back-up) - RPM/belt speed gadgets (1 and at least 1 back-up)
177
Appendix E Public Fleets Contacted for Participation
178
179
180
181
182
Appendix F Instrumented Vehicle Exhaust Gas Temperature Profil es