70
The Feasibility Study of the Flood Control Project for the Lower Cagayan River in the Republic of the Philippines Final Report Main Report Tables

The Feasibility Study of the Flood Control Project for the Lower Cagayan River in the Republic of the Philippines
Final Report Main Report
Tables

Serial No Project Name LocationImplementing
Agency(District Office)
Kind of Works Budget Allocation(Pesos1,000)
Scheduled Date of
Completion1 Minanga river control project Gonzaga Cagayan 1st Concrete revetment 500 Oct.2 Protection works along Cagayan valley road Alcala Cagayan 1st Drainage canal 75 Jul.3 Protection works along Cagayan valley road Aparri Cagayan 1st Drainage canal 75 Jul.4 Protection works along Gattaran-Bolos road Baggao Cagayan 1st Slope protection 75 Jul.5 Protection works along Dugo-San Vicente road Buguey Cagayan 1st Slope protection 75 Jul.6 Protection works along Cagayan valley road Camalaniugan Cagayan 1st Drainage canal 75 Jul.7 Protection works along Gataran-Bolos road Gattaran Cagayan 1st Slope protection 75 Jul.8 Protection works along Cagayan valley road Lal-Lo Cagayan 1st Drainage canal 75 Jul.9 Protection works along Dugo-San Vicente road Sta.Ana Cagayan 1st Slope protection 75 Jul.
10 Protection works along Dugo-San Vicente road Sta.Tresita Cagayan 1st Slope protection 75 Jul.11 Protection works along Dugo-San Vicente road Gonzaga Cagayan 1st Slope protection 75 Jul.12 Cagayan river control project Alcala Cagayan 1st Concrete revetment 350 Aug.13 Cagayan river control project Aparri Cagayan 1st Concrete revetment 350 Aug.14 Cagayan river control project Camalaniugan Cagayan 1st Concrete revetment 350 Aug.15 Cagayan river control project Gattaran Cagayan 1st Concrete revetment 350 Aug.16 Cagayan river control project Lal-Lo Cagayan 1st Concrete revetment 350 Aug.17 Lucba river control project Abulug Cagayan 2nd Concrete revetment 1,580 Jun.18 Zinundungan river control project Lasam Cagayan 2nd Concrete revetment 690 May19 Claveria river control project Claveria Cagayan 2nd Gabion spur dike 570 May20 Pamploma river control project Pamplona Cagayan 2nd Dike 500 May21 Malag river control project Rizal Cagayan 2nd Dike 460 May22 Cagayan river control project Tuguegarao Cagayan 3rd Spur dike 1,250 Dec.23 Cagayan river control project Tuguegarao Cagayan 3rd Spur dike 1,250 Dec.24 San Ignacio river bank protection project Ilagan Isabela 1st Concrete revetment 1,000 Mar.25 Cagayan river control project Cabagan Isabela 1st Concrete revetment 2,000 Apr.26 Aurora flood control project Aurora Isabela 2nd Bank protection 1,500 Jun.27 Siffu river control project Roxas Isabela 2nd Concrete revetment 1,500 Jun.28 Cagayan river control project Angadanan Isabela 3rd Gabion bank protection 1,000 Jun.29 Cagayan river control project Cauayan Isabela 3rd Gabion bank protection 1,430 Jun.30 Cagayan river control project Reina Mercedez Isabela 3rd Concrete revetment 1,400 Jun.31 Magat river control project San Mateo Isabela 3rd Gabion spur dike 820 May32 Magat river control project Luna Isabela 3rd Gabion spur dike 650 Apr.33 Gucab river control project Echague Isabela 4th Gabion 1,510 May34 Jones drainage system project Jones Isabela 4th Drainage canal 480 Apr.35 Dammang river control project Echague Isabela 4th Gabion 1,510 May36 Magat river control project Bayombong Nueva Viscaya Dike and revetment 259 May37 Magat river control project Bayombong Nueva Viscaya Dike and revetment 225 May38 Magat river control project Bayombong Nueva Viscaya Dike and revetment 225 May39 Magat river control project Solano Nueva Viscaya Dike and revetment 225 May40 Magat river control project Solano Nueva Viscaya Dike and revetment 225 May41 Magat river control project Solano Nueva Viscaya Dike and revetment 187 May42 Magat river control project Bagabag Nueva Viscaya Dike and revetment 187 May43 Magat river control project Bambang Nueva Viscaya Dike and revetment 187 Apr.44 Magat river control project Bambang Nueva Viscaya Dike and revetment 187 May45 Magat river control project Bambang Nueva Viscaya Dike and revetment 187 Apr.46 Sta.Cruz river control project Bambang Nueva Viscaya Dike and revetment 187 Mar.47 Protection of La Union- Quirino road Kayapa Nueva Viscaya Dike and revetment 345 Mar.48 Sta.Fe river control project Sta.Fe Nueva Viscaya Dike and revetment 187 Apr.49 Sta.Fe river control project Aritao Nueva Viscaya Dike and revetment 187 Mar.50 Ponggo flood control project Nagtipunan Quirino Gabion type bank protection 665 Jun.51 Poblacion Norte flood control project Maddela Quirino Gabion type bank protection 620 May52 Diduyon flood control project Maddela Quirino Gabion type bank protection 573 Apr.53 Construction of protection along Cordon-Aurora road Cabarroguis Quirino Canal lining and bank protection 467 Apr.54 Abbag flood control project Maddela Quirino Gabion type bank protection 467 Apr.55 Dumadate flood control project Quirino Quirino Gabion type bank protection 267 Mar.56 Bank protection along Cordon-Maddela road Aglipay Quirino Bank protection 267 Mar.57 Lined canal and bank protection along Cordon- Aurora road Aglipay Quirino Lined canal and bank protection 207 Apr.58 Anak flood control project Nagtipunan Quirino Gabion type bank protection 467 Apr.59 Mahatao interior flood control project Mahatao Batanes Gravity retaining wall 1,080 Jul.60 Gaat flood control project Itbayat Batanes Gravity retaining wall 580 Jul.61 Charatayan-Panda flood control project Basco Batanes Gravity retaining wall 340 Jul.
Total : 61 projects Allocated budget : 33,100,000 Pesos Source: DPWH CY 2000 Infrastructure Program Region II, Feb. 2000
Table 2.6.1 Ongoing Flood Control Projects in Region 2 Office (for the year 2000)
T1
Serial No. Project Name LocationImplementing
Agency(District Office)
Kind of Works Budget Allocation(Pesos 1,000)
1 Cagayan river flood control project Alcala Cagayan 1st Concrete revetment 1,0002 Cagayan river flood control project Apari Cagayan 1st Concrete revetment 1,0003 Cagayan river flood control project Gattaran Cagayan 1st Concrete revetment 1,0004 Cagayan river flood control project Lallo Cagayan 1st Concrete revetment 1,0005 Protection works along JGCCSMBPR Baggao Cagayan 1st Slope protection for erosion 4406 Protection works along DSVR Buguey Cagayan 1st Slope protection for erosion 4407 Protection works along JGCCSMBPR Gattaran Cagayan 1st Slope protection for erosion 1,0008 Protection works along DSVR Gonzaga Cagayan 1st Slope protection for erosion 4409 Protection works along DSVR Sta. Ana Cagayan 1st Slope protection for erosion 44010 Protection works along DSVR Sta.Teresita Cagayan 1st Slope protection for erosion 44011 Minanga river control project Gonzaga Cagayan 1st Revetment 1,80012 Matalag river control project Rizal Cagayan 2nd Revetment 1,50013 Zinundungan river control project Lasam Cagayan 2nd Revetment 3,00014 Pamplona river control project Pamplona Cagayan 2nd Dike 1,00015 Lubcan river control project Lubucan Cagayan 2nd Revetment 2,00016 Claveria river control project Claveria Cagayan 2nd Revetment 2,00017 Claveria drainage system along road Claveria Cagayan 2nd Lined canal 1,50018 Nannarian flood control project Penablanca Cagayan 3rd Gabion spurdike 3,70019 Camasi flood control project Penablanca Cagayan 3rd lined canal 70020 Various flood control projects Cagayan 3rd 2,60021 Angasinan river control project Ilagan Isabela 1st Spurdike 2,50022 Baculud river control project Ilagan Isabela 1st Concrete revetment 2,00023 Various flood control projects Isabela 1st 6,50024 Siffu river control project Roxas,Sitio Isabela 2nd Gabion spurdike 3,00025 siffu river control project Roxas,Ana Isabela 2nd SSP revetment 3,00026 Aurora flood control project Aurora Isabela 2nd Gabion bank protection 3,00027 Siffu river control project Burgos Isabela 2nd Gabion bank protection 3,00028 Cagayan river control project Angadanan Isabela 3rd Concrete revetment 2,00029 Cagayan river control project Cauayan Isabela 3rd Concrete revetment 3,95030 Cagayan river control project Reina Mercedes Isabela 3rd Concrete revetment 2,67031 Magat river control project San Mateo Isabela 3rd Gabion spudike 2,73032 Magat river control project Luna Isabela 3rd Gabion spudike 65033 Jones town proper drainage system Jones Isabela 4th Lined canal 1,70034 Protection works along National road Magsaysay Isabela 4th Lined canal 3,00035 San Agustin town drainage system San Agustin Isabela 4th Lined canal 1,30036 Sta. Fe river control project Bambang Nueva Viscaya Gabion revetment/dike 1,00037 Magat river control project Bayombong Nueva Viscaya Gabion revetment/dike 50038 Magat river control project Magsaysay Nueva Viscaya Gabion revetment/dike 50039 Various flood control projects Nueva Viscaya 3,00040 Ponggo flood control project Nagtipuanan Quirino Gabion bank protection 2,00041 Poblacion Norte flood control project Maddela Quirino Gabion bank protection 2,50042 Diduyon flood control project Maddela Quirino Gabion bank protection 2,00043 Abbag flood control project Maddela Quirino Gabion bank protection 2,50044 Anak flood control project Nagtipunan Quirino Gabion bank protection 1,00045 Lusod flood control project Maddela Quirino Gabion bank protection 1,50046 Dumatat flood control project Cabarroguis Quirino Gabion bank protection 50047 Charatayan Panda Padangan FCP Basco Batanes Retaining wall 4,50048 Mahatao flood control project Mahatao Batanes Retaining wall 2,00049 Ivana flood control project Ivana Batanes Retaining wall 2,000
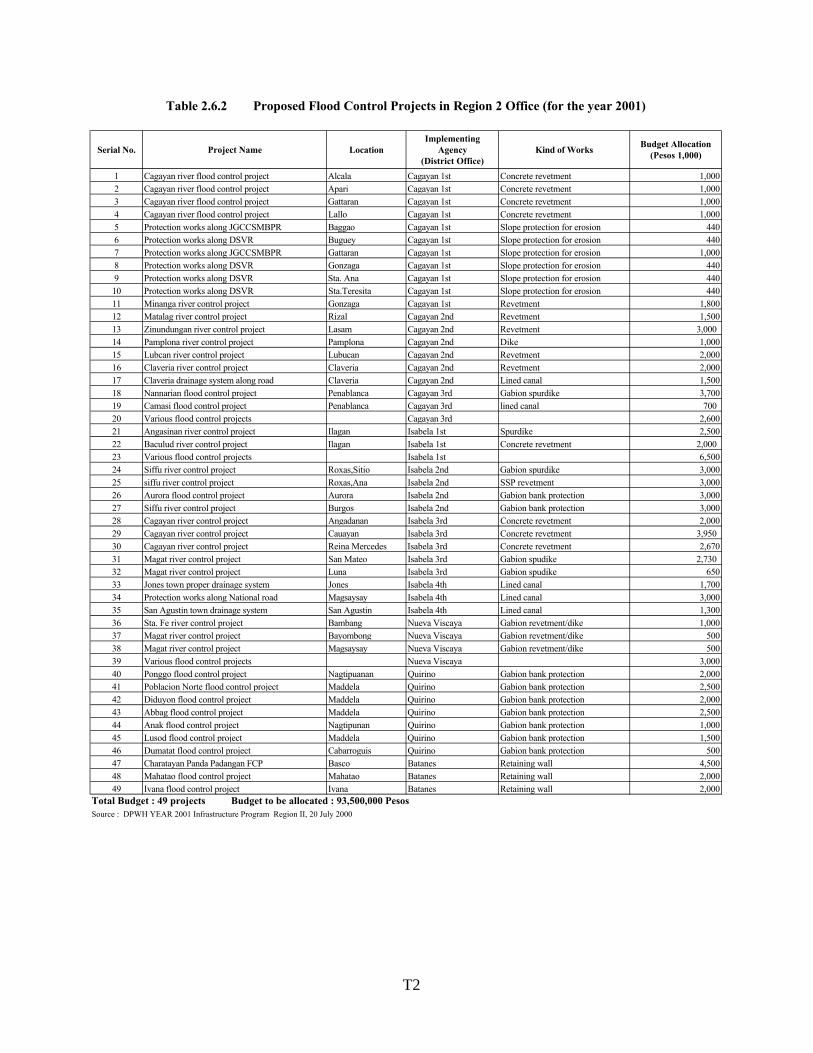
Total Budget : 49 projects Budget to be allocated : 93,500,000 PesosSource : DPWH YEAR 2001 Infrastructure Program Region II, 20 July 2000
Table 2.6.2 Proposed Flood Control Projects in Region 2 Office (for the year 2001)
T2

Ongoing Projects by Cagayan Province (million Pesos)Project Location Works Budget
River control Centro, Abulug Riverbank protection 0.50 Anti-erosion and river control Tuguegarao river Riverbank protection 0.76 Total 1.26
Proposed Projects by Nueva Viscaya Province (million Pesos)Project Location Works Budget
Bagumbayan flood control Dupax del Sur Bank protection -Road protection Solano Slope protection -Construction of earth dike Bayombong Earth dike -Road protection Bambang Slope protection -Road protection Solano Slope protection -Road protection Kayapa Slope protection -Road protection Solano Slope protection -Road protection Solano Slope protection -Road protection Sta.Fe Slope protection -Road protection Dupax del Sur Slope protection -Total -
Proposed Projects by Tuguegarao City (million Pesos)Project Location Works Budget
River control (Phase VIII) Centro Riverbank protection 1.25 Cagayan River control Caggay Riverbank protection 1.25 River control (Phase IV) Centro Riverbank protection 3.00 Cagayan River control Cataggaman Riverbank protection 3.50 Total 9.00
Ongoing Projects by Ilagan City (million Pesos)Project Location Works Budget
Ilagan dredging works Cagayan river Canalization 0.20
Proposed Projects by Ilagan City (million Pesos)Project Location Works Budget
Flood control Camunaran section Riverbank protection 10.00 Flood control Baculod Riverbank protection 10.00 Flood control Alinguigan 2nd Riverbank protection 10.00 Flood control Mulalum Riverbank protection 10.00 Flood control Aggasian Riverbank protection 10.00 Flood control Fugu Riverbank protection 10.00 Flood control Cab 17-21 Riverbank protection 10.00 Flood control Cab 9-11 Riverbank protection 10.00 Flood control Cab 7 Riverbank protection 10.00 Flood control Cab 4 Riverbank protection 10.00 Flood control ? Riverbank protection 10.00 Total 110.00 Note; All proposed projects above are not authorized yet and still in waiting approval.
Table 2.6.3 Ongoing and Proposed Flood Control Projects by LGUs
T3

Potential Remaining areaRegion irrigable area to be irriated
(ha) Area (ha) Rate (%) (ha)CAR 99,650 72,754 73 26,896
1 277,180 173,395 63 103,7852 472,640 196,899 42 275,7413 482,230 251,193 52 231,0374 263,590 128,055 49 135,5355 239,660 116,288 49 123,3726 197,250 75,141 38 122,1097 50,740 26,168 52 24,5728 84,380 46,485 55 37,8959 76,500 35,136 46 41,36410 108,140 39,408 36 68,73211 249,990 82,972 33 167,01812 205,789 54,841 27 150,948
ARMM 156,300 14,124 9 142,176CARAGA 162,300 37,509 23 124,791
Total 3,126,339 1,350,368 43 1,775,971
Source: NIA Corporate Planning Office
Table 2.8.1 Status of Irrigation Development by Region
Irrigation developmentas of December 1999
T4

Potential Remaining Potential Remaining Potential RemainingYear irrigable area to be irrigable area to be irrigable area to be
area developed area developed area developed (ha) (ha) (%) (ha) (ha) (ha) (%) (ha) (ha) (ha) (%) (ha)
1999 3,126,340 1,350,368 43.2 1,775,972 472,640 196,899 41.7 275,741 99,650 72,754 73.0 26,8962000 3,126,340 1,375,800 44.0 1,750,540 472,640 199,250 42.2 273,390 99,650 72,990 73.2 26,6602001 3,126,340 1,445,960 46.3 1,680,380 472,640 215,080 45.5 257,560 99,650 73,620 73.9 26,0302002 3,126,340 1,507,400 48.2 1,618,940 472,640 219,020 46.3 253,620 99,650 73,880 74.1 25,7702003 3,126,340 1,584,250 50.7 1,542,090 472,640 224,840 47.6 247,800 99,650 75,800 76.1 23,8502004 3,126,340 1,669,810 53.4 1,456,530 472,640 228,950 48.4 243,690 99,650 76,060 76.3 23,5902005 3,126,340 1,753,940 56.1 1,372,400 472,640 231,230 48.9 241,410 99,650 79,380 79.7 20,2702006 3,126,340 1,814,820 58.0 1,311,520 472,640 233,430 49.4 239,210 99,650 79,500 79.8 20,1502007 3,126,340 1,850,000 59.2 1,276,340 472,640 234,660 49.6 237,980 99,650 79,530 79.8 20,1202008 3,126,340 1,883,540 60.2 1,242,800 472,640 238,030 50.4 234,610 99,650 79,560 79.8 20,0902009 3,126,340 1,918,220 61.4 1,208,120 472,640 241,020 51.0 231,620 99,650 79,560 79.8 20,090
Increase*(1999-2009) - 567,852 18.2 - - 44,121 9.3 - - 6,806 6.8 -
Av. Increase* per year - 56,785 1.8 - - 4,412 0.9 - - 681 0.7 -
Source: NIA, CO, with addition (*)
Irrigation developed area
Irrigation developed area
Irrigation developed area
Table 2.8.2 Indicative Ten-Year Irrigation Development Program by NIA
CARWhole country Region 2
T5

Sites Length(km) Sites Length
(km) Sites Length(km) Sites Length
(km) Sites Length(km) Sites Length
(km)
Cagayan I - - 2 0.284 19 2.804 - - - - 10 11.000
Cagayan II - - 1 0.164 5 0.633 - - - - 5 5.500
Cagayan III - - 11 2.146 5 1.205 - - 1 1.690 5 6.100
Isabela I 3 0.125 5 0.452 26 5.444 7 3.145 12 3.372 10 11.360
Isabela II - - 7 0.453 4 0.815 21 3.860 - - 6 2.210
Isabela III - - 1 0.012 8 0.799 - - 1 4.988 4 4.600
Isabela IV - - 1 0.250 6 0.825 - - 3 5.670 4 4.100
Nueva Vizcaya - - 44 2.308 38 10.425 1 6.000 - - 12 13.850
Quirino 1 0.600 11 0.494 11 1.698 - - - - 5 5.850
Total 4 0.725 83 6.563 122 24.648 29 13.005 17 15.720 61 64.570
Source : Inventory Survey by DPWH, Region II Office
Main Drainage Canal
Lateral Drainage Canal Estero
Table 2.9.1 Existing Flood Control Structures in Cagayan River Basin
District OfficeEarth Dike Spur Dike Revetment
T6

Magat DamLocation Oscariz, Ramon , IsabelaCompletion date October-82Purpose Irrigation and hydroelectric generationDam
Type : Zoned earth rock fillDirect height : 114 m Crest length : 4,160 m Crest elevation : 200 EL m
SpillwayWidth (m) : 164 mRadial gates : 7 setsOrifice gates : 2 setsDischarge capacity : 30,600 cu.m/s
ReservoirFull supply level (FSL) : 193.0 EL mMaximum flood level (MFL) : 197.6 EL mStorage capacity at FSL : 1.08 billion cu.mStorage capacity at MFL : 1.26 billion cu.m
Power houseInstalled capacity : 360 MWAdditional capacity : 180 MWTotal : 540 MW
Irrigation service Service area : 95,000 ha
Maris Diversion Weir (Maris Dam)Location Oscariz, Ramon, IsabelaCompletion date August-82Purpose IrrigationWeir
Type : Ogee type concrete weirDirect height : 10.5 mCrest length : 102.00 mCrest elevation : EL m
Scouring sluiceSluice gate : 2 setsStoplog gate : 16 sets
SluicewayNorth gate : 2 setsSouth gate : 2 sets
Service area : 88,400 ha
Chico Diversion WeirLocation Bo. Ngipen, TabukCompletion date December-83Purpose IrrigationWeir
Type : Ogee type concrete weirDirect height : 3.65- 7.0m Crest length : 759 m Crest elevation : 204.50 EL mProbable afflux elevation : 207.55 EL m
Scouring sluiceSluice gate : 2 sets
SluicewayLeft sluiceway : 4 bays with 2 steel gate(2.5×3.8m)Right sluiceway : 1 bay with 2 steel gate(2.06×1.32m)
SiphonLength : 733 mDiameter of conduit : 3-3.8 m
Service area : 17,600 haSource : NIA, Region II Office
Table 2.9.2 Principal Features of Magat Dam and Major Intake Weirs
T7

Magapit Amulung Iguig SolanaLocation Magapit Baculud Minanga SolanaCompletion date May-85 Jun-82 Sep-83 Dec-80Service Area (ha) 11,457 (H):1,371 (L): 801 776 2,780Water Requirement (cu.m/s) 21.081 (H):2.523 (L): 1.474 1.427 5.33Water Level (EL,m)
HWL 11.00 20.00 20.00 48.45 MWL (Wet season) 1.24 6.30 8.02 36.10 MWL (Dry season) 0.46 4.52 7.08 34.60 LWL 0.00 1.40 4.00 34.10
Pump Plant Type Numbers 4 (H): 3 (L): 1 3 4 Diameter of Suction Pipe (mm) 1,800 (H): 700 (L): 800 600 700 Diameter of Discharge Pipe (mm) 1,500 (H): 600 (L): 800 500 700 Suction Pipe Level (EL,m) 0.70[ 0.70] (H): 5.21[-2.37] (L): 5.21[-2.37] 7.46[ -0.12] 31.30[ 2.67] Discharge Pipe Level (EL,m) 14.00[14.00] (H): 23.00[15.42] (L): 17.00[ 9.42] 19.50[-11.92] 52.15[23.95] Actual Head (m) 13.30 (H): 17.79 (L): 11.79 12.04 16.80 Total Head (m) 14.60 13.70 18.50 Pump Capacity (cu.m/min/unit) 340 (H): 70.5 (L): 80.0 37.6 60
Note: 1. At Solana station, three pump plants will be added soon.
2. [ ] indicates assumed elevation in terms of mean sea leval
Source: NIA Region II Office
Table2.9.3 Principal Features of Irrigation Pump Stations along Cagayan Rive
Name of StationItem
Vertical mixed flow pump with volute casing
T8

Table 2.9.4 Principal Features of Major Bridges
River Name of Bridge
Bridge Type
Completion Year
No. of Span
Total Length (m)
Width(m) Remarks
Magapit
Suspension RC-I beamTrussRCDG
1980
1122
376.00 7.32
Buntun Truss Comp.I-beam
1968 85
1,098.00 7.32
Gamu Truss Comp.I-beam
1964 38
442.00 6.75
Naguilian Truss Comp.I-beam
2000 85
687.80 7.32
Dalibubon Continuous box culvert
- 30 210.00 5.60 ongoing
Jones PC 1982 22 154.00 3.34Itawes PC - 29 283.00 4.00 ongoingTuao PC 1984 6 42.00 4.00Calanan Truss - 5 - -Pinukpuk Truss - - - -
Dummon Dummon TrussRCDG
1945 12
89.14 6.10
Pared Pared I-beamDCRG
1946 28
226.32 7.32
Tuguegarao Pinacanauan RCDG 1992 8 303.84 6.70Pinacanauan San Pablo RCDG 1998 7 279.15 7.32
Arcon Truss 1946 3 121.14 6.20Minanga RCDG 1973 11 339.90 7.32
Siffu Siffu RCDG 1971 20 300.00 6.75Mallig Mallig RCDG 1974 14 210.00 6.75Ilagan Mallam PCDG 1996 10 487.84 9.52
Magat Truss 1978 - 274.00 12.00San Lorenzo PSDG 1996 - 483.90 7.32Batu PSDG - - 345.63 7.32
Abian Abian Comp.I-beam - 7 108.22 6.75Cupas Truss - 6 279.00 -Indiana PSCG - - 98.40 6.70Sta.Fe RCDG - 1 24.30 6.70Ganano Truss 1975 3 73.20 7.32Ipil Truss 1975 3 73.20 7.32Buluarte - - - - -Calao 1 Truss 1975 1 130.00 7.32Calao 2 RCDG - - - -
Source: DPWH Region II office
Sta.Fe
Ganano
Diaddi
Cagayan
Chico
Tumauini
Magat
T9

Table 3.1.1 Assumed Cost Disbursement(Unit: Mill. Pesos)
Item 1987 1988 1989 1990 1991 1992 1993 1994 1995 1996 1997 1998 1999 2000 2001 2002 2003 2004 2005 Total
I. MULTPURPOSE PROJECT1. Mallig Project 44.87 281.51 748.07 905.79 1,016.20 718.82 3,715.262. Siffu Project 31.72 158.58 264.31 338.31 264.31 1,057.233. Matuno Project 152.16 507.20 937.26 1,348.04 1,568.00 1,342.41 5,855.074. Alimit Project 61.10 305.57 509.28 651.87 509.28 2,037.10
Sub-Total 12,664.66II. FLOOD CONTROL PROJECT
1. Tuguegarao Dike 27.60 131.70 131.70 131.70 131.70 554.402. Magapit (Naasiping Left, NLL) 49.00 232.30 232.30 232.30 232.30 978.203. Bank Protection 53.30 53.90 53.90 53.90 53.90 53.90 53.90 53.90 53.90 53.90 53.90 53.90 53.90 53.90 53.90 53.90 53.90 53.90 969.604. Cabagan Dike 15.50 72.80 72.80 72.80 72.80 306.705. Magapit (Nassiping Right, NLR) 147.70 312.10 312.10 312.10 312.10 312.10 312.10 312.10 312.10 312.10 2,956.60
Sub-Total 5,765.50III. IRRIGATION PROJECT
1. Pinacanauan RIS 1.85 21.16 23.012. Dabubu RIP 5.54 46.81 46.72 99.073. Lulutan IP 7.80 88.29 87.85 183.944. Solana IS 2.92 35.10 35.10 73.125. Gappal IP 19.79 88.08 259.24 238.96 606.076. Ilagan IP 7.00 79.75 79.39 166.147. Tuguegarao IP 4.15 47.64 47.46 99.258. Alcala Amulung West IP 13.59 128.62 166.15 125.41 433.779. Bagao IS 21.23 85.97 182.51 161.27 450.9810. Dummon RIS 20.75 84.38 182.50 161.75 449.3811. Tumauini IS 20.74 178.93 178.73 378.4012. Zinundungan IEP 17.57 73.19 172.55 154.75 418.0613. Magat O & M Improvement 157.75 352.95 234.71 183.46 131.13 1,060.00
Sub-Total 4,441.19IV. HYDROPOWER
1. Ibulao 16.53 82.65 137.75 176.32 137.75 551.002. Tanudan 19.38 96.90 161.50 206.72 161.50 646.003. Diduyon 1,069.78 1,337.22 2,674.44 2,674.44 1,158.92 8,914.80
Sub-Total 10,111.80
Total 0.00 211.05 414.24 460.77 904.87 1,713.57 2,169.20 2,635.67 2,369.59 1,867.75 2,010.57 1,151.54 1,576.07 1,653.34 2,513.97 2,315.33 3,603.55 3,553.67 1,858.40 32,983.15
V. PROJECT COST BY SECTOR 0.001. Flood Control 0.00 53.30 53.90 90.62 291.87 552.21 612.35 618.26 383.32 217.10 468.15 585.53 683.36 751.82 610.56 366.00 366.00 366.00 366.00 7,436.352. Irrigation 0.00 157.75 360.34 369.43 559.38 948.74 1,031.64 1,188.56 1,065.94 540.95 477.20 251.98 460.85 484.13 412.86 404.61 489.67 441.94 289.61 9,935.583. Hydropower 0.00 0.00 0.00 10.72 53.62 212.62 525.21 828.85 920.33 1,109.70 1,065.22 314.03 431.86 417.39 1,490.55 1,544.72 2,747.88 2,745.73 1,202.79 15,621.22
T10

Table 4.3.1 Incremental Capital Output Ratio of Nation and Region 2: 1993-1998
Item 1993 1994 1995 1996 1997 1998 Average*2 Philippines 1. Capital Formation 164,125 176,388 184,667 206,854 230,662 204,279 192,539 2. Incremental Output 15,215 32,212 35,856 46,897 43,739 -4,785 34,784 3. ICOR 10.79 5.48 5.15 4.41 5.27 -42.69 5.54 4. Average of ICOR 5.5 Region 2 1. Capital Formation 2,593 5,880 5,131 6,265 6,276 6,136 5,229 2. Incremental Output 460 969 714 570 1,738 -1,073 890 3. ICOR 5.64 6.07 7.19 10.99 3.61 -5.72 5.88 4. Average of ICOR 5.9 Source: 1999 Philippine Statistical Year book, NSCB
Gross Regional Domestic Expenditure 1996-1998, July 2000, NSCB Note: *1 ICOR stands for Incremental Capital Output Ratio.
*2 An average of ICOR was estimated excluding 1998 values because the national economy suffered from the Asian crisis seriously.
Remark
In order to accelerate economic growth, the regional government has to increase production factors such as capital and labor, to increase productivity or to improve technology level. Since the labor force is in excess in developing countries, the government has to increase capital stock through investment on condition that the investment efficiency is constant. An economic growth is calculated as follows.
YI
ICORYG ×=
1)(
Where, G(Y) : Economic Growth (∆Y/Y) ICOR: Incremental capital-output ratio (∆K/∆Y = I/∆Y) I : Investment (=∆K) ∆Y : Increment of GRDP Y : GRDP
Thus, an increase of investment makes an economic growth in the region, since the ICOR is considered as constant during a certain period for the industrial structure keeps the same conditions. Incidentally, the smaller is the ICOR, the higher is the economic efficiency of investment, as shown in the formula above. On basis of the GRDE records as shown in the table above, the ICORs of Region 2 and the country were 5.9 and 5.5 respectively.
T11

Table 4.3.2 GRDP Projection at 1998 Constant Prices: 1998-2020
Actual Estimate Projection Growth Rate (%)Item 1998 2004 2005 2010 2020 2005 2010
*1 *2 - 2010 - 2020GRDP Under Medium Growth Scenario (Billion Pesos)1. Philippines 2,667.1 3,613.0 3,800.7 4,896.3 8,125.9 5.2 5.22. NCR 925.4 1,268.1 1,336.6 1,738.6 2,941.8 5.4 5.43. CAR 59.7 92.8 99.9 144.6 302.6 7.7 7.74. Region 2 *3 54.5 77.5 83.1 100.6 143.0 3.9 3.65. Other Regions 1,627.5 2,174.6 2,281.1 2,912.5 4,738.5 5.0 5.06. Philippines without NCR 1,741.7 2,344.8 2,464.1 3,157.7 5,184.1 5.1 5.17. Region 2
1) Low Scenario*3 54.5 77.5 83.1 100.6 143.0 3.9 3.62) High Scenario*4 54.5 77.5 83.1 126.6 268.3 8.8 7.8
GRDP per Capita (1000 Pesos)1. Philippines 36.5 43.8 45.1 53.3 77.0 3.4 3.72. NCR 92.5 114.2 118.4 144.6 225.9 4.1 4.63. CAR 44.6 61.0 64.3 85.0 154.5 5.7 6.24. Region 2 20.2 25.6 26.9 30.1 38.2 2.3 2.45. Other Regions 27.6 32.5 33.4 38.9 54.6 3.1 3.46. Philippines without NCR 29.6 32.8 33.8 39.6 56.1 3.2 3.57. Region 2
1) Low Scenario 20.2 25.6 26.9 30.1 38.2 2.3 2.42) High Scenario 20.2 25.6 26.9 37.9 71.7 7.1 6.6
Expected Capital Investment and GRDP in Region 2 (Billion Pesos)1. Low Scenario
ICOR = 5.9 5.9 5.9 5.9a. Incremental GDP (Billion Pesos) 5.2 5.6 2.6 5.5b. Required Basic Capital Formation 30.7 33.2 15.2 32.4
2. Special Projects for Region 2 8.8 15.5 20.0 33.3AFMA*5 0.5 0.6 0.7 1.2CEZA*5 1.2 1.3 1.6 2.7W/R Projects in M/P*6 - 1.3 1.6 2.7Ripple & Private Capital Formation 7.0 12.4 16.0 26.6Total Capital Formation 39.5 48.8 35.2 65.7
ICOR= 5.9 5.9 5.8 5.5Incremental GRDP 6.7 8.3 6.1 11.9GRDP 79.0 85.7 119.1 211.5 6.8 5.9GRDP per Capita (1000 Pesos) 26.1 27.8 35.7 56.1 5.1 4.6
ReferencePhilippines (Billion Pesos) ICOR = 5.5 5.5 5.5 5.5
a. Incremental GDP - 216.8 187.7 241.9 401.4b. Required Capital Formation 1,192.5 1,032.6 1,330.2 2,207.6
Note: *1 Actual values at current prices*2 Estimates in Medium-Term Development Plan 1999-2004*3 Estimates based on the past trend by NEDA Regional Office 2*4 Estimates by NEDA Regional Office 2. They include AFMA, CEZA and other economic development programs in addition to the ordinal investment programs.*5 The capital investment of special projects are assumed by means of trend projection. (Unit: Bil. Pesos)
Initial Investment **1 Growth Total ExpectedProjects 2000 2001 Rate Investment Total Invest-
**2 **3 ment**4AFMA 0.447 0.492 5.2% 16.3 28.6CEZA 0.108 1.063 5.2% 36.0 61.0**1 AFMA's investment 447 million pesos for Region 2 in 2000 was already appropriated by the central government. The investment of CEZA in 2000 was appropriated around 108.38 million pesos. In the following year, it was assumed to increase to 1.06 billion pesos, which is a minimum investment to attain the target public investment of 60 billion pesos by 2020. The total investment of CEZA is estimated at around 120 billion pesos including private investment.**2 The growth rates are assumed to be the same as the national economic growth rate, although they were expected as 10% by NEDA Regional Office 2 in the high scenario.**3 The total investment of the respective projects by the target year 2020.**4 The accumlated amount by 2020
*6 The minimum investment to attain the regional economic target of 56,100 pesos per capita in 2020. The total investment was estimated at around 30 billion pesos by 2020, accounting for 1/3 of the total amount, 90.6 billion pesos in the M/P.*7 ICOR was assumed to be improved to the national level due to improvement of regional economic environment.
T12

Table 5.2.1 Summary of Meteorological Record (1/2)
Rainfall (mm)
Station Period Jan Feb Mar Apr May Jun Jul Aug Sep Oct Nov Dec AmountAparri 1951-85 134.4 75.2 45.4 35.3 99.4 175.2 183.5 226.5 286.8 345.2 397.6 210.8 2,215.3APC, Iguig 1981-99 27.6 16.1 18.7 42.5 153.0 161.0 225.2 267.1 232.5 346.8 180.0 133.1 1,803.6Lal-lo 1972-84 125.0 56.1 29.5 55.5 162.3 145.9 171.2 275.0 197.7 310.3 349.1 197.2 2,074.8Bitag Grande 1975-80 85.5 21.0 28.9 27.4 212.6 118.3 313.0 199.9 548.7 214.2 286.3 141.2 2,197.0Tuao 1956-85 29.4 24.3 31.2 63.3 171.0 195.4 214.8 232.2 175.1 246.7 230.8 96.9 1,711.1Tuguegarao 1949-85 18.7 14.5 30.2 49.1 113.1 155.2 195.5 234.5 202.2 248.5 276.4 94.7 1,632.6Pinukpuk 1970-81 83.7 26.0 58.4 75.8 203.8 233.6 263.2 322.3 212.7 365.5 364.2 189.2 2,398.4Naneng 1956-85 38.3 28.1 51.4 72.9 208.0 271.8 285.4 337.8 288.7 298.2 299.2 94.9 2,274.7Guilguila 1963-80 122.7 56.1 61.7 77.0 215.4 321.8 329.1 284.7 312.9 318.5 375.9 237.2 2,713.0Lubuagan 1969-78 62.6 32.8 65.2 51.2 147.7 224.6 213.1 236.5 210.8 237.2 275.0 155.4 1,912.1Basao 1963-75 95.6 27.2 70.6 114.8 288.8 422.0 382.0 341.4 314.9 312.6 439.8 271.5 3,081.2Ilagan 1965-84 59.1 20.9 32.3 62.6 155.4 172.8 144.7 186.0 172.2 291.1 315.9 191.1 1,804.1Banga-an 1963-78 27.2 7.6 22.0 78.8 218.7 274.8 302.4 375.6 274.5 148.8 115.3 26.4 1,872.1Bontoc 1963-85 17.9 11.9 46.6 127.6 263.8 294.5 390.5 267.9 302.8 204.8 152.5 54.4 2,135.2Barlig 1963-85 134.4 41.0 92.9 95.2 309.7 402.6 394.7 411.6 372.1 407.8 499.5 326.3 3,487.8Bauko 1963-80 6.5 7.5 43.8 169.1 284.5 304.8 371.0 421.4 313.4 188.7 67.9 54.4 2,233.0Mt. Polis 1963-80 160.4 134.0 110.1 157.7 337.3 457.1 516.8 553.5 453.0 378.1 370.9 246.6 3,875.5Mt. Data 1950-78 27.2 25.0 74.6 187.9 357.0 413.5 619.4 563.3 465.2 296.3 220.4 78.2 3,328.0Lagawe 1968-82 176.0 88.5 65.2 190.1 171.3 265.0 362.0 319.9 341.4 331.6 394.3 146.3 2,851.6Nayon 1968-80 63.4 25.5 69.9 89.5 217.2 200.4 207.8 243.6 220.4 240.2 185.7 99.3 1,862.9Echague 1976-85 17.5 9.1 18.2 91.7 114.5 97.1 148.8 259.9 189.6 272.8 128.0 142.3 1,489.5Diadi 1968-71 54.2 16.3 49.9 54.4 173.0 239.2 275.8 192.4 211.4 399.6 280.0 153.3 2,099.5Barat 1968-80 23.8 10.1 35.8 90.0 226.7 224.8 271.4 323.1 302.7 337.8 156.4 104.9 2,107.5Consuelo 1956-85 33.5 18.0 44.0 70.9 221.5 252.6 380.4 331.0 325.5 263.9 211.8 60.5 2,213.6Gabong 1972-52 38.6 13.0 25.5 33.4 128.5 179.9 251.5 216.7 229.0 230.0 284.9 90.3 1,721.3Dakgan 1972-82 18.4 11.3 29.8 23.1 134.5 158.8 234.2 176.5 216.5 273.1 274.6 68.9 1,619.7Casiguran 1961-84 234.2 113.8 176.5 136.3 242.3 229.4 284.7 251.9 592.5 421.7 628.8 402.9 3,715.0Wacal 1980-85 36.8 19.6 112.2 160.7 174.1 107.5 255.5 201.4 183.2 259.9 141.4 50.4 1,702.7Banti 1980-85 33.7 12.4 17.9 71.4 102.7 86.6 133.0 169.9 224.6 177.9 78.9 34.7 1,143.7Dippadiw 1980-83 185.8 19.7 53.2 27.2 190.1 59.7 245.8 239.2 181.1 249.7 458.1 299.5 2,209.1San Francisco 1975-80 122.8 138.2 47.0 41.8 146.3 82.3 143.1 143.4 153.9 328.3 209.8 171.7 1,728.6NIA Cabarroguis 1982-85 54.2 7.7 52.0 95.5 170.3 185.8 96.0 187.8 124.2 159.2 121.0 117.5 1,371.2Hapid 1976-85 15.4 21.7 42.8 115.2 222.5 167.9 209.4 173.7 241.4 213.4 109.4 29.9 1,562.7Baretbet 1977-85 21.1 12.5 58.9 128.1 262.7 184.7 231.4 194.9 254.4 250.8 125.1 49.4 1,774.0Baligatan 1976-85 29.4 10.7 37.6 98.7 206.8 177.0 234.2 213.1 231.0 202.9 160.2 50.9 1,652.5Poblacion Lagawe 1976-85 44.9 37.5 62.7 117.9 240.1 183.3 284.8 267.4 230.1 250.7 136.3 64.3 1,920.0Sto. Domingo 1976-85 28.6 14.6 29.7 115.3 113.9 161.7 193.5 157.3 232.7 245.3 116.3 44.8 1,453.7Kasibu 1978-85 52.5 44.4 86.0 189.8 260.1 221.3 223.1 234.9 259.6 555.6 398.4 132.1 2,657.8Kamamasi 1978-85 183.1 55.5 111.5 158.7 279.0 187.7 325.4 216.4 401.2 521.3 505.7 306.7 3,252.2Alayan 1978-85 112.1 42.4 60.1 191.4 229.6 170.4 253.8 200.3 375.2 535.9 475.1 268.3 2,914.6Packet 1979-84 45.4 30.5 75.2 126.2 261.3 171.9 259.5 187.3 335.8 231.5 277.7 201.8 2,204.1
Mean air temperature (oC)
Station Period Jan Feb Mar Apr May Jun Jul Aug Sep Oct Nov Dec MeanAparri 1951-85 23.1 23.8 25.3 27.1 28.3 28.5 28.3 27.9 27.6 26.8 25.4 23.8 26.3Tuguegarao 1951-83 23.1 24.1 26.1 28.2 29.0 28.6 28.0 27.7 27.3 26.3 24.8 23.5 26.4Echague 1981-84 21.5 22.7 24.5 26.1 26.9 27.6 26.8 26.6 26.3 25.3 24.2 22.2 25.1
Mean maximum air temperature (oC)
Station Period Jan Feb Mar Apr May Jun Jul Aug Sep Oct Nov Dec MeanEchague 1980-97 27.1 29.4 32.3 34.5 34.9 34.4 33.2 33.3 32.2 31.5 29.5 27.2 31.6APC, Iguig 1981-99 28.1 29.8 32.9 35.3 36.5 35.7 34.5 33.9 33.2 31.2 29.6 27.6 32.4Aparri 1951-85 26.3 27.6 29.6 31.6 33.3 33.5 32.9 32.4 31.6 30.2 28.3 26.8 30.3Tuguegarao 1951-83 29.2 31.2 33.8 35.9 36.8 35.7 34.9 34.2 33.6 32.2 30.1 28.8 33.0Malasin 1976-80 27.2 27.4 30.2 32.8 32.9 31.9 31.5 31.3 30.9 29.0 27.0 26.0 29.8San Isidro 1976-80 27.3 28.2 30.6 33.1 33.0 31.9 31.7 31.6 31.3 29.2 27.3 26.2 30.1Lagawe 1981-84 29.1 29.0 28.9 28.8 29.7 30.2 29.7 29.9 29.7 29.7 29.6 28.4 29.4Hapid 1981-84 23.7 24.6 25.7 27.3 28.5 28.2 27.7 26.8 28.2 26.7 25.5 23.0 26.3Baretbet 1981-84 26.1 28.2 31.2 31.0 30.1 29.9 29.1 28.8 29.8 28.4 27.8 25.9 28.9Consuelo 1981-84 25.5 28.7 30.3 30.9 31.7 31.1 29.2 27.6 28.6 27.4 27.1 24.8 28.6Sto Domingo 1981-84 27.7 29.1 28.9 31.0 32.2 32.7 31.9 30.1 30.0 29.4 30.1 27.2 30.0
T13

Table 5.2.1 Summary of Meteorological Record (2/2)
Mean minimum air temperature (oC)
Station Period Jan Feb Mar Apr May Jun Jul Aug Sep Oct Nov Dec MeanEchague 1980-97 19.8 20.1 20.6 22.7 23.7 24.0 23.6 23.7 23.4 22.9 22.0 19.0 22.1APC, Iguig 1981-99 20.0 20.2 21.3 23.0 24.1 24.5 24.0 24.2 23.8 23.1 22.2 20.4 22.6Aparri 1961-99 20.4 20.6 22.0 23.5 24.4 24.8 24.7 24.5 24.2 23.7 22.8 21.2 23.1Tuguegarao 1951-83 19.3 19.4 20.9 22.6 23.7 23.8 23.6 23.6 23.3 22.5 21.6 20.3 22.1Malasin 1976-80 21.8 21.9 23.6 24.6 24.8 25.3 25.1 25.3 25.4 24.7 23.2 22.3 24.0San Isidro 1976-80 21.3 21.1 23.0 24.9 25.4 25.7 25.6 25.5 24.6 24.1 22.8 21.6 23.8Lagawe 1981-84 20.5 19.0 22.0 21.7 21.2 22.1 20.6 21.8 21.5 21.8 22.0 21.1 21.3Hapid 1981-84 21.2 20.5 21.1 22.7 23.3 24.1 23.8 23.2 23.0 23.4 22.0 20.5 22.4Baretbet 1981-84 21.7 23.1 23.3 24.3 24.5 24.4 24.2 24.8 25.0 24.0 23.8 22.5 23.8Consuelo 1981-84 20.4 21.5 23.7 24.2 25.4 25.2 24.0 23.4 23.6 22.9 22.0 21.1 23.1Sto Domingo 1981-84 19.6 20.1 19.5 20.2 22.2 22.0 21.2 20.4 20.1 18.7 19.1 18.9 20.2
Relative humidity (%)
Station Period Jan Feb Mar Apr May Jun Jul Aug Sep Oct Nov Dec MeanAPC, Iguig 1983-97 89 88 82 79 78 82 84 85 86 88 89 90 85Aparri 1951-85 85 83 82 81 80 80 81 83 84 84 86 87 83Tuguegarao 1949-99 80 76 73 69 69 72 74 76 77 79 82 82 76Echague 1981-84 88 86 81 79 83 84 84 87 86 85 90 92 85Malasin 1976-80 85 81 78 70 72 80 81 80 85 83 88 86 81San Isidro 1976-80 86 82 78 74 73 80 82 81 83 86 90 88 82
Daily evaporation, A-pan (mm)
Station Period Jan Feb Mar Apr May Jun Jul Aug Sep Oct Nov Dec MeanAPC, Iguig 1980-99 2.8 4.1 5.8 6.6 6.5 6.0 5.1 4.7 4.3 3.5 2.7 2.3 4.5Tuguegarao 1974-91 2.6 3.9 5.0 5.8 5.7 5.1 4.8 4.0 3.4 3.2 2.6 2.1 4.0Alimano reservoir 1957-67 4.9 5.5 6.6 7.8 7.5 6.4 6.0 5.5 5.8 5.3 4.5 4.4 5.9Talictic (Baligatan) 1957-84 3.7 4.6 6.0 7.3 7.1 6.1 5.6 5.1 5.1 4.6 3.7 3.3 5.2Bontoc 1969-74 3.9 4.4 4.2 4.3 3.0 3.5 2.5 3.1 3.6 3.2 2.9 3.0 3.5Echague 1977-97 2.6 3.2 5.0 5.3 5.3 4.8 4.8 4.1 3.9 3.4 2.5 2.3 3.9Lagawe 1980-82 3.9 3.7 4.3 5.4 5.7 4.8 4.9 5.7 4.9 6.4 5.5 3.9 4.9Consuelo 1980-84 3.5 4.6 5.2 6.0 6.1 5.4 5.1 3.7 4.7 3.3 3.3 3.1 4.5Sto Domingo 1979-84 4.3 5.3 6.3 7.3 6.3 6.4 5.8 5.6 6.0 5.3 4.7 4.7 5.7Baretbet 1980-84 3.4 3.3 5.7 6.2 6.2 5.8 5.6 5.3 5.0 4.3 3.6 3.2 4.8Wacal 1980-84 3.0 4.2 5.2 5.6 5.8 6.6 5.7 5.4 4.8 4.7 3.5 3.0 4.8Malasin 1976-80 3.5 4.4 6.2 8.3 7.5 6.2 6.0 5.5 4.3 3.8 3.1 2.6 5.1San Isidro 1976-80 3.5 4.4 5.8 7.3 7.1 6.4 6.1 5.4 4.9 3.8 3.1 2.6 5.0
Wind speed (km/hr)
Station Period Jan Feb Mar Apr May Jun Jul Aug Sep Oct Nov Dec MeanAparri 1951-85 12.0 10.0 10.0 10.0 8.0 8.0 9.0 8.0 8.0 11.0 14.0 12.0 10.0APC, Iguig 1983-96 8.0 8.0 8.8 8.1 8.0 7.6 7.7 5.9 6.2 7.6 7.8 7.7 7.6Tuguegarao 1958-99 5.4 5.0 5.7 6.4 5.7 5.8 5.5 4.5 4.5 5.9 5.4 5.6 5.5
Daily sunshine duration (hr)
Station Period Jan Feb Mar Apr May Jun Jul Aug Sep Oct Nov Dec MeanTuguegarao 1978-99 4.3 5.9 7.1 7.8 7.4 7.3 6.6 5.7 5.6 4.8 3.8 3.1 5.8Echague 1981-97 3.3 5.0 6.2 6.9 7.0 6.5 6.0 5.2 5.1 4.2 3.4 2.5 5.1
Mean Monthly Atmospheric Pressure (hpa)
Station Period Jan Feb Mar Apr May Jun Jul Aug Sep Oct Nov Dec MeanTuguegarao 1984-99 1,008 1,001 1,004 1,002 1,002 1,000 1,004 1,001 1,007 1,000 1,001 1,008 1,003APC, Iguig 1984-99 1,017 1,018 1,017 1,013 1,011 1,009 1,009 1,008 1,009 1,012 1,014 1,017 1,013
T14

Table 5.2.2 Storm Records in the Cagayan River Basin
Hourly RainfallCode Name Period Availability Peak (m3/s) Availability
(1) Magat damsite (C.A. = 4,143 km2)T6718 Welming Nov. 1 - 5 '67 x 8,281 xT6811 Nitang Sep. 24 - 29 '68 x 1,790 xT6905 Elang Jul. 24 - 27 '69 x 1,242 xT7013 Pitang Sep. 8 - 12 '70 x 9,540 xT7311 Narsing Oct. 12 - 16 '73 x 6,128 xT7416 Tering Oct. 14 - 17 '74 x 5,658 xT7604 Didang May 15 - 26 '76 x 4,900 xT7717 Uding Nov. 10 - 17 '77 x 1,449 oT7810 MIDING Aug. 23 - 26 '78 o 3,060 oT7818 WELING Sep. 26 - 30 '78 o 3,100 oT7822 Kading Oct. 25 - 27 '78 o 7,906 oTS7922 Krising Dec. 21 - 24 '79 o 2,537 xT8011 Nitang Jul. 18 - 22 '80 x 3,101 oT8012 Osang Jul. 22 - 27 '80 o 1,650 xTS8019 Yoning Oct. 28 - 30 '80 x 3,297 oT8020 Aring Nov. 1 -7 '80 o 7,637 oTS8105 Elang Jul. 3 - 5 '81 o 3,996 oT8120 Anding Nov. 21 - 27 '81 o 5,440 oTS8410 Maring Aug. 28 - Sept. 5 '84 o 2,140 oTD8415 Seniang Oct. 28 - Nov. 3 '84 o 4,440 oTS8510 Miling Sept. 2 - 11 '85 o 3,192 oT8516 Tasing Oct. 18 - 26 '85 o 6,300 o
Reming 29-Oct-84 x 4,259 xSaling 19-Oct-85 x 7,634 xRuping 20-Oct-86 x 1,706 xWeling 11-Nov-86 x 2,154 xToyang 21-Oct-88 x 5,293 xYoning 8-Nov-88 x 2,678 xTasing 19-Oct-89 x 8,671 xPasing 16-Oct-90 x 2,349 xMaring 21-Sep-92 o 2,444 oKadiang 5-Oct-93 o 8,527 oHusing 2-Nov-93 o 7,079 oMonang 7-Dec-93 x 784 oOneng 16-Dec-93 x 1,326 oMameng 1-Oct-95 o 5,713 oNeneng Oct 8-12, '95 x 2,567 oRosing Nov. 3-8, '95 o 5,918 oMonsoon Dec. 24-28, 1995 o 3,442 oUlpiang 14-Nov-96 x 1,005 xIliang 15-Oct-98 o 2,797 oLoleng 24-Oct-98 o 6,976 oNorming 12-Dec-98 x 843 o
(2) Matuno damiste (C.A. = 550 km2)T8011 Nitang Jul. 18 - 22 '80 o 852 o 2 hrs. rainfall
(3) Palattao G/S (C.A. = 6,626 km2)Nov. 22 - 23 '61 o 5,978 xNov. 6 - 7 '62 o 4,786 xJun. 27 - 28 '63 o 3,290 x
(4) Cabulay G/S (C.A. = 196 km2)Sept. 18 - 19 '65 o 105 x
(5) Ibulao G/S (C.A. = 606 km2)Sept. 23 - '71 o 445 x
(6) Gabong G/S (C.A. = 586 km2)Jul. 19 - 25 '80 o 441 x
RemarksFlood HydrographTropical Cyclone/Monsoon Rain
T15

Unit: mmBasin 1/2* 1/5 1/10 1/25 1/50 1/100 1/200 1/1000 1/10000
Casecnan 133 209 277 360 440 520 600 820 1,200Cagayan No. 2 122 200 270 360 420 505 590 800 1,100Cagayan No. 1 116 184 247 330 400 470 550 780 1,080Diduyon 127 201 268 360 430 520 700 850 1,300Addalam (A) 102 156 201 271 333 405 488 733 1,261Matuno No. 1 117 152 174 202 222 242 261 307 373Alimit No. 1 (A) 100 141 168 203 230 257 284 349 450Magat 89 119 139 158 164 200 218 261 324Ilagan No. 1 132 186 223 273 312 352 394 498 669Disabungan 141 206 254 319 371 426 484 633 887Siffu No. 1 (A) 81 123 153 194 226 259 293 379 519Mallig No. 2 90 141 180 234 277 324 375 507 741Chico No. 2 131 190 237 303 359 421 489 677 1,036Chico No. 4 110 160 195 240 275 311 348 439 581Pinukpuk 104 155 191 238 275 312 351 448 603Base Point No. 1 157 205 236 274 302 329Base Point No. 2 158 212 246 289 321 352Base Point No. 3 164 221 258 304 338 372Base Point No. 4 169 233 277 333 376 420Base Point No. 5 178 250 303 373 430 489Base Point No. 6 173 231 269 317 352 386Base Point No. 7 167 223 260 305 338 371Base Point No. 8 188 255 298 354 395 436Base Point No. 9 162 221 261 311 349 388
Note: *1: Probability
1 - D
ay R
ainf
all
4 - D
ay R
ainf
all
Table 5.3.1 Probable Rainfall in the Base Point Basin
T16

Table 5.5.1 Projected Source Water Requirement by Municipality (1/2)
Province Municipality water req't population water req't population water req't population water req't population water req't population(m3/day) (capita) (m3/day) (capita) (m3/day) (capita) (m3/day) (capita) (m3/day) (capita)
Quirino Aglipay 764 9,714 977 11,009 1,180 12,276 1,585 13,437 2,137 14,515 Quirino Cabarroguis 1,234 10,967 1,598 12,430 1,993 13,860 2,973 15,170 4,224 16,388 Quirino Diffun 1,986 17,330 2,691 19,642 3,545 21,901 5,750 23,973 8,852 25,897 Quirino Maddela 1,298 13,771 1,716 15,608 2,182 17,404 3,290 19,050 4,844 20,579 Quirino Saguday 1,848 5,240 2,741 5,939 4,035 6,622 7,702 7,249 11,589 7,831 Aurora Casigran 174 2,644 211 2,958 235 3,246 257 3,530 281 3,785 Aurora Dilasag 270 4,089 327 4,574 362 5,020 398 5,459 435 5,854 Aurora Danalongan 76 1,148 93 1,285 103 1,410 113 1,533 122 1,644 Aurora Dipaculao 144 2,185 175 2,445 194 2,683 213 2,918 232 3,128 Block 1 Total 7,794 67,087 10,528 75,890 13,828 84,422 22,283 92,319 32,715 99,621 N. Vizcaya Ambagio 702 10,635 841 11,766 928 12,836 1,007 13,777 1,081 14,595 N. Vizcaya Aritao 3,356 32,686 4,431 36,163 5,686 39,451 8,910 42,341 13,262 44,855 N. Vizcaya Dupax del Norte 2,405 24,827 3,145 27,468 3,979 29,966 6,072 32,161 8,884 34,070 N. Vizcaya Dupax del Sur 951 14,437 1,142 15,972 1,260 17,425 1,366 18,701 1,468 19,811 N. Vizcaya Kayapa 598 9,067 717 10,031 791 10,944 857 11,745 922 12,443 N. Vizcaya Santa Fe 918 6,934 1,236 7,671 1,626 8,369 2,680 8,982 4,025 9,515 N. Vizcaya Alfonso Castañeda 115 1,745 138 1,931 151 2,106 165 2,261 177 2,395 Block 2 Total 9,043 100,332 11,649 111,002 14,423 121,097 21,056 129,969 29,820 137,684 N. Vizcaya Bagabag 3,794 31,709 5,224 35,081 7,087 38,271 12,154 41,075 19,309 43,513 N. Vizcaya Bambang 5,646 41,459 7,752 45,868 10,487 53,706 18,013 59,491 28,268 56,894 N. Vizcaya Bayombong 8,916 51,932 12,509 57,455 17,382 67,272 31,191 74,518 49,113 71,265 N. Vizcaya Diadi 1,301 13,981 1,626 15,468 1,939 18,111 2,660 20,062 3,516 19,186 N. Vizcaya Lasib 1,940 29,436 2,327 32,566 2,569 35,528 2,784 38,131 2,994 40,394 N. Vizcaya Quezon 1,031 15,635 1,236 17,298 1,365 18,871 1,478 20,253 1,591 21,456 N. Vizcaya Solano 6,123 52,639 8,285 58,236 10,990 63,533 18,234 68,187 28,187 72,235 N. Vizcaya Villaverde 993 15,060 1,191 16,661 1,314 18,177 1,423 19,508 1,532 20,666 Block 3 Total 29,745 251,851 40,151 278,634 53,131 313,468 87,938 341,225 134,511 345,610 Isabela Echague 6,130 62,963 8,038 69,350 10,202 75,050 15,682 79,675 23,009 83,417 Isabela Jones 3,664 38,897 4,817 42,843 6,135 46,364 9,466 49,221 14,023 51,533 Isabela San Agustin 1,676 20,039 2,106 22,072 2,511 23,886 3,408 25,358 4,533 26,549 Isabela San Isidro 1,187 17,999 1,416 19,825 1,551 21,455 1,664 22,777 1,768 23,847 Block 4 Total 12,657 139,898 16,378 154,090 20,400 166,755 30,220 177,031 43,332 185,346 Isabela Cordon 2,517 34,176 3,069 37,643 3,490 40,737 4,210 43,247 5,046 45,278 Isabela Ramon 3,875 40,261 4,910 44,345 1,883 47,990 8,497 50,948 11,554 53,341 Isabela Santiago 13,154 110,559 17,415 121,775 22,447 131,784 35,847 139,905 53,014 146,476 Block 5 Total 19,546 184,996 25,393 203,763 27,820 220,510 48,554 234,099 69,615 245,095 Isabela Alicia 6,670 59,088 8,547 65,083 10,578 70,432 15,843 74,772 22,168 78,284 Isabela Angadanan 3,559 37,187 4,586 40,959 5,687 44,326 8,403 47,057 11,882 49,268 Isabela San Guillermo 1,936 14,031 2,598 15,454 3,413 16,725 5,653 17,755 8,519 18,589 Block 6 Total 12,164 110,307 15,731 121,497 19,678 131,483 29,899 139,585 42,568 146,142 Isabela Benito Solive 2,593 23,207 3,400 25,562 4,323 27,663 6,734 29,367 9,801 30,747 Isabela Dinapigui 116 1,764 137 1,943 148 2,102 167 2,232 177 2,337 Isabela Divilican 135 2,036 161 2,243 175 2,427 188 2,577 201 2,698 Isabela Ilagan 12,213 105,971 16,123 116,721 20,653 126,315 32,534 134,099 47,504 140,398 Isabela Palanan 293 4,429 347 4,879 381 5,280 411 5,605 436 5,868 Isabela San Mariano 4,738 39,095 6,208 43,061 7,892 46,601 12,355 49,472 17,846 51,796 Block 7 Total 20,088 176,504 26,375 194,409 33,572 210,388 52,389 223,353 75,965 233,844 Isabela Cauayan 11,836 103,979 15,359 114,527 19,302 123,940 29,600 131,578 42,332 137,758 Isabela Naguilian 3,750 27,227 5,189 29,989 7,066 32,454 12,257 34,454 19,279 36,073 Isabela Reinal Mercedes 2,640 19,989 3,544 22,016 4,657 23,826 7,688 25,294 11,599 26,482 Block 8 Total 18,226 151,195 24,093 166,533 31,025 180,220 49,544 191,326 73,210 200,313 Isabela Aurora 2,851 29,603 3,660 32,606 4,513 35,286 6,614 37,460 9,264 39,220 Isabela Burgos 1,410 21,375 1,683 23,544 1,842 25,479 1,974 27,049 2,099 28,320 Isabela Cabatuan 2,543 31,918 3,173 35,156 3,744 38,046 4,944 40,390 6,456 42,288 Isabela Luna 1,644 14,871 2,143 16,380 2,717 17,726 4,210 18,819 6,110 19,703 Isabela San manuel 3,943 28,640 5,198 31,545 6,687 34,138 10,761 36,242 15,791 37,944 Isabela San mateo 5,743 54,819 7,464 60,381 9,374 65,343 14,258 69,370 20,453 72,629 Block 9 Total 18,133 181,227 23,321 199,612 28,877 216,018 42,760 229,330 60,173 240,102 Ifugao Banaue 3,357 37,106 2,627 41,024 3,179 44,797 4,476 48,283 6,091 51,429 Ifugao Hunguduan 1,420 21,516 1,701 23,788 1,877 25,976 2,044 27,997 2,210 29,822 Ifugao Kiangan 1,222 15,133 1,521 16,730 1,795 18,269 2,370 19,691 3,082 20,974 Ifugao Lagawe 1,884 16,682 2,463 18,444 3,136 20,140 4,905 21,707 7,176 23,122 Ifugao Lamut 1,955 19,127 2,505 21,146 3,101 23,091 4,602 24,888 6,478 26,510 Ifugao Mayoyao 2,027 27,655 2,495 30,575 2,886 33,387 3,596 35,985 4,484 38,330 Ifugao Potia 1,998 30,296 2,393 33,495 2,645 36,576 2,879 39,422 3,111 41,991 Block 10 Total 13,863 167,515 15,705 185,203 18,619 202,236 24,872 217,973 32,632 232,179 Mt. Province Barlig 540 8,194 635 8,897 691 9,571 743 10,190 795 10,732 Mt. Province Bauko 1,067 16,182 1,257 17,571 1,366 18,902 1,469 20,123 1,571 21,195 Mt. Province Bontoc 2,548 22,355 3,291 24,273 4,163 26,111 6,531 27,799 9,593 29,279 Mt. Province Natonin 650 9,860 765 10,706 833 11,517 896 12,261 957 12,914 Mt. Province Paraceles 1,149 17,405 1,350 18,899 1,469 20,330 1,580 21,644 1,690 22,797 Mt. Province Sabangan 622 9,435 732 10,244 797 11,020 857 11,732 916 12,357 Mt. Province Sadanga 381 5,781 448 6,277 488 6,752 525 7,189 561 7,572 Mt. Province Sagada 522 7,931 616 8,611 669 9,263 720 9,862 770 10,387 Block 11 7,478 97,143 9,094 105,478 10,476 113,466 13,323 120,801 16,853 127,233 Isabela Gamu 3,070 25,541 4,023 28,132 5,126 30,444 8,052 32,320 11,712 33,839 Isabela Mallig 3,430 26,191 4,575 28,848 5,964 31,219 9,736 33,143 14,550 34,699 Isabela Quezon 2,850 19,765 3,840 21,770 5,072 23,560 8,477 25,012 12,827 26,186 Isabela Quirino 1,355 20,554 1,619 22,639 1,771 24,500 1,898 26,010 2,019 27,231 Isabela Roxas 6,942 50,697 9,313 55,840 12,230 60,430 20,218 64,154 30,437 67,167 Block 12 Total 17,647 142,749 23,370 157,230 30,162 170,153 48,381 180,638 71,545 189,123
20202000 2005 2010 2015
T17

Table 5.5.1 Projected Source Water Requirement by Municipality (2/2)
Province Municipality water req't population water req't population water req't population water req't population water req't population(m3/day) (capita) (m3/day) (capita) (m3/day) (capita) (m3/day) (capita) (m3/day) (capita)
20202000 2005 2010 2015
Isabela Magsaysay 1,935 24,471 2,405 26,953 2,817 29,169 3,666 30,966 4,712 32,421 Isabela Santo Tomas 2,020 22,539 2,611 24,825 3,246 26,866 4,783 28,521 6,837 29,861 Isabela Tumauini 4,180 51,106 5,220 56,290 6,170 60,917 8,214 64,671 10,744 67,709 Block 13 Total 8,135 98,115 10,236 108,069 12,233 116,951 16,663 124,158 22,292 129,990 Isabela Cabagan 3,058 39,329 3,801 43,318 4,455 46,879 5,790 49,768 7,468 52,105 Isabela Maconacon 202 3,057 241 3,367 263 3,644 282 3,868 300 4,050 Isabela San Pablo 857 12,984 1,022 14,301 1,119 15,476 1,200 16,430 1,275 17,202 Isabela Santa Maria 1,439 21,835 1,720 24,050 1,881 26,027 2,017 27,631 2,144 28,929 Block 14 Total 5,557 77,205 6,783 85,037 7,719 92,026 9,290 97,697 11,187 102,286 K. Apayao Lubuagan 1,567 10,994 2,210 12,022 3,087 12,929 5,570 13,654 9,070 14,238 K. Apayao Pasil 654 9,925 776 10,853 843 11,672 900 12,327 953 12,854 K. Apayao Rizal 892 13,522 1,057 14,787 1,150 15,902 1,226 16,794 1,298 17,513 K. Apayao Tabuk 9,927 70,546 13,653 77,143 18,531 82,960 32,195 87,614 50,716 91,364 K. Apayao Tanudan 822 12,489 975 13,657 1,063 14,687 1,133 15,511 1,199 16,175 K. Apayao Tinglayan 996 15,097 1,180 16,509 1,283 17,754 1,369 18,750 1,450 19,553 Block 15 Total 14,859 132,574 19,850 144,971 25,957 155,903 42,392 164,650 64,686 171,696 K. Apayao Balbaran 860 13,043 1,019 14,263 1,109 15,339 1,182 16,199 1,253 16,893 K. Apayao Conner 1,086 15,011 1,265 16,453 1,349 17,696 1,418 18,660 1,478 19,414 K. Apayao Flora 41 632 50 693 54 745 57 786 61 818 K. Apayao Kabugao 39 601 48 659 52 708 54 747 58 777 K. Apayao Pinukpuk 1,688 25,613 2,002 28,008 2,177 30,120 2,323 31,809 2,459 33,171 Block 16 Total 3,714 54,900 4,383 60,075 4,741 64,609 5,034 68,202 5,308 71,072 Cagayan Tuguegarao 17,569 117,656 22,749 127,378 28,971 136,414 46,632 144,284 67,915 150,773 Block 17 Total 17,569 117,656 22,749 127,378 28,971 136,414 46,632 144,284 67,915 150,773 Cagayan Amulung 3,135 41,396 3,769 44,817 4,262 47,996 5,202 50,765 6,285 53,049 Cagayan Enrile 4,202 31,517 5,380 34,121 6,743 36,542 10,538 38,650 15,078 40,388 Cagayan Iguig 1,971 20,948 2,442 22,679 2,905 24,288 4,050 25,689 5,410 26,845 Cagayan Peñablance 1,558 23,621 1,828 25,573 1,979 27,387 2,114 28,967 2,243 30,270 Cagayan Solana 5,326 66,186 6,428 71,654 7,335 76,738 9,236 81,165 11,392 84,815 Block 18 Total 16,193 183,668 19,847 198,845 23,225 212,951 31,140 225,237 40,408 235,367 Cagayan Piat 1,892 19,163 2,333 20,746 2,767 22,218 3,859 23,500 5,121 24,557 Cagayan Rizal 1,005 15,246 1,179 16,506 1,278 17,677 1,365 18,697 1,449 19,538 Cagayan Santo Niño 1,967 18,697 2,470 20,241 3,002 21,677 4,385 22,928 6,036 23,959 Cagayan Tuao 4,124 54,054 4,949 58,521 5,586 62,672 6,807 66,288 8,189 69,269 Block 19 Total 8,989 107,160 10,931 116,014 12,633 124,244 16,416 131,412 20,795 137,323 Cagayan Alcala 3,416 35,135 4,273 38,038 5,152 40,737 7,370 43,087 10,053 45,025 Cagayan Allcapan 1,275 12,927 1,542 13,995 1,786 14,988 2,395 15,853 3,052 16,566 Cagayan Aparri 3,439 31,695 4,364 34,313 5,370 36,748 8,009 38,868 11,181 40,616 Cagayan Baggao 4,156 41,177 5,198 44,579 6,276 47,742 9,027 50,496 12,298 52,767 Cagayan Camalaniugan 2,258 18,241 2,891 19,748 3,616 21,149 5,592 22,369 7,969 23,375 Cagayan Gattaran 2,883 32,793 3,570 35,502 4,230 38,021 5,795 40,215 7,692 42,023 Cagayan Lal-lo 1,033 9,539 1,292 10,327 1,562 11,060 2,266 11,698 3,085 12,224 Cagayan Lasam 2,680 26,613 3,343 28,812 4,019 30,856 5,746 32,636 7,789 34,104 Block 20 Total 21,140 208,119 26,473 225,315 32,011 241,300 46,200 255,220 63,120 266,700 GRAND TOTAL (m^3/day) 282,540 2,844,176 363,039 3,125,557 449,500 3,383,886 684,985 3,603,526 978,651 3,787,934
T18

Table 5.5.2 Future Irrigation Water Demand (1/5, Year 2000)(unit: m3/s)
Name of System Area Code/Base Point No JAN FEB MAR APR MAY JUN JUL AUG SEP OCT NOV DEC
I. Upper Cagayan BasinCISs UC-3 0.52 0.64 0.70 0.40 0.37 1.28 1.38 0.73 0.85 0.25 0.00 0.24CIPs UC-3 0.00 0.00 0.00 0.00 0.00 0.00 0.00 0.00 0.00 0.00 0.00 0.00CISs UC-4 0.40 0.49 0.53 0.30 0.14 0.44 0.48 0.25 0.29 0.09 0.00 0.18CISs UC-5 0.15 0.19 0.20 0.12 0.11 0.37 0.40 0.21 0.25 0.07 0.00 0.07Addalam RIP outlet-5 0.00 0.00 0.00 0.00 0.00 0.00 0.00 0.00 0.00 0.00 0.00 0.00CISs UC-6B 0.47 0.54 0.72 0.38 0.38 1.27 1.90 1.36 1.12 0.26 0.00 0.19Dabubu IP 6 0.00 0.00 0.00 0.00 0.00 0.00 0.00 0.00 0.00 0.00 0.00 0.00CIPs UC-6 0.00 0.00 0.00 0.00 0.00 0.00 0.00 0.00 0.00 0.00 0.00 0.00CISs UC-7 0.85 0.99 1.31 0.70 0.70 2.30 3.44 2.47 2.04 0.48 0.00 0.35CIPs UC-7 0.00 0.00 0.00 0.00 0.00 0.00 0.00 0.00 0.00 0.00 0.00 0.00Gappal IS/IP 8 0.33 0.41 0.48 0.05 0.40 0.29 0.36 0.23 0.09 0.06 0.02 0.28CIPs UC-8B 0.00 0.00 0.00 0.00 0.00 0.00 0.00 0.00 0.00 0.00 0.00 0.00CIPs UC-9 0.00 0.00 0.00 0.00 0.00 0.00 0.00 0.00 0.00 0.00 0.00 0.00Lulutan IP 15 0.00 0.00 0.00 0.00 0.00 0.00 0.00 0.00 0.00 0.00 0.00 0.00Sub total 2.72 3.26 3.94 1.95 2.10 5.95 7.96 5.25 4.64 1.21 0.02 1.31
II. Magat BasinCISs M-1 8.52 10.50 11.80 6.87 2.96 9.47 10.52 8.03 7.63 2.61 0.00 3.91CIPs M-1 0.00 0.00 0.00 0.00 0.00 0.00 0.00 0.00 0.00 0.00 0.00 0.00Matuno (Manam.) 10 0.00 0.00 0.00 0.00 0.00 0.00 0.00 0.00 0.00 0.00 0.00 0.00Matuno (Bayom.) 11 0.00 0.00 0.00 0.00 0.00 0.00 0.00 0.00 0.00 0.00 0.00 0.00CISs M-2 0.12 0.15 0.17 0.10 0.05 0.19 0.25 0.19 0.19 0.05 0.00 0.06CISs M-3 11.54 20.21 16.66 9.19 4.86 16.73 22.00 20.17 14.59 4.94 0.00 5.47CIPs M-3 0.00 0.00 0.00 0.00 0.00 0.00 0.00 0.00 0.00 0.00 0.00 0.00Magat RIIS 13 64.03 72.07 14.56 31.68 100.36 70.42 86.44 37.03 0.00 0.00 45.28 36.50CISs M-4 1.12 1.36 1.66 1.03 0.55 1.83 2.42 2.08 1.70 0.56 0.00 0.51CISs M-5 0.06 0.08 0.10 0.06 0.03 0.10 0.13 0.11 0.09 0.03 0.00 0.03Sub total 85.39 104.37 44.95 48.93 108.81 98.74 121.76 67.61 24.20 8.19 45.28 46.48
III. Ilagan BasinIlagan IP 18 0.00 0.00 0.00 0.00 0.00 0.00 0.00 0.00 0.00 0.00 0.00 0.00Tumauini (Ila.) 18 0.00 0.00 0.00 0.00 0.00 0.00 0.00 0.00 0.00 0.00 0.00 0.00CISs I-3 0.06 0.07 0.09 0.05 0.05 0.17 0.25 0.18 0.15 0.03 0.00 0.03CISs I-4 0.18 0.21 0.28 0.15 0.15 0.49 0.73 0.52 0.43 0.10 0.00 0.07CIPs I-4 0.00 0.00 0.00 0.00 0.00 0.00 0.00 0.00 0.00 0.00 0.00 0.00Sub total 0.24 0.28 0.37 0.20 0.20 0.66 0.98 0.70 0.58 0.13 0.00 0.10
IV. Siffu, Mallig BasinCISs S-1 0.91 1.10 1.34 0.83 0.30 0.89 1.17 1.01 0.83 0.27 0.00 0.41Siffu RIS 29 13.68 15.97 16.70 5.50 5.22 14.90 16.90 8.22 7.42 4.79 3.43 11.79CISs S-3 0.12 0.15 0.18 0.11 0.07 0.22 0.28 0.25 0.21 0.07 0.00 0.05Mallig RIS 31 1.36 1.78 0.84 0.00 1.11 3.25 3.10 2.66 0.92 0.00 0.35 1.03CISs S-5 0.27 0.34 0.42 0.24 0.21 0.73 1.13 0.87 0.64 0.19 0.00 0.11CIPs S-5 0.00 0.00 0.00 0.00 0.00 0.00 0.00 0.00 0.00 0.00 0.00 0.00Sub total 16.34 19.34 19.48 6.68 6.91 19.99 22.58 13.01 10.02 5.32 3.78 13.39
V. Chico BasinCISs C-1 2.30 2.55 2.32 1.01 0.42 1.23 0.76 0.68 0.76 0.35 0.00 0.99CISs C-2 1.00 1.17 1.10 0.56 0.44 1.24 0.87 0.74 0.86 0.25 0.00 0.42CISs C-3 0.50 0.58 0.54 0.28 0.21 0.58 0.41 0.35 0.40 0.12 0.00 0.21Chico RIS 23 8.67 9.81 11.06 1.76 0.00 0.00 4.36 7.19 10.80 8.25 6.55 7.35Chico Mallig IP 30 0.00 0.00 0.00 0.00 0.00 0.00 0.00 0.00 0.00 0.00 0.00 0.00CISs C-4 0.44 0.52 0.63 0.37 0.25 0.87 1.17 0.88 0.72 0.21 0.00 0.18CISs C-5 0.50 0.59 0.71 0.42 0.28 0.99 1.34 1.01 0.83 0.24 0.00 0.20Chico RIS(West) 25 1.66 1.93 2.18 0.33 0.00 0.00 0.59 0.99 1.54 1.21 0.98 0.98CISs C-6 1.56 1.89 2.29 1.29 0.62 1.98 2.67 2.07 1.77 0.52 0.00 0.64CIPs C-6 0.00 0.00 0.00 0.00 0.00 0.00 0.00 0.00 0.00 0.00 0.00 0.00Sub total 16.63 19.04 20.83 6.02 2.22 6.89 12.17 13.91 17.68 11.15 7.53 10.97
VI. Lower Cagayan BasinCISs LC-1 0.13 0.16 0.20 0.12 0.10 0.35 0.54 0.42 0.31 0.09 0.00 0.05CIPs LC-1 0.00 0.00 0.00 0.00 0.00 0.00 0.00 0.00 0.00 0.00 0.00 0.00Tumauini IS 33 1.32 1.72 1.99 0.30 1.70 1.51 1.73 1.46 1.24 0.15 0.85 0.72S/Pab.Caba. IS 34 0.03 0.04 0.04 0.00 0.04 0.04 0.03 0.03 0.03 0.00 0.02 0.02Pinacanauan RIS 35 0.28 0.33 0.37 0.06 0.29 0.28 0.26 0.22 0.21 0.02 0.16 0.19CISs LC-5 1.12 1.33 1.60 0.94 0.81 2.99 4.03 3.03 2.49 0.72 0.00 0.46CIPs LC-5 0.00 0.00 0.00 0.00 0.00 0.00 0.00 0.00 0.00 0.00 0.00 0.00Tuguegarao PIS 36 0.13 0.19 0.21 0.05 0.10 0.08 0.10 0.06 0.04 0.03 0.02 0.09Solana PIS 37 1.10 1.33 1.49 0.23 0.00 0.00 0.00 0.00 0.00 0.00 0.65 0.75A/Amul.West PIP 37 0.00 0.00 0.00 0.00 0.00 0.00 0.00 0.00 0.00 0.00 0.00 0.00CISs LC-6 0.30 0.36 0.44 0.26 0.13 0.42 0.57 0.43 0.35 0.10 0.00 0.13CIPs LC-6 0.00 0.00 0.00 0.00 0.00 0.00 0.00 0.00 0.00 0.00 0.00 0.00IAAPIS(Iguig) 38 0.40 0.48 0.54 0.09 0.43 0.41 0.39 0.33 0.31 0.04 0.24 0.27CISs LC-7 0.34 0.40 0.49 0.29 0.14 0.47 0.64 0.48 0.39 0.11 0.00 0.14CIPs LC-7 0.00 0.00 0.00 0.00 0.00 0.00 0.00 0.00 0.00 0.00 0.00 0.00IAAPIS(A/Amulu) 39 1.15 1.38 1.55 0.24 1.16 1.13 1.09 0.90 0.85 0.10 0.68 0.78Baggao IS(Pared) 40 0.58 0.70 0.79 0.12 0.61 0.60 0.57 0.48 0.45 0.05 0.35 0.40Baggao IS(Paranan) 42 0.79 0.95 1.07 0.17 1.13 1.10 1.06 0.88 0.83 0.10 0.47 0.54CISs LC-10 1.38 1.63 1.97 1.16 0.58 1.93 2.61 1.96 1.61 0.47 0.00 0.56CIPs LC-10 0.00 0.00 0.00 0.00 0.00 0.00 0.00 0.00 0.00 0.00 0.00 0.00CISs LC-11 0.05 0.06 0.07 0.04 0.02 0.07 0.09 0.07 0.06 0.02 0.00 0.02Zinundungan RIS 44 2.46 3.07 3.47 0.51 2.51 2.34 2.32 2.00 1.96 0.24 1.57 1.64Zinun. Exten. 44 0.00 0.00 0.00 0.00 0.00 0.00 0.00 0.00 0.00 0.00 0.00 0.00Dummun RIS 46 1.04 1.64 2.01 0.33 1.75 1.65 1.71 1.41 1.04 0.12 0.82 0.64CIPs LC-12 0.00 0.00 0.00 0.00 0.00 0.00 0.00 0.00 0.00 0.00 0.00 0.00CISs LC-13 0.70 0.97 1.29 0.81 0.41 1.32 1.91 1.45 0.93 0.26 0.00 0.31CIPs LC-13 0.00 0.00 0.00 0.00 0.00 0.00 0.00 0.00 0.00 0.00 0.00 0.00Magapit PIS(L/Caga.) 47 0.05 0.08 0.10 0.02 0.38 0.36 0.37 0.30 0.23 0.03 0.04 0.03CISs LC-14 0.41 0.57 0.75 0.47 0.24 0.77 1.11 0.85 0.54 0.15 0.00 0.18CIPs LC-14 0.00 0.00 0.00 0.00 0.00 0.00 0.00 0.00 0.00 0.00 0.00 0.00Sub total 13.76 17.39 20.44 6.21 12.53 17.82 21.13 16.76 13.87 2.80 5.87 7.92
TOTAL 135.08 163.68 110.01 69.99 132.77 150.05 186.58 117.24 70.99 28.80 62.48 80.17Note: Updated based on the same titled table in the 1987 Master Plan
T19

Table 5.5.2 Future Irrigation Water Demand (2/5, Year 2005)(unit: m3/s)
Name of System Area Code/Base Point No JAN FEB MAR APR MAY JUN JUL AUG SEP OCT NOV DEC
I. Upper Cagayan BasinCISs UC-3 0.52 0.64 0.70 0.40 0.37 1.28 1.38 0.73 0.85 0.25 0.00 0.24CIPs UC-3 0.22 0.26 0.29 0.16 0.15 0.53 0.56 0.30 0.35 0.10 0.00 0.10CISs UC-4 0.40 0.49 0.53 0.30 0.14 0.44 0.48 0.25 0.29 0.09 0.00 0.18CISs UC-5 0.15 0.19 0.20 0.12 0.11 0.37 0.40 0.21 0.25 0.07 0.00 0.07Addalam RIP outlet-5 3.85 5.31 6.35 0.82 4.72 3.26 4.26 2.68 1.22 0.76 0.35 3.44CISs UC-6B 0.47 0.54 0.72 0.38 0.38 1.27 1.90 1.36 1.12 0.26 0.00 0.19Dabubu IP 6 - - - - - - - - - - - - CIPs UC-6 - - - - - - - - - - - - CISs UC-7 0.85 0.99 1.31 0.70 0.70 2.30 3.44 2.47 2.04 0.48 0.00 0.35CIPs UC-7 - - - - - - - - - - - - Gappal IS/IP 8 0.65 0.83 0.96 0.10 0.79 0.57 0.72 0.46 0.18 0.12 0.04 0.56CIPs UC-8B - - - - - - - - - - - - CIPs UC-9 - - - - - - - - - - - - Lulutan IP 15 - - - - - - - - - - - - Sub total 7.11 9.25 11.06 2.98 7.36 10.02 13.14 8.46 6.30 2.13 0.39 5.13
II. Magat BasinCISs M-1 8.52 10.50 11.80 6.87 2.96 9.47 10.52 8.03 7.63 2.61 0.00 3.91CIPs M-1 0.13 0.16 0.18 0.11 0.09 0.32 0.36 0.27 0.26 0.09 0.00 0.06Matuno (Manam.) 10 - - - - - - - - - - - - Matuno (Bayom.) 11 - - - - - - - - - - - - CISs M-2 0.12 0.15 0.17 0.10 0.05 0.19 0.25 0.19 0.19 0.05 0.00 0.06CISs M-3 11.54 20.21 16.66 9.19 4.86 16.73 22.00 20.17 14.59 4.94 0.00 5.47CIPs M-3 0.06 0.11 0.09 0.05 0.05 0.19 0.24 0.22 0.16 0.05 0.00 0.03Magat RIIS 13 115.96 116.85 82.95 54.86 109.23 96.74 140.02 72.93 40.51 29.47 48.09 89.46CISs M-4 1.12 1.36 1.66 1.03 0.55 1.83 2.42 2.08 1.70 0.56 0.00 0.51CISs M-5 0.06 0.08 0.10 0.06 0.03 0.10 0.13 0.11 0.09 0.03 0.00 0.03Sub total 137.51 149.42 113.61 72.27 117.82 125.57 175.94 104.00 65.13 37.80 48.09 99.53
III. Ilagan BasinIlagan IP 18 - - - - - - - - - - - - Tumauini (Ila.) 18 - - - - - - - - - - - - CISs I-3 0.06 0.07 0.09 0.05 0.05 0.17 0.25 0.18 0.15 0.03 0.00 0.03CISs I-4 0.18 0.21 0.28 0.15 0.15 0.49 0.73 0.52 0.43 0.10 0.00 0.07CIPs I-4 0.17 0.20 0.27 0.14 0.14 0.47 0.70 0.50 0.42 0.10 0.00 0.07Sub total 0.41 0.48 0.64 0.34 0.34 1.13 1.68 1.20 1.00 0.23 0.00 0.17
IV. Siffu, Mallig BasinCISs S-1 0.91 1.10 1.34 0.83 0.30 0.89 1.17 1.01 0.83 0.27 0.00 0.41Siffu RIS 29 13.68 15.97 16.70 5.50 5.22 14.90 16.90 8.22 7.42 4.79 3.43 11.79CISs S-3 0.12 0.15 0.18 0.11 0.07 0.22 0.28 0.25 0.21 0.07 0.00 0.05Mallig RIS 31 1.36 1.78 0.84 0.00 1.11 3.25 3.10 2.66 0.92 0.00 0.35 1.03CISs S-5 0.27 0.34 0.42 0.24 0.21 0.73 1.13 0.87 0.64 0.19 0.00 0.11CIPs S-5 0.19 0.23 0.29 0.17 0.15 0.51 0.79 0.61 0.45 0.13 0.00 0.07Sub total 16.53 19.57 19.77 6.85 7.06 20.50 23.37 13.62 10.47 5.45 3.78 13.46
V. Chico BasinCISs C-1 2.30 2.55 2.32 1.01 0.42 1.23 0.76 0.68 0.76 0.35 0.00 0.99CISs C-2 1.00 1.17 1.10 0.56 0.44 1.24 0.87 0.74 0.86 0.25 0.00 0.42CISs C-3 0.50 0.58 0.54 0.28 0.21 0.58 0.41 0.35 0.40 0.12 0.00 0.21Chico RIS 23 22.41 26.99 12.33 0.00 8.22 25.71 21.13 17.93 6.83 0.00 5.24 19.06Chico Mallig IP 30 - - - - - - - - - - - - CISs C-4 0.44 0.52 0.63 0.37 0.25 0.87 1.17 0.88 0.72 0.21 0.00 0.18CISs C-5 0.50 0.59 0.71 0.42 0.28 0.99 1.34 1.01 0.83 0.24 0.00 0.20Chico RIS(West) 25 2.27 2.82 1.30 0.00 0.83 2.50 2.07 1.82 0.72 0.00 0.56 1.93CISs C-6 1.56 1.89 2.29 1.29 0.62 1.98 2.67 2.07 1.77 0.52 0.00 0.64CIPs C-6 0.20 0.25 0.30 0.17 0.15 0.52 0.70 0.54 0.46 0.14 0.00 0.08Sub total 31.18 37.36 21.52 4.10 11.42 35.62 31.12 26.02 13.35 1.83 5.80 23.71
VI. Lower Cagayan BasinCISs LC-1 0.13 0.16 0.20 0.12 0.10 0.35 0.54 0.42 0.31 0.09 0.00 0.05CIPs LC-1 0.07 0.08 0.10 0.06 0.05 0.18 0.28 0.21 0.16 0.05 0.00 0.03Tumauini IS 33 1.32 1.72 1.99 0.30 1.70 1.51 1.73 1.46 1.24 0.15 0.85 0.72S/Pab.Caba. IS 34 0.81 0.98 0.45 0.00 0.59 1.86 1.53 1.30 0.49 0.00 0.19 0.69Pinacanauan RIS 35 1.15 1.31 1.31 0.11 1.17 1.14 1.10 0.71 0.23 0.19 0.08 0.89CISs LC-5 1.12 1.33 1.60 0.94 0.81 2.99 4.03 3.03 2.49 0.72 0.00 0.46CIPs LC-5 0.11 0.13 0.15 0.09 0.08 0.28 0.38 0.29 0.24 0.07 0.00 0.04Tuguegarao PIS 36 0.13 0.19 0.21 0.05 0.10 0.08 0.10 0.06 0.04 0.03 0.02 0.09Solana PIS 37 1.10 1.33 1.49 0.23 0.00 0.00 0.00 0.00 0.00 0.00 0.65 0.75A/Amul.West PIP 37 6.44 8.13 8.47 1.22 6.05 5.49 5.71 3.65 1.48 1.16 0.68 4.89CISs LC-6 0.30 0.36 0.44 0.26 0.13 0.42 0.57 0.43 0.35 0.10 0.00 0.13CIPs LC-6 - - - - - - - - - - - - IAAPIS(Iguig) 38 0.78 0.89 0.89 0.08 0.80 0.78 0.75 0.49 0.04 0.00 0.00 0.57CISs LC-7 0.34 0.40 0.49 0.29 0.14 0.47 0.64 0.48 0.39 0.11 0.00 0.14CIPs LC-7 - - - - - - - - - - - - IAAPIS(A/Amulu) 39 2.31 2.61 2.62 0.22 2.35 2.28 2.19 1.42 0.12 0.00 0.00 1.68Baggao IS(Pared) 40 0.58 0.70 0.79 0.12 0.61 0.60 0.57 0.48 0.45 0.05 0.35 0.40Baggao IS(Paranan) 42 0.79 0.95 1.07 0.17 1.13 1.10 1.06 0.88 0.83 0.10 0.47 0.54CISs LC-10 1.38 1.63 1.97 1.16 0.58 1.93 2.61 1.96 1.61 0.47 0.00 0.56CIPs LC-10 - - - - - - - - - - - - CISs LC-11 0.05 0.06 0.07 0.04 0.02 0.07 0.09 0.07 0.06 0.02 0.00 0.02Zinundungan RIS 44 2.57 3.00 3.03 0.24 2.56 2.38 2.36 1.58 0.14 0.00 0.00 1.89Zinun. Exten. 44 - - - - - - - - - - - - Dummun RIS 46 1.04 1.64 2.01 0.33 1.75 1.65 1.71 1.41 1.04 0.12 0.82 0.64CIPs LC-12 - - - - - - - - - - - - CISs LC-13 0.70 0.97 1.29 0.81 0.41 1.32 1.91 1.45 0.93 0.26 0.00 0.31CIPs LC-13 - - - - - - - - - - - - Magapit PIS(L/Caga.) 47 9.66 14.13 15.58 1.42 15.25 14.36 14.84 9.60 0.62 0.00 0.00 8.55CISs LC-14 0.41 0.57 0.75 0.47 0.24 0.77 1.11 0.85 0.54 0.15 0.00 0.18CIPs LC-14 - - - - - - - - - - - - Sub total 33.29 43.27 46.97 8.73 36.62 42.01 45.81 32.23 13.80 3.84 4.11 24.22
TOTAL 226.03 259.35 213.57 95.27 180.62 234.85 291.06 185.53 110.05 51.28 62.17 166.22Note: Updated based on the same titled table in the 1987 Master Plan
T20

Table 5.5.2 Future Irrigation Water Demand (3/5, Year 2010)(unit: m3/s)
Name of System Area Code/Base Point No JAN FEB MAR APR MAY JUN JUL AUG SEP OCT NOV DEC
I. Upper Cagayan BasinCISs UC-3 0.52 0.64 0.70 0.40 0.37 1.28 1.38 0.73 0.85 0.25 0.00 0.24CIPs UC-3 0.22 0.26 0.29 0.16 0.15 0.53 0.56 0.30 0.35 0.10 0.00 0.10CISs UC-4 0.40 0.49 0.53 0.30 0.14 0.44 0.48 0.25 0.29 0.09 0.00 0.18CISs UC-5 0.15 0.19 0.20 0.12 0.11 0.37 0.40 0.21 0.25 0.07 0.00 0.07Addalam RIP outlet-5 3.85 5.31 6.35 0.82 4.72 3.26 4.26 2.68 1.22 0.76 0.35 3.44CISs UC-6B 0.47 0.54 0.72 0.38 0.38 1.27 1.90 1.36 1.12 0.26 0.00 0.19Dabubu IP 6 0.66 0.91 1.09 0.14 0.81 0.56 0.73 0.46 0.21 0.13 0.06 0.59CIPs UC-6 0.43 0.51 0.67 0.35 0.36 1.17 1.75 1.26 1.04 0.24 0.00 0.18CISs UC-7 0.85 0.99 1.31 0.70 0.70 2.30 3.44 2.47 2.04 0.48 0.00 0.35CIPs UC-7 0.19 0.22 0.29 0.15 0.15 0.51 0.76 0.54 0.45 0.10 0.00 0.08Gappal IS/IP 8 0.65 0.83 0.96 0.10 0.79 0.57 0.72 0.46 0.18 0.12 0.04 0.56CIPs UC-8B - - - - - - - - - - - - CIPs UC-9 - - - - - - - - - - - - Lulutan IP 15 - - - - - - - - - - - - Sub total 8.39 10.89 13.11 3.62 8.68 12.26 16.38 10.72 8.00 2.60 0.45 5.98
II. Magat BasinCISs M-1 8.52 10.50 11.80 6.87 2.96 9.47 10.52 8.03 7.63 2.61 0.00 3.91CIPs M-1 0.13 0.16 0.18 0.11 0.09 0.32 0.36 0.27 0.26 0.09 0.00 0.06Matuno (Manam.) 10 - - - - - - - - - - - - Matuno (Bayom.) 11 - - - - - - - - - - - - CISs M-2 0.12 0.15 0.17 0.10 0.05 0.19 0.25 0.19 0.19 0.05 0.00 0.06CISs M-3 11.54 20.21 16.66 9.19 4.86 16.73 22.00 20.17 14.59 4.94 0.00 5.47CIPs M-3 0.30 0.53 0.44 0.24 0.24 0.93 1.22 1.12 0.81 0.27 0.00 0.15Magat RIIS 13 115.96 116.85 82.95 54.86 109.23 96.74 140.02 72.93 40.51 29.47 48.09 89.46CISs M-4 1.12 1.36 1.66 1.03 0.55 1.83 2.42 2.08 1.70 0.56 0.00 0.51CISs M-5 0.06 0.08 0.10 0.06 0.03 0.10 0.13 0.11 0.09 0.03 0.00 0.03Sub total 137.75 149.84 113.96 72.46 118.01 126.31 176.92 104.90 65.78 38.02 48.09 99.65
III. Ilagan BasinIlagan IP 18 - - - - - - - - - - - - Tumauini (Ila.) 18 - - - - - - - - - - - - CISs I-3 0.06 0.07 0.09 0.05 0.05 0.17 0.25 0.18 0.15 0.03 0.00 0.03CISs I-4 0.16 0.19 0.25 0.13 0.13 0.44 0.65 0.47 0.39 0.09 0.00 0.07CIPs I-4 0.24 0.28 0.38 0.20 0.20 0.66 0.98 0.71 0.58 0.14 0.00 0.10Sub total 0.46 0.54 0.72 0.38 0.38 1.27 1.88 1.36 1.12 0.26 0.00 0.20
IV. Siffu, Mallig BasinCISs S-1 0.91 1.10 1.34 0.83 0.30 0.89 1.17 1.01 0.83 0.27 0.00 0.41Siffu RIS 29 13.68 15.97 16.70 5.50 5.22 14.90 16.90 8.22 7.42 4.79 3.43 11.79CISs S-3 0.12 0.15 0.18 0.11 0.07 0.22 0.28 0.25 0.21 0.07 0.00 0.05Mallig RIS 31 1.36 1.78 0.84 0.00 1.11 3.25 3.10 2.66 0.92 0.00 0.35 1.03CISs S-5 0.27 0.34 0.42 0.24 0.21 0.73 1.13 0.87 0.64 0.19 0.00 0.11CIPs S-5 0.53 0.66 0.82 0.47 0.42 1.44 2.22 1.71 1.26 0.37 0.00 0.21Sub total 16.87 20.00 20.30 7.15 7.33 21.43 24.80 14.72 11.28 5.69 3.78 13.60
V. Chico BasinCISs C-1 2.30 2.55 2.32 1.01 0.42 1.23 0.76 0.68 0.76 0.35 0.00 0.99CISs C-2 1.00 1.17 1.10 0.56 0.44 1.24 0.87 0.74 0.86 0.25 0.00 0.42CISs C-3 0.50 0.58 0.54 0.28 0.21 0.58 0.41 0.35 0.40 0.12 0.00 0.21Chico RIS 23 22.41 26.99 12.33 0.00 8.22 25.71 21.13 17.93 6.83 0.00 5.24 19.06Chico Mallig IP 30 19.62 22.66 22.95 2.24 19.70 18.94 18.44 11.92 4.04 3.28 1.50 15.10CISs C-4 0.44 0.52 0.63 0.37 0.25 0.87 1.17 0.88 0.72 0.21 0.00 0.18CISs C-5 0.50 0.59 0.71 0.42 0.28 0.99 1.34 1.01 0.83 0.24 0.00 0.20Chico RIS(West) 25 2.27 2.82 1.30 0.00 0.83 2.50 2.07 1.82 0.72 0.00 0.56 1.93CISs C-6 1.56 1.89 2.29 1.29 0.62 1.98 2.67 2.07 1.77 0.52 0.00 0.64CIPs C-6 0.71 0.86 1.04 0.58 0.51 1.81 2.45 1.89 1.63 0.48 0.00 0.29Sub total 51.31 60.63 45.21 6.75 31.48 55.85 51.31 39.29 18.56 5.45 7.30 39.02
VI. Lower Cagayan BasinCISs LC-1 0.13 0.16 0.20 0.12 0.10 0.35 0.54 0.42 0.31 0.09 0.00 0.05CIPs LC-1 0.07 0.08 0.10 0.06 0.05 0.18 0.28 0.21 0.16 0.05 0.00 0.03Tumauini IS 33 1.32 1.72 1.99 0.30 1.70 1.51 1.73 1.46 1.24 0.15 0.85 0.72S/Pab.Caba. IS 34 0.81 0.98 0.45 0.00 0.59 1.86 1.53 1.30 0.49 0.00 0.19 0.69Pinacanauan RIS 35 1.15 1.31 1.31 0.11 1.17 1.14 1.10 0.71 0.23 0.19 0.08 0.89CISs LC-5 1.12 1.33 1.60 0.94 0.81 2.99 4.03 3.03 2.49 0.72 0.00 0.46CIPs LC-5 0.63 0.75 0.90 0.53 0.46 1.67 2.26 1.70 1.39 0.40 0.00 0.26Tuguegarao PIS 36 0.13 0.19 0.21 0.05 0.10 0.08 0.10 0.06 0.04 0.03 0.02 0.09Solana PIS 37 3.64 4.11 4.14 0.35 3.71 3.60 3.47 2.25 0.73 0.60 0.26 2.81A/Amul.West PIP 37 6.44 8.13 8.47 1.22 6.05 5.49 5.71 3.65 1.48 1.16 0.68 4.89CISs LC-6 0.30 0.36 0.44 0.26 0.13 0.42 0.57 0.43 0.35 0.10 0.00 0.13CIPs LC-6 0.43 0.51 0.62 0.36 0.31 1.15 1.55 1.16 0.95 0.28 0.00 0.18IAAPIS(Iguig) 38 0.78 0.89 0.89 0.08 0.80 0.78 0.75 0.49 0.04 0.00 0.00 0.57CISs LC-7 0.34 0.40 0.49 0.29 0.14 0.47 0.64 0.48 0.39 0.11 0.00 0.14CIPs LC-7 0.14 0.16 0.20 0.12 0.10 0.36 0.49 0.37 0.31 0.09 0.00 0.06IAAPIS(A/Amulu) 39 2.31 2.61 2.62 0.22 2.35 2.28 2.19 1.42 0.12 0.00 0.00 1.68Baggao IS(Pared) 40 0.58 0.70 0.79 0.12 0.61 0.60 0.57 0.48 0.45 0.05 0.35 0.40Baggao IS(Paranan) 42 0.79 0.95 1.07 0.17 1.13 1.10 1.06 0.88 0.83 0.10 0.47 0.54CISs LC-10 1.38 1.63 1.97 1.16 0.58 1.93 2.61 1.96 1.61 0.47 0.00 0.56CIPs LC-10 - - - - - - - - - - - - CISs LC-11 0.05 0.06 0.07 0.04 0.02 0.07 0.09 0.07 0.06 0.02 0.00 0.02Zinundungan RIS 44 2.57 3.00 3.03 0.24 2.56 2.38 2.36 1.58 0.14 0.00 0.00 1.89Zinun. Exten. 44 - - - - - - - - - - - - Dummun RIS 46 1.04 1.64 2.01 0.33 1.75 1.65 1.71 1.41 1.04 0.12 0.82 0.64CIPs LC-12 - - - - - - - - - - - - CISs LC-13 0.62 0.86 1.14 0.72 0.37 1.17 1.70 1.29 0.83 0.23 0.00 0.28CIPs LC-13 - - - - - - - - - - - - Magapit PIS(L/Caga.) 47 9.66 14.13 15.58 1.42 15.25 14.36 14.84 9.60 0.62 0.00 0.00 8.55CISs LC-14 0.41 0.57 0.75 0.47 0.24 0.77 1.11 0.85 0.54 0.15 0.00 0.18CIPs LC-14 - - - - - - - - - - - - Sub total 36.84 47.23 51.04 9.68 41.08 48.36 52.99 37.26 16.84 5.11 3.72 26.71
TOTAL 251.62 289.13 244.34 100.04 206.96 265.48 324.28 208.25 121.58 57.13 63.34 185.16Note: Updated based on the same titled table in the 1987 Master Plan
T21

Table 5.5.2 Future Irrigation Water Demand (4/5, Year 2015)(unit: m3/s)
Name of System Area Code/Base Point No JAN FEB MAR APR MAY JUN JUL AUG SEP OCT NOV DEC
I. Upper Cagayan BasinCISs UC-3 0.52 0.64 0.70 0.40 0.37 1.28 1.38 0.73 0.85 0.25 0.00 0.24CIPs UC-3 0.22 0.26 0.29 0.16 0.15 0.53 0.56 0.30 0.35 0.10 0.00 0.10CISs UC-4 0.40 0.49 0.53 0.30 0.14 0.44 0.48 0.25 0.29 0.09 0.00 0.18CISs UC-5 0.15 0.19 0.20 0.12 0.11 0.37 0.40 0.21 0.25 0.07 0.00 0.07Addalam RIP outlet-5 3.85 5.31 6.35 0.82 4.72 3.26 4.26 2.68 1.22 0.76 0.35 3.44CISs UC-6B 0.47 0.54 0.72 0.38 0.38 1.27 1.90 1.36 1.12 0.26 0.00 0.19Dabubu IP 6 0.66 0.91 1.09 0.14 0.81 0.56 0.73 0.46 0.21 0.13 0.06 0.59CIPs UC-6 0.87 1.01 1.33 0.71 0.71 2.34 3.51 2.52 2.08 0.49 0.00 0.36CISs UC-7 0.85 0.99 1.31 0.70 0.70 2.30 3.44 2.47 2.04 0.48 0.00 0.35CIPs UC-7 0.47 0.55 0.72 0.39 0.39 1.27 1.91 1.37 1.13 0.26 0.00 0.19Gappal IS/IP 8 0.65 0.83 0.96 0.10 0.79 0.57 0.72 0.46 0.18 0.12 0.04 0.56CIPs UC-8B 0.15 0.17 0.22 0.12 0.12 0.39 0.59 0.42 0.35 0.08 0.00 0.06CIPs UC-9 - - - - - - - - - - - - Lulutan IP 15 3.46 4.30 4.92 0.46 4.23 3.09 3.81 2.44 0.95 0.62 0.20 2.93Sub total 12.72 16.19 19.34 4.80 13.62 17.67 23.69 15.67 11.02 3.71 0.65 9.26
II. Magat BasinCISs M-1 8.52 10.50 11.80 6.87 2.96 9.47 10.52 8.03 7.63 2.61 0.00 3.91CIPs M-1 0.13 0.16 0.18 0.11 0.09 0.32 0.36 0.27 0.26 0.09 0.00 0.06Matuno (Manam.) 10 - - - - - - - - - - - - Matuno (Bayom.) 11 - - - - - - - - - - - - CISs M-2 0.12 0.15 0.17 0.10 0.05 0.19 0.25 0.19 0.19 0.05 0.00 0.06CISs M-3 11.54 20.21 16.66 9.19 4.86 16.73 22.00 20.17 14.59 4.94 0.00 5.47CIPs M-3 0.30 0.53 0.44 0.24 0.24 0.93 1.22 1.12 0.81 0.27 0.00 0.15Magat RIIS 13 115.96 116.85 82.95 54.86 109.23 96.74 140.02 72.93 40.51 29.47 48.09 89.46CISs M-4 1.12 1.36 1.66 1.03 0.55 1.83 2.42 2.08 1.70 0.56 0.00 0.51CISs M-5 0.06 0.08 0.10 0.06 0.03 0.10 0.13 0.11 0.09 0.03 0.00 0.03Sub total 137.75 149.84 113.96 72.46 118.01 126.31 176.92 104.90 65.78 38.02 48.09 99.65
III. Ilagan BasinIlagan IP 18 0.28 0.60 0.83 0.18 0.35 0.17 0.31 0.17 0.15 0.09 0.08 0.32Tumauini (Ila.) 18 - - - - - - - - - - - - CISs I-3 0.06 0.07 0.09 0.05 0.05 0.17 0.25 0.18 0.15 0.03 0.00 0.03CISs I-4 0.16 0.19 0.25 0.13 0.13 0.44 0.65 0.47 0.39 0.09 0.00 0.07CIPs I-4 0.24 0.28 0.38 0.20 0.20 0.66 0.98 0.71 0.58 0.14 0.00 0.10Sub total 0.74 1.14 1.55 0.56 0.73 1.44 2.19 1.53 1.27 0.35 0.08 0.52
IV. Siffu, Mallig BasinCISs S-1 0.91 1.10 1.34 0.83 0.30 0.89 1.17 1.01 0.83 0.27 0.00 0.41Siffu RIS 29 13.68 15.97 16.70 5.50 5.22 14.90 16.90 8.22 7.42 4.79 3.43 11.79CISs S-3 0.12 0.15 0.18 0.11 0.07 0.22 0.28 0.25 0.21 0.07 0.00 0.05Mallig RIS 31 1.36 1.78 0.84 0.00 1.11 3.25 3.10 2.66 0.92 0.00 0.35 1.03CISs S-5 0.27 0.34 0.42 0.24 0.21 0.73 1.13 0.87 0.64 0.19 0.00 0.11CIPs S-5 0.53 0.66 0.82 0.47 0.42 1.44 2.22 1.71 1.26 0.37 0.00 0.21Sub total 16.87 20.00 20.30 7.15 7.33 21.43 24.80 14.72 11.28 5.69 3.78 13.60
V. Chico BasinCISs C-1 2.30 2.55 2.32 1.01 0.42 1.23 0.76 0.68 0.76 0.35 0.00 0.99CISs C-2 1.00 1.17 1.10 0.56 0.44 1.24 0.87 0.74 0.86 0.25 0.00 0.42CISs C-3 0.50 0.58 0.54 0.28 0.21 0.58 0.41 0.35 0.40 0.12 0.00 0.21Chico RIS 23 22.41 26.99 12.33 0.00 8.22 25.71 21.13 17.93 6.83 0.00 5.24 19.06Chico Mallig IP 30 39.23 45.32 45.91 4.47 39.39 37.88 36.87 23.85 8.08 6.55 3.01 30.19CISs C-4 0.44 0.52 0.63 0.37 0.25 0.87 1.17 0.88 0.72 0.21 0.00 0.18CISs C-5 0.50 0.59 0.71 0.42 0.28 0.99 1.34 1.01 0.83 0.24 0.00 0.20Chico RIS(West) 25 2.27 2.82 1.30 0.00 0.83 2.50 2.07 1.82 0.72 0.00 0.56 1.93CISs C-6 1.30 1.58 1.91 1.07 0.52 1.65 2.23 1.72 1.48 0.44 0.00 0.53CIPs C-6 0.83 1.01 1.22 0.69 0.60 2.13 2.88 2.23 1.92 0.56 0.00 0.34Sub total 70.78 83.13 67.97 8.87 51.16 74.78 69.73 51.21 22.60 8.72 8.81 54.05
VI. Lower Cagayan BasinCISs LC-1 0.13 0.16 0.20 0.12 0.10 0.35 0.54 0.42 0.31 0.09 0.00 0.05CIPs LC-1 0.07 0.08 0.10 0.06 0.05 0.18 0.28 0.21 0.16 0.05 0.00 0.03Tumauini IS 33 1.32 1.72 1.99 0.30 1.70 1.51 1.73 1.46 1.24 0.15 0.85 0.72S/Pab.Caba. IS 34 0.81 0.98 0.45 0.00 0.59 1.86 1.53 1.30 0.49 0.00 0.19 0.69Pinacanauan RIS 35 1.15 1.31 1.31 0.11 1.17 1.14 1.10 0.71 0.23 0.19 0.08 0.89CISs LC-5 0.64 0.75 0.91 0.53 0.46 1.70 2.29 1.73 1.42 0.41 0.00 0.26CIPs LC-5 1.14 1.34 1.62 0.95 0.83 3.02 4.08 3.07 2.52 0.73 0.00 0.46Tuguegarao PIS 36 0.13 0.19 0.21 0.05 0.10 0.08 0.10 0.06 0.04 0.03 0.02 0.09Solana PIS 37 3.64 4.11 4.14 0.35 3.71 3.60 3.47 2.25 0.73 0.60 0.26 2.81A/Amul.West PIP 37 6.44 8.13 8.47 1.22 6.05 5.49 5.71 3.65 1.48 1.16 0.68 4.89CISs LC-6 0.30 0.36 0.44 0.26 0.13 0.42 0.57 0.43 0.35 0.10 0.00 0.13CIPs LC-6 0.45 0.53 0.64 0.37 0.32 1.19 1.61 1.21 0.99 0.29 0.00 0.18IAAPIS(Iguig) 38 0.78 0.89 0.89 0.08 0.80 0.78 0.75 0.49 0.04 0.00 0.00 0.57CISs LC-7 0.04 0.05 0.06 0.04 0.01 0.06 0.08 0.06 0.05 0.01 0.00 0.02CIPs LC-7 0.66 0.78 0.94 0.55 0.48 1.76 2.37 1.78 1.46 0.42 0.00 0.27IAAPIS(A/Amulu) 39 2.31 2.61 2.62 0.22 2.35 2.28 2.19 1.42 0.12 0.00 0.00 1.68Baggao IS(Pared) 40 0.58 0.70 0.79 0.12 0.61 0.60 0.57 0.48 0.45 0.05 0.35 0.40Baggao IS(Paranan) 42 0.79 0.95 1.07 0.17 1.13 1.10 1.06 0.88 0.83 0.10 0.47 0.54CISs LC-10 1.38 1.63 1.97 1.16 0.58 1.93 2.61 1.96 1.61 0.47 0.00 0.56CIPs LC-10 0.50 0.59 0.72 0.42 0.37 1.34 1.80 1.36 1.11 0.32 0.00 0.02CISs LC-11 0.05 0.06 0.07 0.04 0.02 0.07 0.09 0.07 0.06 0.02 0.00 0.02Zinundungan RIS 44 2.57 3.00 3.03 0.24 2.56 2.38 2.36 1.58 0.14 0.00 0.00 1.89Zinun. Exten. 44 - - - - - - - - - - - - Dummun RIS 46 1.04 1.64 2.01 0.33 1.75 1.65 1.71 1.41 1.04 0.12 0.82 0.64CIPs LC-12 0.05 0.08 0.10 0.06 0.06 0.20 0.29 0.22 0.14 0.04 0.00 0.02CISs LC-13 0.62 0.86 1.14 0.72 0.37 1.17 1.70 1.29 0.83 0.23 0.00 0.28CIPs LC-13 0.23 0.32 0.42 0.27 0.23 0.83 1.20 0.92 0.59 0.16 0.00 0.10Magapit PIS(L/Caga.) 47 9.66 14.13 15.58 1.42 15.25 14.36 14.84 9.60 0.62 0.00 0.00 8.55CISs LC-14 0.41 0.57 0.75 0.47 0.24 0.77 1.11 0.85 0.54 0.15 0.00 0.18CIPs LC-14 - - - - - - - - - - - - Sub total 37.89 48.52 52.64 10.63 42.02 51.82 57.74 40.87 19.59 5.89 3.72 26.94
TOTAL 276.75 318.82 275.76 104.47 232.87 293.45 355.07 228.90 131.54 62.38 65.13 204.02Note: Updated based on the same titled table in the 1987 Master Plan
T22
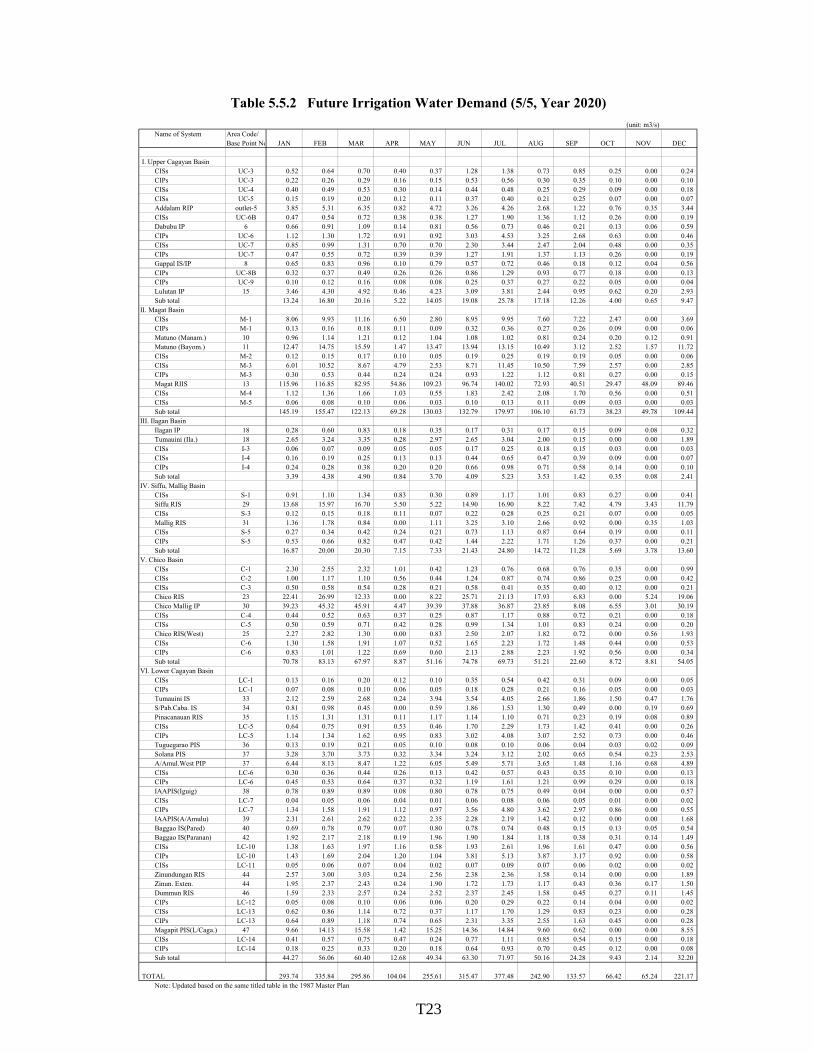
Table 5.5.2 Future Irrigation Water Demand (5/5, Year 2020)(unit: m3/s)
Name of System Area Code/Base Point No JAN FEB MAR APR MAY JUN JUL AUG SEP OCT NOV DEC
I. Upper Cagayan BasinCISs UC-3 0.52 0.64 0.70 0.40 0.37 1.28 1.38 0.73 0.85 0.25 0.00 0.24CIPs UC-3 0.22 0.26 0.29 0.16 0.15 0.53 0.56 0.30 0.35 0.10 0.00 0.10CISs UC-4 0.40 0.49 0.53 0.30 0.14 0.44 0.48 0.25 0.29 0.09 0.00 0.18CISs UC-5 0.15 0.19 0.20 0.12 0.11 0.37 0.40 0.21 0.25 0.07 0.00 0.07Addalam RIP outlet-5 3.85 5.31 6.35 0.82 4.72 3.26 4.26 2.68 1.22 0.76 0.35 3.44CISs UC-6B 0.47 0.54 0.72 0.38 0.38 1.27 1.90 1.36 1.12 0.26 0.00 0.19Dabubu IP 6 0.66 0.91 1.09 0.14 0.81 0.56 0.73 0.46 0.21 0.13 0.06 0.59CIPs UC-6 1.12 1.30 1.72 0.91 0.92 3.03 4.53 3.25 2.68 0.63 0.00 0.46CISs UC-7 0.85 0.99 1.31 0.70 0.70 2.30 3.44 2.47 2.04 0.48 0.00 0.35CIPs UC-7 0.47 0.55 0.72 0.39 0.39 1.27 1.91 1.37 1.13 0.26 0.00 0.19Gappal IS/IP 8 0.65 0.83 0.96 0.10 0.79 0.57 0.72 0.46 0.18 0.12 0.04 0.56CIPs UC-8B 0.32 0.37 0.49 0.26 0.26 0.86 1.29 0.93 0.77 0.18 0.00 0.13CIPs UC-9 0.10 0.12 0.16 0.08 0.08 0.25 0.37 0.27 0.22 0.05 0.00 0.04Lulutan IP 15 3.46 4.30 4.92 0.46 4.23 3.09 3.81 2.44 0.95 0.62 0.20 2.93Sub total 13.24 16.80 20.16 5.22 14.05 19.08 25.78 17.18 12.26 4.00 0.65 9.47
II. Magat BasinCISs M-1 8.06 9.93 11.16 6.50 2.80 8.95 9.95 7.60 7.22 2.47 0.00 3.69CIPs M-1 0.13 0.16 0.18 0.11 0.09 0.32 0.36 0.27 0.26 0.09 0.00 0.06Matuno (Manam.) 10 0.96 1.14 1.21 0.12 1.04 1.08 1.02 0.81 0.24 0.20 0.12 0.91Matuno (Bayom.) 11 12.47 14.75 15.59 1.47 13.47 13.94 13.15 10.49 3.12 2.52 1.57 11.72CISs M-2 0.12 0.15 0.17 0.10 0.05 0.19 0.25 0.19 0.19 0.05 0.00 0.06CISs M-3 6.01 10.52 8.67 4.79 2.53 8.71 11.45 10.50 7.59 2.57 0.00 2.85CIPs M-3 0.30 0.53 0.44 0.24 0.24 0.93 1.22 1.12 0.81 0.27 0.00 0.15Magat RIIS 13 115.96 116.85 82.95 54.86 109.23 96.74 140.02 72.93 40.51 29.47 48.09 89.46CISs M-4 1.12 1.36 1.66 1.03 0.55 1.83 2.42 2.08 1.70 0.56 0.00 0.51CISs M-5 0.06 0.08 0.10 0.06 0.03 0.10 0.13 0.11 0.09 0.03 0.00 0.03Sub total 145.19 155.47 122.13 69.28 130.03 132.79 179.97 106.10 61.73 38.23 49.78 109.44
III. Ilagan BasinIlagan IP 18 0.28 0.60 0.83 0.18 0.35 0.17 0.31 0.17 0.15 0.09 0.08 0.32Tumauini (Ila.) 18 2.65 3.24 3.35 0.28 2.97 2.65 3.04 2.00 0.15 0.00 0.00 1.89CISs I-3 0.06 0.07 0.09 0.05 0.05 0.17 0.25 0.18 0.15 0.03 0.00 0.03CISs I-4 0.16 0.19 0.25 0.13 0.13 0.44 0.65 0.47 0.39 0.09 0.00 0.07CIPs I-4 0.24 0.28 0.38 0.20 0.20 0.66 0.98 0.71 0.58 0.14 0.00 0.10Sub total 3.39 4.38 4.90 0.84 3.70 4.09 5.23 3.53 1.42 0.35 0.08 2.41
IV. Siffu, Mallig BasinCISs S-1 0.91 1.10 1.34 0.83 0.30 0.89 1.17 1.01 0.83 0.27 0.00 0.41Siffu RIS 29 13.68 15.97 16.70 5.50 5.22 14.90 16.90 8.22 7.42 4.79 3.43 11.79CISs S-3 0.12 0.15 0.18 0.11 0.07 0.22 0.28 0.25 0.21 0.07 0.00 0.05Mallig RIS 31 1.36 1.78 0.84 0.00 1.11 3.25 3.10 2.66 0.92 0.00 0.35 1.03CISs S-5 0.27 0.34 0.42 0.24 0.21 0.73 1.13 0.87 0.64 0.19 0.00 0.11CIPs S-5 0.53 0.66 0.82 0.47 0.42 1.44 2.22 1.71 1.26 0.37 0.00 0.21Sub total 16.87 20.00 20.30 7.15 7.33 21.43 24.80 14.72 11.28 5.69 3.78 13.60
V. Chico BasinCISs C-1 2.30 2.55 2.32 1.01 0.42 1.23 0.76 0.68 0.76 0.35 0.00 0.99CISs C-2 1.00 1.17 1.10 0.56 0.44 1.24 0.87 0.74 0.86 0.25 0.00 0.42CISs C-3 0.50 0.58 0.54 0.28 0.21 0.58 0.41 0.35 0.40 0.12 0.00 0.21Chico RIS 23 22.41 26.99 12.33 0.00 8.22 25.71 21.13 17.93 6.83 0.00 5.24 19.06Chico Mallig IP 30 39.23 45.32 45.91 4.47 39.39 37.88 36.87 23.85 8.08 6.55 3.01 30.19CISs C-4 0.44 0.52 0.63 0.37 0.25 0.87 1.17 0.88 0.72 0.21 0.00 0.18CISs C-5 0.50 0.59 0.71 0.42 0.28 0.99 1.34 1.01 0.83 0.24 0.00 0.20Chico RIS(West) 25 2.27 2.82 1.30 0.00 0.83 2.50 2.07 1.82 0.72 0.00 0.56 1.93CISs C-6 1.30 1.58 1.91 1.07 0.52 1.65 2.23 1.72 1.48 0.44 0.00 0.53CIPs C-6 0.83 1.01 1.22 0.69 0.60 2.13 2.88 2.23 1.92 0.56 0.00 0.34Sub total 70.78 83.13 67.97 8.87 51.16 74.78 69.73 51.21 22.60 8.72 8.81 54.05
VI. Lower Cagayan BasinCISs LC-1 0.13 0.16 0.20 0.12 0.10 0.35 0.54 0.42 0.31 0.09 0.00 0.05CIPs LC-1 0.07 0.08 0.10 0.06 0.05 0.18 0.28 0.21 0.16 0.05 0.00 0.03Tumauini IS 33 2.12 2.59 2.68 0.24 3.94 3.54 4.05 2.66 1.86 1.50 0.47 1.76S/Pab.Caba. IS 34 0.81 0.98 0.45 0.00 0.59 1.86 1.53 1.30 0.49 0.00 0.19 0.69Pinacanauan RIS 35 1.15 1.31 1.31 0.11 1.17 1.14 1.10 0.71 0.23 0.19 0.08 0.89CISs LC-5 0.64 0.75 0.91 0.53 0.46 1.70 2.29 1.73 1.42 0.41 0.00 0.26CIPs LC-5 1.14 1.34 1.62 0.95 0.83 3.02 4.08 3.07 2.52 0.73 0.00 0.46Tuguegarao PIS 36 0.13 0.19 0.21 0.05 0.10 0.08 0.10 0.06 0.04 0.03 0.02 0.09Solana PIS 37 3.28 3.70 3.73 0.32 3.34 3.24 3.12 2.02 0.65 0.54 0.23 2.53A/Amul.West PIP 37 6.44 8.13 8.47 1.22 6.05 5.49 5.71 3.65 1.48 1.16 0.68 4.89CISs LC-6 0.30 0.36 0.44 0.26 0.13 0.42 0.57 0.43 0.35 0.10 0.00 0.13CIPs LC-6 0.45 0.53 0.64 0.37 0.32 1.19 1.61 1.21 0.99 0.29 0.00 0.18IAAPIS(Iguig) 38 0.78 0.89 0.89 0.08 0.80 0.78 0.75 0.49 0.04 0.00 0.00 0.57CISs LC-7 0.04 0.05 0.06 0.04 0.01 0.06 0.08 0.06 0.05 0.01 0.00 0.02CIPs LC-7 1.34 1.58 1.91 1.12 0.97 3.56 4.80 3.62 2.97 0.86 0.00 0.55IAAPIS(A/Amulu) 39 2.31 2.61 2.62 0.22 2.35 2.28 2.19 1.42 0.12 0.00 0.00 1.68Baggao IS(Pared) 40 0.69 0.78 0.79 0.07 0.80 0.78 0.74 0.48 0.15 0.13 0.05 0.54Baggao IS(Paranan) 42 1.92 2.17 2.18 0.19 1.96 1.90 1.84 1.18 0.38 0.31 0.14 1.49CISs LC-10 1.38 1.63 1.97 1.16 0.58 1.93 2.61 1.96 1.61 0.47 0.00 0.56CIPs LC-10 1.43 1.69 2.04 1.20 1.04 3.81 5.13 3.87 3.17 0.92 0.00 0.58CISs LC-11 0.05 0.06 0.07 0.04 0.02 0.07 0.09 0.07 0.06 0.02 0.00 0.02Zinundungan RIS 44 2.57 3.00 3.03 0.24 2.56 2.38 2.36 1.58 0.14 0.00 0.00 1.89Zinun. Exten. 44 1.95 2.37 2.43 0.24 1.90 1.72 1.73 1.17 0.43 0.36 0.17 1.50Dummun RIS 46 1.59 2.33 2.57 0.24 2.52 2.37 2.45 1.58 0.45 0.27 0.11 1.45CIPs LC-12 0.05 0.08 0.10 0.06 0.06 0.20 0.29 0.22 0.14 0.04 0.00 0.02CISs LC-13 0.62 0.86 1.14 0.72 0.37 1.17 1.70 1.29 0.83 0.23 0.00 0.28CIPs LC-13 0.64 0.89 1.18 0.74 0.65 2.31 3.35 2.55 1.63 0.45 0.00 0.28Magapit PIS(L/Caga.) 47 9.66 14.13 15.58 1.42 15.25 14.36 14.84 9.60 0.62 0.00 0.00 8.55CISs LC-14 0.41 0.57 0.75 0.47 0.24 0.77 1.11 0.85 0.54 0.15 0.00 0.18CIPs LC-14 0.18 0.25 0.33 0.20 0.18 0.64 0.93 0.70 0.45 0.12 0.00 0.08Sub total 44.27 56.06 60.40 12.68 49.34 63.30 71.97 50.16 24.28 9.43 2.14 32.20
TOTAL 293.74 335.84 295.86 104.04 255.61 315.47 377.48 242.90 133.57 66.42 65.24 221.17Note: Updated based on the same titled table in the 1987 Master Plan
T23

Unit: Million m3/Year
Balance 2000 2005 2010 2015 2020Point Demand Demand Demand Demand Demand
1 0.00 0.00 0.00 0.00 0.002 0.00 0.00 0.00 0.00 0.003 0.00 0.00 0.00 0.00 0.004 0.00 0.00 0.00 0.00 0.005 0.00 0.00 0.00 0.00 0.006 0.00 0.00 -1.79 -5.85 -8.777 0.00 0.00 0.00 0.00 0.008 -1.43 -6.51 -6.51 -6.51 -6.519 0.00 0.00 0.00 0.00 0.00
10 0.00 0.00 0.00 0.00 0.0011 -4.80 -4.80 -4.87 -4.95 -112.9912 -0.29 -0.29 -0.34 -0.40 -0.4813 -85.27 -85.27 -89.95 -91.83 -93.3714 0.00 0.00 0.00 0.00 0.0015 0.00 0.00 0.00 0.00 0.0016 0.00 0.00 0.00 0.00 0.0017 0.00 0.00 0.00 0.00 0.0018 0.00 0.00 0.00 0.00 0.0019 0.00 0.00 0.00 0.00 0.0020 0.00 0.00 0.00 0.00 0.0021 -0.04 -0.04 -0.07 -0.10 -0.1422 -0.38 -0.38 -0.38 -0.40 -0.4223 -6.52 -61.30 -61.44 -61.58 -61.7524 0.00 0.00 0.00 0.00 0.0025 0.00 0.00 0.00 0.00 0.0026 0.00 0.00 0.00 0.00 0.0027 0.00 0.00 0.00 0.00 0.0028 0.00 0.00 0.00 0.00 0.0029 -68.96 -68.96 -68.96 -68.96 -68.9630 -162.10 -162.10 -162.10 -162.10 -162.1031 -18.45 -18.45 -18.45 -18.45 -18.4532 -15.18 -16.56 -20.61 -22.43 -24.7533 -4.15 -4.15 -4.15 -4.15 -13.3634 0.00 -1.45 -1.45 -1.45 -1.4535 0.00 0.00 0.00 0.00 0.0036 0.00 0.00 0.00 0.00 0.0037 0.00 0.00 0.00 0.00 0.0038 0.00 0.00 0.00 0.00 0.0039 0.00 0.00 0.00 0.00 0.0040 -3.38 -11.24 -11.24 -11.24 -11.2441 0.00 0.00 0.00 0.00 0.0042 -9.90 -9.90 -9.90 -9.90 -31.5443 0.00 0.00 0.00 0.00 0.0044 -24.93 -24.00 -24.00 -24.00 -24.0045 -7.27 -7.27 -7.27 -7.27 -11.8546 -20.32 -20.32 -20.32 -20.32 -32.9847 0.00 0.00 0.00 0.00 0.0048 0.00 0.00 0.00 0.00 0.00
Total -433.37 -502.99 -513.80 -521.89 -685.09
(President Condition)
Table 5.5.3 5-year Probable Annual Water Deficit at Balance Points
T24

Purpose
Catchment area (km2) 656River name Siffu
ReservoirFlood water level (EL .m) 115.5Surcharge water level (EL .m) 113.0High water level (EL .m) 106.0Low water level (EL .m) 97.0Gross storage(106m3) 314Storage for water utility (106m3) 93Storage for flood control (106m3) 115Reservoir area at SWL (km2) 19.0
DamType EarthfillCrest elevation (EL .m) 118Crest length (m) 240Crest width (m) 12Height (m) 58Upstream slope 1:3.9Downstream slope 1:2.7Embankment volume (m3) 1,659,500
SpillwayType Gated open chutewayDesign flood (m3/s) 3,000Gate width (m) 9.4Gate height (m) 11.7Gate units (nos) 3Crest elevation (EL .m) 101.3Crest width (m) 28.2Energy dissipator Stilling basin
DiversionType TunnelDesign flood (m3/s) 1,300Tunnel diameter (m) 5.6Tunnel length (m) 500Number of tunnel (lanes) 2
WaterwayMaximum discharge (m3/s) 19.9Intake sill elevation (EL .m) 93.5Length of Waterway (m) 350
Power and EnergyMaximum plant discharge (m3/s) 19.9Maximum gross head (m) 40.0Rated head (m) 32.0Installed capacity (kW) 5,400Annual energy (GWh) 41.1
Table 6.1.1 Principal Features of Siffu No.1 Dam
Flood Control, Hydropower and Supplemental Water Supply of Magat Dam
T25

Purpose
Catchment area 362 km2 at damsite and 1,951 km2 at Chico river intake wRiver name Mallig
ReservoirFlood water level (EL .m) 185.5Surcharge water level (EL .m) 183High water level (EL .m) 180Low water level (EL .m) 160Gross storage(106m3) 1037Storage for water utility (106m3) 545Storage for flood control (106m3) 112Reservoir area at SWL (km2) 41
DamType RockfillCrest elevation (EL .m) 188Crest length (m) 300Crest width (m) 12Height (m) 84Upstream slope 1:2.9Downstream slope 1:2.0Embankment volume (m3) 2,365,000
SpillwayType Gated open chutewayDesign flood (m3/s) 1,680Gate width (m) 7.2Gate height (m) 9Gate units (nos) 3Crest elevation (EL .m) 174Crest width (m) 21.6Energy dissipator Stilling basin
DiversionType TunnelDesign flood (m3/s) 800Tunnel diameter (m) 4.4Tunnel length (m) 650Number of tunnel (lanes) 2
WaterwayMaximum discharge (m3/s) 61Intake sill elevation (EL .m) 150Length of Waterway (m) 270
Transbasin basin (from Chico river to Mallig No.2 Dam)Type Open channel and tunnelDesign discharge (m3/s) 30Tunnel diameter (m) 4.0Tunnel length (m) 4,000Channel length (m) 1,600
Irrigation and Flood control
Table 6.1.2 Principal Features of Mallig No.2 Dam
T26

Purpose
Catchment area (km2) 550River name Matuno
ReservoirFlood water level (EL .m) 524.7High water level (EL .m) 520.0Low water level (EL .m) 480.0Gross storage(106m3) 137Effective Storage (106m3) 97Reservoir area at HWL (km2) 3.5
DamType Rockfill with a center core zone
Crest length (m) 580Crest width (m) 14Height (m) 147Upstream slope 1:3.3Downstream slope 1:2.1Embankment volume (m3) 10,000,000
SpillwayType Gated and open chute spillwayDesign flood (m3/s) 10,300Gate width (m) 12Gate height (m) 16Gate units (nos) 4Crest elevation (EL .m) 504Crest width (m) 57Overflow crest length (m) 48Chuteway length (m) 225Chuteway width 57Energy dissipator Stilling basin
IrrigationWater requirement (m3/s) 21.4Service area (ha) 13,680
Power and EnergyMaximum plant discharge (m3/s) 112.2Firm plant discharge (m3/s) 37.4Installed capacity (kW) 180,000Annual energy (GWh) 356
528
Table 6.1.3 Principal Features of Matuno No.1 Dam
Flood Control, Hydropower and Supplemental water Supply of Magat Dam
Total (GWh)
T27

Purpose
Catchment area (km2) 559River name Alimit
ReservoirFlood water level (EL .m) 279High water level (EL .m) 271Low water level (EL .m) 246Gross storage(106m3) 254Storage for water utility (106m3) 156Reservoir area at SWL (km2) 8.4
DamType Concrete gravity
Crest elevation (EL .m) 281Crest length (m) 430Crest width (m) 8Height (m) 89Upstream slope 1:0.1Downstream slope 1:0.8Embankment volume (m3) 647,000
SpillwayType Non-gated open chutewayDesign flood (m3/s) 2,000Crest elevation (EL .m) 271Crest width (m) 44Energy dissipator Stilling basin
DiversionType TunnelDesign flood (m3/s) 450Tunnel diameter (m) 5.4Tunnel length (m) 630Number of tunnel (lanes) 1
WaterwayMaximum discharge (m3/s) 26.0Intake sill elevation (EL .m) 240Length of Waterway (m) 130
Power and EnergyMaximum plant discharge (m3/s) 26.0Maximum gross head (m) 75.0Rated head (m) 56.3Installed capacity (kW) 12,200Annual energy (GWh) 80.6
Table 6.1.4 Principal Features of Alimit No.1 Dam
Compensation for Flood Control by Magat Dam, Hydropower and Supplemental Water Supply of Magat Dam
T28

AdjustedForestArea
(km2) *1 (km2)*2 (km2)*2
1 0401 764.57 752 406.53 400 35 263 32 241 91% 19 42 0402 535.87 527 299.61 295 30 158 23 121 77% 373 0403 865.58 851 576.23 567 64 545 48 408 75% 41 954 0404 168.01 165 158.06 155 93 154 93 154 100% 05 0405 1,013.79 997 782.82 770 85 847 75 748 88% 1006 0406 1,021.34 1,004 216.49 213 26 261 5 50 19% 2 2097 0407 469.17 461 98.42 97 32 148 1 5 3% 5 1388 0408 717.12 705 117.23 115 10 71 3 21 30% 499 0409 1,044.18 1,027 194.06 191 23 236 2 21 9% 6 210
10 0410 534.75 526 200.35 197 35 184 6 32 17% 4 14811 0411 559.37 550 157.07 154 0 0 0 0 - 012 0412 519.94 511 139.21 137 0 0 0 0 - 013 0413 649.12 638 451.80 444 30 191 26 166 87% 2614 0501 898.80 884 444.28 437 57 504 31 274 54% 27 20315 0502 933.12 917 895.87 881 96 881 93 853 97% 2816 0503 517.87 509 234.77 231 53 270 32 163 60% 27 8017 0504 589.70 580 549.56 540 95 551 91 528 96% 2318 0505 583.60 574 431.34 424 70 402 57 327 81% 7519 0506 377.92 372 347.39 342 100 372 91 338 91% 3320 0507 687.14 676 530.59 522 90 608 75 507 83% 2 9921 0508 374.52 368 358.70 353 97 357 96 353 99% 422 0509 457.46 450 377.12 371 90 405 77 346 86% 5 5323 0510 385.47 379 235.96 232 91 345 61 231 67% 11424 0601 425.63 418 86.47 85 1 4 0 0 0% 425 0602 979.37 963 492.19 484 26 250 17 164 65% 51 3626 0603 1,512.91 1,487 610.03 600 67 997 29 431 43% 13 23 52927 0604 462.42 455 124.44 122 59 268 17 77 29% 19128 0605 545.98 537 376.38 370 92 494 65 349 71% 7 13829 0606 507.43 499 462.23 454 88 439 86 429 98% 1030 0607 914.26 899 702.38 691 94 845 76 683 81% 15 14731 0608 871.26 857 585.26 575 78 668 53 454 68% 7 20732 0701 3,304.32 3,249 2,640.27 2,596 77 2,501 73 2,371 95% 112 1833 0801 332.65 327 330.28 325 99 324 99 324 100% 034 0802 2,349.66 2,310 2,210.83 2,174 88 2,033 82 1,894 93% 8 1 13035 0901 874.63 860 809.24 796 85 731 79 679 93% 52
Total 27,748.93 27,281 17,633.46 17,336 17,304 13,742 28 347 3,188Notes: *1; Forest Register prepared in 1995 by JAFTA, DENR, NAMRIA, and RSRDAD.
*2; Adjustment factor of 0.983 (=27,281/27,749) is introduced in the adjustment.
Area of Re-forestation after
1993 (km2)
Proposed Reforestat-ion Area
(km2)
Table 8.2.1 Proposed Reforestation Area
Forest Compatment
Agricultural Land over
18% in Slope
Land Area over 18% in slope
Forest Area in Land over 18% in slopeForest Area
(Forest Register) (km2) *1
Catchment Area (Forest Register)
Adjusted Catchemnt
AreaY/X
No.(%) (km2), X (%) (km2), Y
T29

SAFDZ No. 1 2 3 8 x 9 10 11SAFDZ Proposed : 2020 Remaining Grasses Agro- Watershed Built-up Total
No. Present Land Use NPAAAD /Shrubs Forestry /Forestry areas1 Crop fields 608,021 7,827 0 - 0 14,474 11,023 35,094 676,4392 Livestock areas 11,901 51,909 0 - 0 2,065 0 37,583 103,4583 Fishery areas 94 6 11,803 - 0 0 0 0 11,9038 Remaining NPAAAD - - - - - - - - 0x Grasses/Shurubs 28,547 92,582 0 - 172,446 42,117 317,305 92,648 745,6459 Fruit trees, etc. incl. Agro-Forestry 27,872 257 0 - 0 8,938 34 3,758 40,85910 Forest 4 139 1,628 - 0 37,506 1,058,402 30 1,097,70911 Built-up areas 0 0 0 - 0 0 0 52,087 52,087
Total 676,439 152,720 13,431 0 172,446 105,100 1,386,764 221,200 2,728,100
Note: SAFDZ No. 4 to 7, being combination of crop, livestock and fishery, are involved to No.1 or 2, because of their small areas. Source : Present Land Use/SAFDZ; "SAFDZ data, R-2 and CAR", 1999, BSWM, R-2 & CAR Proposed Land Use in 2020; prepared by the JICA Study Team
Crop Livestock Fishery
Table 9.1.1 Present Land Use to Proposed Land Use Plan in 2020 by SAFDZ Zoning
T30

Table 9.2.1 Paddy and Corn Production Plan
Present Proposed Increse(2020) rate
(1) (2) (2)/(1)Paddy Physical area (1,000 ha)
gross 473 528 1.12net 331 396 1.20 irrigated 218 269 1.23 rainfed 113 127 1.12
Cropping Intensity (%) irrigated 170 220 1.29 rainfed 110 130 1.18
Harvested area (1,000 ha) irrigated 371 592 1.60 rainfed 124 165 1.33Total 495 757 1.53
Yield (t/ha) irrigated 3.5 4.75 1.36 rainfed 1.8 2.2 1.22
Production (1,000 t) irrigated 1,297 2,811 2.17 rainfed 224 363 1.62Total 1,521 3,174 2.09
Corn Cropping Intensity (%)
gross 137 114 0.83net 123 103 0.83
Cropping Intensity (%) 195 220 1.13 Harvested area (1,000 ha) 240 226 0.94 Yeild (t/ha) 2.1 3.75 1.79 Production (1,000 t) 505 846 1.68
Beans Cropping Intensity (%)
gross 67 35 0.52net 60 32 0.52paddy field 60
Cropping Intensity (%) 195 200 1.03 Harvested area (1,000 ha) 118 123 1.05 Yeild (t/ha) 1.0 1.5 1.50 Production (1,000 t) 118 185 1.57
Source: Present = Estimate based on data from BAS, 2000 Proposed = by the Study Team
T31

Table 9.3.1 Projected Paddy Production and Rice Supply for the whole country (The Philippines)
Year 2000 2001 2002 2003 2004 2005 2006 2007 2008 2009 2010 2011 2012 2013 2014 2015 2016 2017 2018 2019 2020
Yield (t/ha)Irrigated 3.94 3.98 4.02 4.06 4.10 4.14 4.18 4.22 4.26 4.30 4.34 4.36 4.38 4.40 4.42 4.44 4.46 4.48 4.50 4.52 4.54Rainfed 2.73 2.74 2.75 2.77 2.78 2.79 2.80 2.81 2.83 2.84 2.85 2.86 2.86 2.87 2.87 2.88 2.89 2.89 2.90 2.91 2.91
3.33 3.38 3.42 3.46 3.50 3.55 3.59 3.64 3.68 3.73 3.78 3.81 3.84 3.87 3.90 3.93 3.96 3.99 4.02 4.05 4.08Annual Rice Area
new area generation (ha) 31,000 31,000 31,000 31,000 31,000 31,000 31,000 31,000 31,000 31,000 31,000 31,000 31,000 31,000 31,000 31,000 31,000 31,000 31,000 31,000 31,000NIS 20,000 20,000 20,000 20,000 20,000 20,000 20,000 20,000 20,000 20,000 20,000 20,000 20,000 20,000 20,000 20,000 20,000 20,000 20,000 20,000 20,000CIS 11,000 11,000 11,000 11,000 11,000 11,000 11,000 11,000 11,000 11,000 11,000 11,000 11,000 11,000 11,000 11,000 11,000 11,000 11,000 11,000 11,000
Priv.physical irrigated area (1,000 ha) 1,381 1,412 1,443 1,474 1,505 1,536 1,567 1,598 1,629 1,660 1,691 1,722 1,753 1,784 1,815 1,846 1,877 1,908 1,939 1,970 2,001
NIS 701 721 741 761 781 801 821 841 861 881 901 921 941 961 981 1,001 1,021 1,041 1,061 1,081 1,101CIS 506 517 528 539 550 561 572 583 594 605 616 627 638 649 660 671 682 693 704 715 726
Priv. 174 174 174 174 174 174 174 174 174 174 174 174 174 174 174 174 174 174 174 174 174irrigated cropping intensity
NIS 1.39 1.41 1.43 1.45 1.48 1.50 1.52 1.54 1.57 1.59 1.61 1.63 1.65 1.66 1.68 1.70 1.71 1.73 1.75 1.76 1.78CIS 1.18 1.20 1.22 1.23 1.25 1.27 1.29 1.31 1.33 1.35 1.37 1.38 1.40 1.41 1.43 1.44 1.45 1.47 1.48 1.50 1.51
Priv. 1.18 1.20 1.22 1.23 1.25 1.27 1.29 1.31 1.33 1.35 1.37 1.38 1.40 1.41 1.43 1.44 1.45 1.47 1.48 1.50 1.51harvested area (1,000 ha) 1,777 1,845 1,915 1,986 2,059 2,134 2,210 2,289 2,369 2,451 2,535 2,608 2,683 2,758 2,835 2,913 2,993 3,073 3,155 3,239 3,323
NIS 974 1,017 1,061 1,106 1,152 1,199 1,248 1,297 1,348 1,400 1,453 1,501 1,548 1,597 1,647 1,697 1,748 1,800 1,853 1,907 1,962CIS 597 619 642 665 689 713 738 764 790 816 844 867 891 916 941 966 991 1,017 1,044 1,071 1,098
Priv. 205 208 212 215 218 221 225 228 231 235 238 241 243 246 248 250 253 255 258 261 263Annual harvested area (1,000 ha)
Irrigated 1,777 1,845 1,915 1,986 2,059 2,134 2,210 2,289 2,369 2,451 2,535 2,608 2,683 2,758 2,835 2,913 2,993 3,073 3,155 3,239 3,323Rainfed 1,787 1,762 1,737 1,713 1,688 1,663 1,638 1,613 1,589 1,564 1,539 1,514 1,489 1,465 1,440 1,415 1,390 1,365 1,341 1,316 1,291Total 3,564 3,607 3,652 3,698 3,747 3,797 3,849 3,902 3,958 4,015 4,074 4,123 4,172 4,223 4,275 4,328 4,383 4,439 4,496 4,554 4,614
Paddy Producton (1,000 t)Irrigated 7,001 7,342 7,696 8,063 8,442 8,834 9,239 9,659 10,092 10,540 11,003 11,373 11,751 12,137 12,532 12,935 13,347 13,769 14,199 14,639 15,088Rainfed 4,879 4,831 4,784 4,736 4,687 4,638 4,589 4,539 4,488 4,437 4,386 4,324 4,263 4,201 4,138 4,076 4,013 3,950 3,886 3,823 3,759Total 11,879 12,174 12,480 12,799 13,129 13,472 13,828 14,198 14,580 14,977 15,389 15,697 16,013 16,338 16,670 17,011 17,360 17,719 18,086 18,462 18,847
Seeds, feeds, wasted (9.5 %) (1,000 t) 1,129 1,157 1,186 1,216 1,247 1,280 1,314 1,349 1,385 1,423 1,462 1,491 1,521 1,552 1,584 1,616 1,649 1,683 1,718 1,754 1,790Paddy for Consumption (1,000 t) 10,751 11,017 11,295 11,583 11,882 12,192 12,515 12,849 13,195 13,555 13,927 14,206 14,492 14,786 15,086 15,395 15,711 16,035 16,367 16,708 17,056Miling Recovery Rate 0.66 0.66 0.66 0.66 0.66 0.66 0.66 0.66 0.66 0.66 0.66 0.66 0.66 0.66 0.66 0.66 0.66 0.66 0.66 0.66 0.66Rice for Consumption (1,000 t) 7,095 7,271 7,455 7,645 7,842 8,047 8,260 8,480 8,709 8,946 9,192 9,376 9,565 9,758 9,957 10,161 10,369 10,583 10,803 11,027 11,257
DemandPopulation (Million) 76.320 77.898 79.476 81.054 82.637 84.215 85.769 87.312 88.841 90.355 91.851 93.328 94.783 96.216 97.625 99.008 100.366 101.697 102.997 104.267 105.503
Per Capita Demand (kg) 101.6 102.0 102.4 102.8 103.2 103.6 104.1 104.5 104.9 105.3 105.7 106.2 106.6 107.0 107.4 107.9 108.3 108.7 109.2 109.6 110.0Total Demand (1,000 t) 7,754 7,946 8,139 8,334 8,531 8,729 8,925 9,122 9,319 9,516 9,712 9,908 10,102 10,296 10,489 10,680 10,870 11,058 11,244 11,428 11,610
Surplus(+)/Deficit(-) (1,000 t) (659) (675) (685) (690) (689) (682) (666) (642) (610) (570) (520) (532) (538) (538) (532) (519) (500) (475) (442) (401) (353)Surplus(+)/Deficit(-) percentage -8.5% -8.5% -8.4% -8.3% -8.1% -7.8% -7.5% -7.0% -6.5% -6.0% -5.4% -5.4% -5.3% -5.2% -5.1% -4.9% -4.6% -4.3% -3.9% -3.5% -3.0%
Reference: "Corporate Plan, 1993-2002", Jun. 1993, NIA, p.62 Table 6.2 "The Study on Strengthening og NIA's Management System, Draft Final Report, August 2001", JICA
T32

Table 9.3.2 List of Candidate Scheme for Proposed Irrigation Development in Long Term Plan
FC=Flood ControlWithout Additional
Location Irrigation Area FC to FCCandidate Scheme for Long Term Plan *1 Total New/ Rehabili./ Financial
Province Municipality extension improve't Cost Benefit Benefit(ha) (ha) (ha) (mil.P) (mil.P/yr) (mil.P/yr)
I. Affected by Flood (Need Flood Control)1. Alcala Amulung West Irrigation Project AAWPIP Cagayan Alcala, Amulung 7,700 7,700 1,527 - 556
Stage I (4,000) 980 219 - 2. Solana Pump Irrigation System-Reh. & Ext. Project SPIS-REP (*) Cagayan Solana 7,880 5,100 2,780 1,071 - 475
Stage I (3,000) 504 288 - 3. Mamil Pump Irrigation Project MPIP Cagayan Enrile 563 563 115 18 364. Santa Isabel Pump Irrigation Project SIPIP Isabela Gamu 1,000 1,000 206 34 615. Damao Pump Irrigation Project DPIP Isabela Gamu 1,000 1,000 209 32 646. Lapogan Pump Irrigation Project LPIP Isabela Tumauini 400 400 93 13 267. Lulutan Pump Irrigation Project LAPIP Isabela Gamu 3,800 3,800 782 140 2318. Gamu Pump Irrigation Project GPIP Isabela Gamu 400 400 80 12 249. Enrile Pump Irrigation Project EPIP Cagayan Enrile 3,100 3,100 588 168 241
10. Zinundungan Irrigation Extension Project ZIEP (*) Cagayan Lasam 3,495 2,045 1,450 920 179 22411. Lallo West Pump Irrigation Project LWPIP Cagayan Lallo 900 900 196 48 6012. Nassiping Pump Irrigation Project NPIP Cagayan Gattaran 765 765 149 46 55
Rehabilitation of CIADP (Magapit & Iguig-Alcala-Amulung PISs) 376 215 32413. Magapit Pump Irrigation System MPIS * Cagayan Lallo 10,914 10,91414. Iquig-Alcala-Amulung Pump Irrigation System IAAPIS * Cagayan Iguig, Amulung 2,306 2,30615. Dummun River Irrigation System DRIS * Cagayan Gattaran 1,802 1,802 1,015 80 10116. Pinacanuan River Irrgation System PRIS * Cagayan Penablanca 880 880 91 45 5617. San Pablo-Cabagan Irrigation System SPCIS * Isabela San Pablo 1,273 1,273 108 52 6518. Santa Maria Communal Pump Irrigation System SMPIS * Isabela Sta. Maria 690 690 58 28 3519. Delfin Albano Pump Irrigation Project DAPIP Isabela Delfine Albano 2,445 2,445 502 145 18120. Tumauini Multipurpose (Reservoir) Project TRP (*) Isabela Tumauini 6,600 2,985 3,615 2,349 524 65421. Upper Chico River Irrigation System UCRIS * Kal./Isa. Tabuk/Quezon 17,551 17,551 1,326 646 80722. Mallig River Irrigation System MRIS * Isabela Mallig. Quezon 2,427 2,427 166 100 12723. Nueva Vizcaya Bagabag Irrigation System NVBIS * N. Viz. Bagabag 2,160 2,160 125 81 10524. Ilagan Pump IrrigationProject IPIP Isabela Ilagan 5,000 5,000 1,184 276 29225. Napaccu Pump Irrigation Project NAPIP Isabela Reina Mercedes 1,000 1,000 216 47 5926. Tagaran Pump Irrigation Project TPIP Isabela Cauayan 500 500 106 25 2827. Reina Mercedes Pump Irrigation Project RMPIP Isabela Reina Mercedes 900 900 195 42 5228. Sto. Nino Pump Irrigation Project SNPIP Cagayan Sto Nino 1,200 1,200 240 65 69
Total 88,651 40,803 47,848 14,293 3,567 5,008
II. No Need of Flood Control1. Upper Ilagan Western Brgy. Pump Irrigation Project UIWBPIP Isabela Ilagan 3,000 3,000 648 162 - 2. San Agustin Pump Irrigation Project SAPIP Isabela San Agustin 22,700 22,700 5,376 1,271 - 3. Dibuluan River Irrigation Project DRIP Isabela San Agustin 3,000 3,000 738 221 - 4. Dabubu Irrigation Project DIP Isabela San Agustin 1,000 1,000 312 75 - 5. Rizal Irrigation Project RIP Kalinga Rizal 1,500 1,500 465 116 - 6. Baggao Irrigation System BIS * Cagayan Baggao 2,067 2,067 1,306 65 - 7. Lower Chico River Irrigation System LCRIS * Cagayan Tuao 1,856 1,856 134 71 - 8. Bantug Pump Irrigation System BPIS * Isabela Angadanan 150 150 13 6 - 9. San Mariano Pump Irrigation Project SMPIP Isabela San Mariano 400 400 88 26 -
10. East Tabacal Pump Irrigation Project ETPIP Isabela Cauayan 1,800 1,800 407 101 - 11. Debibi Groundwater IP DGIP Quirino Cabarruguis 4,000 4,000 640 15912. Villaverde IP VIP N.Viz. Villaverde 3,000 3,000 451 112 -
Total 44,473 40,400 4,073 10,578 2,385 -
New / Extension Project (including combined one) 28 schemes 81,203 81,203 20,529 4,779 3,712Rehabilitation / Improvement Project 12 schemes 51,921 51,921 4,341 1,173 1,296
GRAND TOTAL 40 schemes 133,124 81,203 51,921 24,870 5,952 5,008
Note: *1: Blank = New / Extension Project
* = Rehabilitation / Improvement Project (*) = Combination of New/Ext. and Reh./Imp.
*2: On-going projects are not presented.
T33

Table 9.3.3 List of Candidate Scheme for Proposed Irrigation Development in Long Term Plan and Reviewed Master Plan
FC=Flood ControlEIRR (%) Candidate for Reviewed M/P EIRR (%) Pipeline New/ext. Reh/imp
Location Without Additional Both (1) Long ref. to Subsec.10.8.3 (3) Without project in CO project project Reviewed Reviewed M/PCandidate Scheme for Long Term Plan *1 FC to FC and (2) Term (Package 1- Without FC (3) < 15 % and matuted EIRR EIRR Master New NIA
Province Municipality (1) (2) < 15 % Plan irrigation component) FC (3) project in R-2 >=16.5%: O >=25%: O Plan fund regularIL IS in Rev.MP <16.5%: X <25%: X fund
I. Affected by Flood (Need Flood Control)1. Alcala Amulung West Irrigation Project AAWPIP Cagayan Alcala, Amulung 15.5*2 22.8 O O - O ---> ---> O O -2. Solana Pump Irrigation System-Reh. & Ext. Project SPIS-REP (*) Cagayan Solana 26.7*2 25.0 O O - ---> ---> O O -3. Mamil Pump Irrigation Project MPIP Cagayan Enrile 11.1 19.9 O - O y 11.1 X - - -4. Santa Isabel Pump Irrigation Project SIPIP Isabela Gamu 11.7 18.1 O - O y 11.7 X - - -5. Damao Pump Irrigation Project DPIP Isabela Gamu 10.6 19.2 O - - y 10.6 X - - -6. Lapogan Pump Irrigation Project LPIP Isabela Tumauini 9.6 19.0 O - - y 9.6 X - - -7. Lulutan Pump Irrigation Project LAPIP Isabela Gamu 12.3 18.1 O - - y 12.3 X - - -8. Gamu Pump Irrigation Project GPIP Isabela Gamu 10.9 18.5 O - - y 10.9 X - - -9. Enrile Pump Irrigation Project EPIP Cagayan Enrile 17.8 23.1 O O - ---> ---> O O -
10. Zinundungan Irrigation Extension Project ZIEP (*) Cagayan Lasam 16.3 18.8 O - O ---> ---> O O -11. Lallo West Pump Irrigation Project LWPIP Cagayan Lallo 16.5 19.5 O - O ---> ---> O O -12. Nassiping Pump Irrigation Project NPIP Cagayan Gattaran 18.5 21.8 O - O O ---> ---> O O -
Rehabilitation of CIADP (Magapit & Iguig-Alcala-Amulung PISs) 26.7 31.0 O ---> ---> O O -13. Magapit Pump Irrigation System MPIS * Cagayan Lallo O - O14. Iquig-Alcala-Amulung Pump Irrigation System IAAPIS * Cagayan Iguig, Amulung O O -15. Dummun River Irrigation System DRIS * Cagayan Gattaran 8.6 10.3 X - - - -16. Pinacanuan River Irrgation System PRIS * Cagayan Penablanca 28.2 31.9 O - O y 28.2 - O O O -17. San Pablo-Cabagan Irrigation System SPCIS * Isabela San Pablo 23.1 27.0 O - O y 23.1 - O O O -18. Santa Maria Communal Pump Irrigation System SMPIS * Isabela Sta. Maria 23.1 27.3 O - O y 23.1 - O O - O19. Delfin Albano Pump Irrigation Project DAPIP Isabela Delfine Albano 18.5 21.8 O - O y 18.5 O ---> ---> O O -20. Tumauini Multipurpose (Reservoir) Project TRP (*) Isabela Tumauini 17.8 20.4 O - O y 17.8 O ---> ---> O O -21. Upper Chico River Irrigation System UCRIS * Kal./Isa. Tabuk/Quezon 27.8 31.4 O - - y 27.8 - O - - -22. Mallig River Irrigation System MRIS * Isabela Mallig. Quezon 31.5 35.5 O - - y 31.5 - O O O -23. Nueva Vizcaya Bagabag Irrigation System NVBIS * N. Viz. Bagabag 33.0 37.1 O - - y 33.0 - O O O -24. Ilagan Pump IrrigationProject IPIP Isabela Ilagan 16.5 17.2 O - - y 16.5 O - O - O25. Napaccu Pump Irrigation Project NAPIP Isabela Reina Mercedes 15.2 18.2 O - - y 15.2 X - - - -26. Tagaran Pump Irrigation Project TPIP Isabela Cauayan 15.2 17.7 O - - y 15.2 X - - - -27. Reina Mercedes Pump Irrigation Project RMPIP Isabela Reina Mercedes 15.0 17.5 O - - y 15.0 X - - - -28. Sto. Nino Pump Irrigation Project SNPIP Cagayan Sto Nino 16.8 17.6 O - - y 16.8 O - O O -
Total 27 4 11 16 14 2
II. No Need of Flood Control1. Upper Ilagan Western Brgy. Pump Irrigation ProjectUIWBPIP Isabela Ilagan 16.8 - O - - - 16.8 O - O - O2. San Agustin Pump Irrigation Project SAPIP Isabela San Agustin 16.1 - O - - - 16.1 X - - - - 3. Dibuluan River Irrigation Project DRIP Isabela San Agustin 19.8 - O - - - 18.4 O ---> ---> O - O4. Dabubu Irrigation Project DIP Isabela San Agustin 18.6 - O - - - 18.6 O - O O - 5. Rizal Irrigation Project RIP Kalinga Rizal 19.1 - O - - - 16.6 O ---> ---> O - O6. Baggao Irrigation System BIS * Cagayan Baggao 7.0 - X - - - - 7. Lower Chico River Irrigation System LCRIS * Cagayan Tuao 29.0 - O - - - 29.0 - O O - O8. Bantug Pump Irrigation System BPIS * Isabela Angadanan 22.8 - O - - - 22.8 - X - - - 9. San Mariano Pump Irrigation Project SMPIP Isabela San Mariano 17.8 - O - - - 17.8 O ---> ---> O - O
10. East Tabacal Pump Irrigation Project ETPIP Isabela Cauayan 16.1 - O - - - 16.1 X - - - - 11. Debibi Groundwater IP DGIP Quirino Cabarruguis 17.0 - O - - - 16.1 O ---> ---> O - O12. Villaverde IP VIP N.Viz. Villaverde 17.0 - O - - - 16.1 O ---> ---> O - O
Total 11 0 0 8 1 7
GRAND TOTAL 40 schemes 38 4 11 24 15 9
Note: *1: Blank = New / Extension Project *2: Stage 1
* = Rehabilitation / Improvement Project ***: O = selected(*) = Combination of New/Ext. and Reh./Imp. X = postponed
**: On-going projects are not presented. y, Y = yes
T34

Table 10.4.1 Comparison of Long Term Plans in 1987 Master Plan and Reviewed Master Plan
Long Term Plan in 1987 Master Plan Long Term Plan in Reviewed Master Plan
Study Area: Whole Cagayan River Basin Design Flood: 25 Years Probable Flood
Study Area: Whole Cagayan River Basin Design Flood: 25 Years Probable Flood
(A) Multipurpose Dam Projects
1) Siffu No.1 Dam Project 1) Siffu No.1 Dam Project
2) Mallig No.2 Dam Project 2) Mallig No.2 Dam Project
3) Matuno No.1 Dam Project 3) Matuno No.1 Dam Project
4) Alimit No.1 Dam Project 4) Alimit No.1 Dam Project
5) Magat Dam 5) Magat Dam
(B) Flood Control Schemes
Structural Measures
1) Dike embankment including revetment and sluice along the main Cagayan River and major tributaries
1) Dike embankment including revetment, sluice and riverbank tree zone along the main Cagayan River and major tributaries
- in the main Cagayan River - in the main Cagayan River - in major tributaries including Siffu, Ilagan
and Magat River - in major tributaries including Siffu, Ilagan
and Magat River
2) Narrow excavation at Nassiping Not adopted 3) Cut-off channel works 2) Cut-off channel works
- in the main Cagayan River at Gabut and San Isidro
- in the main Cagayan River at Gabut, San Isidro and Tuguegarao
- in Magat, Siffu and Mallig Rivers - in Magat, Siffu and Mallig Rivers
4) Bank protection (75 sites) 3) Bank protection (73 sites)
5) Flood control dams (Single purpose) 4) Flood control dams (Single purpose) - Cagayan No.1 dam - Cagayan No.1 dam - Ilagan No.1 dam - Ilagan No.1 dam
Non-structural Measures
1) Evacuation system (FFWS, Evacuation center)
2) Resettlement
Supporting Measures
1) Strengthening of institution and organization
(C) Watershed Management Schemes
1) Reforestation plan (Reforestation area 3,188 km2)
2) Sabo works plan (26 Sabo dams)
(D) Agricultural Development Schemes
Structural Measures
1) New irrigation/ extension schemes (9 schemes, total 65,330 ha) including Chico Mallig and Matuno (multipurpose project)
1) New irrigation/ extension schemes (28 schemes, total 81,203 ha)
2) Irrigation rehabilitation/ improvement schemes (5 schemes, total 12,212 ha)
2) Irrigation rehabilitation/ improvement schemes (10 schemes, total 48,052 ha)
3) Diversified crop land (170,000 ha) 3) Diversified crop land (148,400 ha)
4) Permanent crop land (200,000 ha) 4) Permanent crop land (277,600 ha)
5) Pasture land (300,000 ha) 5) Pasture land (153,300 ha)
6) Fresh water fisheries 6) Fresh water fisheries
7) Magat O&M improvement 7) Magat O&M improvement
Supporting Measures
1) Continuation and enhancement of on-going agriculture support services
2) Strengthening of support system for irrigation system through establishment of rural development center
3) Enhancement of marketing and transportation system
4) Establishment of upland development experimental center
(E) Hydropower Development Schemes
1) Ibulao scheme (Run-of-river type) 1) Ibulao scheme (Run-of-river type)
2) Tanudan scheme (Run-of-river type) 2) Tanudan scheme (Run-of-river type)
3) Diduyon scheme with Diduyon dam 3) Diduyon scheme with Diduyon dam
T35

(Unit: 1,000 ha)Land Use Present Proposed Increase/ Remarks
(2020) decrease (-) Agricultural area
Rice field 472.5 528.0 55.5 in grossCorn field 137.3 113.8 -23.5Other diversfied cropland 66.6 34.6 -32.0Sub-total 676.4 676.4 0.0
GrasslandPasture 103.5 152.7 49.2Wild grass 471.4 108.4 -363.0Shrub 274.2 63.6 -210.6Sub-total 849.1 324.7 -524.4
Agro-Forest 40.9 105.1 64.2
Forest 1,097.5 1,386.8 289.3
OthersSlash and Burn Cultivation 0.2 0.0 -0.2 KainginFishpond (controlled) 11.9 13.9 2.0Built-up areas 52.1 221.2 169.1Sub-total 64.2 235.1 170.9
Total 2,728.1 2,728.1 -0.0
Table 10.6.1 Proposed Land Use Plan
T36

Alluvial Plain Remarks
non-irrigated irrigated
Vegetation/ corn- corn corn- tabaco paddy- fallow paddy- paddy brush upl.crp. forestagricultural peanut upl.crp grass vegetable brushland use veget. pasture fruits grass
sugarcane paddy*1 *1: terrace type field
Flood hazard inundation several times/year ……… once/several years *2: river cross-section changed period: 2-7 days / depth: 2-5 m in 1973 from deep narrow one
related problem channel course change siltation*2 to shallow wide one (APC)
Land use plan *3: inundation less than 3-dayby irrigation/extension by rehabilitation = not so serious (DA-02, APC)
/improvement improved paddy-paddy, paddy-paddy-veg. paddy-paddy-bean/vegetables
example corn- water melon/vegetable paddy-paddy-corn pasture *4: Alcala-Amulung West PIP*4 *5 *5: IAAPIS, SPIS
agr-intensity middle high high high low
irrigation water source river river river (larger scale) stream/pond
reservoir groudwater groundwater (small scale)
intake pump up from the Cagayan River lower reach weir from tributary
distribution gravity gravity/pump
Table 10.6.2 Present Land Use and Example of Agricultural Development Plan
Mountanous area village, etc.mostly river sidehigher
lower middle
Undulated/hilly area
gravity/pump
soil erosion
slope slide
very high
vegetable/fruits
by spray/drip irrigation
with flood control*3
streamspring
natural
T37

Table 10.6.3 Comparison of Irrigation NIS/NIP in 1987 Master Plan and in 1999
(Unit: ha) 1987 Master Plan Status in 1999 Difference
Service area Proposed project Existing service area On-going project Programmed project inNIS and Proposed NIP in 1987 MP Existing On-going Existing New Rehabili- converted Rehabili- Extension Restored listed Rehabili- NIS area Remarksand NIS/NIP by NIA in 1999 NIS NIS other sys. develop't tation NIS to CIS tation (new) NIP tation (11)
(1) (2) (3) (4) (5) (6) (7) (8) (9) (10) (11) (12) = (6) - (1)Existing NIS Service Area and Its Change 131,480 139,893 8,413 (1)+(2)= 150,797
(6)-(1)-(2)= -10,904 1. Existing System ( partly with Rehbili./Exten. ) (131,480) (12,212)
Dummon River Irrigation System DRIS 2,070 2,070 1,802 317 -268Zinundungan River Irrigation System ZRIS 1,760 2,045 977 285Baggao Irrigation System BIS 1,812 1,812 2,067 62 453 255Solana-Tuguegarao Irrigation System 3,143 3,143 2,777 500 -366 SPIS: Solana PISPinacanauan River Irrigation System PRIS 1,200 1,200 880 305 -320Tumauini Irrigation System TIS 3,987 3,987 3,615 1,130 91 6,600 -372 Multipurpose Project: FS/IP preparedChico River Irrigation System CRIP 20,108 1,856 -701 LCRIS: Lower Chico RIS
9,842 UCRIS: Upper Chico RIS-Quezon7,709 Phase I: 17,551ha fm NIA CAR
Magat River Integrated Irrigation System MRIIS 97,400 88,370 -9,030
2. On-going Project at the time of 1987MP (19,317)San Pablo-Cabagan Irrigation Project SPCIS 2,890 1,273 386 35 370 1,273Mallig River Irrigation Project MRIS 2,427 2,427 1,650 2,427Cagayan Integrated Agricultural Development 14,000 2,306 670 13,220 IAAPIS: Iguig Alcala Amulung PISProject CIADP 10,914 1,870 290 MPIS: Magapit PIS
3. Proposed New Project 1987MP (11,540) (53,790)Zinundungan Irrigation Extension Project 150 1,600 partly implemented or not?Alcala-Amulung West Irrigation Project 6,750 2,500 AAWPIP, FSChico Mallig Irrigation Project 2,100 29,100 FS of Rizal IP conducted in KalingaTuguegarao Irrigation Project 1,400 202 TPISLulutan Irrigation Project 2,950 4,000 SIPIP: Sta.Isabela PIPIlagan Irrigation Project 60 3,140 1,000 LPIP:Gappal Irrigation Project 4,400 400 400 GCIP(S), mostly shifted to SAPIPMatuno River Irrigation Project 9,230 3,450 650 12,600
3232,010 2,010 Nueva Vizcaya Bagabag Irr,Sys.?
Dabubu River IrrigationProject 1,000 1,000 DIP: Dabubu IP
4. Newly Proposed Project (after 1987 MP) in 1999Addalam River Irrigation Project ARIP 5,830 incl.hilly grassland, EL<100mDibuluan River Irrigation Project DRIP 3,000 incl.hilly grassland, EL<200mSanta Isabel Pump Irrigation Project SIPIP 4,000San Agustin Pump Irrigation Project SAPIP 22,700 group of river bank lowlandRizal Irrgation Project RIP 1,500Delfine Albano Pump Irrigation Project DAPIP 2,445 part of Mallig Multipurpose PjtUpper Ilagan Western Brgy. Pump Irr. Pjt UIWBPIP 3,000 detached from MRIISDammao Pump Irrigation Project DPIP 1,000 detached from MRIIS
Source: (1) - (6); "Final Report for The Master Plan Study on The Cagayan River Basin Water Resources Development", Aug.1987,JICA (7) - (12); Tables prepared by NIA, R-02
T38

Table 10.6.4 Candidate and Selected Scheme for Proposed Irrigation Development in Reviewed Master PlanFC=Flood Control
EIRR (%) Candidate for Reviewed M/P EIRR (%) Pipeline New/ext. Reh/imp Location Without Additional ref. to Subsec.10.8.3 (3) Without project in CO project project Reviewed Reviewed M/P
Candidate Scheme for Long Term Plan *1 FC to FC (Package 1- Without FC (3) < 15 % and matuted EIRR EIRR Master New NIAProvince Municipality (1) (2) irrigation component) FC (3) project in R-2 >=16.5%: O >=25%: O Plan fund regular
IL IS in Rev.MP <16.5%: X <25%: X fund
I. Affected by Flood (Need Flood Control)1. Alcala Amulung West Irrigation Project AAWPIP Cagayan Alcala, Amulung 15.5*2 22.8 O - O ---> ---> O O -2. Solana Pump Irrigation System-Reh. & Ext. Project SPIS-REP (*) Cagayan Solana 26.7*2 25.0 O - ---> ---> O O -3. Mamil Pump Irrigation Project MPIP Cagayan Enrile 11.1 19.9 - O y 11.1 X - - -4. Santa Isabel Pump Irrigation Project SIPIP Isabela Gamu 11.7 18.1 - O y 11.7 X - - -5. Damao Pump Irrigation Project DPIP Isabela Gamu 10.6 19.2 - - y 10.6 X - - -6. Lapogan Pump Irrigation Project LPIP Isabela Tumauini 9.6 19.0 - - y 9.6 X - - -7. Lulutan Pump Irrigation Project LAPIP Isabela Gamu 12.3 18.1 - - y 12.3 X - - -8. Gamu Pump Irrigation Project GPIP Isabela Gamu 10.9 18.5 - - y 10.9 X - - -9. Enrile Pump Irrigation Project EPIP Cagayan Enrile 17.8 23.1 O - ---> ---> O O -
10. Zinundungan Irrigation Extension Project ZIEP (*) Cagayan Lasam 16.3 18.8 - O ---> ---> O O -11. Lallo West Pump Irrigation Project LWPIP Cagayan Lallo 16.5 19.5 - O ---> ---> O O -12. Nassiping Pump Irrigation Project NPIP Cagayan Gattaran 18.5 21.8 - O O ---> ---> O O -
Rehabilitation of CIADP (Magapit & Iguig-Alcala-Amulung PISs) 26.7 31.0 O ---> ---> O O -13. Magapit Pump Irrigation System MPIS * Cagayan Lallo - O14. Iquig-Alcala-Amulung Pump Irrigation System IAAPIS * Cagayan Iguig, Amulung O -15. Pinacanuan River Irrgation System PRIS * Cagayan Penablanca 28.2 31.9 - O y 28.2 - O O O -16. San Pablo-Cabagan Irrigation System SPCIS * Isabela San Pablo 23.1 27.0 - O y 23.1 - O O O -17. Santa Maria Communal Pump Irrigation System SMPIS * Isabela Sta. Maria 23.1 27.3 - O y 23.1 - O O - O18. Delfin Albano Pump Irrigation Project DAPIP Isabela Delfine Albano 18.5 21.8 - O y 18.5 O ---> ---> O O -19. Tumauini Multipurpose (Reservoir) Project TRP (*) Isabela Tumauini 17.8 20.4 - O y 17.8 O ---> ---> O O -20. Upper Chico River Irrigation System UCRIS * Kal./Isa. Tabuk/Quezon 27.8 31.4 - - y 27.8 - O - - -21. Mallig River Irrigation System MRIS * Isabela Mallig. Quezon 31.5 35.5 - - y 31.5 - O O O -22. Nueva Vizcaya Bagabag Irrigation System NVBIS * N. Viz. Bagabag 33.0 37.1 - - y 33.0 - O O O -23. Ilagan Pump IrrigationProject IPIP Isabela Ilagan 16.5 17.2 - - y 16.5 O - O - O24. Napaccu Pump Irrigation Project NAPIP Isabela Reina Mercedes 15.2 18.2 - - y 15.2 X - - - -25. Tagaran Pump Irrigation Project TPIP Isabela Cauayan 15.2 17.7 - - y 15.2 X - - - -26. Reina Mercedes Pump Irrigation Project RMPIP Isabela Reina Mercedes 15.0 17.5 - - y 15.0 X - - - -27. Sto. Nino Pump Irrigation Project SNPIP Cagayan Sto Nino 16.8 17.6 - - y 16.8 O - O O -
Total 4 11 16 14 2
II. No Need of Flood Control1. Upper Ilagan Western Brgy. Pump Irrigation ProjectUIWBPIP Isabela Ilagan 16.8 - - - - 16.8 O - O - O2. San Agustin Pump Irrigation Project SAPIP Isabela San Agustin 16.1 - - - - 16.1 X - - - - 3. Dibuluan River Irrigation Project DRIP Isabela San Agustin 18.4 - - - - 19.8 O ---> ---> O - O4. Dabubu Irrigation Project DIP Isabela San Agustin 18.6 - - - - 18.6 O - O O - 5. Rizal Irrigation Project RIP Kalinga Rizal 16.6 - - - - 19.1 O ---> ---> O - O6. Lower Chico River Irrigation System LCRIS * Cagayan Tuao 29.0 - - - - 29.0 - O O - O7. Bantug Pump Irrigation System BPIS * Isabela Angadanan 22.8 - - - - 22.8 - X - - - 8. San Mariano Pump Irrigation Project SMPIP Isabela San Mariano 17.8 - - - - 17.8 O ---> ---> O - O9. East Tabacal Pump Irrigation Project ETPIP Isabela Cauayan 16.1 - - - - 16.1 X - - - -
10. Debibi Groundwater IP DGIP Quirino Cabarruguis 16.1 - - - - 17.0 O ---> ---> O - O11. Villaverde IP VIP N.Viz. Villaverde 16.1 - - - - 17.0 O ---> ---> O - O
Total 0 0 8 1 7
GRAND TOTAL 38 schemes 4 11 24 15 9
Note: *1: Blank = New / Extension Project *2: Stage 1
* = Rehabilitation / Improvement Project ***: O = selected(*) = Combination of New/Ext. and Reh./Imp. X = postponed
**: On-going projects are not presented. y, Y = yes
T39

Table 10.6.5 List of Proposed Irrigation Development Scheme in Reviewed Master Plan and Selection of Pre-Feasibility Study Project
FC=Flood ControlWithout Additional Selection of Pre-FS Project (if yes, 1 point)
Location Irrigation FC to FC Related Preparedness Equitable develop'tProposed Scheme for Reviewed Master Plan *1 Area Financial FC: NIA FS Except without Total Pre-FS
Province Municipality Cost Benefit Benefit proposed 10-year DE Isabela highway point(ha) (mil.P) (mil.P/yr) (mil.P/yr) in Rev.MP program province:
To be implemented by New Funding SourceI. Affected by Flood (Need Flood Control)
1. Alcala Amulung West Irrigation Project AAWPIP Cagayan Alcala, Amulung 7,700 1,527 - 556 1 1 1 1 1 5 O Stage I (4,000) 980 219 -
2. Solana Pump Irrigation System-Reh. & Ext. Project SPIS-REP (*) Cagayan Solana 7,880 1,071 - 475 1 0 0 1 0 2 Stage I (3,000) 504 288 -
3. Enrile Pump Irrigation Project EPIP Cagayan Enrile 3,100 588 168 241 1 0 0 1 0 24. Zinundungan Irrigation Extension Project ZIEP (*) Cagayan Lasam 3,495 920 179 224 1 0 0 1 1 35. Lallo West Pump Irrigation Project LWPIP Cagayan Lallo 900 196 48 60 1 0 0 1 0 26. Nassiping Pump Irrigation Project NPIP Cagayan Gattaran 765 149 46 55 1 1 1 1 0 47. Rehabilitation of CIADP (Magapit & Iguig-Alcala-Amulung PISs * = MPIS + IAAPIS 376 215 324 1 1 1 1 0 4
Magapit Pump Irrigation System MPIS - Cagayan Lallo 10,914Iquig-Alcala-Amulung Pump Irrigation System IAAPIS - Cagayan Iguig, Amulung 2,306
8. Pinacanuan River Irrgation System PRIS * Cagayan Penablanca 880 91 45 56 0 0 0 1 0 19. San Pablo-Cabagan Irrigation System SPCIS * Isabela San Pablo 1,273 108 52 65 0 0 0 0 0 0
10. Delfin Albano Pump Irrigation Project DAPIP Isabela Delfine Albano 2,445 502 145 181 0 0 1 0 1 211. Tumauini Multipurpose (Reservoir) Project TRP (*) Isabela Tumauini 6,600 2,349 524 654 0 1 1 0 0 212. Mallig River Irrigation System MRIS * Isabela Mallig. Quezon 2,427 166 100 127 0 0 0 0 0 013. Nueva Vizcaya Bagabag Irrigation System NVBIS * N. Viz. Bagabag 2,160 125 81 105 0 0 0 1 0 114. Sto. Nino Pump Irrigation Project SNPIP Cagayan Sto Nino 1,200 240 65 69 0 0 0 1 1 2
Total 54,045 8,409 2,174 3,193
II. No Need of Flood Control1. Dabubu Irrigation Project DIP Isabela San Agustin 1,000 312 75 - 0 1 0 0 1 2
Total 1,000 312 75 -
New / Extension Project (including combined one) 10 schemes 30,768Rehabilitation / Improvement Project 5 schemes 24,277
TOTAL 15 schemes 55,045
To be implemented by NIA Regular FundI. Affected by Flood (Need Flood Control)
1. Ilagan Pump IrrigationProject IPIP Isabela Ilagan 5,000 1,184 276 292 0 0 0 0 1 12. Santa Maria Communal Pump Irrigation System SMPIS * Isabela Sta. Maria 690 58 28 35 0 0 0 0 1 1
Total 5,690 1,241 305 327II. No Need of Flood Control
1. Dibuluan River Irrigation Project DRIP Isabela San Agustin 3,000 738 221 - 0 1 0 0 1 22. Rizal Irrigation Project RIP Kalinga Rizal 1,500 465 116 - 0 1 1 1 1 43. San Mariano Pump Irrigation Project SMPIP Isabela San Mariano 400 88 26 - 0 0 1 0 1 24. Lower Chico River Irrigation System LCRIS * Cagayan Tuao 1,856 134 71 - 0 0 0 1 1 25. Upper Ilagan Western Brgy. Pump Irrigation Project UIWBPIP Isabela Ilagan 3,000 648 162 - 0 0 0 0 1 16. Debibi Groundwater IP DGIP Quirino Cabarruguis 4,000 640 159 0 1 0 1 1 37. Villaverde IP VIP N.Viz. Villaverde 3,000 451 112 - 0 1 0 1 1 3
Total 16,756 3,164 867 0
New / Extension Project (including combined one) 7 schemes 19,900Rehabilitation / Improvement Project 2 schemes 2,546
TOTAL 9 schemes 22,446
Grand Total Note:New / Extension Project (including combined one) 17 schemes 50,668 *1: Blank = New / Extension ProjectRehabilitation / Improvement Project 7 schemes 26,823 * = Rehabilitation / Improvement Project
(*) = Combination of New/Ext. and Reh./Imp. TOTAL 24 schemes 77,491
T40

Table 10.7.1 Comparison between 1987 Master Plan and Reviewed Master Plan
1987 Master Plan Reviewed Master Plan
Study Area: Whole Cagayan River Basin
Design Flood: 25 Years Probable Flood
Study Area: Whole Cagayan River Basin
Design Flood: 25 Years Probable Flood
(A) Multipurpose Dam Projects
1) Siffu No.1 Dam Project 1) Siffu No.1 Dam Project ○
2) Mallig No.2 Dam Project Not adopted
3) Matuno No.1 Dam Project 2) Matuno No.1 Dam Project
4) Alimit No.1 Dam Project Not adopted
5) Magat Dam (supplement of a part of deficit in Magat project by
Siffu No.1 dam)
(B) Flood Control Schemes
Structural Measures
1) Dike embankment including revetment and sluice 1) Dike embankment including revetment, sluice and
riverbank tree zone
- Tuguegarao dike - in the main Cagayan River from river mouth to
Tuguegarao ○
- Cabagan dike - Not adopted
2) Narrow excavation at Nassiping
- Left side bank of lower portion, Nassiping (NLL) - Not adopted
- Right side bank of lower portion, Nassiping (NLR) - Not adopted
2) Cut-off channel works
- in the main Cagayan River at Gabut, San Isidro and
Tuguegarao ○
3) Bank protection (75 sites) 3) Bank protection (73 sites)
- 21 sites from river mouth to Cabagan in main Cagayan
River ○
- 52 sites upstream from Tumauini in main Cagayan,
Siffu, Mallig, Ilagan, and Magat River ○
Non-structural Measures
1) Evacuation system (FFWS, Evacuation center) ○
2) Resettlement ○
Supporting Measures
1) Strengthening of institution and organization ○
(C) Watershed Management Schemes
1) Reforestation plan (Reforestation area 3,188 km2)
2) Sabo works plan (26 Sabo dams)
(D) Agricultural Development Schemes
Structural Measures
1) New irrigation/ extension schemes (9 schemes, total
65,530 ha) including Chico Mallig and Matuno
(multipurpose project)
1) New irrigation/ extension schemes (17 schemes, total
54,985 ha)
- by new fund (10 schemes, total 35,085 ha) ○
- by NIA regular fund (7 schemes, total 19,900 ha)
2) Irrigation rehabilitation/ improvement schemes (5
schemes, total 11,898 ha)
2) Irrigation rehabilitation/ improvement schemes (7
schemes, total 22,506 ha)
- by new fund (5 schemes, total 19,960 ha) ○
- by NIA regular fund (2 schemes, total 2,546 ha)
3) Diversified crops development (170,000 ha) 3) Diversified crops development (148,400 ha)
4) Permanent crops development (57,000 ha) 4) Permanent crops development (105,100 ha)
5) Pasture land development (210,000 ha) 5) Pasture land development (152,700 ha)
6) Magat O&M improvement 6) Magat O&M improvement
Supporting Measures
1) Continuation and enhancement of on-going agriculture
support services ○
2) Strengthening of support system for irrigation system
through establishment of rural development center
- for Alcala Amulung West PIP ○
- for other irrigation systems
3) Enhancement of marketing and transportation system
4) Establishment of upland development experimental
center
(E) Hydropower Development Schemes
1) Ibulao scheme (Run-of-river type) 1) Ibulao scheme (Run-of-river type)
2) Tanudan scheme (Run-of-river type) 2) Tanudan scheme (Run-of-river type)
3) Diduyon scheme with Diduyon dam 3) Diduyon scheme with Diduyon dam
Note: ○ indicates projects to be implemented under the investment amount of Pesos 30 billion by the target year
2020.
T41

Table 10.7.2 Features of Projects in Reviewed Master Plan
Name of Projects Project Outlines
Project Cost
(Million Pesos)
EIRR(%)
F/S
(A) Multipurpose Dam Projects
1) Siffu No.1 Dam Project
○
Earthfill type dam, 58 m high, 1.7 million m3 in embankment volume, 93 million m3 in effective storage volume, 115 million m3 in flood control space, installed capacity of 5.4 MW, output of 41.1 GWh,
3,172 28.3
(B) Flood Control Schemes
Structural Measures
1) Dike embankment including revetment, sluice and riverbank tree zone in the main Cagayan River from river mouth to Tuguegarao
- Dikes from river mouth to Nassiping with riverbank tree zone
○ Lower Reach Dike, Total dike length of 82.7 km, total
embankment volume of 9.3 million m3, 2,844 28.1 *
- Dikes from Alcala to Tuguegarao with riverbank tree zone ○
Dikes of Alcala-Buntun, Tuguegarao and Enrile, Total dike length of 57.5 km, total embankment volume of 8.5
million m3, 2,891 27.0 *
2) Cut-off channel works in the main Cagayan River - Gabut cut-off channel
○ Length of 0.9 km, excavation volume of 4.0 million m3,
1,008 16.6 *
- San Isidro cut-off channel ○
Length of 2.1 km, excavation volume of 7.4 million m3, 1,722 18.8 *
- Tuguegarao cut-off channel ○
Length of 6.7 km, excavation volume of 17.5 million m3, Spoil bank plan
4,662 15.0 *
3) Bank protection (73 sites) - 21 sites from river mouth to Cabagan in main
Cagayan River ○
Total length of 18.8 km, total bank protection area of 514,900 m2,
726 19.2 *
- 52 sites upstream from Tumauini in main Cagayan, Siffu, Mallig, Ilagan and Magat River ○
Total length of 51.9 km, total bank protection area of 931,000 m2, 3,657
15.1 for 73 sites
Non-structural Measures
1) Evacuation system - Flood forecasting and warning system (FFWS)
○ Improvement of facilities and strengthening of local disaster
management capacity in Tuguegarao 242 *
- Evacuation center ○ Strengthening of center and DCC capability 15218.0
*2) Resettlement ○ 2,776 households, land acquisition of 7,468 ha 1,185 - *
Supporting Measures
1) Strengthening of institution and organization ○ Funding, River administration, People’s awareness 150 - *
(C) Watershed Management Schemes
1) Reforestation plan Reforestation area of 3,188 km2 5,000 16.3 2) Sabo works plan 26 Sabo dams in Magat River basin 5,472 16.8
(D) Agricultural Development Schemes
Structural Measures
1) New irrigation/ extension schemes (17 schemes, total 54,985 ha) - by new fund (10 schemes, total 35,085 ha) - a scheme of Alcala Amulung West PIP 1,527 22.8 * ○ - other 9 schemes of Enrile, Lallo West, Nassiping, Delfin
Albano, Sto Nino, Dabubu, Solana, Zinundungan, and Tumauini 6,327
17.6~25.0
- by NIA regular fund (7 schemes, total 19,900 ha)
7 schemes of Dibuluan, Rizal, San Mariano, Upper Ilagan Western Brgy., Ilagan, Debibi, and Villaverde,
4,21416.1~
18.4
2) Irrigation rehabilitation/ improvement schemes (7 schemes, total 22,506 ha) - by new fund (5 schemes, total 19,960 ha)
○ 5 schemes of Magapit & Iguig-Alcala-Amulung, Pinacanauan,
San Pablo-Cabagan, Mallig, and Nueva Vizcaya Bagabag, 866
27.0~37.1
- by NIA regular fund (2 schemes, total 2,546 ha)
2 schemes of Lower Chico, and Santa Maria Communal, 192
27.3~29.0
3) Diversified crops development Improvement in unit yield (148,400 ha) - - 4) Permanent crops development Promotion of agro-forestry (105,100 ha) - - 5) Pasture land development Reinforcement of agro-pastoral linkage (152,700 ha) - - 6) Magat O&M improvement Improvement of irrigation efficiency - -
Supporting Measures
1) Continuation and enhancement of on-going agriculture support services ○
Agrarian reform and agricultural modernization through CARP and AFMA
Included in Structuralmeasures
- *
2) Strengthening of support system for irrigation system through establishment of rural development center - for Alcala Amulung West PIP ○ Rice mills and multipurpose dry yards 367 - * - for other irrigation systems
Improvement of post harvest and marketing system including
rice mill and corn mill at 4 centers 433 -
3) Enhancement of marketing and transportation system
Study on alternative route to Metro Manila including that with tunnels and sea route via Irene port
150 -
4) Establishment of upland development experimental center
Experimental/ pilot farm for fruit tree with drip and sprinkler
irrigation system at 3 centers 360 -
(E) Hydropower Development Schemes
1) Ibulao scheme (Run-of-river type) Installed capacity of 17 MW, output of 85 GWh, 1,653 26.6 2) Tanudan scheme (Run-of-river type) Installed capacity of 25 MW, output of 130 GWh, 1,938 31.5 3) Diduyon scheme with Diduyon dam
Installed capacity of 352 MW, output of 957 GWh, Diduyon concrete gravity dam, 111 m high,
26,745 26.5
4) Matuno No.1 Dam Project (multipurpose)
Rockfill type, 147 m high, 10 million m3 in embankment volume, 97 million m3 in effective storage, installed capacity of 180 MW, irrigation area of 12,860 ha
17,565 36.8
Note: ○ indicates projects to be implemented under the investment amount of Pesos 30 billion by the target year 2020.
* indicates projects selected to conduct feasibility study.
EIRRs were estimated under future condition. T42

Table 10.8.1 Benefits of Flood Control Project Category of Damageable Assets and Activities Damages Mitigated by FC Project
Building Unit Damage to residential and business’s buildings due to inundation
Household Effects Furniture and movables such as automobile, electric appliances
Depreciable Assets of Business Establishments
Damage to depreciable assets of business establishments except their sites and buildings
Inventory Stocks of Business Establishments
Damage to inventory stocks of business establishments due to inundation
Depreciable Assets for Farming and Fishery
Damage to depreciable assets of farming or fishery in farmers or business establishments except their sites and buildings
Damages to General Assets
Inventory Stocks for Farming and Fishery
Damage to inventory stocks of farming or fishery in farmers or business establishments except their sites and buildings
Damages to Agricultural Production Damage to crop production due to inundation
Effects of Mitigating Damages to General Assets
Dam
ages
to
Infr
astru
ctur
es Road, Bridge,
Railway, River Facility, Sewerage, Water Supply, Electric Power, Gas, Telephone, Park, Irrigation, etc.
Damage to infrastructures supporting livelihood, business activities and farming production
Dir
ect D
amag
es
Effects of Mitigating Damage to Human Lives Damage to living space, causing casualties Household Economy
Damage to daily housekeeping tasks and community activities due to inundation
Industrial Production
Stoppage or decrease of business and production activities due to inundation
Effects of Mitigating Damages to Daily Activities
Damage to Daily Maintenance and Business Activities Public Services Stoppage or decrease of public services
Household Economy
After inundation, cleaning and repairing houses damaged by flood, and extra expenses for state of emergency
Industrial Production
After inundation, cleaning and repairing buildings damaged by flood, and extra expenses for state of emergency
Expenses for State of Emergency
Government’s Activities
Expenses for emergency activities to casualties in addition to the works above
Damage due to Traffic Disruption
Road, Railway, Port, Airport, etc.
Disruption of traffic systems such as road network, railway, etc., spreading to surrounding areas
Damage due to Disruption of Lifeline Services
Water Supply, Electric Power, Gas, Telephone, etc.
Disruption of public utility services such as water supply, electricity, gas, etc., spreading to surrounding areas
Effects of Mitigating Damages after Flood
Damage due to Stoppage and Decrease of Daily Activities
Decrease of production due to lack of raw and semi finished materials, Stoppage of public services such as medical and utilities, spreading to surrounding areas
Ben
efits
of F
lood
Miti
gatio
n
Indi
rect
Dam
ages
Effects of Mitigating Mental Influence
Influence due to Damages Above
Mental influence due to damages to general assets, business losses, casualties, aftereffects, and influence over surrounding areas
Benefit from Sophisticated Environment Land appreciation owing to improvement of flood control
T43

Table 10.8.2 Review of Projects Proposed in 1987 Master Plan at 2000 Prices
Flood Control SchemesCost *1 Benefit Under Present Condition
Project Name Initial O/M Benefit EIRR B/C*3 NPV*3Invetement (Million Pesos (Million Pesos (Million
(Mil. Pesos) per Year) per Year) (%) Pesos)1. Tuguegarao Dike 1,501 6 216 16.8 1.12 892. Narrow Improvement (Site: NLL) 2,700 10 294 12.5 0.84 -2173. Siffu No.1 Dam 1,469 5 110 6.9 0.48 -4554. Bank Protection Work 3,502 13 264 6.9 0.49 -1,0765. Cabagan Dike 761 3 62 7.6 0.53 -2176. Narrow Improvement (Site: NLR) 8,152 31 573 6.4 0.45 -2,6697. Magat/Alimit Dam 5,559 20 416 6.9 0.48 -1,7208. Cagayan No.1 Dam 4,461 15 273 5.2 0.39 -1,6319. Mallig No.2 Dam 1,207 4 57 3.7 0.30 -50410. Ilagan No.1 Dam 5,894 21 133 - 0.15 -3,02011. Narrow Improvement (Site: NUP) 9,218 35 17 - 0.01 -5,470
Benefit Counting on Future Economic Growth PriorityBenefit Order
Project Name in 2010 in 2020 EIRR B/C*3 NPV*3 Based on(Million Pesos (Million Pesos (Million Economic
per Year) per Year) (%) Pesos) Efficiency
1. Tuguegarao Dike 216 703 28.5 2.23 922 12. Narrow Improvement (Site: NLL) 294 955 22.6 1.67 915 23. Siffu No.1 Dam 110 357 14.6 0.96 -32 64. Bank Protection Work 510 905 15.1 1.01 20 45. Cabagan Dike 62 200 15.5 1.05 21 36. Narrow Improvement (Site: NLR) 573 1,862 13.9 0.91 -462 67. Magat/Alimit Dam 416 1,352 13.2 0.86 -539 58. Cagayan No.1 Dam 273 888 11.3 0.70 -889 89. Mallig No.2 Dam 57 184 9.0 0.88 -115 910. Ilagan No.1 Dam 133 433 4.1 0.26 -2,949 1011. Narrow Improvement (Site: NUP) 17 57 - 0.02 -5,401 11
Multipurpose SchemesCost *1 Benefit Under Present Condition
Project Name Initial O/M Benefit EIRR B/C*3 NPV*3Invetement (Million Pesos (Million Pesos (Million
(Mil. Pesos) per Year) per Year) (%) Pesos)1. Multipurpose Siffu No.1 Dam 2,696 52.1 942.3 21.4 1.56 9742. Multipurpose Magat/Alimit Dam 4,989 68.7 810.9 11.7 0.75 -7903. Multipurpose Mallig No.2 Dam 9,474 71.9 1,897.7 14.4 0.95 -3084. Multipurpose Matuno Dam 14,794 19.2 4,428.1 19.9 1.46 4,022
Benefit Counting on Future Economic Growth PriorityBenefit Order
Project Name in 2000 in 2020 EIRR B/C*3 NPV*3 Based on(Million Pesos (Million Pesos (Million Economic
per Year) per Year) (%) Pesos) Efficiency1. Multipurpose Siffu No.1 Dam 1,388 1,999 28.5 2.55 2,696 22. Multipurpose Magat/Alimit Dam 1,359 2,188 19.3 1.44 1,384 33. Multipurpose Mallig No.2 Dam 2,512 3,219 18.5 1.34 1,962 44. Multipurpose Matuno Dam 7,818 13,084 29.7 3.01 17,569 1
Note: *1 Costs at 2000 constant prices was estimated from the M/P estimates applying a price deflator of 3.0, derived from CPI and WPI. *2 Benefit at 2000 constant prices was estimated from the M/P esitmates applying a price feflator of 3.4, derived from CPI, and growth of population and GRDP per capita. *3 Discounted at 15%.
T44

Financial Cost Economic Cost Economic EIRR (%) PriorityLocation No. Location Initial Benefit after Under Under Order on
Invetement O/M Completion Present Future Economic(Million Pesos) (Million Pesos) (Mil. Pesos/Yr) (Mil. Pesos/Yr) Conditions Conditions Efficiency
1 Agusi 47.1 40.0 0.15 3.89 9.2 17.8 102 Camalaniugan 30.3 25.7 0.10 4.70 17.8 29.4 13 Tucalana 61.7 52.4 0.20 5.08 12.3 22.2 44 Sta. Maria 45.1 38.3 0.14 3.51 8.6 17.0 175 Magapit 31.8 27.0 0.10 1.15 3.1 9.2 206 Gattaran 30.2 25.6 0.10 2.93 8.7 17.1 127 Tupang 10.8 9.2 0.03 0.90 9.6 18.1 98 Dugayong 9.5 8.0 0.03 0.74 8.7 17.1 139 Babayuan 6.7 5.7 0.02 0.77 13.2 23.2 3
10 San Vicente 75.9 62.4 0.23 8.88 13.8 24.0 211 Nattapian 32.3 27.4 0.10 3.18 11.1 20.5 512 Cataggaman 102.2 83.5 0.30 9.33 10.7 19.9 713 Jct. Enrile 13.5 11.4 0.04 1.05 8.7 17.1 1514 Alibago 10.9 9.2 0.03 0.85 8.7 17.1 1415 Namabbalan 64.6 54.8 0.21 5.90 10.3 19.3 816 Sta. Maria 47.6 40.3 0.15 3.70 8.7 17.0 1617 Cabagan 80.8 68.3 0.26 6.19 8.5 16.9 1918 Bagumbayan 10.2 8.7 0.03 1.01 11.1 20.4 619 Larion 0.8 0.7 0.00 0.02 2.3 7.8 2120 Caggay 11.0 9.3 0.04 0.86 8.8 17.2 1121 Tanza 2.8 2.4 0.01 0.22 8.6 17.0 18
Whole Works 725.9 607.0 2.29 64.87 10.2 19.2 -
Table 10.8.3 Result of Economic Evaluation for Urgent Bank Protection Works
T45
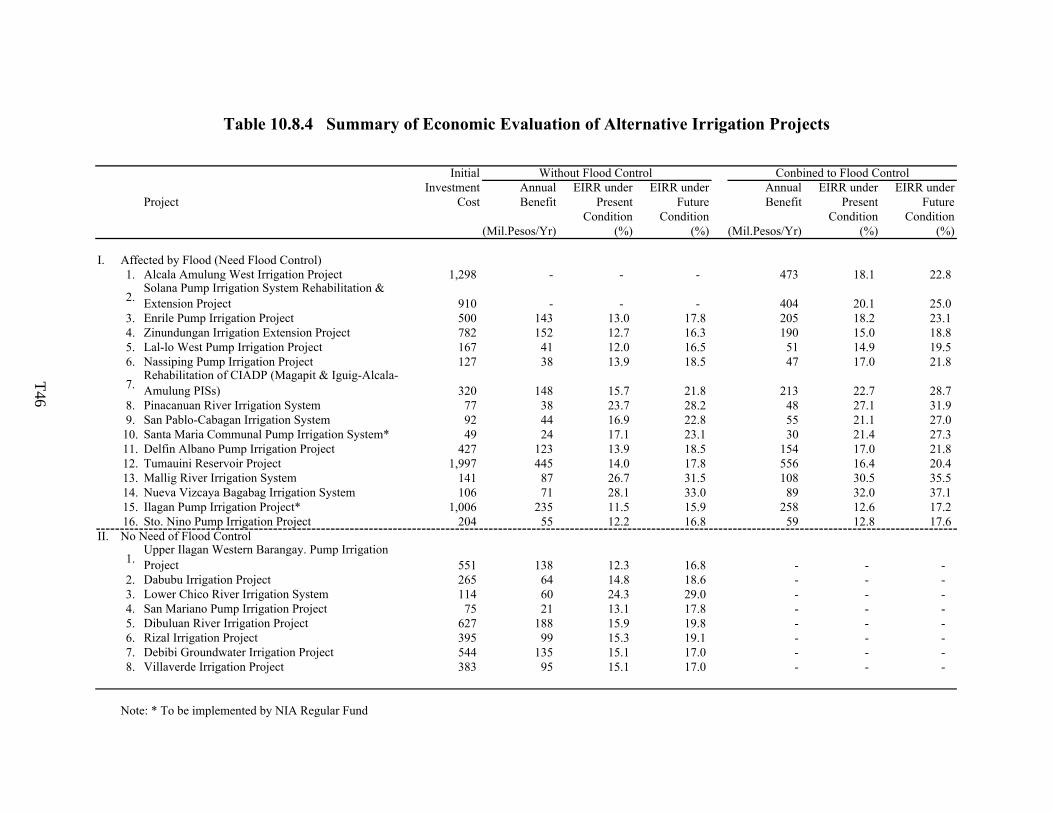
Table 10.8.4 Summary of Economic Evaluation of Alternative Irrigation Projects
Initial Without Flood Control Conbined to Flood ControlInvestment Annual EIRR under EIRR under Annual EIRR under EIRR under
Project Cost Benefit Present Future Benefit Present FutureCondition Condition Condition Condition
(Mil.Pesos/Yr) (%) (%) (Mil.Pesos/Yr) (%) (%)
I. Affected by Flood (Need Flood Control)1. Alcala Amulung West Irrigation Project 1,298 - - - 473 18.1 22.8
2.Solana Pump Irrigation System Rehabilitation & Extension Project 910 - - - 404 20.1 25.0
3. Enrile Pump Irrigation Project 500 143 13.0 17.8 205 18.2 23.14. Zinundungan Irrigation Extension Project 782 152 12.7 16.3 190 15.0 18.85. Lal-lo West Pump Irrigation Project 167 41 12.0 16.5 51 14.9 19.56. Nassiping Pump Irrigation Project 127 38 13.9 18.5 47 17.0 21.8
7.Rehabilitation of CIADP (Magapit & Iguig-Alcala-Amulung PISs) 320 148 15.7 21.8 213 22.7 28.7
8. Pinacanuan River Irrigation System 77 38 23.7 28.2 48 27.1 31.99. San Pablo-Cabagan Irrigation System 92 44 16.9 22.8 55 21.1 27.0
10. Santa Maria Communal Pump Irrigation System* 49 24 17.1 23.1 30 21.4 27.311. Delfin Albano Pump Irrigation Project 427 123 13.9 18.5 154 17.0 21.812. Tumauini Reservoir Project 1,997 445 14.0 17.8 556 16.4 20.413. Mallig River Irrigation System 141 87 26.7 31.5 108 30.5 35.514. Nueva Vizcaya Bagabag Irrigation System 106 71 28.1 33.0 89 32.0 37.115. Ilagan Pump Irrigation Project* 1,006 235 11.5 15.9 258 12.6 17.216. Sto. Nino Pump Irrigation Project 204 55 12.2 16.8 59 12.8 17.6
II. No Need of Flood Control
1.Upper Ilagan Western Barangay. Pump Irrigation Project 551 138 12.3 16.8 - - -
2. Dabubu Irrigation Project 265 64 14.8 18.6 - - - 3. Lower Chico River Irrigation System 114 60 24.3 29.0 - - - 4. San Mariano Pump Irrigation Project 75 21 13.1 17.8 - - - 5. Dibuluan River Irrigation Project 627 188 15.9 19.8 - - - 6. Rizal Irrigation Project 395 99 15.3 19.1 - - - 7. Debibi Groundwater Irrigation Project 544 135 15.1 17.0 - - - 8. Villaverde Irrigation Project 383 95 15.1 17.0 - - -
Note: * To be implemented by NIA Regular Fund
T46

Table 10.9.1 Assumed Cost Disbursement for Reviewed Master Plan(Unit : Million Pesos)
2002 2003 2004 2005 2006 2007 2008 2009 2010 2011 2012 2013 2014 2015 2016 2017 2018 2019 2020 Total1. Multipurpose Dam Project
(1) Siffu No.1 Dam Project 317.2 713.7 713.7 713.7 713.7 3,172.0Subtotal (1.) 0.0 0.0 0.0 0.0 0.0 0.0 0.0 317.2 713.7 713.7 713.7 713.7 0.0 0.0 0.0 0.0 0.0 0.0 0.0 3,172.0
2. Flood Control Project(1) Lower Reach Dike 284.4 426.6 426.6 426.6 426.6 426.6 426.6 2,844.0(2) Alcala Buntun Dike 208.3 234.3 234.3 234.3 234.3 234.3 234.3 234.3 234.6 2,083.0(3) Gabut Cut-off Channel 100.8 226.8 226.8 226.8 226.8 1,008.0(4) San Isidro Cut-off Channel 172.2 310.0 310.0 310.0 310.0 309.8 1,722.0(5) Tuguegarao and Enrile Dike 80.8 121.2 121.2 121.2 121.2 121.2 121.2 808.0(6) Tuguegarao Cut-off Channel 466.2 699.3 699.3 699.3 699.3 699.3 699.3 4,662.0(7) Bank Protection 640.0 640.0 640.0 164.2 164.2 164.2 164.2 164.2 164.2 164.2 164.2 164.2 164.2 164.2 164.2 164.2 164.2 164.2 4,383.0(8) FFWS/Evacuation Center 78.8 78.8 78.8 78.8 78.8 394.0(9) Resettlement 65.9 65.9 65.9 65.9 65.9 65.9 65.9 65.9 65.9 65.9 65.9 65.9 65.9 65.9 65.9 65.9 65.9 64.7 1,185.0
(10) Supporting Measures 8.3 8.3 8.3 8.3 8.3 8.3 8.3 8.3 8.3 8.3 8.3 8.3 8.3 8.3 8.3 8.3 8.3 8.9 150.0Subtotal (2.) 0.0 1,077.4 1,219.6 1,219.6 743.8 1,052.9 1,126.1 1,126.1 871.7 1,009.5 782.7 782.7 1,329.7 1,603.3 1,058.9 1,058.9 1,058.9 1,058.9 1,058.3 19,239.0
3. Irrigation Project 3.1 Irrigation Project to be Implemented by New Funding SourcesNIP/NIS(1) Reh. of CIADP (Iguig-Alcala- N P * 40.0 150.0 186.0 <As JICA Grant, on list of NIA IDP 2001-2010 (Draft)> 376.0
Amulung PIS & Magapit PIS)(2) Tumauini Multipurpose P 50.0 375.0 500.0 600.0 450.0 374.0 <JBIC, on list of NIA IDP 2001-2010 (Draft)> 2,349.0(3) Alcala Amulung West PIP N P 152.7 229.0 229.0 229.1 F/S Review 114.6 229.0 229.0 114.6 1,527.0(4) Nueva Vizcaya Bagabag IS N G * 12.5 37.4 37.4 37.4 124.7(5) Mallig RIS N G * 16.6 49.8 49.8 49.7 165.9(6) Solana PIS-REP N P 107.1 160.6 160.7 160.6 160.7 160.6 160.7 1,071.0(7) Dabubu IP N G 31.2 93.6 93.6 93.6 312.0(8) Delfin Albano PIP N P 50.2 150.6 150.6 150.6 <FS/DE made by NIA, R-2> 502.0(9) Enrile PIP N P 58.8 176.4 176.4 176.4 588.0
(10) Sto. Nino PIP N P 24.0 55.2 72.0 72.0 223.2(11) Pinacanauan RIS N G * 9.1 27.1 27.2 27.2 90.6(12) San Pablo-Cabagan IS N G * 10.8 32.5 32.5 32.4 108.2(13) Zinundungan Irr. Ext. P N G 92.0 276.0 276.0 276.0 920.0CIP/CIS(14) Nassiping PIP C P 14.9 44.7 44.7 44.7 <FS/DE made by NIA, R-2> 149.0(15) Lallo West PIP 19.6 58.8 58.8 58.8 196.0(16) Supporting Measures 20.4 20.4 20.4 20.4 20.4 20.4 20.4 20.4 20.4 20.4 20.4 20.4 20.4 20.4 20.4 20.4 20.4 20.2 367.0
Subtotal (3.1) 0.0 75.3 417.8 855.1 794.1 849.5 519.1 540.4 354.9 571.1 425.3 403.2 465.2 540.9 563.9 509.1 532.5 356.0 296.2 9,069.6Total (1.~3.1) 0.0 1,152.7 1,637.4 2,074.7 1,537.9 1,902.4 1,645.2 1,983.7 1,940.3 2,294.3 1,921.7 1,899.6 1,794.9 2,144.2 1,622.8 1,568.0 1,591.4 1,414.9 1,354.5 31,480.6
3.2 Irrigation Project to be Implemented by NIA and Other Agencies' Regular Fund(1) San Mariano PIP 8.8 26.4 26.4 26.4 <FS/DE made by NIA, R-2> 88.0(2) Rizal IP 50.0 100.0 191.0 125.0 466.0(3) Debibi Groundwater IP 100.0 150.0 200.0 190.0 640.0(4) Dibuluan IP 91.0 100.0 200.0 200.0 147.0 738.0(5) Villa verde IP 70.0 80.0 100.0 100.0 100.0 450.0(6) Lower Chico RIS 13.4 40.2 40.2 40.3 134.1(7) Upper Ilagan Western BPIP 64.8 194.4 194.4 194.4 648.0(8) Ilagan PIP 118.4 355.1 355.0 355.0 1,183.5(9) Santa Maria PIS 5.8 17.3 17.3 17.2 57.6
(10) Supporting Measures 52.4 52.4 52.4 52.4 52.4 52.4 52.4 52.4 52.4 52.4 52.4 52.4 52.4 52.4 52.4 52.4 52.4 52.2 943.0(11) Other projects 500.0 438.8 371.2 321.2 130.2 172.6 156.6 157.6 247.6 177.6 207.2 307.4 242.6 112.9 253.2 129.0 75.2 75.3 75.6 4,151.8
Subtotal (3.2) 500.0 500.0 500.0 500.0 500.0 500.0 500.0 500.0 500.0 500.0 500.0 500.0 500.0 500.0 500.0 500.0 500.0 500.0 500.0 9,500.04. Watershed Management Project
(1) Reforestation 277.8 277.8 277.8 277.8 277.8 277.8 277.8 277.8 277.8 277.8 277.8 277.8 277.8 277.8 277.8 277.8 277.8 277.4 5,000.0(2) Sabo Works 547.2 547.2 547.2 547.2 547.2 547.2 547.2 547.2 547.2 547.2 5,472.0
Subtotal (4.) 0.0 825.0 825.0 825.0 825.0 825.0 825.0 825.0 825.0 825.0 825.0 277.8 277.8 277.8 277.8 277.8 277.8 277.8 277.4 10,472.05. Hydropower Project
(1) Ibulao Project 165.3 371.9 371.9 371.9 372.0 1,653.0(2) Tanudan Project 193.8 436.0 436.0 436.0 436.2 1,938.0(3) Diduyon Project 2,674.5 6,017.6 6,017.6 6,017.6 6,017.7 26,745.0(4) Matuno No.1 Dam Project (multipurpose) 1,756.5 3,161.7 3,161.7 3,161.7 3,161.7 3,161.7 17,565.0
Subtotal (5.) 0.0 0.0 0.0 0.0 0.0 1,756.5 3,161.7 3,161.7 3,327.0 3,533.6 3,533.6 565.7 808.0 436.0 3,110.5 6,453.8 6,017.6 6,017.6 6,017.7 47,901.0Total (1.~5.) 500.0 2,477.7 2,962.4 3,399.7 2,862.9 4,983.9 6,131.9 6,470.4 6,592.3 7,152.9 6,780.3 3,243.1 3,380.7 3,358.0 5,511.1 8,799.6 8,386.8 8,210.3 8,149.6 99,353.6
Note : N : National C : Communal P : Pump G : Gravity * : Rehabilitation
T47

Table 11.3.1 Calculation of Water Duty for Higher Plain in AAWPIP
AAWPIP: Alcala Amulung West Pump Irrigation Project
Month Jan. Feb. Mar. Apr. May Jun. Jul. Aug. Sep. Oct. Nov. Dec.
Cropping Pattern
50%Probable Rainfall (1/5) R(80) mm 5 1 4 8 60 85 86 119 108 161 83 13Reference Evapotranspiration ETo mm 102 99 140 144 137 124 122 119 121 121 102 94
Dry Season PaddyCrop Coefficient Kc 1.09 1.17 1.11 0.98 1.05Crop Evapotranspiration ETcrop mm 111.2 115.8 155.4 141.1 98.7Percolation P mm 46.5 42.0 46.5 45.0 46.5Area Factor fa 1 1 7/8 1/8 1/2Land Soaking LS mm 75.0 75.0Flooding Fl mm 15.0 0.0Effective Rainfall Re mm 3.5 0.7 2.8 5.6 9.1Net Irrigation Requirement mm 244 157 174 23 139
Wet Season PaddyCrop Coefficient Kc 1.05 1.06 1.13 1.16 1.04Crop Evapotranspiration ETcrop mm 145.2 140.1 141.5 123.8Percolation P mm 46.5 45.0 46.5 46.5Area Factor fa 1/8 7/8 1 1 1/2Land Soaking LS mm 18.75 112.5 18.75Flooding Fl mm 7.5 7.5Effective Rainfall Re mm 5.6 42.0 59.5 60.2 83.3Net Irrigation Requirement mm 18 246 152 128 43
Wet Season Legumes, etcCrop Coefficient Kc 0.40 0.51 1.02 0.89 0.85Crop Evapotranspiration ETcrop mm 47.6 61.7 123.4 90.8 79.9Area Factor fa 1/16 7/16 1/2 7/16 1/16Effective Rainfall Re mm 67.8 64.4 106.0 54.4 10.0Net Irrigation Requirement mm 0 0 9 16 4
Net Irrigation Requirement in total mm 244 157 174 41 246 152 128 43 0 9 16 143Irrigation Efficiency E 0.54 0.54 0.54 0.54 0.54 0.54 0.54 0.54 0.54 0.54 0.54 0.54
Gross Irrigation Requirement mm 452 291 322 76 456 281 237 80 0 17 30 265Water Duty lit/s/ha 1.69 1.20 1.20 0.29 1.70 1.09 0.88 0.30 0.00 0.06 0.11 0.99
Dry Season Wet Season Legumes, Corn,
T48

Table 11.3.2 Calculation of Water Duty for Lower Plain in AAWPIP
AAWPIP: Alcala Amulung West Pump Irrigation Project
Month Jan. Feb. Mar. Apr. May Jun. Jul. Aug. Sep. Oct. Nov. Dec.
Cropping Pattern
50%Probable Rainfall (1/5) R(80) mm 5 1 4 8 60 85 86 119 108 161 83 13Reference Evapotranspiration ETo mm 102 99 140 144 137 124 122 119 121 121 102 94
Dry Season PaddyCrop Coefficient Kc 1.09 1.17 1.11 0.98 1.05Crop Evapotranspiration ETcrop mm 111.2 115.8 155.4 141.1 98.7Percolation P mm 62.0 56.0 62.0 60.0 62.0Area Factor fa 1 1 7/8 1/8 1/2Land Soaking LS mm 75.0 75.0Flooding Fl mm 15.0 0.0Effective Rainfall Re mm 3.5 0.7 2.8 5.6 9.1Net Irrigation Requirement mm 260 171 188 24 146
Wet Season PaddyCrop Coefficient Kc 1.05 1.06 1.13 1.16 1.04Crop Evapotranspiration ETcrop mm 145.2 140.1 141.5 123.8Percolation P mm 62.0 60.0 62.0 62.0Area Factor fa 1/8 7/8 1 1 1/2Land Soaking LS mm 18.75 112.5 18.75Flooding Fl mm 7.5 7.5Effective Rainfall Re mm 5.6 42.0 59.5 60.2 83.3Net Irrigation Requirement mm 18 259 167 143 51
Wet Season Legumes, etcCrop Coefficient Kc 0.40 0.51 1.02 0.89 0.85Crop Evapotranspiration ETcrop mm 47.6 61.7 123.4 90.8 79.9Area Factor fa 1/16 7/16 1/2 7/16 1/16Effective Rainfall Re mm 67.8 64.4 106.0 54.4 10.0Net Irrigation Requirement mm 0 0 9 16 4
Net Irrigation Requirement in total mm 260 171 188 42 259 167 143 51 0 9 16 151Irrigation Efficiency E 0.54 0.54 0.54 0.54 0.54 0.54 0.54 0.54 0.54 0.54 0.54 0.54
Gross Irrigation Requirement mm 481 317 348 78 480 309 265 94 0 17 30 280Water Duty lit/s/ha 1.80 1.31 1.30 0.30 1.79 1.19 0.99 0.35 0.00 0.06 0.11 1.04
Dry Season Wet Season Legumes, Corn,

Table 12.2.1 Features of Projects in Feasibility Study
Name of Projects Project Outlines Project Cost(Million Pesos)
EIRR(%), a)
b)
(I) Flood Control Schemes Structural Measures 1) Dike embankment including revetment, sluice and riverbank tree zone in the main Cagayan River from river
mouth to Tuguegarao - Dikes from river mouth to
Nassiping - 4 dikes of Mabanguc, Catugan,
Camalaniugan and Lal-lo (Phase 1), - Total dike length of 44.3 km, total
embankment volume of 4.2 million m3,
1,50532.9c)
■
- Other 3 dikes of Lasam, Gattaran and Nassiping,
- Total dike length of 22.8 km, total embankment volume of 1.9 million m3,
650 38.6
- Dikes from Alcala to Tuguegarao - 5 dikes of Alcala-Buntun, Enrile, Amulung, Iguig, and Tuguegarao,
- Total dike length of 82.8 km, total embankment volume of 12.1 million m3,
3,64222.5c)
- Riverbank tree zone Width of 30 m and total length of 68.9 km along Catugan, Alcala-Buntun, Enrile, and Tuguegarao dike (Phase 1)
28 - ■
2) Cut-off channel works in the main Cagayan River - Gabut cut-off channel Length of 0.7 km, excavation volume of 4.3
million m3, 1,090 15.6
- San Isidro cut-off channel Length of 1.6 km, excavation volume of 9.6 million m3,
2,025 16.6
- Tuguegarao cut-off channel Length of 5.8 km, excavation volume of 19.3 million m3,
3,975 17.0
3) Bank protection at 21 sites from river mouth to Cabagan in main Cagayan River
Total bank protection area of 306,000 m2, (Phase 1) 726 19.2 ■
Non-structural Measures 1) Evacuation system - Flood forecasting and warning
system (FFWS) Improvement of existing FFWS facilities,
strengthening of PAGASA subcenter and local disaster management capacity in Tuguegarao
242 ■
- Evacuation center Strengthening of existing evacuation center facilities, and capability of DCC staffs and local people
152
18.0
■
2) Resettlement 2,776 households, land acquisition of 7,468 ha
1,188 - ■
Supporting Measures 1) Strengthening of institution and
organization Funding, River administration, People’s
awareness 168 - ■
(II) Agricultural Development Schemes Structural Measures 1) Alcala Amulung West Pump Irrigation Project (new irrigation project by new fund) - Stage 1 Development area of 4,090 ha, 4 sets of
intake pump and 2 sets of booster pump, 1,626 16.4 ■
- Stage 2 Development area of 2,970 ha, 4 sets of intake pump and 2 sets of booster pump,
982 16.1
Supporting Measures 1) Continuation and enhancement of
on-going agriculture support services
Agrarian reform and agricultural modernization through CARP and AFMA
(22)d)
- ■
2) Strengthening of support system for Alcala Amulung West Pump Irrigation Project - Stage 1 - Rice mill, 4 units with a capacity of 5
ton/ hour/unit, - Multipurpose dry yards of 97,000 m2,
(210)d)
- ■
- Stage 2 - Rice mill, 3 units with a capacity of 5 ton/ hour/unit,
- Multipurpose dry yards of 73,000 m2,
(157)d)
-
Notes: a) EIRRs were estimated under future condition.
b) ■ indicates projects recommended to implement urgently.
c) EIRRs were estimated including costs of relevant riverbank tree zones.
d) Costs of supporting measures for agricultural development scheme given in ( ) are included in the
project cost of the Alcala Amulung West Pump Irrigation Project (structural measures).

QuantityWork item Unit Phase I Phase II Total Remarks
1. General Item(1) Mobilization/demobilization L.S.(2) Temporary works L.S.(3) Preparatory works L.S.
2. AAWPIP Pump Station2.1 Civil works
(1) Excavation (rock) m3 20000 - 20,000(2) Backfill m3 14000 - 14,000
2.2 Electro-Mechanical works(1) Transmission line with tower L.S. 1 - 1 5km, 2 towers(2) Sub-station L.S. 1 - 1(3) Pump & Motor with appurtenant L.S. 1 - 1(4) Screen L.S. 1 - 1(5) Desiliting facilities L.S. 1 - 1
2.3 Building and concrete works(1) Pump house L.S. 1 - 1(2) Pump sump: concrete "A" m3 1200 - 1,200
3. Booster Pump Station3.1 Civil works
(1) Excavation (rock) m3 300 - 300(2) Backfill m3 50 - 50
3.2 Electro-Mechanical works(1) Transmission line km 15 - 15(2) Sub-station L.S. 1 - 1(3) Pump & Motor with appurtenant L.S. 1 - 1(4) Screen L.S. 1 - 1
2.3 Building and concrete works(1) Pump house L.S. 1 - 1(2) Pump sump: concrete "A" m3 120 - 120
4. Main Irrigation System4.1 Main Canal (MC) I: 27.50km, II: 0.00km
(1) Excavation (indurated) m3 825,000 - 825,000(2) Embankment m3 824,000 - 824,000 side borrow(3) Concrete lining (Class "B") m3 28,300 - 28,300(4) Concrete pavement m3 - - - (5) Gravel pavement m3 24,800 - 24,800
4.2 Related structure for MC(1) Head gate no. 10 - 10(2) Turnout no. 40 - 40(3) Syphon L.S. 2 - 2(4) Culvert L.S. 20 - 20(5) Bridge m2 2,000 - 2,000(6) Cross drain no. 39 - 39(7) Others L.S. 1 - 1 10% of total
4.3 Lateral & Sub Lateral Canals (LC/SLC) I: 29.45km, II: 32.30km(1) Excavation (common) m3 120,400 144,400 264,800(2) Embankment m3 614,200 624,700 ######## I/2: 6km(3) Concrete lining (Class "B") m3 11,900 10,700 22,600(4) Concrete pavement m3 - - - (5) Gravel pavement m3 18,300 18,800 37,100
4.4 Related structure for LC(1) Head gate no. 9(2) Turnout no. 40 60 100(3) Syphon L.S. 6 4 10(4) Culvert L.S. 19 3 22(5) Cross drain no. 25(6) Others L.S. 10% of total
5. On-farm System(1) Farm Ditch & Drain with related structure ha 4,090 2,970 7,060(2)(3) Land levelling ha - 150 150
6. Main Drainage System 6.1 Main & Lateral Drains (MD-I: 7.60km, II: 0.70km, LD-I: 19.70km, II: 7.50km )
(1) Excavation (common) m3 492,000(2) Masonry m3(3) Gabion m3 100
6.2 Related structure(1) Culvert no. 50(2)
7. Pangul River Training7.1 Cut-off channel
(1) Excavation (common) m3 - 750,000 750,000(2) Gabion m3 - 200 200(3) Bridge m2 - 400 400
7.2 Flood dike(1) Embankment m3 - 378,000 378,000 I/5: 6km(2) Sluice no. - 2 2
8. Supprting Measures(1) Rice Mill no. 4 3 7(2) Drying yard m2 97,000 73,000 170,000
Table 12.5.1 Summary of Quantities for Alcala Amulung West Pump Irrigation Project

Table 13.4.1 Project Cost for the Lower Cagayan Flood Control Project, Phase 1 (2002-2007)in 4 Phases including AAWPIP stage 1
US$ 1.0=Pesos 50.0=JY 120.0
Cost Items Cost (Pesos million)Total FC LC
A Flood control project1 Direct construction cost 1,585 960 625
1) Urgent Bank Protection Works 540 270 2702) Left and Right Dike System reach from river mouth to Magapit w/tree zone 1,045 690 355
2 VAT, 10 % of 1 158 0 158Sub total, 1+2 1,743 960 784
3 Land Acquisition and Compensation Cost 26 0 265 Cost for non-structural measures 319 129 1916 Cost for supporting measures 30 24 67 Government Administration Expenses, 3 % of 1 48 0 488 Engineering Services Expenses, 12 % of 1 190 152 38
Sub total, 1+2+3+4+5+6+7+8 2,356 1,265 1,0929 Price Contingency, 5 % p.a.for LC and 2 % p.a. for FC 224 76 148
Sub total, 1+2+3+4+5+6+7+8+9 2,580 1,340 1,24010 Physical Contingency, 8 % 206 107 99
Total, Flood Control 2,786 1,448 1,339
B Irrigation project1 Direct construction cost 1) Alucala Amulung West pump irrigation project , stage 1 902 450 452
2 VAT, 10 % of 1 0 90Sub total, 1+2 992 450 542
3 Land Acquisition, Compensation 20 0 204 Supporting measures 210 126 845 Government Administration Expenses, 3 % of 1 27 0 276 Engineering Services Expenses, 12 % of 1 108 87 22
Sub total, 1+2+3+4+5 1,358 663 6957 Price Contingency, 5 % p.a. for LC and 2 % p.a. for FC 148 44 104
Sub total, 1+2+3+4+5+6 1,505 706 7998 Physical Contingency, 8 % 120 56 64
Total, Irrigation 1,626 763 863
G. total, Flood Control and Irrigation 4,412 2,210 2,202
Table 13.4.2 Project Cost for the Lower Cagayan Flood Control Project, Phase 2 (2004-2011)
in 4 PhasesUS$ 1.0=Pesos 50.0=JY 120.0
Cost Items Cost (Pesos million)Total FC LC
A Flood control project1 Direct construction cost 1,635 1,079 556
1) Left and Right Dike System w/tree zone, reach from Magapit 1,635 1,079 556to Nassiping, Amulung dike system w/tree zone , and Gabutcut-off channel reach from Nassiping to Amulung
2 VAT, 10 % of 1 164 0 164Sub total, 1+2 1,799 1,079 719
3 Land Acquisition and Compensation Cost 4 0 44 Cost for non-structural measures 409 0 4095 Cost for supporting measures 60 48 126 Government Administration Expenses, 3 % of 1 49 0 497 Engineering Services Expenses, 12 % of 1 196 157 39
Sub total, 1+2+3+4+5+6+7 2,517 1,284 1,2338 Physical and Price Contingency, 12 % of 1 to 7 311 161 150
Total, Flood Control 2,828 1,445 1,383

Table 13.4.3 Project Cost for the Lower Cagayan Flood Control Project, Phase 3 (2007-2015)in 4 Phases
US$ 1.0=Pesos 50.0=JY 120.0 Cost Items Cost (Pesos million)
Total FC LC A Flood control project 1 Direct construction cost 2,857 1,886 971
1) Alcala-Buntun and Iguig Dike System w/tree zone, reach from 2,857 1,886 971Amulung to Tuguegarao and San Isidoro cut-off channel
2 VAT, 10 % of 1 255 0 255 Sub total, 1+2 3,112 1,886 1,227 3 Land Acquisition and Compensation Cost 43 0 43
4 Cost for non-structural measures 517 0 5175 Cost for supporting measures 30 24 6
6 Government Administration Expenses, 3 % of 1 86 0 86 7 Engineering Services Expenses, 12 % of 1 343 274 69 Sub total, 1+2+3+4+5+6+7 4,131 2,184 1,947 8 Physical and Price Contingency 289 153 136
Total, Flood Control 4,420 2,337 2,083
B Irrigation project1 Direct construction cost 1) Alucala Amulung West pump irrigation project , stage 1 560 280 280
2 VAT, 10 % of 1 0 56Sub total, 1+2 616 280 336
3 Land Acquisition, Compensation 12 0 124 Supporting measures 157 94 635 Government Administration Expenses, 3 % of 1 17 0 176 Engineering Services Expenses, 12 % of 1 67 54 13
Sub total, 1+2+3+4+5 869 428 4417 Price and physical contingencies, 12 % of 1-6 91 43 49
Total irrigation 1+2+3+4+5+6+7 961 471 490
Total, Flood Control and Irrigation 5,380 2,808 2,573
Table 13.4.4 Project Cost for the Lower Cagayan Flood Control Project, Phase 4 (2011-2020)
in 4 Phases
US$ 1.0=Pesos 50.0=JY 120.0 Cost Items Cost (Pesos million)
Total FC LC A Flood control project 1 Direct construction cost 3,696 2,439 1,257
1) Tuguegarao and Enrile Dike System w/tree zone, reach from 3,696 2,439 1,257Tuguegarao to Cabagan and Tuguegarao cut-off channel
2 VAT, 10 % of 1 370 0 370 Sub total, 1+2 4,066 2,439 1,626 3 Land Acquisition and Compensation Cost 28 0 28
4 Cost for non-structural measures 96 0 965 Cost for supporting measures 30 24 6
6 Government Administration Expenses, 3 % of 1 111 0 111 7 Engineering Services Expenses, 12 % of 1 444 355 89 Sub total, 1+2+3+4+5+6+7 4,774 2,818 1,956 8 Price and Physical Contingency, 12 % of 1 to 7 573 338 235
Total, Flood Control 5,347 3,156 2,190

Table 13.4.5 Summary of Project Cost for the Lower Cagayan River Flood Control Project, Phase 1, 2, 3, and 4(Flood Control only)
US$ 1.0=Pesos 50.0=JY120.0 unit:Peso millionFlood Control system / Work Items Cost (Pesos million)
Total FC LC
1 Urgent Bank Protection Works and Left and Right Dike System with 2,786 1,448 1,339 Tree Zone reach from River Mouth to Magapit
2 Left and Right Right Dike System, reach from River Magapit to Nassiping, 2,828 1,445 1,383 Amulung Dike System w/Tree Zone and Gabut Cut Off Channel, reach from Nassiping to Amulung
3 Alcala-Buntun Dike System w/Tree Zoneand San Isidoro Cut Off Channel, 4,420 2,337 2,083Reach from Amulung to Tuguegarao
4 Tuguegarao and Enrile Dike Systems w/Tree Zone, and Tuguegarao 5,347 3,156 2,190Cut-Off Channel, Reach from Tuguegarao to Cabagan
Total 15,381 8,385 6,996
Total, equivalent US$ (million) 308 168 140

Table 13.4.6 Disbursement Schedule for the Lower Cagayan Flood Control Project, Phase 1 (2002-2007) in 4 Phases(including AAWPIP stage 1)
US$ 1.0=Pesos 50.0 unit: Pesos millionCost items Total 2002 2002 2003 2003 2004 2004 2005 2005 2006 2006 2007 2007 Total FC LC FC LC FC LC FC LC FC LC FC LC FC LC
A Flood Control Project1 Direct Construction cost w/VAT 1,744.0 960.0 784.0 0.0 0.0 96.0 78.4 288.0 235.2 192.0 156.8 192.0 156.8 192.0 156.8
(disburse ment rate %, assumed) 0 0 10 10 30 30 20 20 20 20 20 202 Land Acquisition and Compensation cost 376.0 153.0 223.0 0.0 89.2 0.0 66.9 0.0 26.8 153.0 0.0
including non-structural & supporting measures(disburse ment rate %, assumed) 0 40 0 30 0 30 0
3 Administration Expenses 48.0 0.0 48.0 0.0 4.8 0.0 9.6 0.0 9.6 0.0 9.6 0.0 9.6 0.0 4.8(disbursement rate %, assumed) 0 10 0 20 0 20 0 20 0 20 0 10
4 Engineering Services Expenses 192.0 154.0 38.0 30.8 7.6 30.8 7.6 15.4 3.8 30.8 7.6 30.8 7.6 15.4 3.8(disbursement rate %, assumed) 20 20 20 20 10 10 20 20 20 20 10 10
5 Sub Total, 1+2+3+4 2,360.0 1,267.0 1,093.0 30.8 101.6 126.8 162.5 303.4 275.4 375.8 174.0 222.8 174.0 207.4 165.46 Price Contingency 219.6 75.8 143.8 0.0 0.0 2.5 8.1 12.1 27.5 22.5 26.1 17.8 37.4 20.7 44.7
(2 % for FC, 5 % for LC) 0.00 0.00 1.02 1.05 1.04 1.10 1.06 1.15 1.08 1.20 1.10 1.267 Sub Total, 5+6 2,579.6 1,342.8 1,236.8 30.8 101.6 129.3 170.6 315.5 302.9 398.3 200.1 240.6 211.4 228.1 210.18 Physical Contingency, 8 % 206.4 107.4 98.9 2.5 8.1 10.3 13.7 25.2 24.2 31.9 16.0 19.2 16.9 18.3 16.89 Total, 7+8 2,786.0 1,450.2 1,335.8 33.3 109.7 139.7 184.3 340.8 327.1 430.2 216.1 259.9 228.3 246.4 226.9
B Irrigation Project1 Direct Construction cost w/VAT 992.0 450.0 542.0 0.0 0.0 0.0 0.0 135.0 162.6 135.0 162.6 90.0 108.4 90.0 108.4
(disburse ment rate %, assumed) 0 0 0 0 30 30 30 30 20 20 20 202 Land Acquisition and Compensation 230.0 126.0 104.0 0.0 31.2 0.0 20.8 0.0 6.2 50.4 10.4 37.8 10.4 37.8 10.4
Cost including supporting measures(disburse ment rate %, assumed) 0 30 0 20 0 20 40 10 30.0 10.0 30.0 10
3 Administration Expenses 26.8 0.0 26.8 0.0 2.7 0.0 5.4 0.0 5.4 0.0 5.4 0.0 5.4 0.0 2.7(disbursement rate %, assumed) 0 10 0 20 0 20 0 20 0 20 0 10
4 Engineering Services Expenses 109.0 87.0 22.0 17.4 4.4 17.4 4.4 8.7 2.2 17.4 4.4 17.4 4.4 8.7 2.2(disbursement rate %, assumed) 20 20 20 20 10 10 20 20 20 20 10 10
5 Sub Total, 1+2+3+4 1,357.8 663.0 694.8 17.4 38.3 17.4 30.6 143.7 176.4 202.8 182.8 145.2 128.6 136.5 123.76 Price Contingency 148.0 43.5 104.4 0.0 0.0 0.3 1.5 5.7 17.6 12.2 27.4 11.6 25.7 13.7 32.2
(2 % for FC, 5 % for LC) 0.00 0.00 1.02 1.05 1.04 1.10 1.06 1.15 1.08 1.20 1.10 1.267 Sub Total, 5+6 1,505.8 706.5 799.2 17.4 38.3 17.7 32.1 149.4 194.0 215.0 210.2 156.8 154.3 150.2 155.88 Physical Contingency, 8 % 120.5 56.5 63.9 1.4 3.1 1.4 2.6 12.0 15.5 17.2 16.8 12.5 12.3 12.0 12.59 Total, 7+8 1,626.2 763.1 863.2 18.8 41.3 19.2 34.7 161.4 209.6 232.2 227.0 169.4 166.6 162.2 168.3
G. Total A+B 4,412.2 2,213.3 2,198.9

Table 15.1.1 Results of Impact Evaluation of Flood Control Project on Natural Environment Environmental
Components Conceivable Impacts Magnitude of Impact*
Characteristics of Impact
• Vegetation clearance and population decrease by excavation work. (-1) Irreversible Terrestrial
Flora • Genetic disturbance of terrestrial flora caused by planting in forest zone. (-0)
• Habitat loss due to vegetation clearance. (-1) Irreversible • Formation of habitat barrier for wild animals due
to dikes. (-0)
• Creation of habitat including breeding grounds and foods for terrestrial fauna by forest zone. (+1) Permanent
Terrestrial Fauna
• Decrease in flood frequency and “drying up effect,” to some species. (-0)
• Turbid water flow and siltation caused by excavation works. (-1) Temporal
• Decrease of habitat diversity of aquatic organisms. (-0) Aquatic
Ecology • Creation of habitat including breeding grounds
and foods for aquatic fauna. (+1) Permanent
• Water pollution in case of lack of sewage system. (-0) Water Quality
• Turbid water flow from construction sites. (-1) Temporal • Air pollution caused by heavy construction
machinery and transportation vehicles. (-1) Temporal Air Quality
• Dust from vegetation-cleared land. (-0)
Noise • Noise caused by heavy construction machinery and transportation vehicles. (-1) Temporal
Landscape • Creation of new landscape. (0) * (+2) Major positive impact, (+1) Minor positive impact, (±0) Negligible impact,
(-1) Minor negative impact, (-2) Major negative impact)
Table 15.1.2 Results of Impact Evaluation of Irrigation Development Project on Natural Environment Environmental
Components Conceivable Impacts Magnitude of Impact*
Characteristics of Impact
Terrestrial Flora
• Vegetation clearance and population decrease by land preparation work. (-1) Irreversible
Terrestrial Fauna
• Habitat loss due to vegetation clearance. (-1) Irreversible
• Turbid water flow and siltation caused by land preparation work. (-1) Temporal
• Habitat loss and population decrease of aquatic organisms. (-1) Irreversible
Aquatic Ecology
• Overuse of agricultural chemicals and/or fertilizers. (-0)
Water Quality • Turbid water flow from land preparation sites. (-1) Temporal • Air pollution caused by heavy construction
machinery and transportation vehicles. (-1) Temporal Air Quality
• Dust from vegetation-cleared land. (-0)
Noise • Noise caused by heavy construction machinery and transportation vehicles. (-1) Temporal
Landscape • Creation of new landscape. (+1) Permanent * (+2) Major positive impact, (+1) Minor positive impact, (±0) Negligible impact,
(-1) Minor negative impact, (-2) Major negative impact)

Affected Barangays Households Public
Facility *Affected
Barangays Households Public Facility *
Appari Catalungan 46 - - 0 -Camalaniugan - 0 - Dammang Sure 30 -
Allacapan - 0 - - - -San Jose 10 -
Santa Maria 11 -Magapit 1 -
Sub-total 22 -Sentro Sur 24 -Nassiping 4 -Sub-total 28 -
Callo Norte 162Callo Sur 162Aggunitan 190 ElSc(1), Ch(1)
Calapangan Norte 165Calapangan Sur 30Minanga Norte 61 PrSc(1)Minanga Sur 102 PrSc(1)
Tagao 0Cataliganan 0
Sub-total 872 SeSh(1), ElSc(2), PrSc(2), Ch(4)
Sto. Nino - 0 - - 0 -Tanban 70 -
Damurog 180 ElSc(1), Ch(1), BH(1)Sub-total 250 ElSc(1), Ch(1), BH(1)
Gabut 173 ElSc(1), Ch(1), BH(1), DCC(1)
Dugayong 226 ElSc(1), Ch(1), BH(1), DCC(1)
Dufunganay 55Bacuit 103Bauan 21
Plalli (Palacu) 32Abolo 128 ElSc(1), Ch(1), DCC(1)
Sub-total 738 ElSc(4), Ch(5), BH(2), DCC(4)
San Isidro San IsidroSan Vicente San Vicente
Sta. Rosa Sta. RosaMinanga Norte Minanga Norte
Solana - 0 - Basi 6 -Tuguegarao - 0 - - 0 -
Enrile - 0 - - 0 -
Total - 343 ElSc(1), Ch(2), BH(1) - 2,433
SeSh(1), ElSc(8), PrSc(2), Ch(13), BH(6),
DCC(8)* SeSc: Secondary School, ElSc: Elementary Scool, PrSc: Primary School, Ch: Church including Chapel BH: Barangay Hall, DCC: Daycare Center
Gattaran
Table 15.1.3 The Number of Households and Public Facilities to Be Relocated
Municipality/ CityAlignments of Dikes and Cut-off Channels River area between right and left bank
SeSh(1), ElSc(1), Ch(2)
-
Ch(1)
-
-
Lasam - 0 -
Lal-lo
Alcala - 0
ElSc(1), Ch(2), DCC(1)
Iguig 247 ElSc(1), Ch(2), BH(1) 537 ElSc(1), Ch(2), BH(3),
DCC(4)
Amulung - 0 -
- 0 -
0-

Table 15.1.4 Results of Impact Evaluation of Flood Control Project on Social Environment Environmental
Components Conceivable Impacts Magnitude of Impact*
Characteristics of Impact
Resettlement • Involuntary resettlement. • Livelihood change at relocated site. • Living environmental change at relocated site. • Community split as a result of relocation.
(-2) Irreversible
• Impact on public health caused by air pollution, noise and traffic accidents. (-1) Temporal
Public Health • Reduce of water related diseases accompanied by alleviation of flood risks. (+1) Permanent
• Procurement of nursery trees for planting. (+1) Temporal • Contracts and employment of laborer for planting
and construction works. (+2) Temporal • Bi-products as fruits, fuel, and herbs from forest
plants. (+1) Permanent • Increase in potential for a tourism spot. (+0)
Economic Activities
• Boost of local economy due to alleviation of flood risks. (+2) Permanent
Navigation • Impact on navigation by run-off regime change. (-0)
Fisheries • Turbid water flow and siltation in the Cagayan river.
(-0)
Water Rights • Impact on existing water rights. (-0) Community
Split • Community split by dikes and cut-off channels. (-1) Irreversible
* (+2) Major positive impact, (+1) Minor positive impact, (±0) Negligible impact, (-1) Minor negative impact, (-2) Major negative impact)
Table 15.1.5 Results of Impact Evaluation of Irrigation Development Project on Social Environment
Environmental Components Conceivable Impacts Magnitude
of Impact* Characteristics
of Impact Resettlement • Involuntary Resettlement. (-1) Irreversible
Public Health • Adverse effect to public health caused by air pollution, noise and traffic accidents. (-1) Temporal
• Contracts of geologic, topographic, and hydrological surveys and employment of local laborers.
(+2) Temporal
• Traffic disturbance and effect on local economy. (-1) Economic Activities
• Improvement of agricultural productivity. (+2) Permanent
Navigation • No significant impacts. (0) • Turbid water flow and siltation in the Cagayan river. (-1) Temporal
Fisheries • Impacts on fisheries caused by overuse of agricultural chemicals and/or fertilizers. (-0)
Water Rights • Impacts on existing water rights due to water intake for irrigation. (-0)
Other • Conflict between landowners and tenant farmers caused by supporting measures. (-0)
* (+2) Major positive impact, (+1) Minor positive impact, (±0) Negligible impact, (-1) Minor negative impact, (-2) Major negative impact)

Table 15.1.6 Environmental Monitoring Plan and Schedule Type of monitoring Monitoring site Frequency/ Timing of
Monitoring Parameters to be
monitored 1. Compliance Monitoring All construction and
monitoring sites Quarterly during construction phase and twice a year during initial operation phase
All specified mitigation measures
2. Environmental Surveillance/Monitoring
2.1 Terrestrial Flora and Fauna
River area When deemed necessary Plant species and wildlife species
2.2 Aquatic Ecology Lower Cagayan River
Annually, during migratory season
The number of Ludong by an experimental catch
2.3 Water Quality Downstream of excavation sites of cut-off channels, Cagayan River
Several times a year, during rainy season
Turbidity and depth of siltation
2.4 Ambient Air Quality Residential area near construction sites and along transportation routes
At the peak periods of each phase of construction work
TSP, NO2, CO, Lead(Pb)
2.5 Noise -ditto- -ditto- Noise level
Table 15.1.7 Environmental Monitoring Plan and Schedule Type of Monitoring Monitoring Sites Frequency/ Timing
of Monitoring Parameters
to be Monitored 1. Compliance Monitoring All construction
and monitoring sites
Quarterly during construction phase and twice a year during initial operation phase
All specified mitigation measures
2. Environmental Surveillance/Monitoring
2.1 Resettlement a) Compensation and
relocation of affected households
Affected barangay/ Relocated sites
Quarterly during resettlement procedure and up to completion of resettlement
Compensation rate, reflection of peoples’ intention on unity of community, and physical conditions (surface area of a lot, public facilities, etc) in resettlement area
b) Employment
Contractor’s administrative record
-ditto-
Rate of hiring local laborers and affected people
c) Livelihood Assistance Relocated sites
-ditto-
Livelihood program and livelihood training offered
2.2 Economic Activities a) Fisheries
Lower Cagayan River
Annually, up to target year, 2020
Annual fish catch, by secondary data
b) Navigation -ditto- As noted, up to target year, 2020
Water level at ferry boat terminal
2.3 Public Health and Sanitation
Concerned municipalities of Cagayan Province
Annually, during construction period only.
Morbidity and mortality of water related diseases, number of traffic accident case, etc
2.4 Education Cagayan Province As noted, up to target year, 2020
Basic performance ratio, including participation rate, completion rate, etc.

Table 15.3.1 Economic Value of Damageable Assets
Damageable ValueAsset Building Durable H. Effects/ Value Crop
Assets Stock Added*1 Production(Pesos) (Pesos) (Pesos) (Pesos/day) (Pesos/ha)
1. Residencea. Residential Unit 56,000 42,000 200 *2
2. Industrial, Educational and Medical Facilitiesa. Manufacturing 22,000 291,000 38,000 840b. Wholesale & Retail Trade 108,000 266,000 116,000 860c. Education 4,150,000 1,162,000 166,000 0d. Health & Social Work 2,407,000 664,000 830,000 0
3. Crop Productiona. Irrigated New Fields (ha) 32,200b. Irrigated Rehabilited Fields (ha) 32,200c. Irrigated Farm Land (ha) 17,500d. Rainfed Paddy Field (ha) 12,300
Note: *1 VA is calculated based on not actual business days of 250 days but 365 calendar days.*2 In residence, the daily amount for cleaning damaged house is equivalent to daily income of an average family
Table 15.3.2 Damage Rate
(1) Direct DamageInundation Depth
Item Below Over Floor LevelFloor Less than More thanLevel 0.5 m 0.5-0.99 m 1.0-1.99 m 2.0-2.99 m 3.0 m
1. Buildinga. Building*1 0 0.092 0.119 0.266 0.380 0.834
2. Residencea. Household Effects 0 0.145 0.326 0.508 0.928 0.991
3. Industrial, Educational and Medical Facilitiesa. Depreciable Assets - 0.232 0.453 0.789 0.966 0.995b. Inventory Stock - 0.128 0.267 0.586 0.897 0.982
4. Crop Production Water Inundation Time (days)Depth 1 to2 3 to 4 5 to 6 More Than
(m) 7a. Lowland Crop Less than 0.5 0.21 0.30 0.36 0.50
0.5 to 0.99 0.24 0.44 0.50 0.71More than 1 0.37 0.54 0.64 0.74
b. Upland Crop Less than 0.5 0.27 0.42 0.54 0.670.5 to 0.99 0.35 0.48 0.67 0.74
More than 1 0.51 0.67 0.81 0.91Note: *1 In case of residence, a floor level is 15cm higher than the ground level.
However, a floor level of business establishments is the same as the ground level.
(2) Indirect DamageInundation Depth
Item Below Over Floor LevelFloor Less than More thanLevel 0.5 m 0.5-0.99 m 1.0-1.99 m 2.0-2.99 m 3.0 m
1. Residence *1Works for Cleaning (days) 7.5 13.3 26.1 42.4 50.1
2. Industrial, Educational and Medical Facilities *2Stoppage of Business (days) 4.4 6.3 10.3 16.8 22.6Stagnant Days of Business after Stoppage 2.2 3.15 5.15 8.4 11.3Total 6.6 9.45 15.45 25.2 33.9
Source: Manual for Economic Study on Flood Control, 1999, Ministry of Land, Infrastructure and Transport in Japan

The Feasibility Study of the Flood Control Project for the Lower Cagayan River in the Republic of the Philippines
Final Report Main Report
Figures

Fifth Works in thePhilippines
The Feasibility Study of the Flood Control Projectfor the Lower Cagayan River
in the Republic of the PhilippinesFigure 1.4.1
JAPAN INTERNATIONAL COOPERATION AGENCYOverall Work Flow
Second Works in thePhilippines
Fourth Worksin the
PhilippinesFirst Works in JapanFirst Works in the Philippines
▲IC/R
▲DF/R
F/R▲ IT/R
▲P/R(2)
Third Year
(1) Collection,arrangement andanalysis of existingdata and information
(2) Determination ofbasic concept andmethod of surveyand investigation
◆ Technology Transfer Seminar (2)
FY 2000FY 1999
First Year
◆Technology Transfer Seminar (1)
(7) Hydrological andhydraulic survey (1)
1) Collection of meteorological and hydrological data 2) Installation of automatic
water level gauges at 4locations
3) Flood runoff analysis
(8) River Profile and cross section survey
(10) River morphologic survey (1)
(11) Flood damage survey
(12) Geological survey (1)
(13) Soil survey
(14) Materials survey
(15) Land use survey (1)
(16) Environmental impactsurvey (1)
(17) Basic social impact survey (1)
(31) Socioeconomic study
(32) Mapping of river morphology and flood
inundation
(33) Hydrological and hydraulic study
(34) Estimation of flood inundation damage
(35) Formulation of draft flood control plan
(36) Formulation of draft watershed conservation plan and hazard map
(37) Formulation of draft land use plan
(38) Environmental study
(39) Study on supporting programs
(40) Supplemental survey on river conditions in dry season
(41) Supplemental survey oncropping in dry season
(47) Formulation of flood control plan
(48) Formulation of land use plan
(49) Formulation of watershed conservation plan
(50) Environmental survey
(51) Preliminary design (1)
FY 20015 6 7 8 10 11 12 1 2 3 4 5 6 7943 108 9 11 12 12 2
◎Workshop (1) ◎Workshop (3) ◎Workshop (4)
Legend :IC/R : Inception ReportP/R(1) : Progress Report (1)P/R(2) : Progress Report (2)IT/R : Interim ReportDF/R : Draft Final ReportF/R : Final Report
(18) Preparation,explanation anddiscussion of ProgressReport (1)
Second Year
▲P/R(1)
(29) Preparation,explanation anddiscussion of ProgressReport (2)
(23) Geological survey (2)
(24) Environmental impactsurvey (2)
(25) Basic social impact survey (2)
(30) Workshop (2) and (3)
(19) Hydrological and hydraulic survey (2)
(5) Collection, arrangementand analysis of data andinformation
(6) Workshop (1)
(9) Aerial Photographicsurvey (1)
1) Aerial photography andprocessing
(20) River morphologic survey (2)
(21) Land use survey (2)
(22) Aerial photographic survey (2) 1) Pricking and ground control survey 2) Leveling 3) Aerial triangulation survey 4) Digital mapping
(43) Preparation of Technology Transfer Seminar (1)
(46) Workshop (4)
PreparatoryWorks in Japan
Workshop (2) ◎
(26) Flood damage survey
(27) Socioeconomic survey
(28) Institutional survey
(3) Preparation andsubmission ofInception Report
(4) Explanation anddiscussion of InceptionReport
(42) Preparation and submission of Interim Report
(44) Explanation and discussion of Interim Report
(45) Technology Transfer Seminar (1)
(64) Technology Transfer Seminar (2)
(63) Explanation and discussion of Draft Final Report
(65) Preparation of Final Report
(52) Economic Evaluation of Reviewed Master Plan
(53) Preliminary design (2)
(54) Preliminary design (3)
(55) Formulation of supporting program
(56) Environmental survey
(57) Construction planning
(58) Cost estimate
(59) Project evaluation
(60) Formulation of implementation plan
(61) Preparation of Draft Final Report
(62) Preparation of Technology Transfer Seminar (2)

LEGEND
RECENTQUATERNARY ALLUVIUMRECENT UNCONSOLIDATED DEPOSITS OF CLAY,SAND, GRAVEL, ETC. MOSTLY STREAM LAID.
PLEISTOCENETABUK FORMATIONDACITIC, UNCONSOLIDATED STREAM DEPOSITEDBOULDERY GRAVELS, TUFF, AGGLOMERATES,BASALT CONGLOMERATE.
PLIOCENEILAGAN FORMATIONSHALLOW MARINE THINLY BEDDED CALCARENITES,COARSE SANDSTONES, CONGLOWERATES, TUFFACEOUSSILTSTOES AND CLAYSTONES, WITH OCCURENCE OFCARBONACEOUS MEMBERS.
UPPER MIOCENECABAGAN FORMATION AND CALLAO LIMESTONECALCAREOUS SANDSTONES, SILTSTONES, CLAYSTONES,PEBBLE CONGLOMERATES, CALCARENITES, CLASTICAND REEF LIMESTONE.
EARLY - MIDDLE MIOCENELUBUAGAN FORMATION AND SICALAO LIMESTONEVOLCANIC WACKES, MICROBRECCIAS, COBBLECONGLOMERATES, SHALES, SILTSTONES. OCCASIONALLY CARBONACEOUS, CALCAREOUS IN SOME SECTIONS,MASSIVE TO WELL-BEDDED, CLASTIC ANDREEF LIMESTONE.
LATE OLIGOCENE - EARLY MIOCENEZIGZAG FORMATIONINCLUDES UNDIFFERENTIATED LUBUAGAN FORMATIONMEMBERS. GENERALLY WELL-INDURATED, CLORITIZED,SILICIFIED AND ZEOLITIZED SILTSTOES, COARSESANDSTONES, MINOR COBBLE CONGLOMERATES ANDINTERCALAED AGGLOMERATES, TUFFS, VOLCANICMICROBRECCIA AND FLOWS.
CRETACEOUS-PALEOGENEUNDIFFERENTIATED INTERCALATION OF METASEDIMENTS(GRAYWACKE, SHALE, MUDSTONE) AND METAVOLCANICS(BASALT, ANDESITE, DACITE AND DIABASE TUFFSAND FLOWS) WITH ASSOCIATED CHERT, MARBLEAND SEDIMENTS.
PLIOCENE-QUATERNARYVOLCANICSINTERMEDIATE TO BASIC CORES, DACITE AND ANDESITE PLUGS.
PALEOGENE-NEOGENEINTRUSIVE ROCKSQUARTZ DIORITE, GRANODIORITE, SYENITE, MONZONITEAND ANDESITE, PORPHYRY STOCKS, DIKESAND SILLS.
N
0 5 25 50 km
SCALE
Figure 2.3.1
Geological Map of Cagayan River Basin
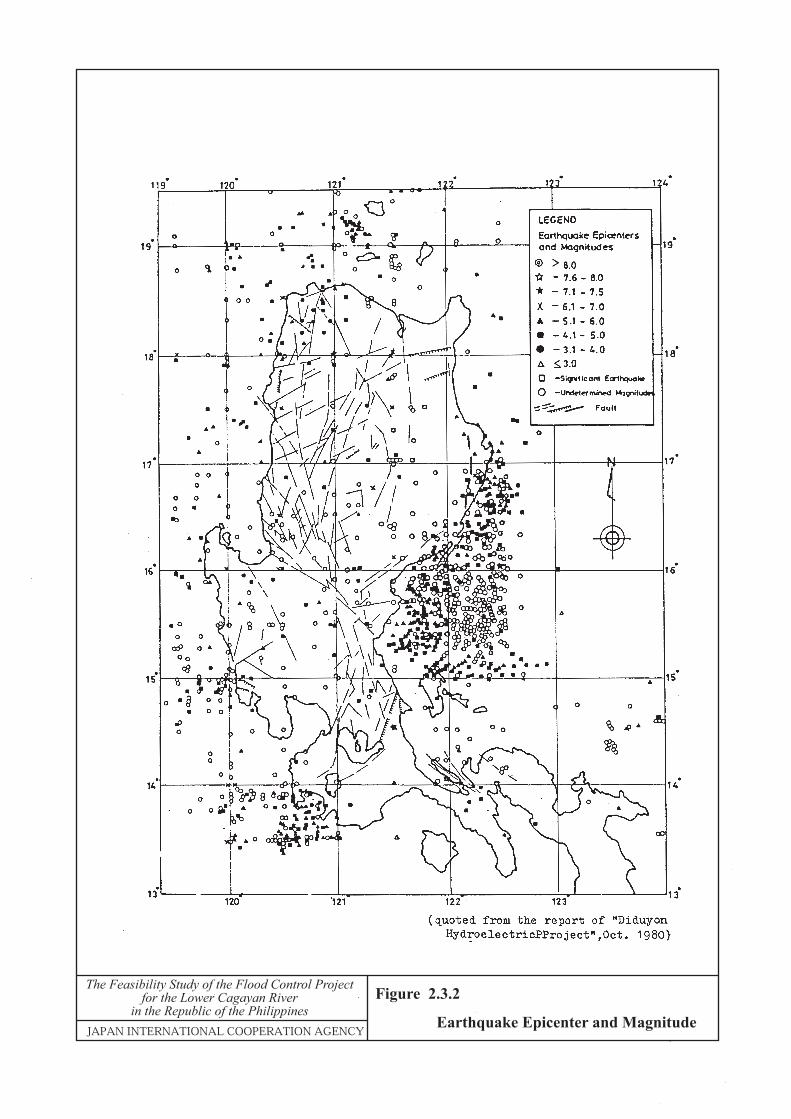

Aparri
Lal-lo
Magapit
Tuao
Iguig
Solana
Enrile
Cabagan
Tumauini
Cauyan
Ilagan
Magat Dam
Mallig
Tuguegarao
EchagueSantiago
Jones
Nassiping
Bayombon
Alcala
Amulung
Magapit Br.
Buntun Br.
Tupang
Babuyan Channel
Pared River
Chico River
Tuguegarao River
Pinacanauan River
Tumauini River
Magat RiverIlagan River
Siffu River
Mall
ig R
iver
Addalam River
Mag
at R
iver
Cag
ayan
Riv
er
Cagayan River
Caraballo Mountains
Sierra Madre Mountains
Cordillera Mountains
Dummon River
0 10 20 30 40 50 kmScale
General Basin Map
N
The Feasibility Study of the Flood Control Projectfor the Lower Cagayan River
in the Republic of the Philippines
JAPAN INTERNATIONAL COOPERATION AGENCY
Figure 2.5.1
Dam
Diversion weir
River course
RoadBasin boundary
Sub-basin boundary
Legend
Sta Cruz River

The Feasibility Study of the Flood Control Projectfor the Lower Cagayan River
in the Republic of the Philippines
Figure 2.5.2
JAPAN INTERNATIONAL COOPERATION AGENCYSchematic River System of the Cagayan River
Babuyan Channel
Aparri
Alcala
Zinundungan River
Chico River Dummon River
Pared River
Tuguegarao River
Pinacanauan River
Tumauini RiverMallig River
Siffu River
Ilagan River
Ganano River
Addalam River
Cagayan River
Faire
Roxas
San Mateo Naguilian
Cauayan
Mallig
Santiago City
San Agustin
Total Catchment Area : 27,300 sq.kmRiver Length : 520 km
Note
Legend: City/municipality
: Rivers
Magapit
Nassiping
Tuguegarao City
Cabagan
Ilagan
Jones
Magat RiverSanta Cruz River
Source : Topographic Maps

Bankful Carrying Capacity
0
5000
10000
15000
20000
25000
0 20 40 60 80 100 120 140 160 180
Distance from River Mouth (km)
Car
ryin
g C
apac
ity (m
3 /s)
River Width of the Cagayan River
0
1000
2000
3000
4000
5000
0 20 40 60 80 100 120 140 160 180
Distance from River Mouth (km)
Wid
th (m
)
Low Water Channel
River width including flood plain
Apa
rri
Mag
apit
Br.
Zin
undu
ngan
R.(
L)
Dum
mon
R.(R
)
Chi
co R
.(L)
Nas
sipi
ng
Pare
d R
.(R)
Alc
ala
Bun
tun
Br.
Tug
uega
rao
R.(R
)
Sta.
Mar
ia B
rPi
naca
naua
n R
.(R)
Cab
agan
-30
-20
-10
0
10
20
30
40
50
0 20 40 60 80 100 120 140 160 180
Elev
atio
n (E
l m) Left Bank
Right Bank
Deepest River Bed
Mean River Bed
Riverbed Slope=1/21,000 Riverbed Slope=1/9,000Riverbed Slope=1/10,000 Riverbed Slope=1/7,000
Longitudinal Profi le of the Cagayan
Mean River Bed slope
Apa
rri
Mag
apit
Br.
Zinu
ndun
gan
R.(L
)
Dum
mon
R.(R
)
Chi
coR
.(L)
Nas
sipi
ng
Pare
dR
.(R)
Alc
al a
Bun
tun
Br.
Tugu
egar
aoR
.(R)
Sta.
Mar
ia B
r.
Pina
cana
uan
R.(R
) Cab
aga
n
Dep
th (m
)

Alcala
Amulung
Iguig
Solana
Tuguegarao
Cabagan
Tumauini
Ilagan
LEGEND
Boundary of Topography
Steep slope, Cliff
Water surface
Mountain, Hill, Terrace
Valley plain along tributary
Natural levee
Former river course
Back swamp
Valley plain
Lower alluvial plain
Alluvial plain for
med by mainstream
Higher alluvial plain
Alcala
Amulung
Iguig
Solana
Tuguegarao
Cabagan
Tumauini
Ilagan
A river geomorphologic study was made based on the
observation of satellite image, aerial photographs,
topographic maps, and site reconnaissance.
Geom
orp
holo
gic
al S
urvey M
ap
of th
e C
agayan
Riv
er
The F
easibility Study of the Flood C
ontrol Project
for the Low
er Cagayan R
iverin the R
epublic of the Philippines
JAPA
N IN
TE
RN
AT
ION
AL
CO
OPE
RA
TIO
N A
GE
NC
Y
Fig
ure 2
.5.4
N
0 2 4 km

Aparri
Lal-lo
Magapit
Babuyan Channel
A
C
D
D
C
B
B
A
N0 1 2 3 4 5 km
Scale
Gattaran
Nassiping
Alcala
E
E
Amulung
Solana
Tuguegarao
Iguig
EnrileNamabbalan
F
F
G
H
H
G
Tumauini
D
D
Cabagan
Ilagan
Riv
er C
ou
rse
Sh
ifting
The F
easibility Study of the Flood C
ontrol Project
for the Low
er Cagayan R
iverin the R
epublic of the Philippines
JAPA
N IN
TE
RN
AT
ION
AL
CO
OPE
RA
TIO
N A
GE
NC
Y
Fig
ure 2
.5.5
Legend
Topographic map (1947 - 1953)
Aerial photographs (1979)
Aerial photographs (1996)
Aerial photographs (2000)
Road


