in ^• CM in en o < i O < 01 § PHOTOGRAPH THIS SHEET UNANNOUNCED LEVEL INVENTORY y ^p(i-hJ-r-s3i ynMjtjzs DOCUMENT IDENTIFICATION DISTRIBUTION STATEMENT A Approved fox public leleoMl Distribution Unlimited DISTRIBUTION STATEMENT ACCESSION FOR NTIS GRAAI DTIC TAB UNANNOUNCED JUSTIFICATION D D BY DISTRIBUTION / AVAILABILITY CODES DATE ACCESSIONED DISTRIBUTION STAMP DATE RETURNED 85 02 12 038 DATE RECEIVED IN DTIC REGISTERED OR CERTIFIED NO. PHOTOGRAPH THIS SHEET AND RETURN TO DTIC-DDAC DTIC FORM 70A ,W DEC 83 #UM DOCUMENT PROCESSING SHEET PREVIOUS EDITION MAY BE USED UNTIL STOCK IS EXHAUSTED.
Transcript
in ^• CM
in en o <
i O <
01
§
PHOTOGRAPH THIS SHEET
UNANNOUNCED
LEVEL INVENTORY
y
^p(i-hJ-r-s3i ynMjtjzs DOCUMENT IDENTIFICATION
DISTRIBUTION STATEMENT A
Approved fox public leleoMl Distribution Unlimited
DISTRIBUTION STATEMENT
ACCESSION FOR NTIS GRAAI
DTIC TAB
UNANNOUNCED
JUSTIFICATION
D D
BY DISTRIBUTION / AVAILABILITY CODES
DATE ACCESSIONED
DISTRIBUTION STAMP
DATE RETURNED
85 02 12 038 DATE RECEIVED IN DTIC REGISTERED OR CERTIFIED NO.
PHOTOGRAPH THIS SHEET AND RETURN TO DTIC-DDAC
DTIC FORM 70A ,W DEC 83 #UM DOCUMENT PROCESSING SHEET PREVIOUS EDITION MAY BE USED UNTIL
STOCK IS EXHAUSTED.
DISCLAIMER NOTICE
THIS DOCUMENT IS BEST QUALITY PRACTICABLE. THE COPY FURNISHED TO DTIC CONTAINED A SIGNIFICANT NUMBER OF PAGES WHICH DO NOT REPRODUCE LEGIBLY.
■••.... .-':^
^:
"■A
M
#
UNCLASSIFIED _
document cq, defen
the E U. s.^"1™"^" sion or manner to an una" by law.
infor nited
fecting
and^^fife^t» trans^jiß-ll v
ed person fiut^gg^bited ^ '
■■--i-'r •■ ■ -'■ *
<■■ >it., i ,,.!,,. ..,, . ,_
UNCIASSIHED
ir'NM^i irn
This document consists of 49 pages
No. 2 J 4 of 337 copies, Series A
OPERATION SNAPPER
Project 4.6
THE TIME-COURSE OF
THERMAL RADIATION AS MEASURED
BY BURNS IN PIGS
REPORT TO THE TEST DIRECTOR
by
Harry D. Kingsley, M. D. Paul R. Schloerb, M. D. Charles H. Murden, Jr., Lt. Col., USAF Daniel B. Williams, Major, USAF Herman E. Pearse, M. D., (Project Director)
March 1953
University of Rochester, Atomic Energy Project Rochester, New York
UNClASSIFItil
Reproduced Direct from Manuscript Copy by AEC Technical Information Service
Oak Ridge, Tennessee
Inquiries relative to this report may be made to
Chief, Armed Forces Special Weapons Project P. O. Box 2610
Washington, D. C.
If this report is no longer needed, return to
AEC Technical Information Service P. O. Box 401
Oak Ridge, Tennessee
\
SICHTI
X
Utmi InlormitlN
ABSTRACT
The "biological effects of the high intensity thermal radiation from atomic bomb explosions were firet studied under controlled con- ditions in the field at Operation GREENHOUSE. Supplemental data were required to further define the time in which a skin burn was produced. Anesthetized young Chester White pigs were placed in protective con- tainers and exposed to the thermal radiation from two atomic bomb explosions. Exposures were limited by aperture plates, each of which contained ten circular ports. Exposure times through these ports were varied by electrically operated shutters. Other containers were used to compare large (3 x ^-.5 in«) and small ^0*75 in.) area burns. Resultant burns were aialyzed grossly and microscopically for degree of severity. The burn severity was related to the amount of energy producing the same degree in the laboratory and then compared to measured thermal energy from field data. The most severe burning occurred in the seconi 0.1 sec period. There was little increase in the severity of a burn after 0.5 sec. No significant burns were produced on normal skin after 0.6 sec, despite the presence of a relatively large amount of measured incident energy. Small bums through limiting apertures were of the same severity as large bums produced behind large apertures on the same animal. Further infor- mation is needed from the laboratory on the effect of thermal pulse shape and on the effect of a variable spectrum of radiant energy in burn production.
CONTENTS
ABSTRACT 3
CHAPTER 1 OBJECTIVE 9
1.1 General 9 1.1.1 Time of Burning 9 1.1.2 Correlation of Measured Energy and Bums . . 9 1.1.3 Comparison of Small and Large Area Bums . . 9
2.5.1 Gross Appearance 16 2.5.2 Microscopic Evaluation 17 2.5.3 Energy Values Assigned to Bums 17 2.5.5 Thermal Energy Measurements 18
2.6 Operations 22
CHAPTER 3 RESULTS 23
3.1 Survival of Animals 23 3.2 Bums - Surface Appearance 23 3.3 Effects of Total Thermal Pulse 23 3.5 Bums from 0.1 Second Periods of the Thermal Pulse. 29 3.5 Bums from Exposure to Increasing Increments of the
Thermal Pulse 31 3.6 Effects of Increasing Initial Cut-Off of the Thermal
Pulse 33 3.7 Results of Comparison of Small and Large Area Bums 35 3.8 Microscopic Evaluation of Bums 35
3.8.1 General 35 3.8.2 Bum Depth - Shot 3 36 3.8.3 Burn Depth - Shot h 37
Stcuritif Informition
CHAPTER k CONCLUSIONS AND RECOMMENDATIONS kO
h.l Conclusions from Results of the Weapons Tested . . ^0 k,2 Recommendations ho
BIBLIOGRAPHY h2
SwHrit) Infemation
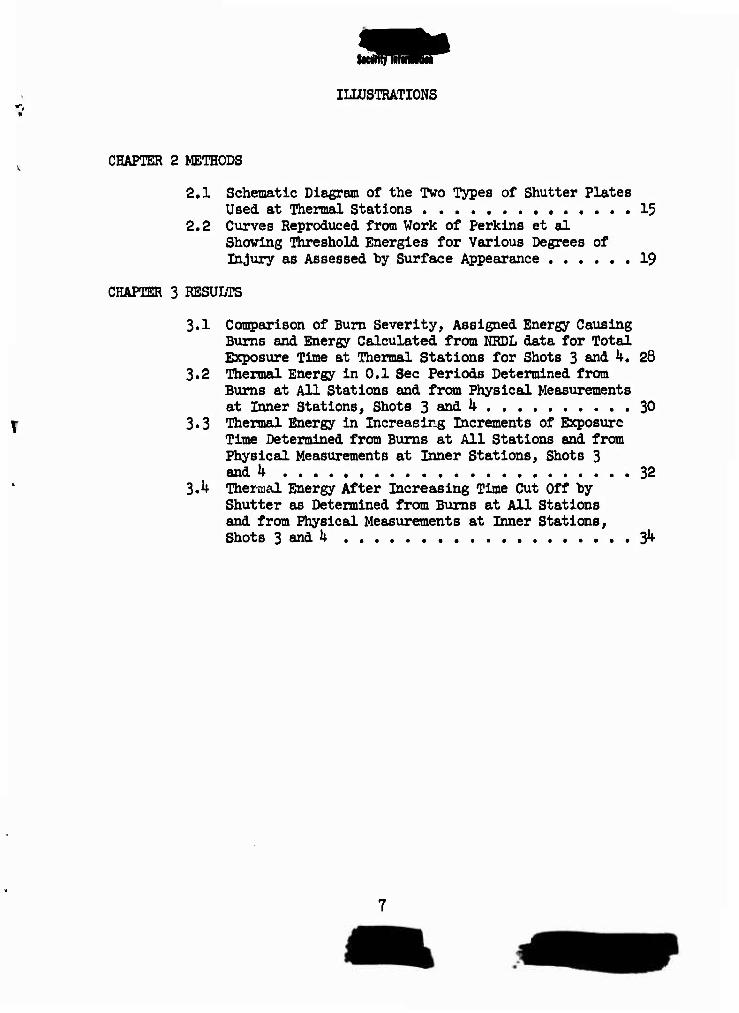
an» ILUJSTRATIONS
CHAPTER 2 METHODS
2.1 Schematic Diagram of the Two Types of Shutter Plates Used at Thermal Stations 15
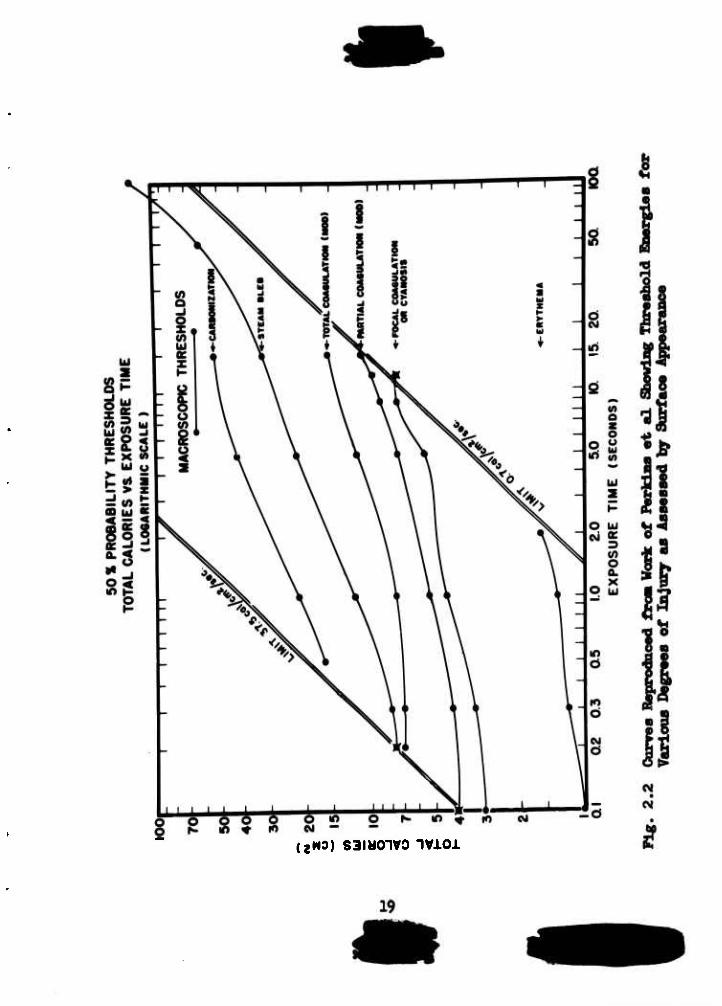
2.2 Curves Reproduced from Work of Perkins et al Showing Threshold Energies for Various Degrees of Injury as Assessed by Surface Appearance 19
CHAPTER 3 RESULTS
3.1 Comparison of Bum Severity, Assigned Energy Causing Bums and Energy Calculated from NRDL data for Total Exposure Time at Thermal Stations for Shots 3 and k, 28
3.2 Thermal Energy in 0.1 Sec Periods Determined from Bums at All Stations and from Physical Measurements at Inner Stations, Shots 3 and h 30
3.3 Thermal Energy in Increasing increments of Exposure Time Determined from Bums at All Stations and from Physical Measurements at Inner Stations, Shots 3 and k 32
3.^ Thermal Energy After Increasing Time Cut Off by Shutter as Determined from Bums at All Stations and from Physical Measurements at Inner Stations, Shots 3 and U 3^
SinlllnliiniittM
TABLES
CHAPTER 2 METHODS
2.1 Distances of Bio-Medical Thermal Stations 13 2.2 Gross Appearance and Classification of Bums on
Pigs 18 2.3 Calculated Thermal Energy from Project 8.3
Measurements 21
CHAPTER 3 RESULTS
3.1 Tabular Summary of Burn Severity, Shot 3 2U 3.2 Tabular Summary of Bum Severity, Shot ^ 26 3.3 Microscopic Data - Shot 3 38 3.Ü Microscopic Data - Shot ü 39
8
mt
Mcuhty iRlonutlM Sicurityl
CHAPTER 1
OBJECTIVE
1.1 GENERAL
1.1.1 Time of Burning
Since Operation GREENHOUSE it became Increasingly apparent that the exact time of clinically significant cutaneous burning by the major thermal pulse must be known. This was important not only to carry out realistic laboratory experiments, but also to settle the question of the efficacy of evasive action.
1.1.2 Correlation of Measured Energy and Bums
The instrumental methods used for measuring the thermal pujpe in the field and the laboratory standards for evaluating the energy causing different grades of severity of burns had improved. Since it was possible to correlate measured thermal energy and bum severity, further field testing was indicated.
1.1.3 Comparison of Small and Large Area Bums
There was a need to settle the question of accuracy of using a small area burn for test purposes. To eliminate any doubt, the severity of small and large area bums had to be compared in the some animal.
1.2 BACKGROUMD
1.2.1 Previous Investigations
A study of the Japanese casualties from the atomic bomb- ing showed that the morbidity and mortality from thermal bums was high. Little was known about bums caused from a brief pulse of high intensity radiant energy. In 19^7 a laboratory study was begun, supported by the Atomic Energy Commission, using combustibles and the carbon arc as sources for the heat to produce burns or experimental animals. The question of valid simulation of bomb radiation arose. There was no data available to answer this.
There were no immediate skin biopsies of bums from the humans in Japan nor from the animals at Operation CROSSROADS that could be compared with the microscopic appearance of the lesions produced in the laboratory.
Stcurity IntemitiM
SlCÜmit lüfWIMtiM
There was a wide divergence of opinion on the time required to cause burns from the "bomb. The opinions ranged from 20 msec or less to 3 sec or more. The time of applying thermal energy influences the severity of the burn.!/
Ultraviolet light has a photo-chemical as well as a thermal effect in causing erythema, hut whether this was a factor in "bomb burns was not known. Nor was it evident how important the visible or infrared portions of the spectrum were in burn production.
These and other questions such as influence of skin color, correlation of thermal measurements and bums, and the protective effects of fabrics led to the experiments at Operation GREENHOUSE.
1.2.2 Results from Operation GREEMHOUSEJ/
A timing shutter was used which exposed the skin through an open port during the initial flash. At about 20 msec a diaphragm covered this and opened another port to expose skin during the thermal pulse from the fireball. There were no burns sustained from the initial flash by any anlmal at any station on two shots. Bums from the bomb occurred after the initial 20 msec.
Pigs were placed behind a sliding shutter which exposed the skin progressively after bomb zero. It appeared that all burning had ceased after 0.5 sec. The accuracy of this result was questioned because of the slow traverse of the shutter and the possible inter- ference by dust.
The surface appearance, depth and healing time of burns of various sizes were the same. Some have been skeptical of this result and maintain that the snail area burn is not a valid test of severity.
The measurements of thermal energy did not agree in all cases with the severity of the bums as gaged by laboratory standards.
The burns in white and dark pigs were equally severe at the nearest station but at the more distant ones the depth of bum
1/J. B. Perkins, H. E. Pearse, and H. D. Kingsley, A Study of Radiant Energy Bums: The Effect of Exposure Time and Intensity, UR-217 (University of Rochester Atomic Energy Project Report), 1952.
2/Pearse, H. E., et al. Thermal Radiation Injury, Operation GREEN- HOUSE, Annex 2.7, Final Report.
10
Sicurity Informition
and its healing time were greater in the dark animals, vat ion needed further study.
This obser-
There were no bums on skin protected by army uniform fabrics. The degree of their protection was not known. They were tested at energy levels which were too low to estimate their effect. Further laboratory evaluation was needed before a range could be determined for accurate placement in the field.
Perhaps the most important result was the demonstration that the surface appearance, microscopic changes and healing of burns from the atomic bomb were comparable to those from laboratory sources. This gave confidence in the results of laboratory testing.
11
Sicurity Intornition
CHAPTER 2
METHODS
2.1 LOCATION OF STATIONS
Plans were made in the pre-test period to ottaln information at three levels of thermal energy at each of two air "bursts. The location of stations was planned using the "best predictions obtainable on expected thermal yield of the bombs to be used. The desired energies were 30, 20 and 10 cal/cm^. The stations were set up on the Bio-Med Line on Yucca Flat. The distances of the stations are shown in Table 2.1.
TABLE 2.1
Distances of Bio-Medical Thermal Stations
1 Shot Actual Range to Actual Slant G.Z. in feet Range in feet \
3 3560 5150 7880
k933 I 6199 | 8601 |
k 3590 U200
3642 ^327
ml. J .J..J.J
5090 * 7780
.. 3 «1.-J. 1, J._ -I-J.
5195 * 78U9
small and large area bums.
2.2 STATIONS
2.2.1 Shutter Plates
In perfecting the design of the pair of shutter plates shown diagrammatically in Fig. 2.1 it was intended that information would be obtained on the following:
a) the severity of the bums produced in the first 5 consecutive 100 msec periods,
13
"b) the severity of the "burns caused by six cumulative increments of 100 msec each from 0 to 0-600 msec,
c) the severity of six burns created by decreasing the exposure progressively, cutting off from the beginning of the pulse successive increments, each 100 msec longer than the previous one; the last and shortest exposure thus ran from 600 msec to the end of the pulse, and,
d) the severity of the tutal, unmodified burn to serve as a control at each distance.
Each shutter plate had two rows of five 1.5 in. circular apertures in an overall area of U x 10 in. These were covered with fused quartz to prevent sand-blasting of the animal's skin during the shock wave.
The operation of the solenoid activated shutter plates was initiated by the flash of the bomb on photo-electric relays.
Four pigs were placed in individual aluminum cylinders at each of three stations. Each of two cylinders had one type of shutter plate in its wall giving two pairs of shutters at each location.
The fabrication and calibration of the shutters, the design, fabrication and placement of the cylinders were done by the members of Project k.2, A detailed description of this equipment is given in their report. Although the reports are separated, it should be pointed out that this was a collaborative effort in which the group at the Naval Medical Research Institute provided and placed the physical equipment and the group at the Atomic Energy Project of the University of Rochester provided the animals and conducted the biological experiments herein reported.
2.2.2 Large and Small Area Containers
To compare small and large area bums, four animals were placed in individual plywood containers suspended from A-frames at the 8601 ft station for Shot 3 and the 78^9 ft station for Shot k. Each container was faced with l/k in. transite sheet (compressed asbestos and Portland cement) having a central rectangular aperture 3 x 4.5 in. and four 0.75 in. (1.9 cm) diameter circular openings. Each of the latter was 1 in. away from the four corners of the rectangular opening. These ports were not covered by quartz. India ink was applied to limited areas of the skin on some of the animals in these containers at Shot k.
Fig. 2.1 Schematic Diagram of the Two Types of Shutter Plates Used at Thermal Stations
2.2.3 Animal Protection
The animals placed in aluminum cylinders were protected against cold by thermostatically controlled strip heaters in the walls of the containers. Ventilation was provided "by electrically driven fans in the end bells of the cylinders which were fitted with shutters to prevent excess dust during the blast wave.
2.2.^ Orientation of Animals
All shutter plates and containers were oriented with the anticipated height of the burst to present a plane surface perpen- dicular to the incident radiation. All apertures were at least 2k in. above the ground surface.
2.3 ANIMAI£
Thirty-two Chester White pigs were procured from the laboratory supply source and were maintained under laboratory cage conditions for 10 days or more prior to shipment to Nevada Proving Grounds. This period of time was required to insure that the animals were free from systemic disease and dermatitis. They were shipped via railway express with an attendant who supervised feeding and care en route. At Nevada Proving Grounds the animals were placed in prepared animal runs in groups of eight. Feeding and care were similar to conditions maintained in the University of Rochester laboratory. On the day prior to testing the weights ranged from 11.1 to 19.1 kg with 23 weighing from 1^.5 to 17.0 kg. The age ranged from 10 to Ik weeks. All animals were identified with numbered ear tags.
2,k AMESTHESIA
Figs were anesthetized with Dial In Urea-urethane injected intra- peritoneally. The dose used for Shot 3 was 70 mg per kg based on the fasting weight on the day prior to the test. For Shot k the dose was increased to 72.5 mg per kg in order to reduce the reflex move- ment in a few animals as indicated by the bums from Shot 3*
2.5 EVALUATION OF BURNS
2.5.1 Gross Appearance
Burns were observed and photographed in color as soon as possible upon the return of the animals to the laboratory. After each shot each of several observers determined the severity of bum and assigned a value for the type of injury. A template was used to orient the observer for location of bums on the side of the animal. The assessment was made objectively without the observer's knowledge
of the type of exposure causing the lesions. On D + 1 the evaluation of the bum was repeated after the animals were anesthetized with Intravenous sodium pentoharbltal. Biopsies of each hum were obtained at this time and the animals sacrificed.
2.5.2 Microscopic Evaluation
At 2h hours after burning surgical biopsies were taken from all lesions In such a way as to obtain representative burned tissue and adjacent normal skin. After fixation and staining with hematoxylln and eosin, the microscopic sections were studied and evaluated with regard to both depth and types of thermal effects. Objective Interpretation was assured by examination of each section without knowledge of the gross appearance or classification.
Depth was measured in millimeters from the skin surface to the average level of thermal damage of the epidemis or of the hair follicle epithelium with a microscope optical micrometer.
Qualitative evaluation of the thermal effects was categori- zed according to a descriptive terminology from laboratory studies. These gradations in order of increasing severity were:
a) acldophilic coagulation with vacuolization of epicermal cells
b) epidermal-dermal separation
c) shrinking and spindling of epidermal cells
d) bleb formation
e) basophllic dermal coagulation
f) carbonization
Combinations of these gradations were often observed. Final inter- pretation and classification of each section were based upon the most severe microscopic damage.
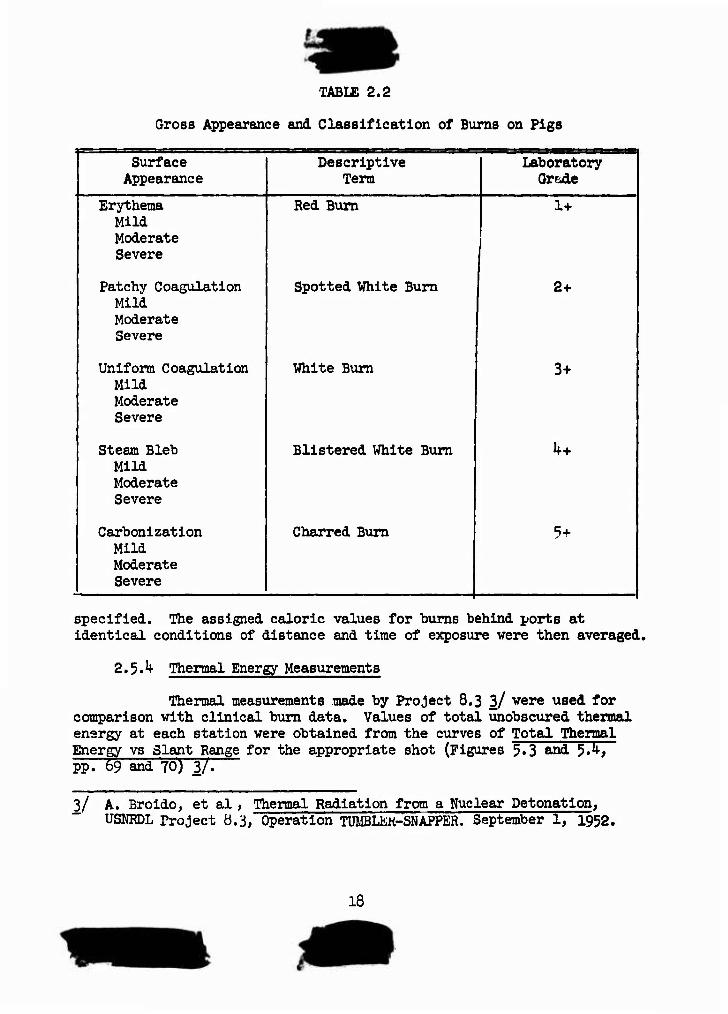
2.5.3 Energy Values Assigned to Bums
Each bum was classified according to the descriptions given in Table 2.2. After the bum was classified, the number of calories which would produce such a bum in the laboratory was determined from the time-intensity threshold values (Figure 2.2) 2/. Each curve on this graph represented the 50 per cent probability of the lesion being produced with the amount of energy and the time
TABIE 2.2
Gross Appearance and Classification of Burns on Pigs
| Surface Descriptive j Laboratory j 1 Appearance Term 1 Gr&de } Erythema Red Burn 1 1+ 1 | Mild
Moderate | Severe
| Patchy Coagulation Spotted White Bum 2+ | | Mild Ij Moderate
Severe
Uniform Coagulation White Bum 3+ j | Mild I Moderate | Severe
| Steam Bleb Blistered White Bum k+ 1 Mild
Moderate I Severe
Carbonization Charred Bum | 5+ ! 1 Mild
Moderate | Severe
specified. The assigned caloric values for bums behind ports at identical conditions of distance and time of exposure vere then averaged.
2.5.1*- Thermal Energy Measurements
Thermal measurements made by Project 8.3 3/ vere used for comparison with clinical bum data. Values of total unobscured thermal energy at each station were obtained from the curves of Total Thermal Energy vs Slant Range for the appropriate shot (Figures 5«3 and 5.k, pp. 69 and 70) 3/.
3/ A. Broido, et al, Thermal Radiation from a Nuclear Detonation, USNRDL Project Ö.3, Operation TUMBLEH-SNAPPER. September 1, 1952.
18
(ZM3) S3i«o"ivo nvioi
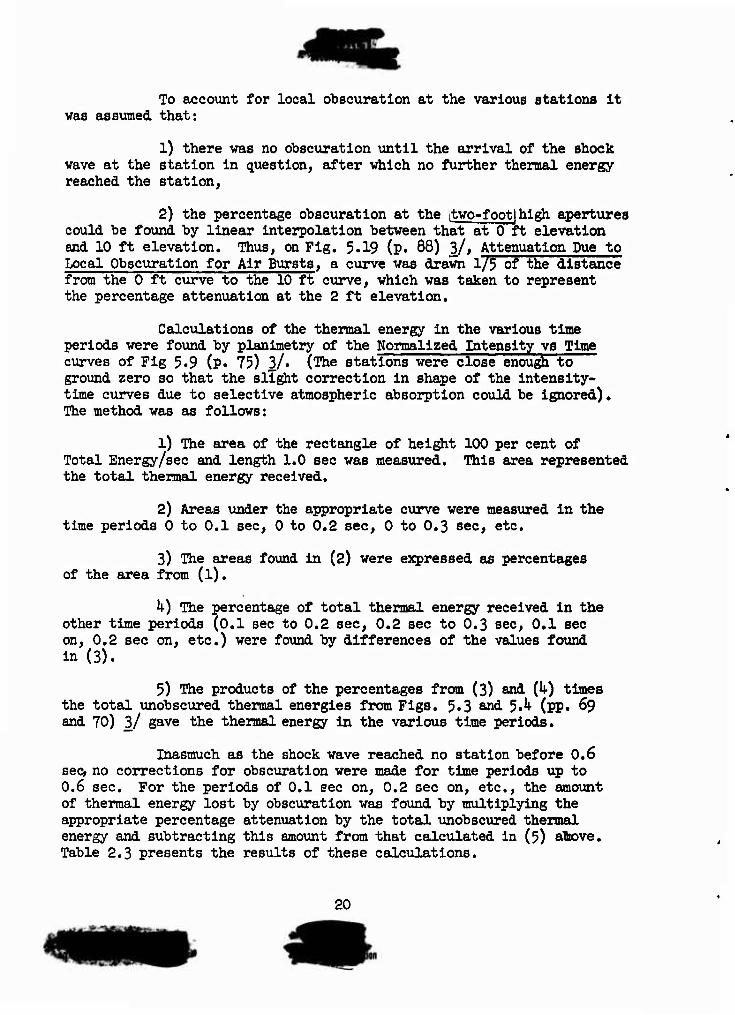
To account for local obscuration at the various stations it was assumed that:
1) there was no obscuration until the arrival of the shock wave at the station in question, after which no further thermal energy reached the station,
2) the percentage obscuration at the two-foot| high apertures could he found by linear interpolation between that at 0 ft elevation and 10 ft elevation. Thus, on Fig. 5«19 (p. 88) 3/, Attenuation Due to Local Obscuration for Air Bursts, a curve was drawn l/5 of the distance from the 0 ft curve to the 10 ft curve, which was taken to represent the percentage attenuation at the 2 ft elevation.
Calculations of the thermal energy in the various time periods were found by planimetry of the Normalized Intensity vs Time curves of Fig 5.9 (p. 75) 3/« (The stations were close enough to ground zero so that the slight correction in shape of the intensity- time curves due to selective atmospheric absolution could be ignored), The method was as follows:
1) The area of the rectangle of height 100 per cent of Total Energy/sec and length 1.0 sec was measured. This area represented the total thermal energy received.
2) Areas under the appropriate curve were measured in the time periods 0 to 0.1 sec, 0 to 0,2 sec, 0 to 0.3 sec, etc.
3) The areas found in (2) were expressed as percentages of the area from (l).
k) The percentage of total thermal energy received in the other time periods (0.1 sec to 0.2 sec, 0.2 sec to 0.3 sec, 0.1 sec on, 0.2 sec on, etc.) were found by differences of the values found in (3).
5) The products of the percentages from (3) and (h) times the total unobscured thermal energies from Figs. 5.3 and 5A (pp. ^9 and 70) 3/ gave the thermal energy in the various time periods.
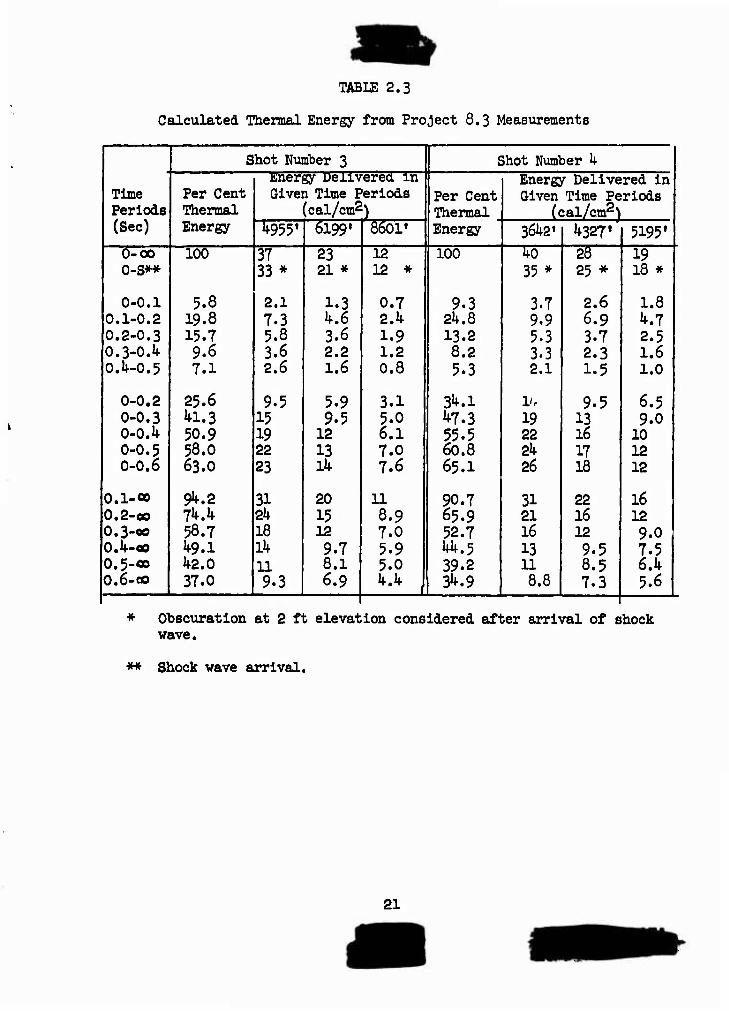
Inasmuch as the shock wave reached no station before 0.6 sec» no corrections for obscuration were made for time periods up to 0.6 sec. For the periods of 0.1 sec on, 0.2 sec on, etc., the amount of thermal energy lost by obscuration was found by multiplying the appropriate percentage attenuation by the total unobscured thermal energy and subtracting this amount from that calculated in (5) alltove. Table 2.3 presents the results of these calculations.
20
TABLE 2.3
Calculated Thermal Energy from Project 8.3 Measurements
1 Shot Number 3
I — ■ ■ i
j Shot Number k \ , Energy Delivered In Energy Delivered in
Time Per Cent Given Time Periods Per Cent Given Time Periods Periods
* Qhscuration at 2 ft elevation considered after arrival of shock wave.
** Shock wave arrival.
21
2.6 OPERATIONS
On D-l the fasted pigs were weighed and clipped with electric clippers having an extra fine head. The skin was washed with water and Inspected for dermatitis or Injury.
From H-6 to H-3 the animals were transported to the station sites where they were given the calculated amount of anesthesia intraperltone- ally. After sleep was Induced they were placed In the exposure con- tainers. Great care was taken to ensure even contact of the sides of the animals against the inner surfaces of the aperture plates.
Approximately 2 hours after the bomb detonation, the animals were recovered from the stations. Careful observations were made as to the condition of ports and shutters to verify that proper operation had occurred. The animals were then returned to the laboratory for evaluation of the burns.
22
CHAPTER 3
BESULTS
3.1 SURVIVAL OF ANIMAIg
There vas one death from anesthesia, occurring at Shot 3 in an animal exposed in an open container suspended from the A-frame. All other pigs were recovered in good condition.
3.2 BURNS - SURFACE APPBARANCE
Satisfactory burns for analysis were produced on all surviving animals exposed except one. In this case (Shot 3> ^955 ft) there was mechanical failure of the release of an aperture plate dust cover at the -5 sec signal. There was evidence, based on inconsistency of the appearance of "burns, that one port shutter at Shot 3 and two port shutters at Shot k did not operate properly. These are des^ mated in Tables 3.1 and 3-2 by "No Data". After Shot 3, the burns on i<hree animals showed evidence of blurring of the longer duration exposures and at the extreme ends of the aperture plates. This appeared to be due to athetoid movements of the animals which were present with light anesthesia. Slightly increasing the anesthesia dosage for animals exposed at Shot k prevented motion without affecting mortality.
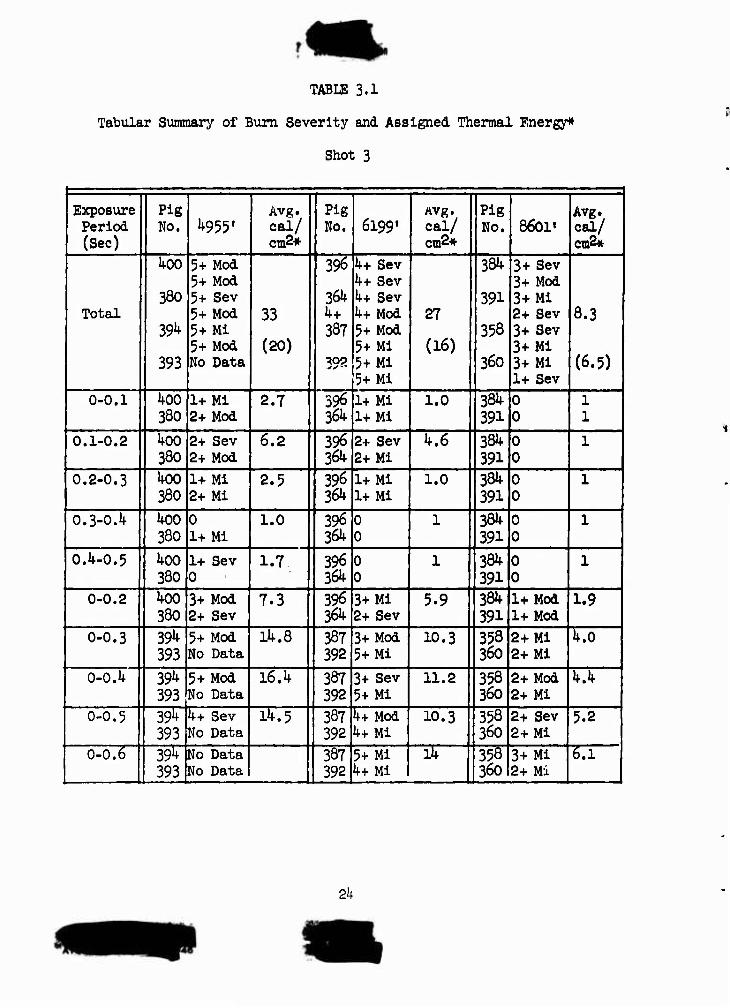
Abrasions existing prior to exposure caused a greater severity of bum in the involved area. This was presumably due to reduced reflectance. Such lesions were always linear or small in diameter, and could be easily detected. Despite great care in positioning an animal behind an aperture plate, there was occasionally slight angulation of the skin surface behind a port. This resulted in a slightly uneven burn, which was graded by the most severely injured portion. The majority of burns were uniform in surface appearance with sharply delineated margins. There was a variable amount of palpable and visible edema which usually disappeared by the 2k hour examination. All bums, regardless of their severity, were surround- ed by a 1-3 mm contiguous zone of erythema. Tables 3.1 and 3.2 show the summery of burn data for Shot 3 and Shot k respectively. The average of assigned energy in cal/cro2 for each exposure condition is also shown in the table.
3.3 EFFECTS OF TOTAL THERMAL PULSE
Figure 3«1 shows the severity of burns produced by exposure to the total thermal pulse of the two bombs at the distances indicated.
TABI£ 3.1
Tabular Summary of Bum Severity and Assigned Thermal Energy*
Shot 3
Exposure j Period 1 (Sec)
1 Pi8 NO. ^955'
Avg. cal/ cm2*
Pig No. 6199' i cal/
cm2*
|pig No. 8601«
Avgv cal/ cm2#
Total
1*00
1 380
1 39U
393
5+ Mod 5+ Mod 5+ Sev 5+ Mod 5+Mi 5+ Mod No Data
33
(20)
396
36^ k+
387
392
\k+ Sev \k+ Sev \k+ Sev 4+Mod 5+Mod 5+Mi 5+Mi 5+Mi
27
(16)
384
391
358
360
3+ Sev 3+ Mod 3+Mi 2+ Sev 3+ Sev 3+Mi 3+ Mi 1+ Sev
8.3
(6.5)
j 0-0.1 koo | 380
1+Mi 2+ Mod
2.7 396 36U
1+ Mi 1+Mi
1.0 384 391
0 0
1 | 1 !
0.1-0.2 hoo I 380
2+ Sev 2+ Mod
6.2 396 36^
2+ Sev 2+Mi
k.6 384 391
0 0
1
0.2-0.3 1^00 1 380
1+Mi 2+ Mi
2.5 396 36^
1+Mi 1+Mi
1.0 384 391
0 0
1 !
0.3-oA Uoo 380
0 1+Mi
1.0 396 36^
0 0
1 | 384 391
0 0
1
0.U-0.5 koo j 380
1+ Sev 0
1,7 396 36^
0 0
1 j 384 391
0 0
1 j
| 0-0.2 1 koo 380
3+ Mod 2+ Sev
7.3 396 364
3+Mi 2+ Sev
5.9 | 384 391
1+Mod 1+Mod
1.9
0-0.3 | i 39^ 1 393
5+ Mod No Data
1^.8 387 392
3+Mod 5+Mi
10.3 j 358 360
2+Mi 2+Mi
4.0
0-0.U | 39^ | 393
5+Mod No Data
l6.k 387 392
3+ Sev 5+Mi
11.2 358 360
2+ Mod 2+Mi
4.4
I 0-0-5 | 39^ 393
k+ Sev No Data
ih.3 387 392
4+Mod k+ Mi
10.3 j 358 36o
2+ Sev 2+Mi
5.2 |
0-0.6 | 39M 393
No Data No Data
387 392
5+ Mi I k+m
ik 35Ö 3601
3+ Mi 2+ Mi
6.1
2k
TABLE 3.1 (Continued)
Tabular Summary of Bum Severity and Assigned Thermal Energy*
Shot 3
1 Exposure Period
i (Sec) 1
1 Pi6 No. ^955'
Avg. cal/ cm2*
Pig No. 6199'
Avg. cal/ cm2*
IPiS No. 8601'
Avg, 1 cal/ cm2*
1 0.1-Totall 1 i^oo 380
5+ Mi 5+Mod
30.5 (17.5)
396' 361^1
k+ Mod 3+ Sev
1^ (9.3)
384 391
2+ Sev 2+Mod
6.8 | (5.5) j
0.2-Total J+oo 380
3+ Sev 3+ Sev
11.0 (TA)
3961 36U
3+ Sev 3+Mi
9.5 1 (6.9)
38U 391
1+Mi 1+ Mod
2.1* (1.9)
0.3-Total 39^ j 393
2+ Sev No Data
7.2 (5.8)
387 3921
2+ Mi 1+ Mod
k.2 ■ (3.o)|
358 360
0 0
1
1 O.l4-Total| 39^ 393
2+ Mod No Data
5.9 ! M)
1 387' 392
0 2+Mi
3.3 (2.5)
358 360
0 1+Mi
1.5 (1.2) 1
0.5-Total 1 39^ , 393
0 No Data
1 3871 392
0 1 358 360
1+ Mi 0
1.0
1 0.6-Total| 39^ 393
No Data No Data
1 | 1 387 392
D 3
1 1358 360
0 0
1 i
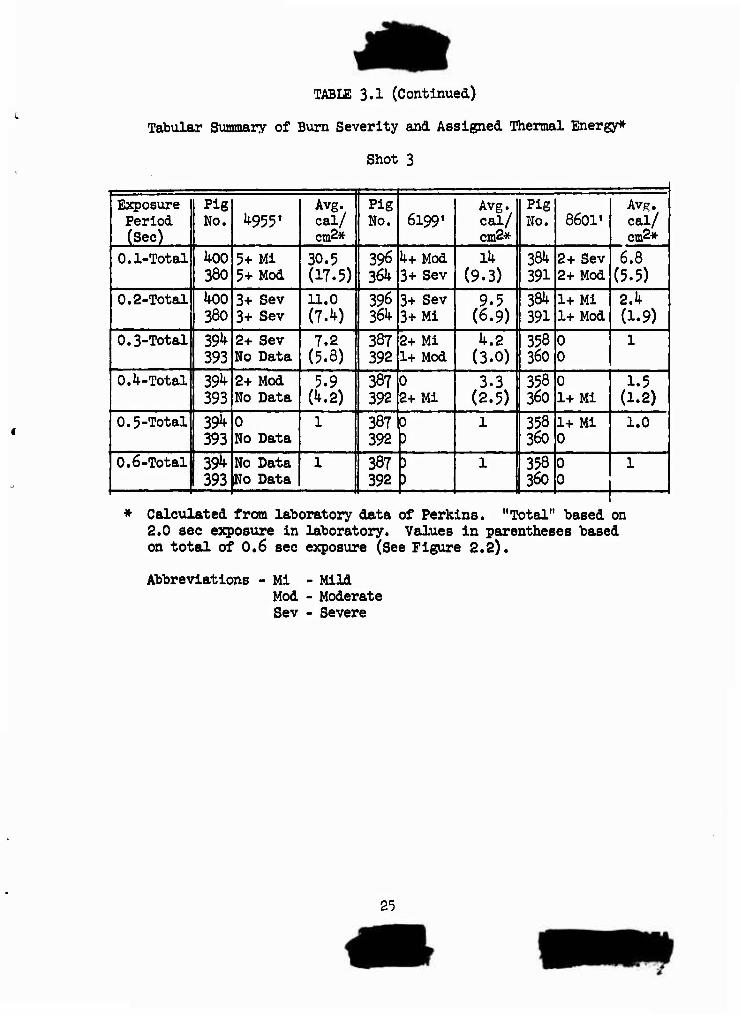
* Calculated from laboratory data of Perkins. "Total" based on 2.0 sec exposure in laboratory. Values In parentheses based on total of 0.6 sec exposure (See Figure 2.2).
Abbreviations Mi Mod Sev
Mild Moderate Severe
25
TABIE 3.2
Tabular Summary of Bum Severity and Assigned Thermal Energy*
Shot k
1 Exposure] Period (Sec)
1 Pig i No' 3642«
Avg. 1 cal/ cm2*
1 Pig No. 1^3271
Avg. 1 cal/ cm2*
1 Pig No. 5195'
Avg. 1 cal/ cm2*
Total i
389
397
| 362
! 377
5+ Sev 5+ Sev 5+ Sev 5+ Sev 5+ Sev 5+ Sev 5+ Sev 5+ Sev
37
(23)
361
386
359
| 379
5+ Mod 5+ Mod 5+ Mod 5+Mod k+ Sev 5+Mi 5+ Sev 5+Mi
31.6
(19)
366
387
357
365
5+Mi 5+Mi 5+Mi 5+Mi 5+Mi 5+Mi 5+Mod 5+Mi
30 j
(18)
0-0.1 389 1397
3+Mi 3+Mi
6.2 36l I 386
1+Mi 2+Mod
2.6 366 378
1+Mod 2+ Sev
3.5
0.1-0.2 1 389 1 397
k+m 3+ Sev
l.k ! 361 1 386
2+ Sev 3+Mi
5.8 366 378
2+Mi 3+Ml
5.0
0.2-0.3 389 1 397
3+Mi 1+Mi
3.7 361 386
0 2+Mi
2.1+ 366 378
0 1+Mi
1.0 j
0.3-0.k 389 397
1+Mod 0
1.0 j 1 361 386
0 0
1 366 378
0 0
1 1 0.^-0.5 | .389
| 397 1+Mi 0
1.0 \ 361 j 386
0 0
1 | 366 378
0 0
1
0-0.2 389 397
5+ Mod 5+Mod
13.5 361 386
k+ Mod 3+Mi
7.3 366 378
3+ Sev 3+Sev
7.3 i
0-0.3 { 362 I 377
5+Mi 5+Mi
13.5 359 j 379
No Data 5+Mi
13.5 357 365
5+Mi 3+Mi
9.9 |
0-0.1* 362 377
5+ Sev No Data
18.5 359 \ 379
W Mod 5+Mod
13.0 357 365
3+ Sev k+ Sev
IX).5 1
0-0.5 j 362 377
k+ Sev 3+ Sev
11.3 359 379
k+ Sev k+ Sev
1^.5 357 365
l^+Mod WMod
10.5
0-0.6 | I 362 1 377
h+ Sev 5+ Mod
17.8 359 1 379
k+ Sev 5+Mi
16.2 357 1 365
l^+Mod 4+Mod
10.5
26
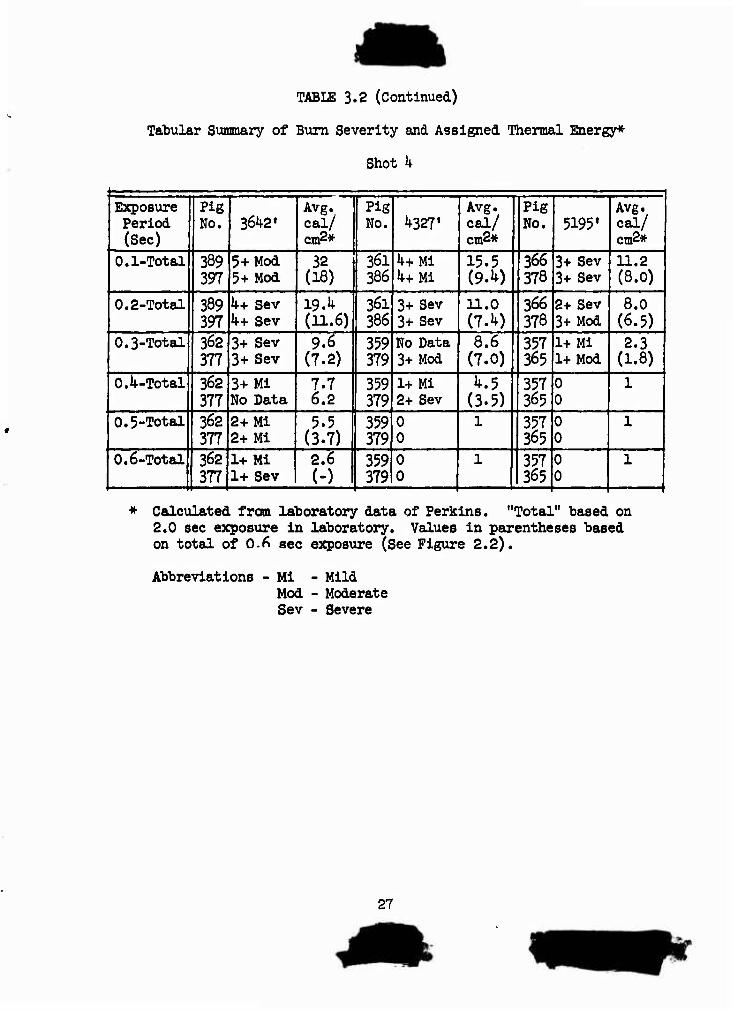
TABLE 3.2 (Continued)
Tabular Summary of Bum Severity and Assigned Thermal Energy*
Shot h
1 Exposure Period (Sec)
|Pig No.
1 36^2'
Avg. cal/ cm2*
1 Pig No. l^'
I Avg. 1 cal/ { cm2* j
|Pig No. 5195'
Avg. cal/ cm2* 1
O.l-Total 389 397
5+ Mod 5+Mod
i 32 (18)
361 386 l^+Mi
15.5 (9.10
366 378
3+ Sev 3+ Sev
11.2 ! (8.0)
1 0.2-Total 389 397
k+ Sev In- Sev
19.^ (11.6)|
361 386
3+ Sev 3+ Sev
11.0 1 (7.^)
366 378
2+ Sev 3+Mod
8.0 i (6.5)
p.3-Total 362 377
3+ Sev 3+ Sev
9.6 (7.2)
359 379
No Data 3+Mod
8.6 | (7.0)
357 365
1+Mi 1+Mod
2.3 ! (1.8)
OA-Total 362 377
3+Ml No Data
7.7 ! 6.2
359 379
1+Mi 2+ Sev
h.5 I (3.5)
357 365
0 0
1 1
p.5-Total 362 377
2+Mi 2+Mi
5.5 (3.7)
359 379
0 0
l | 357 365
0 0
1 \
0.6-Total 362 377
1+ Mi 1+ Sev
2.6 (-) 1 359
379 0 0
l I 357 1365
0 0
1 |
Calculated from laboratory data of Perkins. "Total" based on 2.0 sec exposure in laboratory. Values in parentheses based on total of 0.^ sec exposure (See Figure 2.2).
Abbreviations Mi - Mild Mod - Moderate Sev - Severe
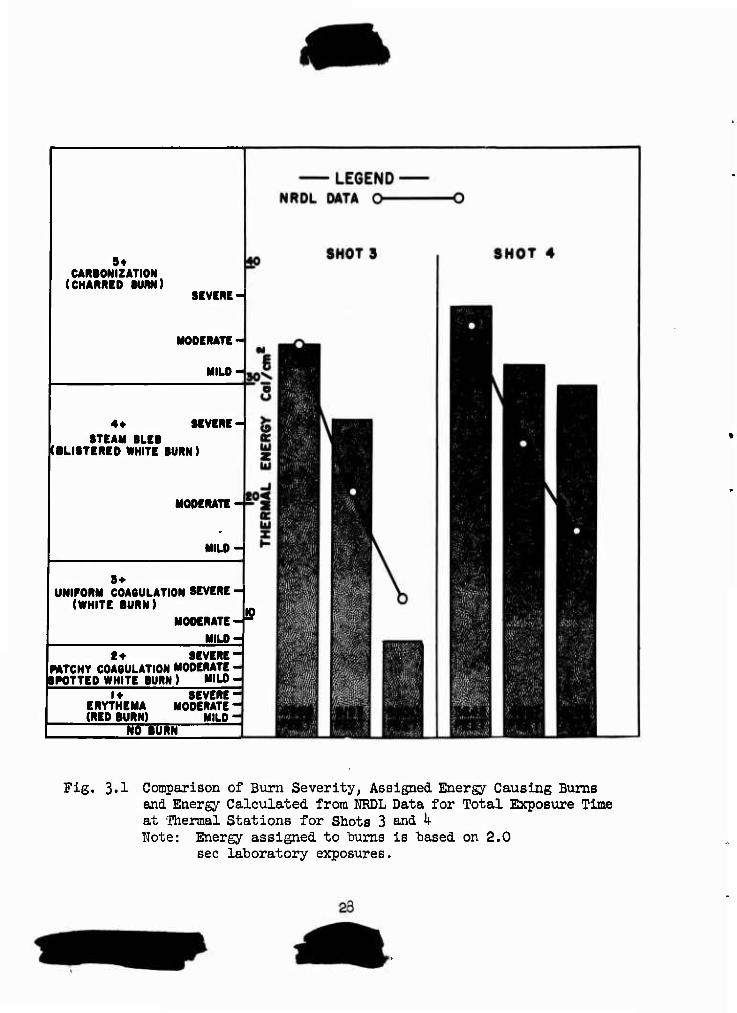
Fig. 3.1 Comparison of Bum Severity, Assigned Energy Causing Bums and Energy Calculated from HRDL Data for Total Exposure Time at Thermal Stations for Shots 3 and k Note: Energy assigned to "bums is based on 2.0
sec laboratory exposures.
At the left of the graph, the descriptive grading is shown and is compared to caloric values in the numerical column. The latter values are based on 2 sec exposures in the laboratory i^ This time vas chosen since at 2 sec 90 per cent of thermal energy had heen delivered. The points connected hy the solid line represent extra- polated data from the calorlmetric measurements made by Project 8.3. It is evident that there is a fair correlation "betveen the severity of burn and the measured energy. The first station (36^2 ft) at Shot k demonstrates a difficulty attendant upon burn assessment by gross appearance. Burns showed the maximum severity distinguishable, namely severe carbonization or charring. Once this state is reached, the effects of added energy cannot be determined grossly. No explanation is apparent for the more severe appearance of the effects at the 6l99 ft station at Shot 3 and all stations at Shot k. Two possibilities are offered to account for this finding. First, the field thermal pulse is characteristically different from the trape- zoidal pulse used in the laboratory. In the bomb thermal pulse there Is a sharply ascending ramp which reaches a maximum in about 0.13 sec and is followed by a more slowly descending ramp and long tall. Second, there is a changing spectrum of radiant thermal energy occurring with time. Further laboratory experimentation is necessary to assess the role of these two factors in bum production.
3.1^ BURNS FROM 0.1 SECOMD PERIODS OF THE THERMAL FUISE
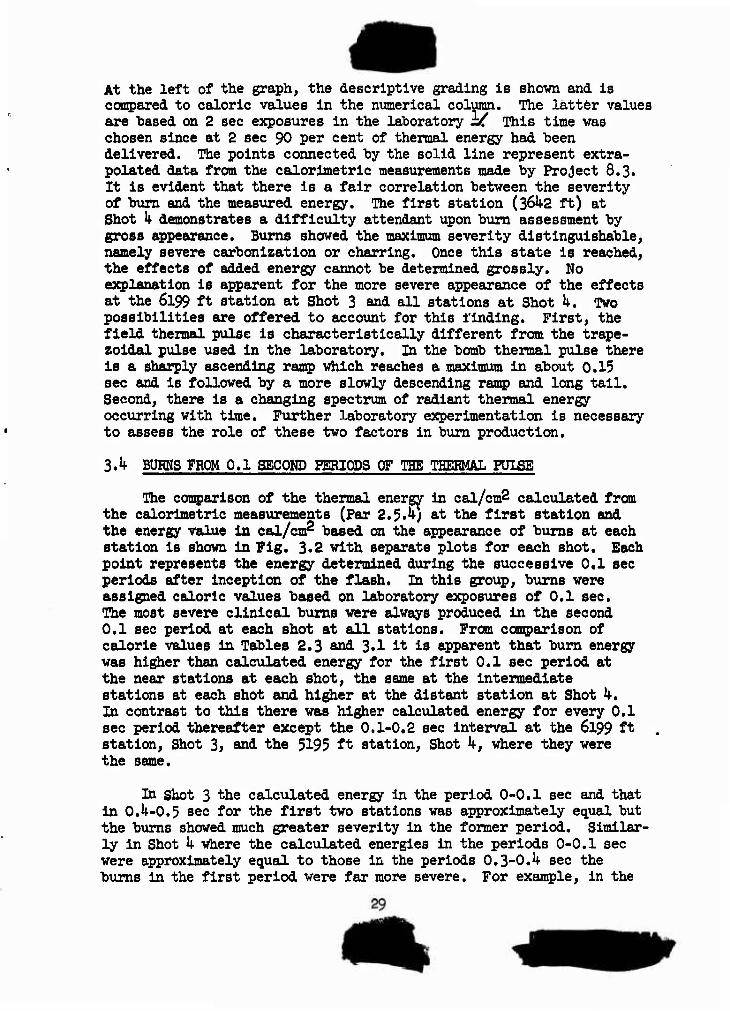
The comparison of the thermal energy in cal/cm^ calculated from the calorlmetric measurements (Par 2.5-5) at the first station and the energy value In cal/cm^ based on the appearance of burns at each station is shown In Fig. 3.2 with separate plots for each shot. Each point represents the energy determined during the successive 0.1 sec periods after inception of the flash. In this group, burns were assigned caloric values based on laboratory exposures of 0.1 sec. The most severe clinical bums were always produced In the second 0.1 sec period at each shot at all stations. From conrparison of calorie values in Tables 2.3 and 3>1 1* Is apparent that bum energy was higher than calculated energy for the first 0.1 sec period at the near stations at each shot, the same at the intermediate stations at each shot and higher at the distant station at Shot k. In contrast to this there was higher calculated energy for every 0.1 sec period thereafter except the 0.1-0.2 sec interval at the 6199 ft station. Shot 3^ and the 5195 ft station. Shot k, where they were the same.
In shot 3 "the calculated energy in the period 0-0.1 sec and that in 0.^-0.5 sec for the first two stations was approximately equal but the bums showed much greater severity in the former period. Similar- ly in Shot k where the calculated energies in the periods 0-0.1 sec were approximately equal to those in the periods 0.3-0.1»- sec the bums in the first period were far more severe. For example, in the
8r SHOT 3 N E
5 6 >- o tc ut z 4 Ui
x
— LCtEND- NROL DATA •■—• 4MB FEET •URN DATA 0 O 4»M ••
& ACIM •' If01 "
(NO BURNS)
7 ^\ 0-0.1 ai-0.2 0.2-0.3 03-04 04-05
f 8H0T4 ^ — LEBEND~ NRDL DATA •"•••• SB4t FEET BURN DATA 0 O SB4t "
H A A 4317 " a—a s iBB
0-0.1 0.1-0.2 02-0.3 0.3-04 0.4-0.5 TIME PERIODS-SECONDS
Fig. 3.2 Thermal Energy in 0.1 Sec Periods Determined from Bums at All Stations and from Physical Measurements at Inner Stations, Shots 3 and k
30
36^2 ft station, Shot k where the calculated energy in 0-0.1 sec was 3.7 cal/cm2, two 3+ hums were produced. In contrast, calculated energy in 0.3-0.^ sec of 3^3 cal/cm2 produced a 1+ "burn and no burn.
Movies taken at 6k frames per second of the fronts of the stations during the period to 0.5 sec revealed no evidence of mechanical failure of shutters or interference by dust.
From the above evidence it was concluded that the measured thermal energy was far more effective in producing thermal bums in the early phases of the thermal pulse than in the later periods. It was also apparent, that, for the weapons involved, the second 0.1 sec period was the most effective in producing bums.
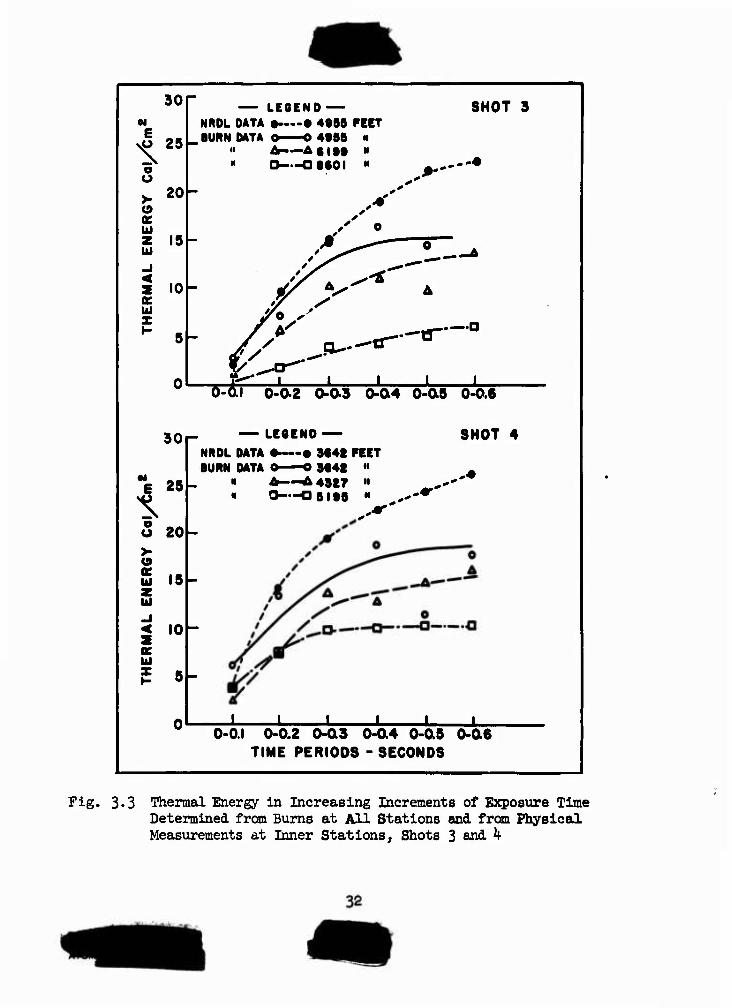
3.5 BURNS FROM EXPOSURE TO INCREASING JICKEMENTS OF THE THERMAL PUIgE
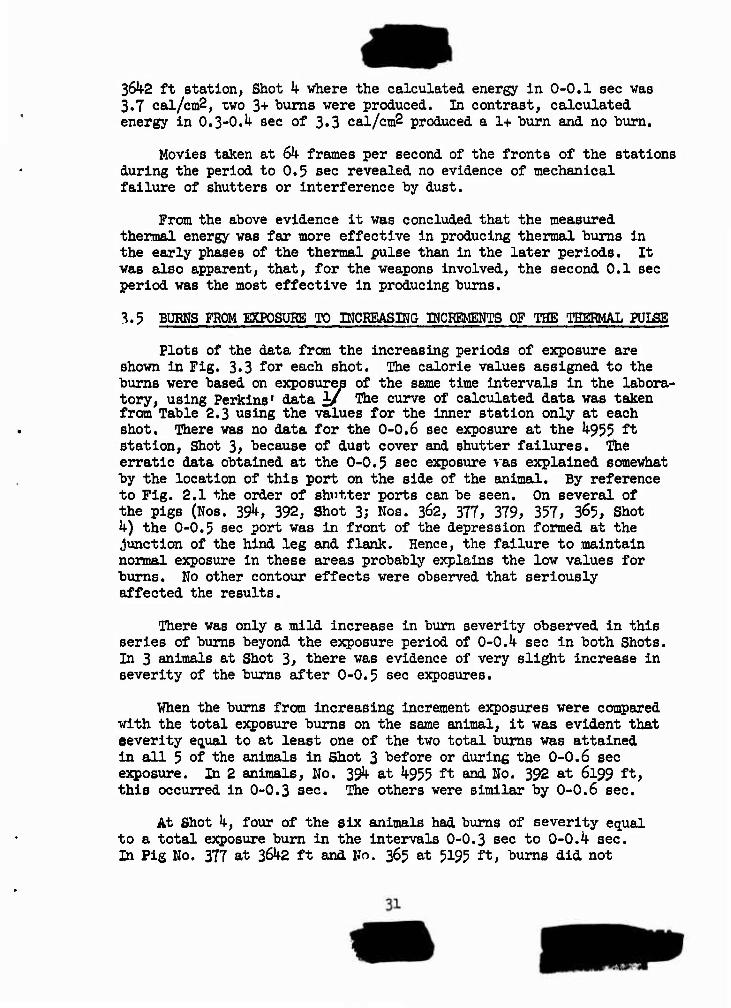
Plots of the data from the increasing periods of exposure are shown in Fig. 3*3 for each shot. The calorie values assigned to the bums were based on exposures of the same time intervals in the labora- tory, using Perkins' data 1/ The curve of calculated data was taken from Table 2.3 using the values for the inner station only at each shot. There was no data for the 0-0.6 sec exposure at the ^955 ft station, Shot 3> because of dust cover and shutter failures. The erratic data obtained at the 0-0.5 sec exposure vas explained somewhat by the location of this port on the side of the animal. By reference to Fig. 2.1 the order of shutter ports can be seen. On several of the pigs (Nos. 39^, 392, Shot 3; Nos. 3^2, 377, 379, 357, 3^5, Shot k) the 0-0,5 sec port was in front of the depression formed at the junction of the hind leg and flank. Hence, the failure to maintain normal exposure in these areas probably explains the low values for bums. No other contour effects were observed that seriously affected the results.
There was only a mild increase in bum severity observed in this series of bums beyond the exposure period of 0-0.^ sec in both Shots. In 3 animals at Shot 3, there was evidence of very slight increase in severity of the burns after 0-0.5 sec exposures.
When the bums from increasing increment exposures were compared with the total exposure bums on the same animal, it was evident that eeverity equal to at least one of the two total bums was attained in all 5 of the animals in Shot 3 before or during the 0-0.6 sec exposure. In 2 animals, No. 39if at ^955 ft and No. 392 at 6199 ft, this occurred in 0-0.3 sec. The others were similar by 0-0.6 sec.
At Shot k, four of the six animals had bums of severity equal to a total exposure bum in the intervals 0-0.3 sec to 0-0.4 sec. In Pig Ho. 377 at 36^2 ft and No. 365 at 5195 ft, bums did not
30 N
>u 25
o u >- 20 o oc w z 15 ui
lü
10-
5-
LESEND NRDL DATA ••—• 40S5 FEET BURN DATA 0 O 4DB5 »
A—A« Iff " H O—OMOI •'
SHOT 3
.--♦
ro y
1/ / /
0 - o
.j-r* --13—
X X
—a
x I 0-0.2 0-0-3 0-04 0-05 0-0.6
30|-
E 25
^ u 20 >■ (9
£ 15 ui «j < 10 ae bJ
5-
LEBEND NRDL DATA •—•• SB4t FEET BURN DATA 0 0 9B4t ••
• AP—^A48tT •' " tl—OBIBB " -„-
SHOT 4
X X X X X X 0-0.1 0-0.2 0-03 0-O4 0-05 0-0$
TIME PERIODS - SECONDS
Fig. 3*3 Thermal Energy in Increasing Increments of Exposure Time Determined from Bums at All Stations and from Physical Measurements at Inner Stations, Shots 3 and \
attain the severity of the total "bum by 0-0.6 sec. In the case of No. 311 > the shutter for the port 0-0. ^ sec and 0,^ sec-total failed This would indicate that the 0-0.5 sec and the 0-0.6 sec exposure may also have "been involved, but there was no conclusive evidence for this. In the other animal, the lack of good apposition of the skin behind the ports was indicated by the less severe burns of the lower row, 0-0,5 sec and 0-0.6 sec, compared to the more severe 0~0,k sec burn on the upper row.
From this series of exposures It was concluded that nearly all the effective thermal energy for the production of cutaneous burns had been delivered within the first 0.5 sec. Table 2.3 shows that In this time for Shot 3^ 58 per cent and for Shot k, 60.8 per cent of the thermal energy had been delivered. The remaining amount had little effect in causing Increased severity of bums. In the case of both Shots 3 and k at the inner stations this would amount to approximately 11 cal/cm?. If this amount of energy from the carbon arc were applied to skin surface over a 2.0 sec period, it would cause a severe 3+ burn on normal skin.
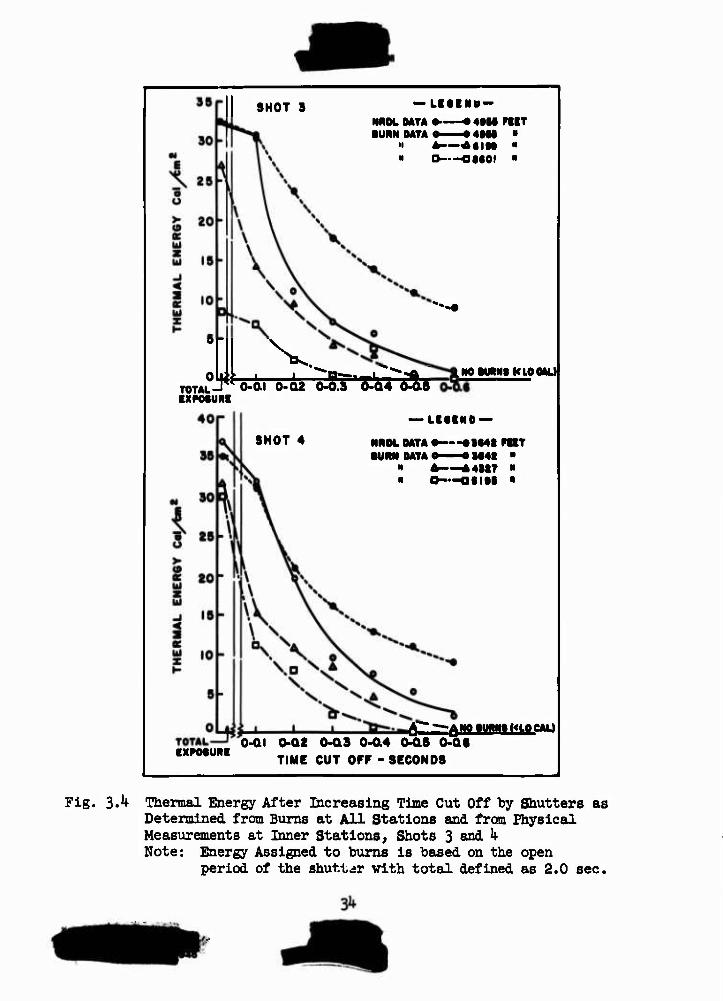
3.6 EFFECTS OF INCREASING INITIAL CUT-OFF OF THE THERMAL PÜISE
In Fig. 3 A comparisons are shown between the calculated thermal energy (NRDL data) at the Innermost station delivered after the time cut-off by the shutters and the assigned energy from bums tinder the same conditions at all stations. Data from Shots 3 and h are plotted separately. To the left of each graph a column showing total thermal energies is presented to complete the range of exposures. It is evident that the bum severity decreased more rapidly than the calculated energy. Bums produced after 0.3 sec at each Shot were mild. There were no significant bums produced when the thermal energy in the first 0.6 sec had been blocked by the shutters. Only two animals, Nos. 362 and 377 at the 3Ö4-2 ft station. Shot k, revealed burns beyond this time. In Par. 3*5^ question was raised concerning the operation of the shutter for No. 377« Any failure would have been reflected in this series of bums. The per cent of energy delivered after 0.6 sec was 37 per cent for Shot 3 and 35 per cent for Shot U, At the inner stations this amounted to 9.3 cal/cm? and 8.8 cal/cvß respectively. In the laboratory these amounts delivered to an animal even over a 2.0 sec period would produce moderate coagulated (white) hums. Since it was demonstrated that there was no significant burning after 0.6 sec both by the increasing increment exposures and by the increasing initial cut-off exposures, the burns were re-assigned energy values on the basis of an C.6 sec laboratory bum with the carbon arc source. These data are presented In Tables 3.1 and 3.2 in parentheses beneath the figure for 2.0 exposure data. The average percentage of measured energy producing the total exposure burna for fall stations at Shot 3 was 6^ per cent, while at Shot k It was 81 per cent. The latter figure was elevated by the unexplained severe
33
SHOT 3 NUM. MTA ••—-«4»N PIIT ■URN MTA 0 0 4tW "
» O—OMO) *
TOTAL EXPMURE
. _r^ o-ai 0-02 0-0.3 o-a4 o-as
SHOT 4 NNOL MTA •>--«»«41 WIT MMt MTA 0 ■ M4I "
" A—*4U7 " • o—auti •
CXPOtURI o-ai o-o2 o-as o-a4 o-as o-at
TIME CUT OFF - SECONDS
ff^—flUOMIWIlWtOMLl
Fig. 3.1*- Thermal Energy After Increasing Time Cut Off "by Shutters as Determined from Burns at All Stations and from Physical Measurements at Inner Stations, Shots 3 and k Note: Energy Assigned to burns is based on the open
period of the shutter with total defined as 2.0 sec.
total exposure burns at the 5195 ft station. The lower figure compared well with the calculations of per cent of measured energy delivered in the first 0.6 8ec-63 per cent, Shot 3 and 65 per cent, Shot k (Table 2.3). It was concluded from this that approximately 70 per cent of the measured total thermal energy delivered in the first 0.6 sec was responsible for the cutaneous burns produced by exposure to the weapons involved.
A further comparison of the effectiveness of various portions of the thermal pulse was made by inspecting Tables 3*2 and 3.3. For Shot 3 the burns produced in the period of 0-0.2 sec at all stations were approximately equal in severity to those produced by the portion of the pulse from 0.2 sec to total. For Shot k, the burns in the first 0.2 sec were slightly more severe than those caused in the later period. In calculations of the measured energy (Table 2.3) there was 25.6 per cent at Shot 3 and 3^.1 per cent at Shot k in the 0-0.2 sec Interval. In the period from 0.2-0.6 sec, 37.^ per cent for Shot 3 Bnä. 31 per cent for Shot h were delivered. This supported the evidence that the 0.2 sec period accounted for l/2 of the effective burning which ended by 0.6 sec.
3.7 RESULTS OF COMPARISON OF SMALL MD LARGE AREA BUMS
The three animals recovered from the 8601 ft station. Shot 3; and the four animals recovered from the 78^9 ft station. Shot k, were evaluated for a comparison of the burns behind the small (0.17 In. diameter) aperture and the large rectangular (3 x ^.5 in.) aperture. Two of the three animals from Shot 3 showed burns diagnosed as 2+ severe and the third was rated 3+ severe in the large areas. There were no significant differences noted grossly or microscopically between the large and small areas where the animal presented a plane surface to the ports. Of the four animals recovered from the 78^9 ft station, Shot k, 2+ mild to 2+ moderate burns were observed in both large and small ports on normal skin areas. In areas where India ink had been applied prior to the Shot, there was severe superficial blistering and carbonization, but microscopically, no differences in burn depth covud be detected.
3.8 MICROSCOPIC EVALUATION OF BURNS
3.8.1 General
The lesions observed in the skin of the animals were those usually seen in "flash" bums and are outlined in 2.5.2. In reporting the results, reliance has been placed principally on the depth of the burn, instead of other criteria, since depth is the most reliable biological estimate of the intensity of the hyperthermia. This estimate of depth is based on changes in the corium and the epithelial cells of the epidermis and hair follicles. Frequently the depth as
measured by hair follicle epithelial changes was slightly greater than that observed In the corlum. However, this difference was too small to have effect on the final results as reported. Difficulties In the estimation of depth were encountered In the burns because of the following factors:
(1) slight differences In the morphology of Injured and uninjured corlum
(2) variations of thickness of corlum
(3) contraction of coagulated or carbonized skin
(U) absence of vascular or inflammatory reaction.
If biopsies had been taken later than 2k hours, the development of an inflammatory barrier might have helped in outlining the depth of irreparable injury. The results were extremely variable and unsatis- factory in regard to the total exposure bums as can be seen in Tables 3*1 and 3*2. The depth evaluation did not compare with gross evaluation. An improved method is needed for the microscopic deter- mination for the depth of damage in skin.
The lesions produced in this experiment resembled closely those resulting from laboratory arc bums. The sharp demarcation between injured and normal tissue, and the absence of edema, con- gestion and inflammatory reaction at 24 hours were similar. The main difference between the arc bum and the bum produced in the field was that the contour of the former was that of a half moon, while the contour of the latter was that of a truncated cone.
3.8.2 Bum Depth - Shot 3
Total exposures at all three stations resulted in bums averaging 0.5 nnn at the first, 0.8 ram at the second and 0.3 mm at the third station. Carbonization, basophilic dermal, coagulation and bleb formation were observed in inverse proportion to the distance from ground zero. The lower figure for the first station as compared with the second may be due to the contraction of the burned skin.
With the 0.1 sec time period burns, the greatest effect occurred from 0.1-0.2 sec with an average depth of burn of 0.5 mm at the first station, 0.06 ram at the second station, and none at the third station. Depth of burn with this exposure was also correlated with qualitative evidence of more severe burn damage than was observed at the other time periods. Progressively decreasing and minimal evidence of burn damage resulted from 0.1 sec time interval exposures after 0.3 sec. These observations were generally substantiated by the results obtained with the other time exposures studied. At Shot 3 t.'ie microscopic comparison of 0-0.2 sec burns as compared to
0.2 sec-total bums did not support the similar gross appearance of the two.
From the microscopic data obtained from Shot 3 (Table 3«3) it may be concluded that the peak of greatest thermal damage to skin occurred from 0.1-0.2 sec and that only slight damage occurred after O.h sec at the stations used.
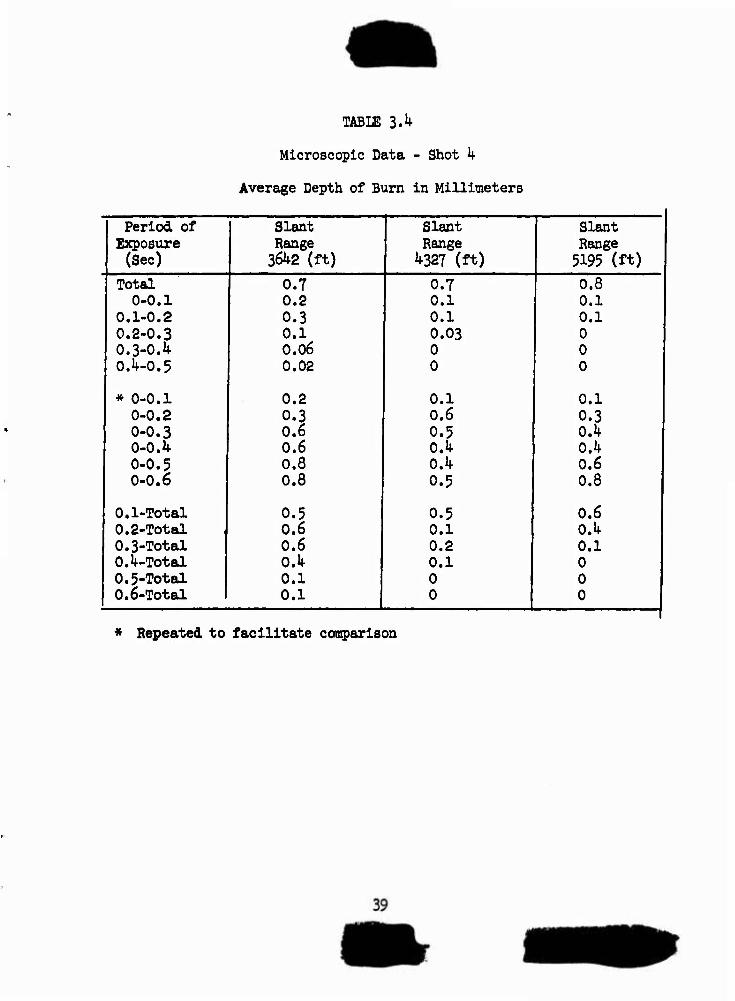
3.8.3 Burn Depth - Shot k
Total exposures at all three stations resulted in burns averaging 0.7 mm in skin depth. No significant average difference in depth of burning at any of the three stations was observed. There was carbonization, basophilic dermal coagulation and occasional bleb formation in nearly all of these exposure effects.
With the 0.1 sec time period bums the greatest effect occurred from 0.1-0.2 sec with an average depth of bum of 0.3 mm at the first station, 0.1 mm at the second station and 0.08 mm at the third station. Depth of bum with this exposure was also correlated with qualitative evidence of more severe bum damage than was observed at the other 0.1 sec time periods. Progressively decreasing and minimal evidence of bum damage resulted from 0,1 sec time period exposures after 0.3 sec. These observations were generally substan- tiated by the results obtained with the other time exposures studied. As in Shot 3> the comparison of 0-0.2 sec bums and 0.2-total bums did not support the similar gross appearance.
From the microscopic data obtained from Shot k (Table S«^) it may be concluded that the peak of greatest thermal damage occurred from 0.1-0.2 sec and that only slight damage occurred after 0,k sec at the stations used.
TABLE 3.3
Microscopic Data - Shot 3
Average Depth of Burn In Millimeters
1 Period of Slant Slant Slant | | Exposure Range Range Range
1^.1 CONCLUSIONS FROM RESULTS OF THE WEAPONS TESTED
The skin bums produced In the period between 0.1 a id 0.2 sec after bomb detonation are the most severe of any created by an 0.1 sec Interval of the thermal pulse.
By Increasing Increments of exposure, the major severity of thermal bums Is attained within the first 0.3 sec and the maximum severity within the first 0.5-0.6 sec after bomb detonation.
When pig skin is shielded from the first 0.6 sec of the thermal pulse, no significant bums are produced. Yet the calculated per cent of measured thermal energy delivered after this time was 37 per cent for Shot 3 and 35 Per cent for Shot U.
Bums produced in the first 0.2 sec of the thermal pulse are approximately equal in severity to those produced in the period of 0.2 sec to the end of the pulse. Calculations from measured energy reveal approximately 30 per cent of the total in the first 0.2 sec and an equal amount in the 0.2-0.6 sec period.
There is better correlation between the measured thermal energy and that determined by evaluating the skin bums from laboratory standards during the first 0.3 sec than during later periods of the thermal pulse where the measured values are always significantly higher.
There are no apparent differences between the severity of snail diameter (0.75 in.) and large (3 x k,5 in) burns when sustained in the same animal.
Existing methods for microscopic evaluation are inadequate for the study of the depth of bums vhen dermis is involved.
h.2. RECOMMENDATIONS
Since there is not good correlation between measured thermal energy and the severity of bums after 0.3 sec, re-examination of instrumentation for measurements of effective thermal energy is required. A study of the spectrum of the thermal pulse and its effect upon cutaneous bums is also indicated.
40
Further work should he done first In the laboratory and later In the field on the Influence of skin color on hum severity.
As soon as laboratory results warrant, further field tests should he made on the protective effects of fabrics against burns.
Improved methods should be developed for the assessment of burn depth.
a
BIBLIOGRAPHY
1/ Perkins, J. B., Pearse, H. E., and Klngsley, H. D., A Study of Radiant Energy Bums; The Effect of Exposure Time and Intensity, UR-217, (University of Rochester Atomic Energy Project Report), 1952.
2/ Pearse, H. E., et al. Thermal Radiation Injury, Operation GREEN- HOUSE, Annex 2.7, Final Report.
3/ Broldo, A., et al. Thermal Radiation from A Nuclear Detonation, USNRDL Project 8.3, Operation TUMBLER-SNAPPER, 1 September 1952.
DISTRIBUTION
AHMT ACTIVITIES
Copy No.
Asat. Chief of Staff, 0-1, D/A, Washington 25, D. C. ATTN: Human Relations and Research Board 1
Asst. Chief of Staff, G-2, D/A, Washington 25, D. C. 2 Asst. Chief of Staff, G-3, D/A, Washington 25, D. C.
ATTN: MCofS, G-3, (HR&SW) 3 Asst. Chief of Staff, G-4, D/A, Washlngtm 25, S. C. ^ Chief of Ordnance, D/A, Washington 25, D. C. ATTN:
CKDES-AR 5 The Surgeon General, D/A, Washington 25, D. C. ATEN:
Chairman, Med. Research and Development Board 6- 6 Chief Chemical Officer, D/A, Washington 25, D. C. 9- 10 Chief of Engineers, D/A, Military Construction Division,
Protective Construction Branch, Washington 25, D. C. ATTN: ENGEB U
The Quartermaster General, CBR, Liaison Office, Research and Development Division, D/A, Washington 25, D. C. 12- 13
Office, Chief of Transportation, Military Planning and Intelligence Division, Bldg. T-7, Washington 25, D. C. ll*
Chief, Army Field Forces, Ft. Monroe, Ta. 15- Iß Army Field Forces Board #1, Ft. Bragg, N. C. 19 Army Field Forces Board #2, Ft. Ehox, Xy. 20 Commanding General, First Army, Governor's Island, New
Tork k, N. T. ATTN: G-l 21 Commanding General, First Army, Governor's Island, New
York kf N. T. AOTN: G-2 22 Commanding General, First Army, Governor's Island, New
Tork 1*, N. T. ATON: 0-3 23 Commanding General, First Army, Governor's Island, New
York k, N. Y. AEEN: G-k 2k' 25 Commanding General, Second Army, Ft. George 0. Meade, Md.
ATTN: AIAME 26 Coomandlng General, Second Army, Ft. George 0. Meade, Md.
ATTN: AIACM 27 Commanding General, Third Army, Ft. McFherson, Ga.
ATTN: ACofS, G-3 28- 29 Commanding General, Fourth Army, Ft. Sam Houaton, Tex.
AETN: G-3 Section 30- 31
DISTRIBUTION (Continued) Copy No.
Comnanalng General, Fifth Army, 1660 E. Hyde Park Blvd., Chicago 15, 111. ATTN; ALFMD-0
Commanding General, Sixth Army, Presidio of San Franciaco, Calif. ATTN: AMGCT-4
Commander-ln-Chlef, European Command, AFO 1(03, 0/0 £M, New York, N. T.
Conmander-in-Chief, Far East Command, AFO 500, c/o PM, San Francisco, Calif. ATTN: ACofS, G-3
Commanding General, U. S. Forces Austria, APO 168, c/o FM, New York, N. Y. ATTN: ACofS, G-3
Commanding General, U. S. Army Alaska, AFO 9^2, c/o PM, Seattle, Wash.
Commanding General, U. S. Army Caribbean, AFO 83k, c/o FM, New Orleans, La. ATTN: CG, USABCABIB
Commanding General, U. S. Army Caribbean, AFO 834, c/o FM, New Orleans, La. ATTN: CG, USARFANT
Commanding General, U. S. Army Caribbean, AFO 834, c/o FM, New Orleans, La. ATTN: Chemical Officer, USABCABIB
Commanding General, U. S. Army Caribbean, APO 834, c/o FM, New Orleans, La. ATTN: Surgeon, USABCABIB
Commanding General, U. S. Army Pacific, AFO 958* c/o FM, San Francisco, Calif. ATTN: Chemical Officer
Commanding General, U. S. Army Europe, AFO 403, c/o FM, New York, N. Y. ATTN: OPOT Dlv., Combat Dev. Branch
Commanding General, Trieste \J. S. Troops, AFO 209, c/o FM, New York, N. Y. ATTN: ACofS, G-3
Commandant, Command and General Staff College, Ft. Leaven- worth, Kan. ATTN: AELIS(AS) Ny
Commandant, The Infantry School, Ft. Banning, Ga. ATTN: C.B.S.
Commandant, The Artillery School, Ft. Sill, Okla. Commandant, The AA&GM Branch, The Artillery School, Ft.
Bliss, Tex. 58 Commandant, The Armored School, Ft. Ehox, Ky. ATTN: Clas-
sified Document Section, Evaluation and Besearch Division 59- 60
Commanding General, Medical Field Service School, Brooke Army Medical Center, Ft. Sam Houston, Tex. 6l
Commandant, Army Medical Service Graduate School, Walter Beed Army Medical Canter, Washington 25, D. C. ATTN: Department of Biophysics 62
The Superintendent, U. S. Military Academy, West Point, N. Y. ATTN: Professor of Ordnance 63
Commandant, Chemical Corps School, Chemical Corps Training Command, Ft. McClellan, Ala. 64
Commanding General, Besearch and Engineering Command, Army Chemical Center, Md. ATTN: Special Projects Officer 65- 66
32- • 35
36
37
38- ■ 42
43
44
45
46
47
48
49- 50
51- 52
53
54
55- 56 57
67- ■ 68
69- • 71
72
73
7^
75
76
77- 78
79
80
DlgERIBüTIOW (Continued) Copy No.
RD Control Officer, Aberdeen Proving Ground, Md. ATTM: Ballistics Research Laboratory
Commanding General, Tho Engineer Center, Ft. Belvoir, Va. ATTN: Asst. Commandant, The Engineer School
Commanding General, The Transportation Center and Ft. lust is, Va. ATTN: Asst. Commandant, Military Sciences and Tactics
Chief of Research and Development, D/A, Washington 25, D. C.
Ccomanding Officer, Engineer Research and Development Laboratory, Ft. Belvoir, Va. ATTN: Chief, Technical Intelligence Branch
Commanding Officer, Picatinny Arsenal, Dover, N. J. ATTN: CEDBB-TK
Commanding Officer, Army Medical Research Laboratory, Ft. Enox, Ky.
Commanding Officer, Chemical Corps Chemical and Radio- logical Laboratory, Army Chemical Center, Md. ATTN: Technical Library
Director, Technical Documents Center, Evans Signal Laboratory, Belmar, N. J«
Commanding Officer, Transportation Research and Develop- ment Station, Ft. Suet is, Va.
Commander, Air Force, U. S. Pacific Fleet, Naval Air Sta- tion, San Diego, Calif. 107
Commander, Training Command, U. S. Pacific Fleet, c/o Fleet Sonar School, San Diego kf, Calif. 108
Commanding Officer, Naval Damage Control Training Center, USN Base, Philadelphia 12, Pa. ATTN: ABC Defense Course 109
Commanding Officer, Naval Unit, Chemical Corps School, Ft. McClellan, Ala. 110
Joint Landing Force Board, Marine Barracks, Camp Lejeune, N. C. Ill
Commander, USN Ordnance Test Station, Inyokem, China Lake, Calif. 112
Officer-ln-Charge, USN Civil Engineering Research and Evaluation Laboratory, Construction Battalion Center, Port Huenema, Calif. ATEN: Code 753 113-11^
Commanding Officer, USN Medical Research Institute, National Naval Medical Center, Bethesda Ik, Md. 115
Director, The Materiel Laboratory, New York Naval Ship- yard, New York, N. Y. Il6
Commanding Officer and Director, USN Electronics Labo- ratory, San Diego 52, Calif. ATTN: Code 25O 117
Commanding Officer and Director, USN Engineering Experi- ment Station, Annapolis, Md. ATTN: Code 155 UB
Commanding Officer, USN Radiological Defense Laboratory, San Francisco, Calif. ATTN: Technical Information Division 119-1^2
Clothing Supply Office, USN Supply Activities, 3d Ave. and 29th St., Brooklyn 32, N. Y. ATTN: Research and Development 123
46
DISTRIBUTION (Continued) Copy No.
Canmander, Naval Air Development Center, Johnsvllle, Pa. 124 Commanding Officer, Office of Naval Research Branch Of-
ficer, 1000 Geary St., San Francisco, Calif. 125-126
AIR FORCE ACTIVITIES
Asct. for Atomic Energy, Headquarters, USAF, Washington 25, D. C. ATTN: DCS/0
Ass'c. for Atomic Energy, Headquarters, USAF, Washington 25, D. C. ATTN: BMSCW Division
Asst. for Development Planning, Headquarters, USAF, Washington 25, D. C.
Director of Operations, Headquarters, USAF, Washington 25, D. C.
Director of Flans, Headquarters, USAF, Washington 25, D. C. ATTN: War Plans Division
Directorate of Requirements, Headquarters, USAF, Washing- ton 25, D. C. ATTN: APDRQ-SA^l
Directorate of Research and Development, Armament Divi- sion, Des/D, Headquarters, USAF, Washington 25, D. C.
Directorate of Intelligence, Headquarters, USAF, Wash- ington 25, D. C.
The Surgeon General, Headquarters, USAF, Washington 25, D. C.
Commanding General, U. S. Air Forces Europe, AFO 633, c/o Hd, New York, N. T.
Commanding General, Far East Air Forces, AFO 925« c/o FM, San Francisco, Calif.
Commanding General, Alaskan Air Comnand, APO 9^2, c/o FM, Seattle, Wash. ATTN: AAOTN
Commanding General, Northeast Air Command, APO 862, c/o IM, New Tork, N. T.
Commanding General, Strategic Air Command, Offutt AFB, Omaha, Neh. ATTN: Chief, Operations Analysis
Commanding General, Tactical Air Command, Langley AFB, 7a. ATTN: Documents Security Branch
Commanding General, Air Defense Command, Ent AFB, Colo. Commanding General, Air Materiel Command, Wright-Patter-
son AFB, Dayton, Ohio Conmanding General, Air Training Command, Scott AFB,
Belleville, 111. Commanding General, Air Research and Development Command,
FO Box 1395« Baltimore 3, Md. ATTN: RDDN Commanding General, Air Proving Ground Command, Eglin
AFB, Fla. ATTN: AG/TRB Commanding General, Air University, Maxwell AFB, Ala. Commandant, Air Command and Staff School, Maxwell AFB,
Ala. 168-169 47
127
128
129-130
131-132
133
134
135
136-137
138-139
llfO
lUl
Ik2-lk6
Ikl
lk8
U9-151 152-153
15^-156
157-158
159-161
162 163-167
UNCLASSIFIED DISTRIBUTION (Continued) Copy No.
Commandant, Air Force School of Aviation Medicine, Randolph AFB, Tex. 170-171
Commanding General, Wright Air Development Center, Wright- Patterson AFB, Dayton, Ohio. ATTN: WC0E3F 172-173
Commanding General, AF Cambridge Research Center, 230 Albany St., Cambridge 39» Mass. ATTN: Atomic War- fare Directorate 17^
Commanding General, AF Special Weapons Center, Klrtland AFB, N. Mex. ATTN: Chief, Technical Library Branch 175-177
Commandant, USAF Institute of Technology, Wright-Patter- son AFB, Dayton, Ohio. ATTN: Resident College 178
Commanding General, Lovry AFB, Denver, Colo. ATTN: Depart- ment of Armament Training 179-180
Commanding General, 1009th Special Weapons Squadron, Tope "T", Uth & Constitution Sts., IM, Washington 25, D,C# lßl-183
The RAND Corporation, 1700 Main Street, Santa Monica, Calif« ATTN: Nuclear Itoergy Division 184-16?
OTHBB DBiFTS. OF DEFENSE ACTIVITIES
Executive Secretary, Joint Chiefs of Staff, Washington 25, D. C. ATTN: Joint Strategic Plans Committee IB6
Director, Weapons Systems Evaluation Group, Rmt 2E1006, Pentagon, Washington 25, D. C. 187
Asst. for Civil Defense, OSD, Washington 25, S. C. 186 Chairman, Research and Development Board, D/D, Washing-
ton 25, D. C. ATTN: Technical Library 169 Executive Secretary, Committee on Atonic Energy, Research
and Development Board, Rm. 3B1075, Pentagon, Washing- ton 25, D. C. 190-191
Executive Secretary, Military Liaison Committee, FO Box l8l4, Washington 25, D. C. 192