7/25/2019 01 Wind Damages Due to Typhoon Yolanda
http://slidepdf.com/reader/full/01-wind-damages-due-to-typhoon-yolanda 1/6
1
1 INTRODUCTIONTyphoons in the Philippines have historically accounted for
a significant amount of damages compared to other types of
natural disasters. (Pacheco 2004; Pacheco et al 2010) Most
recently on November 8, 2013, Typhoon Yolanda
(International Name: Haiyan) made landfall in the country
and was quickly touted as being the strongest landfalling
tropical cyclone on record, at least in terms of wind speed.
(Fischetti 2013) It has claimed a record number of deaths,
and caused widespread catastrophic damage almost
comparable to that caused by Typhoon Pablo of 2012. As a
response to this event, a joint survey team from the
Philippine Institute of Civil Engineers (PICE) and Japan
Society of Civil Engineers (JSCE) conducted post-damage
surveys in several municipalities in Leyte and Samar
affected by Typhoon Yolanda. This brief report is a summary
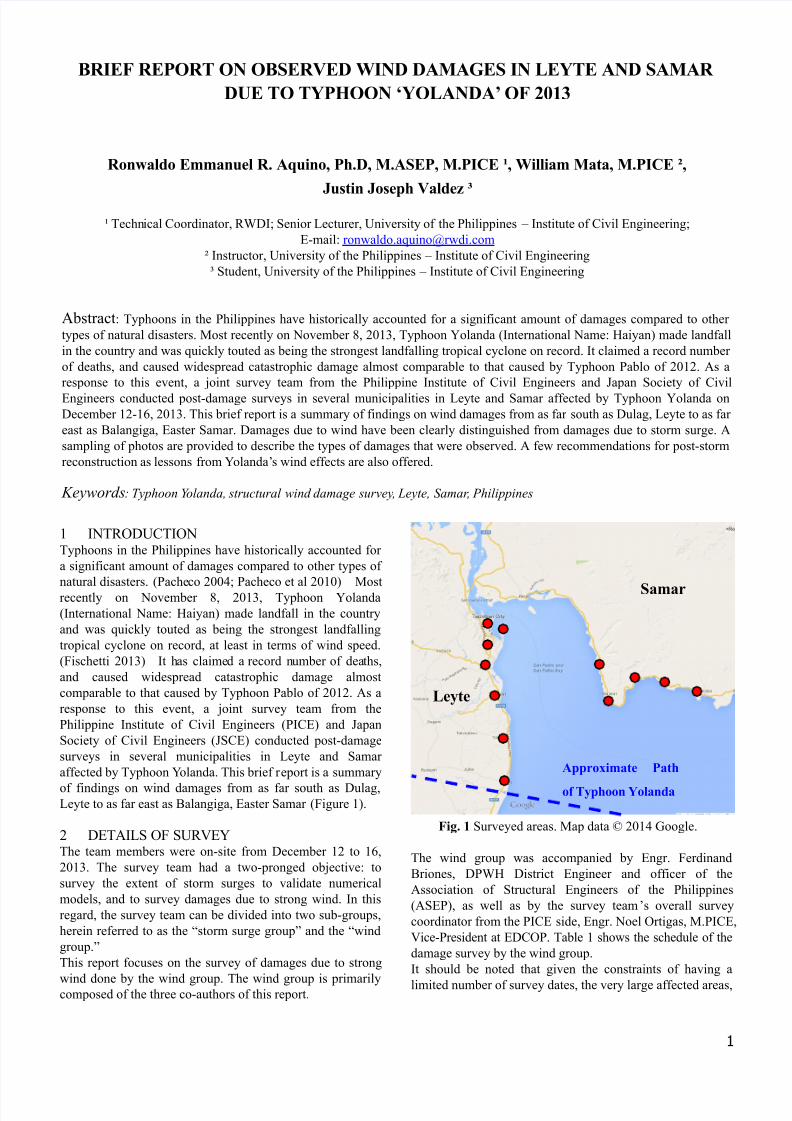
of findings on wind damages from as far south as Dulag,Leyte to as far east as Balangiga, Easter Samar (Figure 1).
2 DETAILS OF SURVEYThe team members were on-site from December 12 to 16,
2013. The survey team had a two-pronged objective: to
survey the extent of storm surges to validate numerical
models, and to survey damages due to strong wind. In this
regard, the survey team can be divided into two sub-groups,
herein referred to as the “storm surge group” and the “wind
group.”
This report focuses on the survey of damages due to strong
wind done by the wind group. The wind group is primarilycomposed of the three co-authors of this report.
Fig. 1 Surveyed areas. Map data © 2014 Google.
The wind group was accompanied by Engr. Ferdinand
Briones, DPWH District Engineer and officer of the
Association of Structural Engineers of the Philippines
(ASEP), as well as by the survey team’s overall survey
coordinator from the PICE side, Engr. Noel Ortigas, M.PICE,
Vice-President at EDCOP. Table 1 shows the schedule of the
damage survey by the wind group.
It should be noted that given the constraints of having a
limited number of survey dates, the very large affected areas,
BRIEF REPORT ON OBSERVED WIND DAMAGES IN LEYTE AND SAMAR
DUE TO TYPHOON ‘YOLANDA’ OF 2013
Ronwaldo Emmanuel R. Aquino, Ph.D, M.ASEP, M.PICE ¹, William Mata, M.PICE ²,
Justin Joseph Valdez ³
¹ Technical Coordinator, RWDI; Senior Lecturer, University of the Philippines – Institute of Civil Engineering;
E-mail: [email protected]
² Instructor, University of the Philippines – Institute of Civil Engineering
³ Student, University of the Philippines – Institute of Civil Engineering
Abstract: Typhoons in the Philippines have historically accounted for a significant amount of damages compared to other
types of natural disasters. Most recently on November 8, 2013, Typhoon Yolanda (International Name: Haiyan) made landfall
in the country and was quickly touted as being the strongest landfalling tropical cyclone on record. It claimed a record number
of deaths, and caused widespread catastrophic damage almost comparable to that caused by Typhoon Pablo of 2012. As a
response to this event, a joint survey team from the Philippine Institute of Civil Engineers and Japan Society of Civil
Engineers conducted post-damage surveys in several municipalities in Leyte and Samar affected by Typhoon Yolanda on
December 12-16, 2013. This brief report is a summary of findings on wind damages from as far south as Dulag, Leyte to as far
east as Balangiga, Easter Samar. Damages due to wind have been clearly distinguished from damages due to storm surge. A
sampling of photos are provided to describe the types of damages that were observed. A few recommendations for post-storm
reconstruction as lessons from Yolanda’s wind effects are also offered.
Keywords: Typhoon Yolanda, structural wind damage survey, Leyte, Samar, Philippines
Leyte
Samar
Approximate Path
of Typhoon Yolanda
7/25/2019 01 Wind Damages Due to Typhoon Yolanda
http://slidepdf.com/reader/full/01-wind-damages-due-to-typhoon-yolanda 2/6
2
and even just after the half-day drive-around on the 1st day
of survey, it was deemed difficult to document the wind
damages as extensively as warranted. Instead, the wind
damage survey sub-group has tried to put focus on a few key
items. First and foremost is to document and assess typical
types of damages. The second is to try to gain clues as to
wind speeds, by gathering information on simple structures
whose capacities can be calculated, which is subsequently
used to back-calculate the wind speed experienced on-site.For brevity, results of the latter objective are not yet
included. It should be additionally noted that the survey was
conducted already more than a month after Typhoon Yolanda
made landfall – a lot of clean-up operations had already been
done.
Table 1 Schedule of wind damage survey sub-group
Day Activities
Day 1 Arrival in Tacloban;
Drive-Around Tacloban and PaloDay 2 Focus on Palo, Leyte
1
Day 3 Visit different parts of Eastern and
Western Samar
Day 4 Cities and Municipalities of Tacloban,
Palo, Tolosa, Tanauan, and Dulag
Day 5 Around Tacloban Airport;
Return to Manila1On this day, the storm surge group went as far east to Guian
and Llorente, Eastern Samar
3 PRELIMINARY ESTIMATE OF WIND SPEEDSTo properly assess wind damages to structures, it is
important to gather information on the actual wind speed at
the site, as well as on surrounding terrain information. If the
National Structural Code of the Philippines 6th
ed. or NSCP
2010 (ASEP 2010) is to be used, this wind speed should be a
3-second gust speed at 10 meters height in flat, open country
terrain.
3.1 Reported Wind Speeds
There are some discrepancies in reported wind speeds,although these are usually based only on certain analysis
techniques performed on satellite imagery (presumably of
cloud formation) and not surface measurements. For
example, at 1200 UTC on November 7, 2013, the Japan
Meteorological Agency (JMA) reported that the storm’s 10-
minute maximum sustained winds reached around 230 kph,
while the Hong Kong Observatory (HKO) and the China
Meteorological Administration (CMA) placed it at around
270 kph to 275 kph. Meanwhile, at 1800 UTC on the same
day, the Joint Typhoon Warning Center (JTWC) reported
that the 1-minute sustained wind speed is around 315 kph.
Note that while these are wind speeds at 10-meters height,
they are presumably wind speeds over open ocean, not on-
land, and are not 3-second gust speeds – they are not directly
useable with the NSCP. Note too that the JMA is the official
Regional Specialized Meteorological Center for the Western
Pacific Ocean of the World Meteorological Organization.
On November 8 itself, the person in charge of taking
measurements at the meteorological station at the Tacloban
(DZR) Airport was said to be on-site just before the typhoon
hit. He allegedly observed wind speeds of 230 to 250 kph
(presumably gust wind speeds) – which mean that the actualgust wind speeds are at least 250 kph. Unfortunately, there
were no more measurements during the peak strength of the
storm at the site because there was no one anymore manning
the station, and the station itself was said to have suffered
damages.
In any case, the question here is what is the actual wind
speed due to Typhoon Yolanda that could be used to assess
structures? If, say, JTWC’s 315 kph is taken as the gust wind
speed at 10 meters height on flat, open land, Typhoon
Yolanda would have brought 7,500-year winds to the
affected areas, based on current climate models as used in
the NSCP. The NSCP, in principle, allows for no damage up
to 700-year winds. By ratio of velocities squared, the wind
forces are therefore at least 50% larger than the design wind
speed at the onset of damage. Significant damages are surely
expected, even for some buildings designed to the latest
edition of the NSCP.
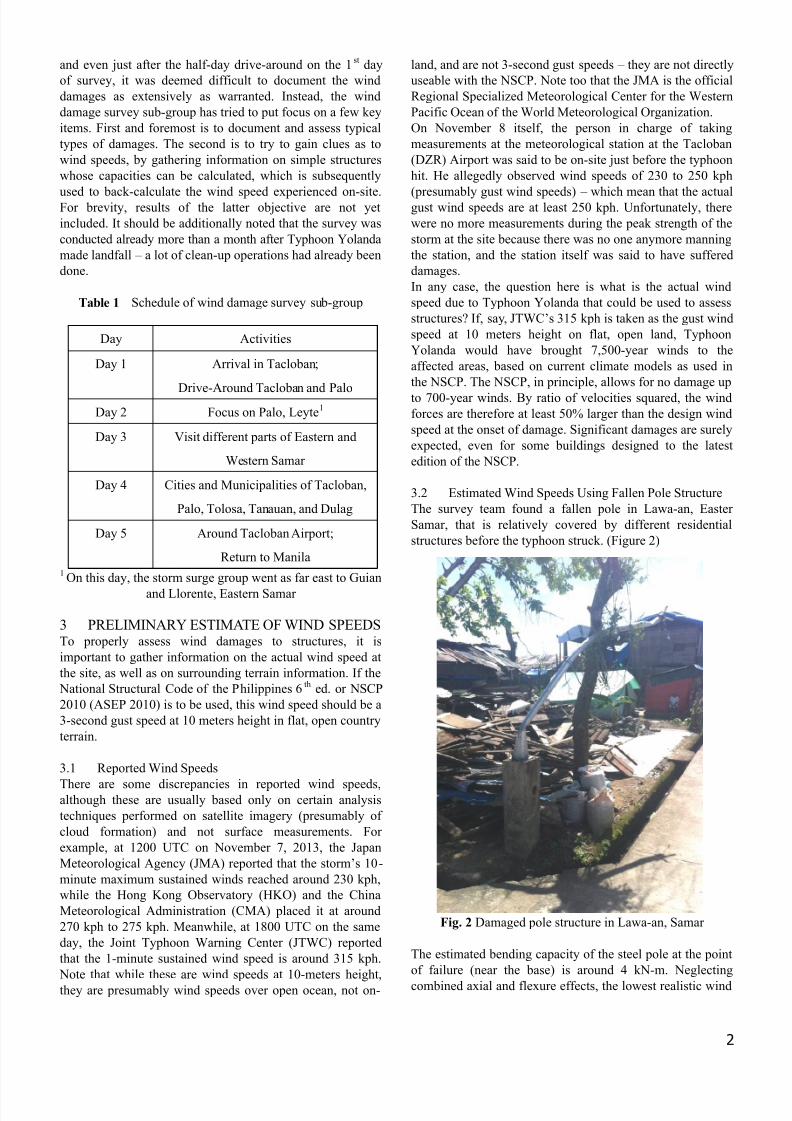
3.2 Estimated Wind Speeds Using Fallen Pole Structure
The survey team found a fallen pole in Lawa-an, Easter
Samar, that is relatively covered by different residential
structures before the typhoon struck. (Figure 2)
Fig. 2 Damaged pole structure in Lawa-an, Samar
The estimated bending capacity of the steel pole at the point
of failure (near the base) is around 4 kN-m. Neglecting
combined axial and flexure effects, the lowest realistic wind
7/25/2019 01 Wind Damages Due to Typhoon Yolanda
http://slidepdf.com/reader/full/01-wind-damages-due-to-typhoon-yolanda 3/6
3
speed estimated is around 360 kph, corresponding to a
terrain factor K d of 1.03 (applied to pressure) and a wind
force coefficient for poles of 1.4 (extrapolated for height-to-
diameter ratio h/ D of 34). This is much higher than the
earlier assumed wind speed of 315 kph. The assumed value
for K d corresponds to a coastline terrain exposure, which is
appropriate for this site. However, the direction of failure of
the pole is towards the sea – i.e. the terrain exposure for the
wind that fell it should be closer to an open terrain. It shouldalso be noted again that there was a building adjacent to this
pole, and across the street is another building still standing.
For its size, this pole is relatively buried in a typical
suburban terrain, albeit just a few meters from the shoreline.
It is also difficult to arrive at a more accurate force
coefficient, given the complex surroundings. It is possible
that the force coefficient is higher than 1.4.
Given the limitations and many assumptions made, it is
therefore recommended that another method is used to verify
this estimated wind speed. The only conclusion that can be
made is that the 3-second gust wind speed (for an equivalent
open country terrain) at 10-meters height seemingly
exceeded 315 kph. Furthermore, it can be said that this is a
very rare, extreme event, at least according to the current
climate model as being used in the NSCP.
4 TYPICAL WIND DAMAGES
4.1 Damages to schools, hospitals, and other public
buildings
Photos of some surveyed schools, hospitals, and other public
buildings are shown in Appendix A. The surveyed schools
were the UP Manila School of Health Sciences (Palo
Campus), Maslog Elementary School, Bolusao Elementary
School, Osmena Elementary School, Telegrafo ElementarySchool and Tanauan Elementary School. The surveyed
hospitals were the Schistosomiasis Research and Training
Center in Palo, Leyte, and Rural Health Unit of Tolosa,
Leyte. The surveyed public buildings were the Daniel Z.
Romualdez Airport Terminal Building, Philippine Ports
Authority (PPA), TESDA Provincial Office, Leyte,
Cathedral of the Transfiguration of Our Lord (Palo), Palo
Municipal Building and the OSCA Office and Day Center
for Senior Citizens.
Note that schools, hospitals, and public buildings were not a
primary objective of the survey; hence a number of other
schools, hospitals, and public buildings are not reported here.
It can be observed from the photos that most of the school
buildings are one-storey structures with large windows used
primarily for ventilation but without any protection from
wind or wind-borne debris, and light metal roof sheets
typically on wooden trusses supported on RC columns. A
roof diaphragm is also typically not present, but this should
not be the primary issue for wind-resistant design of the roof.
Damages to hospitals are similar to the damages to schools,
except it can be seen here that steel roof framing (trusses)
have been used on one relatively newer building and it has
been damaged itself, albeit only partly. It should be noted
that the contents of the floor directly exposed to the
damaged roofs likewise are typically completely damaged.
4.2 Damages to residential structures
Most residential structures have blown away steel roof
sheets, which is the most common roof construction material.
These could either be screwed to steel roof trusses, or most
likely nailed to timber roof trusses. Figure 3 shows two
examples roof failures on residential buildings, whereas the
rest of the (concrete) main structure is still intact. This is
also generally applies to non-residential structures, although
as shown later and also in the example of the OSCA Officeand Day Care for Senior Citizens building in Appendix A,
concrete walls could also be damaged together with the roof
if they were not properly designed for wind actions.
Related to the above, timber structures are the most
devastated. Figure 4 shows one of many residential
buildings with a concrete lower floor and a timber upper
floor, but here shown with a missing upper floor after
suffering heavy wind damage.
Damages to residential structures can also be in the form of
flying or falling hazards such as the example of a fallen tree
adjacent to a residential building in Figure 5.
Another observation is that people have seemingly
reconstructed especially slightly damaged roofs the same
way as pre-storm. There are improvements that can be made
in reconstruction, but the rarity of this event should justify
the economic savings – assuming that for the design (700-
year) events the common types of construction can survive.
Fig. 3 Damaged roof sheets supported on timber trusses
(above) – note the supporting frames are also damaged; and
damaged roof sheets on relatively newer building with steel
roof trusses (below) which are still generally intact.
7/25/2019 01 Wind Damages Due to Typhoon Yolanda
http://slidepdf.com/reader/full/01-wind-damages-due-to-typhoon-yolanda 4/6
4
Fig. 4 Completely destroyed timber upper floor of
residential building. The lower floor structure survived, but
the contents of the lower floor were likewise affected by the
damaged upper floor.
Fig. 5 Nearby trees as an example of a falling hazard on
adjacent residential and other structures. It is not clear here
but the roof sheet may have been the one that caused the tree
to fall in the first place.
Fig. 6 Large group of fallen trees in Palo, Leyte, all pointing
south (to the left)
4.3 Damages to other structures
As alluded to above, trees and other materials (e.g. roof
sheets) can become falling or flying hazards that could cause
damages to structures. However, trees themselves are
“structures” that can provide livelihood to certain people.
One of the people we interviewed said that her coconut
plantation was wiped out after the storm. Figure 6 shows a
number of coconut trees in Palo, Leyte that have fallen down
due to strong winds. It is also interesting to note that these
trees fell towards the south, which means that the winds that
affected them are winds coming from the north – i.e. even
before Yolanda made landfall, the winds were already strong
enough to make these coconut trees fall down. The easterly
winds north of the eye are typically the strongest winds
within a tropical cyclone system.
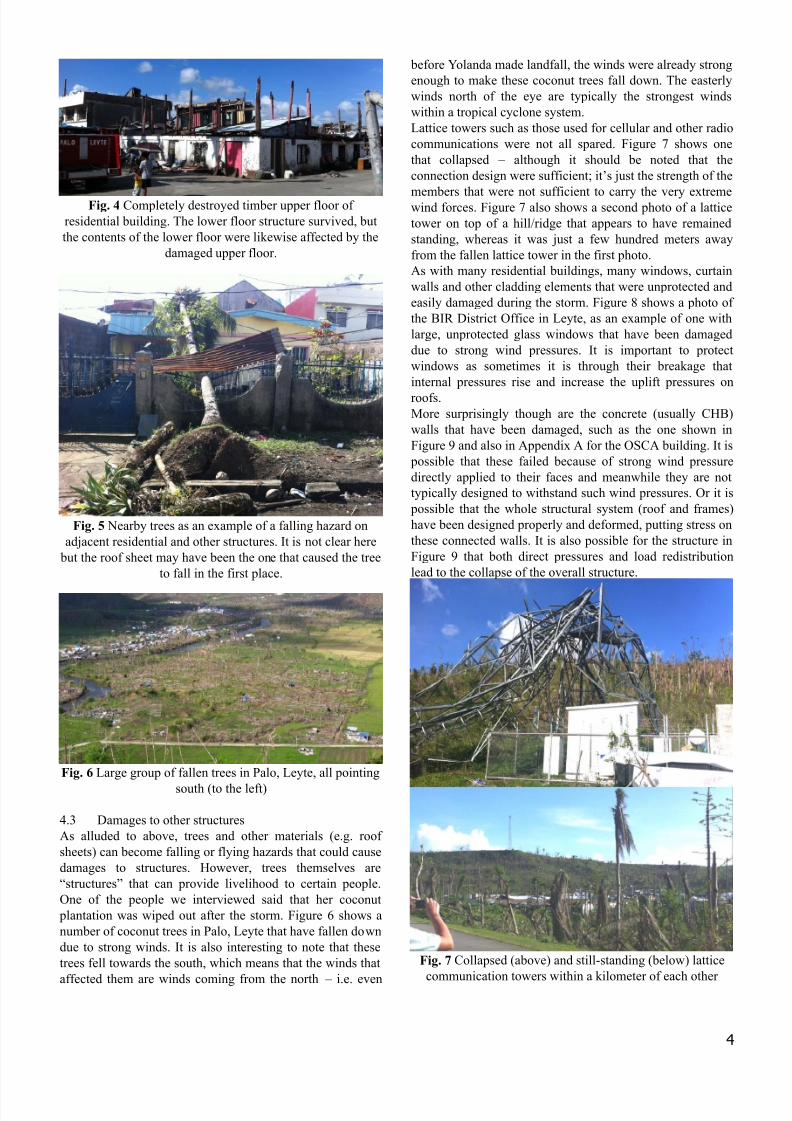
Lattice towers such as those used for cellular and other radio
communications were not all spared. Figure 7 shows one
that collapsed – although it should be noted that the
connection design were sufficient; it’s just the strength of the
members that were not sufficient to carry the very extremewind forces. Figure 7 also shows a second photo of a lattice
tower on top of a hill/ridge that appears to have remained
standing, whereas it was just a few hundred meters away
from the fallen lattice tower in the first photo.
As with many residential buildings, many windows, curtain
walls and other cladding elements that were unprotected and
easily damaged during the storm. Figure 8 shows a photo of
the BIR District Office in Leyte, as an example of one with
large, unprotected glass windows that have been damaged
due to strong wind pressures. It is important to protect
windows as sometimes it is through their breakage that
internal pressures rise and increase the uplift pressures on
roofs.
More surprisingly though are the concrete (usually CHB)
walls that have been damaged, such as the one shown in
Figure 9 and also in Appendix A for the OSCA building. It is
possible that these failed because of strong wind pressure
directly applied to their faces and meanwhile they are not
typically designed to withstand such wind pressures. Or it is
possible that the whole structural system (roof and frames)
have been designed properly and deformed, putting stress on
these connected walls. It is also possible for the structure in
Figure 9 that both direct pressures and load redistribution
lead to the collapse of the overall structure.
Fig. 7 Collapsed (above) and still-standing (below) lattice
communication towers within a kilometer of each other
7/25/2019 01 Wind Damages Due to Typhoon Yolanda
http://slidepdf.com/reader/full/01-wind-damages-due-to-typhoon-yolanda 5/6
5
Fig. 8 Windows are all broken (as well as the roof) on this
BIR District Office building
Fig. 9 Completely collapsed large building with steel roof
trusses supported on RC frames with concrete (CHB) walls
Fig. 10 Open steel roof structure (painted red) originally
providing shade on top of the “open (basketball) court”,
lifted up and tossed to the side
Fig. 11 Seemingly inadequate roof-to-frame connection
Another typically damaged type of structure are “open
court” roofs, such as the one shown in Figure 10, which was
the worst seen by the survey team. The whole steel roof
system was torn from its base, lifted up and tossed to the
side. In other cases (e.g. Figure 11), the roof-to-frame
connection appears to be inadequate. Typically, the steel
rebars are extended out of the concrete column to provide a
hook for the steel roof.
4.4 More photos of damaged structures
There are plenty other damaged structures, including steel
and concrete fences, electrical pole structures, and so on, but
on some occasion there were also a few undamaged
structures which are interesting to study. More photos of all
of these can be found on http://sdrv.ms/JUn8MM. More
photos may be added here in the future, once they become
available. Updates will be disseminated via the Philippine
Institute of Civil Engineers and/or Association of Structural
Engineers of the Philippines.
5
CONCLUDING REMARKSMany of the wind damages found are typical of any strong
windstorm, although some of them can be remedied. For
example, broken windows can be prevented by boarding
them up right before the storm, or using shutters to protect
them. It is possible that roof sheets cannot be prevent from
being blown away when an extreme wind event occurs, but
they could become flying hazards that could damage other
structures. Concrete roof deck/slabs could be used as an
alternative which can surely protect from wind, although
their supporting structures would consequently need to be
stronger than when light roof sheets and trusses are used.
The use of timber is strongly discouraged unless testing andnew systems can demonstrate that they are capable of
withstanding winds. Finally, it appears that the “weakest
link ” is almost always the point where structures fail. It
could be the roof sheet screws or nails, or the connection
detailing, or in some cases, it is another element altogether
that is not at all typically designed for wind such as concrete
(CHB) wall systems. The only solution to this is to check all
exposed elements against wind loads, not just roofs and
other lightweight structures. However, it should be noted
that the adequacy of the current wind-resistant design
standard (i.e. the NSCP 2010) has not yet exactly been tested.
If it can be ascertained that all structures conform to the
NSCP 2010 (or at least its predecessor), and yet these
damages still occur, then there is a need for a major revision
of the code. However, such is not yet the case.
ACKNOWLEDGMENTS
The authors express sincere gratitude to the PICE-JSCE
Joint Survey Team members and organizers. The authors
also extend their thanks to Prof. Yukio Tamura, Tokyo
Polytechnic University, for sharing anecdotal information on
wind speed measurements in Tacloban before Typhoon
Yolanda made landfall, as well as to Dr. Gerry Bagtasa, UP
Institute of Environmental Science and Meteorology, for
sharing his knowledge on the reported Yolanda wind speeds.
7/25/2019 01 Wind Damages Due to Typhoon Yolanda
http://slidepdf.com/reader/full/01-wind-damages-due-to-typhoon-yolanda 6/6
6
REFERENCES
Association of Structural Engineers of the Philippines
(2010), National Structural Code of the Philippines, 6th
ed.,
NSCP 2010.
Fischetti, M. (2013). “Was Typhoon Haiyan a Record
Storm?,” Scientific American, November 27, 2013.
Pacheco, B.M. (2004). “Introduction to Disaster Mitigation
and Preparedness Strategies: the DMAPS Program of thePICE,” Proc., PICE 2004 National Midyear Convention,
Davao City, Philippines.
Pacheco, B.M., Aquino, R.E.R. and Tanzo, W.T. (2010).
“Typhoon Engineering Efforts in the Philippines,” Proc.,
Workshop on Wind-Related Disaster Risk Reduction,
Incheon, South Korea.
Wikipedia, “Typhoon Haiyan,” retrieved 20 January 2014,
http://en.wikipedia.org/wiki/Typhoon_Haiyan
APPENDIX A
Photos 1 to 40: Damages to schools
Photos 41 to 53: Damages to hospitals
Photos 54 to 86: Damages to other public buildings
The above are also available on http://sdrv.ms/JUn8MM.