Page 1
01/12/2011
Transport & Health: some major issues 2011 Annual Polis conference Brussels Luc Int Panis
Research coordinator Environmental Risk & Health at the
Flemish Institute for Technological Research
Transport Transportation Research Institute (Univ. Hasselt)
Page 2
01/12/2011 2 © 2009, VITO NV – Alle rechten voorbehouden
Issues
» What fraction of PM causes health effects?
» Traffic
» Black Carbon
» What are the major health impacts of cycling?
» Not air quality
» Minor accidents: need to quantify risk and costs
» How can we effectively solve both problems? …and achieve a major health benefit
Page 3
01/12/2011 3 © 2009, VITO NV – Alle rechten voorbehouden
Traffic is not healthy (may be PM, noise, stress, …. , ?)
Acute effect
Page 4
01/12/2011 4 © 2009, VITO NV – Alle rechten voorbehouden
Walking in Oxford street vs Hyde park
McCreanor et al. New Engl J Med. 2007
Diesel: Hyde park vs Oxford street
Acute effect
Page 5
01/12/2011 5 © 2009, VITO NV – Alle rechten voorbehouden
Gauderman et al. 2007 The Lancet
Chronic effect
Page 6
01/12/2011 6 © 2009, VITO NV – Alle rechten voorbehouden
Asthma incidence and prevalence related to air pollution
(causes new cases not just exacerbation, confirms HEI, 2009 consensus
Acute &
Chronic effect
Page 7
01/12/2011 7 © 2009, VITO NV – Alle rechten voorbehouden
Page 8
01/12/2011 8 © 2009, VITO NV – Alle rechten voorbehouden
Source VMM, ChemKar, 2009
EC
Bron VMM, ChemKar PM10 HotSpots, 2010
City of Antwerp (Borgerhout)
Measured PM composition in Flanders
Could it be the tiny black fraction?
Black Carbon
Page 9
01/12/2011 9 © 2009, VITO NV – Alle rechten voorbehouden
Personal exposure to Black Carbon
Bicycle
ride Car
commute
Page 10
01/12/2011 10 © 2009, VITO NV – Alle rechten voorbehouden
In transport;
6,3%
Home-based
activities;
29,9%
Sleep; 35,5%
Work; 17,0%
Social & Leisure;
6,3%
Shopping; 1,1% Other; 3,9%
Time-activity
In transport;
21,0%
Home-based
activities;
26,7%Sleep; 25,0%
Work; 12,2%
Social & Leisure;
8,9%
Shopping; 2,0%
Other; 4,3%
Contribution to exposure
In transport;
29,8%
Home-based
activities;
21,8%
Sleep; 13,9%
Work; 12,8%
Social & Leisure;
12,8%
Shopping; 3,2% Other; 5,6%
Contribution to dose
Personal exposure to Black Carbon
Black Carbon
Page 11
01/12/2011 11 © 2009, VITO NV – Alle rechten voorbehouden
Page 12
01/12/2011 12 © 2009, VITO NV – Alle rechten voorbehouden
Does a very brief exposure
to high peaks of Black Carbon
really cause health effects
in healthy people?
Page 13
01/12/2011 13 © 2009, VITO NV – Alle rechten voorbehouden
Looking for health effects
Page 14
01/12/2011 14 © 2009, VITO NV – Alle rechten voorbehouden
Jacobs et al (2010) Bos et al. (2011)
Differences in clinical endpoints per location
Endpoint Near ring road Clean room
Difference P-value Difference P-value
Log Exhaled NO, ppb -2.9% (-3.0% to -2.7%) 0.04 -3.3% (-3.1% to 3.5%) 0.63
Log PFA closure time, s 0.028 (-0.0035 to 0.060) 0.09 0.022 (-0.0045 to 0.048) 0.11
Log Il-6, pg/mL 0.070 (-0.031 to 0.17) 0.18 -0.015 (-0.095 to 0.064) 0.71
Clara cell protein, µg/L 2.8% (-8.0% to 13.7%) 0.61 2.7% (-6.6% to 11.7%) 0.58
Leukocyte counts, per µL 1.3% (-2.0% to 4.6%) 0.44 2.5% (-1.1% to 6.1%) 0.19
Neutrophil counts, per µL 4.6% (0.51% to 13.1%) 0.03 2.4% (-2.3% to 7.2%) 0.33
Percentage neutrophils, % 3.9% (1.5% to 6.2%) 0.003 0.22% (-1.8% to 2.2%) 0.83
Subclinical responses in healthy cyclists briefly exposed to traffic-related air pollution: an intervention study Lotte Jacobs, Tim S Nawrot, Bas de Geus, Romain Meeusen, Bart Degraeuwe, Alfred Bernard, Muhammad Sughis, Benoit Nemery, Luc Int Panis Environmental Health 2010 9:64
http://www.ehjournal.net/content/9/1/64
Page 15
01/12/2011 15 © 2009, VITO NV – Alle rechten voorbehouden
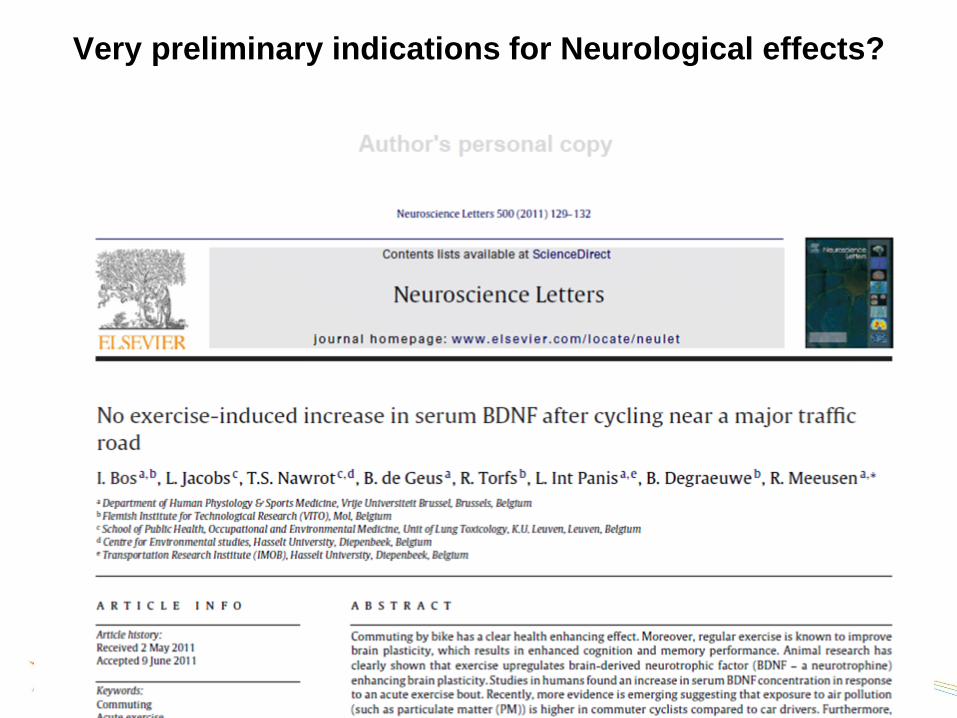
Very preliminary indications for Neurological effects?
Page 16
01/12/2011 16 © 2009, VITO NV – Alle rechten voorbehouden
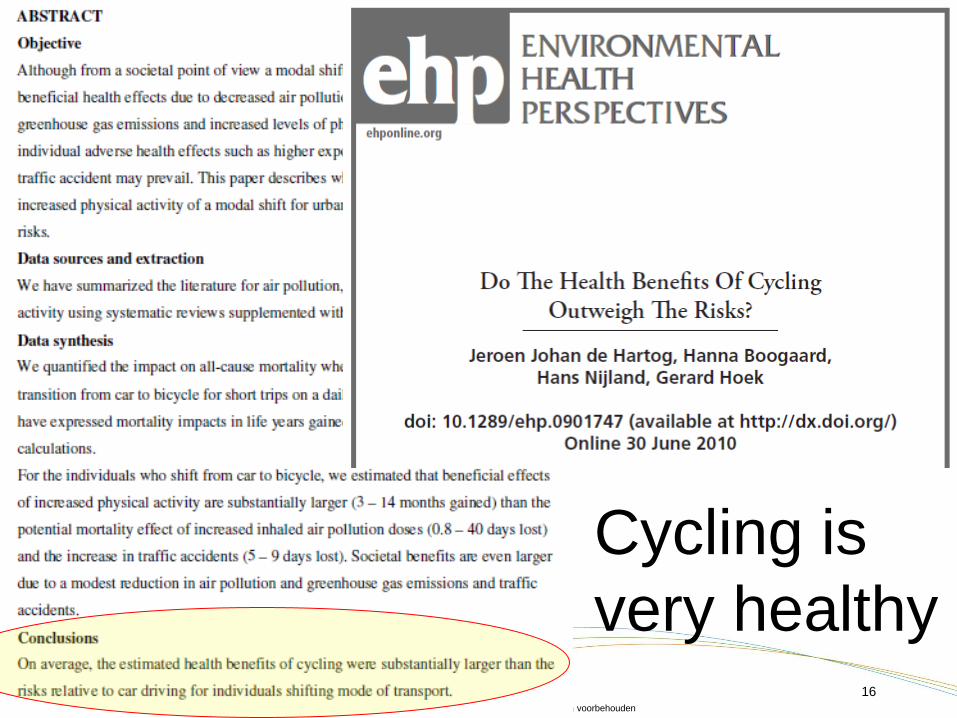
Cycling is
very healthy
Page 17
01/12/2011 17 © 2009, VITO NV – Alle rechten voorbehouden
But perhaps
not always?
Page 18
01/12/2011 18 © 2009, VITO NV – Alle rechten voorbehouden
Reduce the cost of minor accidents
TAPAS based on SHAPES
Source: Rabl & De Nazelle 2012
Page 19
01/12/2011 19 © 2009, VITO NV – Alle rechten voorbehouden
Costs of minor accidents (SHAPES project) (Aertsens et al, 2010)
Type of injury
& consequences
Acute Body Injuries Light injuries No injuries
Cost category Long term Short term
Direct Costs Medical costs 369 43 13 0
non medical
costs
327 89 65 64
Indirect costs Productivity loss 4616 537 104 37
Leisure time loss 144 18 18 9
Intangible costs permanent
invalidity
1018 0 0 0
WTP to avoid
pain
1885 19 60 0
WTP to avoid
psych. conseq.
858 103 24 135
Other costs costs for 3rd
parties
131 11 39 49
TOTAL 9348 820 322 295
Minor accidents, major health costs
Page 20
01/12/2011 20 © 2009, VITO NV – Alle rechten voorbehouden
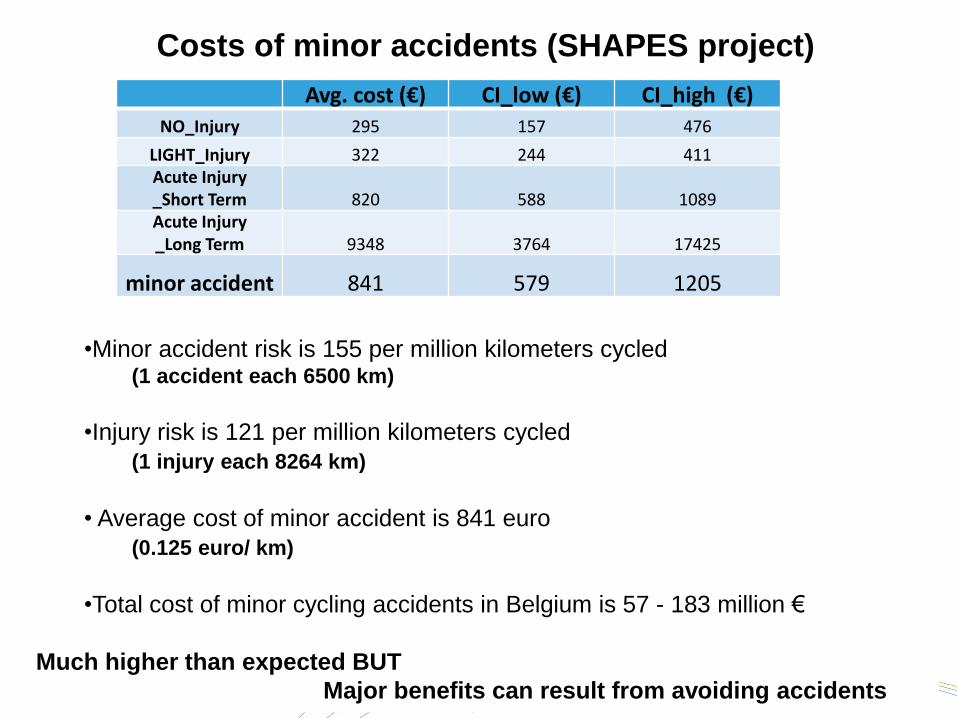
Avg. cost (€) CI_low (€) CI_high (€) NO_Injury 295 157 476
LIGHT_Injury 322 244 411
Acute Injury _Short Term 820 588 1089
Acute Injury _Long Term 9348 3764 17425
minor accident 841 579 1205
•Minor accident risk is 155 per million kilometers cycled (1 accident each 6500 km)
•Injury risk is 121 per million kilometers cycled
(1 injury each 8264 km)
• Average cost of minor accident is 841 euro
(0.125 euro/ km)
•Total cost of minor cycling accidents in Belgium is 57 - 183 million €
Much higher than expected BUT
Major benefits can result from avoiding accidents
Costs of minor accidents (SHAPES project)
Page 21
01/12/2011 21 © 2009, VITO NV – Alle rechten voorbehouden
0%
2%
4%
6%
8%
10%
12%
14%
16%
18%
20%
22%
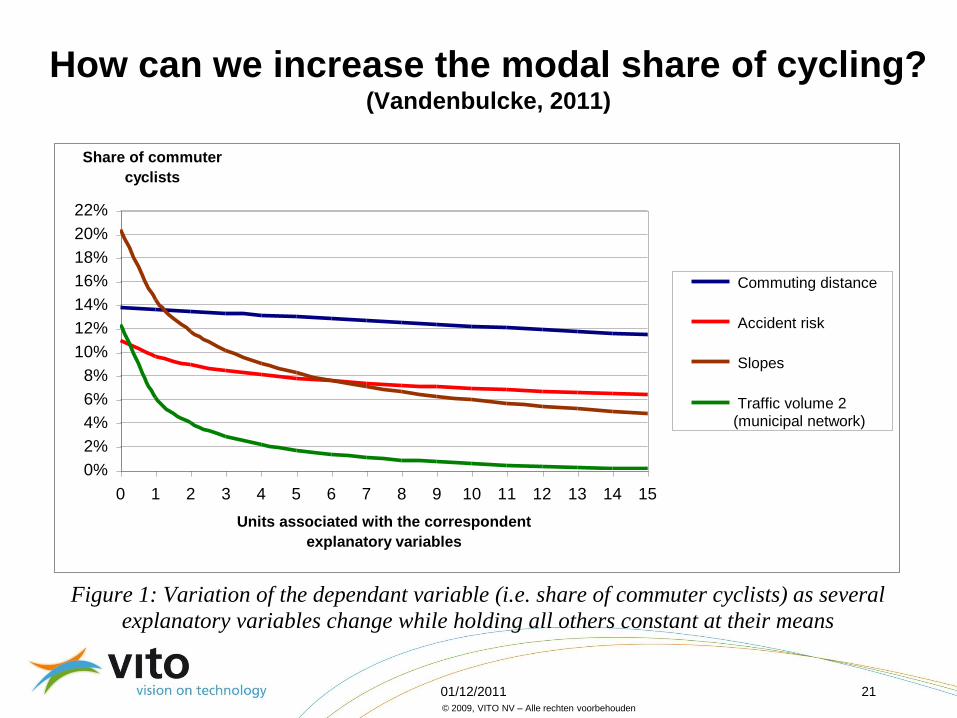
0 1 2 3 4 5 6 7 8 9 10 11 12 13 14 15
Units associated with the correspondent
explanatory variables
Share of commuter
cyclists
Commuting distance
Accident risk
Slopes
Traffic volume 2(municipal network)
Figure 1: Variation of the dependant variable (i.e. share of commuter cyclists) as several
explanatory variables change while holding all others constant at their means
How can we increase the modal share of cycling? (Vandenbulcke, 2011)
Page 22
01/12/2011
How can we effectively solve
the BC and accident problems and
maximise the health benefits?
[email protected]
[email protected]
0%
2%
4%
6%
8%
10%
12%
14%
16%
18%
20%
22%
0 1 2 3 4 5 6 7 8 9 10 11 12 13 14 15
Units associated with the correspondent
explanatory variables
Share of commuter
cyclists
Commuting distance
Accident risk
Slopes
Traffic volume 2(municipal network)
Figure 1: Variation of the dependant variable (i.e. share of commuter cyclists) as several
explanatory variables change while holding all others constant at their means
Page 23
01/12/2011 23 © 2009, VITO NV – Alle rechten voorbehouden
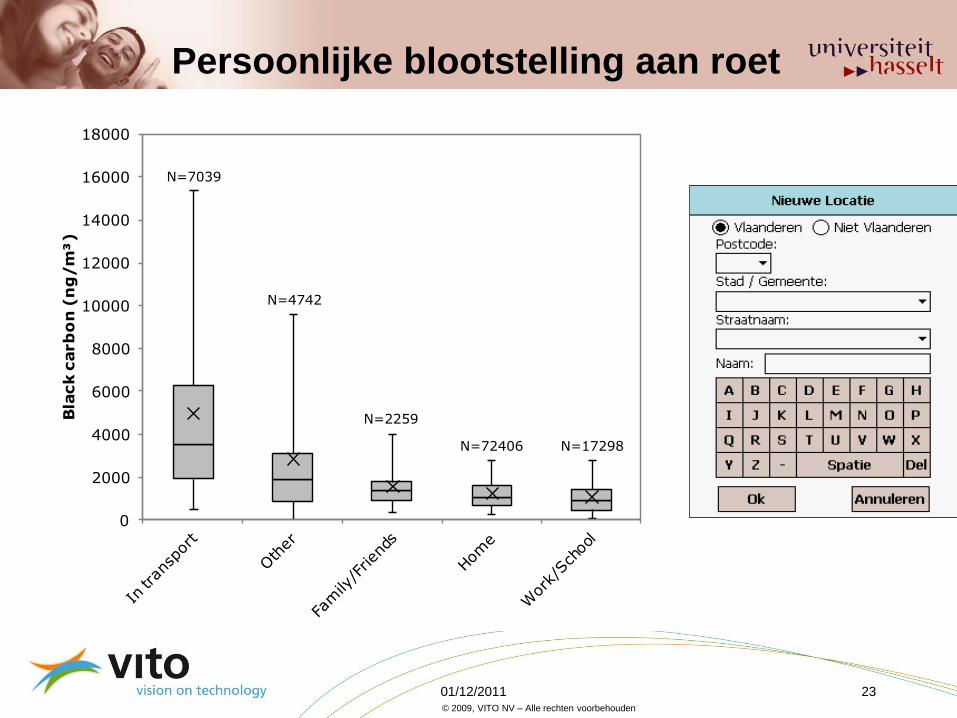
Persoonlijke blootstelling aan roet
0
2000
4000
6000
8000
10000
12000
14000
16000
18000
Bla
ck c
arb
on
(n
g/m
³)
N=7039
N=4742
N=2259
N=72406 N=17298
Page 24
01/12/2011 24 © 2009, VITO NV – Alle rechten voorbehouden
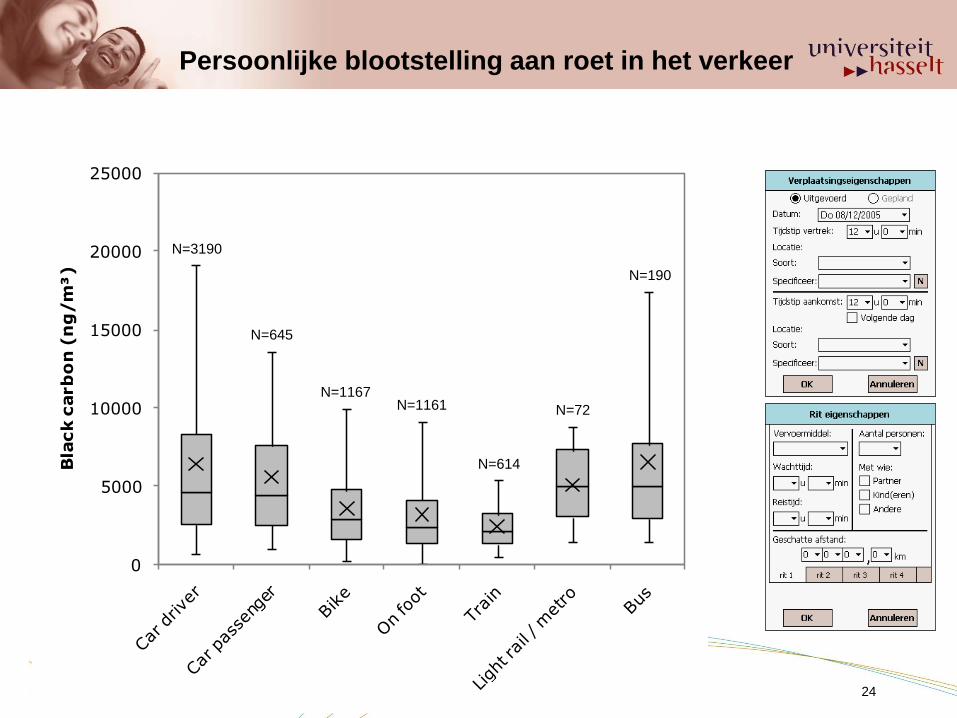
Persoonlijke blootstelling aan roet in het verkeer
0
5000
10000
15000
20000
25000
Bla
ck c
arb
on
(n
g/m
³)
N=3190
N=645
N=1167N=1161
N=614
N=72
N=190
Page 25
01/12/2011 25 © 2009, VITO NV – Alle rechten voorbehouden
BDNF