Tax Avoidance Activities of U.S. Multinational Corporations * SONJA OLHOFT REGO, University of Iowa Abstract This paper investigates whether economies of scale and scope exist for tax planning. In particular, do multinational corporations avoid more taxes than U.S. domestic-only companies, resulting in lower effective tax rates? While the empirical results indicate that ceteris paribus, larger corporations have higher effective tax rates, firms with greater pre-tax income have lower effective tax rates. The negative relation between ETRs and pre-tax income is consistent with firms with greater pre-tax income having more incentives and resources to engage in tax planning. Consistent with multinational corporations being able to avoid income taxes that domestic-only companies cannot, I find that multinational corporations with more extensive foreign operations have lower worldwide ETRs than other firms do. Finally, in a sample of multinational corporations only, I find that higher levels of U.S. pre-tax income are associated with lower U.S. and foreign ETRs, while higher levels of foreign pre-tax income are associated with higher U.S. and foreign ETRs. Thus, large amounts of foreign income are associated with higher corporate tax burdens. Overall, I find substantial evidence of economies of scale and scope to tax planning. Keywords: Effective tax rates; Tax planning; Tax avoidance; Multinational * Send correspondence to: Sonja Olhoft Rego University of Iowa Tippie College of Business 108 PBB, Room W278 Iowa City, Iowa 52242-1000 [email protected]Phone: (319) 335-0891 Fax: (319) 335-1956 This paper is based upon my dissertation at the University of Michigan. I owe particular thanks to my committee members, Joel Slemrod (co-chair), Richard Sloan (co-chair), Doug Shackelford, and Roger Gordon. This paper has also benefited from the helpful comments of Alan Macnaughton and two anonymous reviewers, Mark Bradshaw, Ilia Dichev, Raffi Indjejikian, Mort Pincus, Rick Tubbs, Peter Wysocki, Bob Yetman, and workshop participants at Boston College, INSEAD, the University of Iowa, the University of Michigan, and the University of Texas at Austin.
Transcript
Tax Avoidance Activities of U.S. Multinational Corporations*
SONJA OLHOFT REGO, University of Iowa
AbstractThis paper investigates whether economies of scale and scope exist for tax
planning. In particular, do multinational corporations avoid more taxes than U.S.domestic-only companies, resulting in lower effective tax rates? While the empiricalresults indicate that ceteris paribus, larger corporations have higher effective tax rates,firms with greater pre-tax income have lower effective tax rates. The negative relationbetween ETRs and pre-tax income is consistent with firms with greater pre-tax incomehaving more incentives and resources to engage in tax planning.
Consistent with multinational corporations being able to avoid income taxes thatdomestic-only companies cannot, I find that multinational corporations with moreextensive foreign operations have lower worldwide ETRs than other firms do. Finally, ina sample of multinational corporations only, I find that higher levels of U.S. pre-taxincome are associated with lower U.S. and foreign ETRs, while higher levels of foreignpre-tax income are associated with higher U.S. and foreign ETRs. Thus, large amountsof foreign income are associated with higher corporate tax burdens. Overall, I findsubstantial evidence of economies of scale and scope to tax planning.
*Send correspondence to:Sonja Olhoft RegoUniversity of IowaTippie College of Business108 PBB, Room W278Iowa City, Iowa [email protected]: (319) 335-0891Fax: (319) 335-1956
This paper is based upon my dissertation at the University of Michigan. I owe particular thanksto my committee members, Joel Slemrod (co-chair), Richard Sloan (co-chair), Doug Shackelford,and Roger Gordon. This paper has also benefited from the helpful comments of AlanMacnaughton and two anonymous reviewers, Mark Bradshaw, Ilia Dichev, Raffi Indjejikian,Mort Pincus, Rick Tubbs, Peter Wysocki, Bob Yetman, and workshop participants at BostonCollege, INSEAD, the University of Iowa, the University of Michigan, and the University ofTexas at Austin.
1
1. Introduction
Previous research examining average effective tax rates (ETRs) has found a wide
variety of relations between ETRs and firm characteristics such as size, income, leverage,
capital intensity, and return on assets. This paper attempts to reconcile the contradictory
evidence in the literature by addressing economies of scale and scope.1 Specifically, I
ask whether economies of scale and scope exist for tax planning such that firms having
greater economic scale and scope avoid more income taxes, resulting in lower ETRs?
Effective tax planning (a.k.a. tax avoidance) reduces the present value of tax
payments and generally increases the after-tax rate of return to investors in a firm. 2
While measuring effective tax planning is a difficult task, prior research considers ETRs
a measure of the effectiveness of tax planning (e.g., Mills, Erickson, and Maydew, 1998;
Phillips, 2001). Consistent with such research, I define ETRs as the ratio of income taxes
currently payable to tax authorities, to pre-tax accounting income. Thus, if two firms
have the same pre-tax accounting income but pay different amounts of income taxes, the
firm that pays less tax will have a lower ETR and will be viewed as being more effective
in tax planning.
This paper extends the accounting literature by reconciling prior research on the
relation between ETRs and two measures of economic scale and scope: firm size and pre-
tax income.3 More importantly, I focus on the relation between ETRs and another
measure of economic scope: the extent of multinational activity. The ETRs of
multinational corporations are of particular concern, as some observers believe that
multinational corporations "may have significantly greater opportunities to escape tax
2
with respect to cross-border investments than with respect to strictly domestic
investments" (Leblang 1998, p. 181).
Multinational corporations have opportunities to avoid income taxation by
locating operations in low-tax rate countries, by shifting income from high-tax locations
to low-tax locations, by exploiting differences between the tax rules of different
countries, and by taking advantage of tax subsidy agreements with host countries.
However, Collins and Shackelford (1999) conclude that "empirical findings in this area
are insufficient and inconclusive and fail to either support or undermine Leblang's
assertions" (p. 131).
ETRs have been an important measure of corporate tax burden for policymakers
and academic researchers for several decades.4 For example, a series of reports by the
Citizens for Tax Justice (CTJ, 1984, 1985, 1986) focus on the ETRs of corporate
taxpayers and were influential in the development of the Tax Reform Act of 1986. The
practitioner literature frequently discusses specific tax planning techniques to reduce
corporate ETRs. For instance, Levenson (1999, p. 16) states,
"(Certain) strategies … can help companies reduce their effective tax ratesfrom the typical 35 to 40 percent to as low as 10 percent. This reductiontranslates to higher earnings per share and ultimately places companies ina more favorable light with analysts when compared to competitors."
The widespread interest in ETRs suggests that ETRs have valuation implications.
Firms that consistently report relatively low worldwide current taxes payable (i.e., low
ETRs) have greater after-tax cash flows. These greater after-tax cash flows should be
reflected in analysts' earnings forecasts and investment recommendations and be
impounded in security prices. In fact, based on data indicating that firms with ETRs
below the industry average have higher price-earnings ratios than firms with ETRs above
3
the industry average, Swenson (1999) speculates that the stock market views low-tax
firms as better at controlling costs than their high-tax counterparts. In addition,
Abarbanell and Bushee (1998) find that changes in ETRs are positive predictors of one-
year-ahead earnings changes. Thus, ETRs are an important measure of performance to a
diverse set of stakeholders.
In testing whether economies of scale and scope exist for tax planning, I first
perform empirical tests on a broad sample of U.S. domestic and multinational
corporations. I then focus the analysis on a sub-sample of U.S. multinational
corporations only. In the broad sample of U.S. domestic and multinational corporations, I
find that larger firms have higher worldwide ETRs. This finding is consistent with some
of the prior literature, which concludes that larger firms face political costs that smaller
firms do not (e.g., Zimmerman, 1983; Omer, Molloy, and Ziebart, 1993). Holding firm
size constant, I also find that firms with greater income have lower worldwide ETRs.
This result contradicts Wilkie (1988), who does not control for firm size. The negative
relation between worldwide ETRs and income is consistent with firms with large
amounts of pre-tax income having more incentives and resources to engage in tax
planning. Regarding foreign operations, I document that multinational corporations with
more extensive foreign operations have lower worldwide ETRs than firms with less
extensive foreign operations. These results are consistent with economies of scope to tax
planning.
I also examine the worldwide, U.S., and foreign ETRs for a sample of U.S.
multinational corporations. Consistent with the broad sample of firms, I find that larger
corporations have higher ETRs than smaller firms, and corporations with greater income
4
have lower ETRs than firms with less income. In fact, worldwide ETRs are decreasing in
both U.S. and foreign pre-tax income. However, joint estimation of U.S. and foreign
ETRs indicate that while U.S. and foreign ETRs are decreasing in the amount of U.S.
pre-tax income, they are increasing in the amount of foreign pre-tax income. This result
suggests that while large amounts of U.S. pre-tax income are associated with tax planning
and lower corporate tax burdens, large amounts of foreign pre-tax income are associated
with higher corporate tax burdens. Finally, similar to the results for the broad sample of
firms, multinational corporations with more extensive foreign operations have lower
worldwide and foreign ETRs than multinational corporations with less extensive foreign
operations.
Overall, these results support the notion that economies of scale and scope can
significantly affect a firm's ability to reduce its tax burden through tax planning. In
particular, firms with higher levels of pre-tax income and more extensive foreign
operations are able to reduce their U.S., foreign, and worldwide tax burdens through tax
planning activities. Further, by comparing the tax burdens of multinational and domestic-
only firms, this study responds to Collins and Shackelford's (1999) assertion that
empirical research does not provide conclusive evidence that multinational corporations
pay less income tax than domestic-only companies.
The remainder of this paper is organized as follows: section 2 discusses prior
research and develops empirical hypotheses. Section 3 presents the research design and
sample selection. Section 4 discusses the results of empirical tests, and section 5
concludes.
5
2. ETRs and Economic Scale and Scope
2.1 Background
Substantial amounts of prior research have examined ETRs as a measure of
corporate tax burden. For example, Stickney and McGee (1982) investigate the causes of
observable differences in corporate tax burdens. They conclude that capital intensity,
leverage, and natural resource activities create variation in ETRs across firms, while
foreign operations and size are less important determinants of ETRs. Wilkie (1988)
argues that pre-tax income is an important determinant of variation in corporate tax
burden. Gupta and Newberry (1997) investigate other determinants of variation in ETRs
using panel data and conclude that ETRs are systematically related to a firm's capital
structure, asset mix, and return on assets.
The relations between ETRs and certain firm characteristics are consistent across
ETR studies. For instance, Stickney and McGee (1982), Gupta and Newberry (1997),
and Mills, Erickson, and Maydew (1998) each document a negative relation between
ETRs and leverage and between ETRs and capital intensity. On the other hand, the
evidence about the relation of ETRs to other firm characteristics, such as firm size,
income, and foreign operations, is inconsistent across studies. Firm size is the most
controversial variable examined in prior ETR research. Siegfried (1972) hypothesizes
that larger firms should have lower ETRs than smaller firms because larger firms have
greater resources with which to (1) influence the political process, (2) develop expertise
in tax planning, and (3) organize their activities in optimal tax saving ways. Underlying
Siegfried's arguments (and much of the ETR literature) is the concept that ETRs can be
considered a measure of effective tax planning.
6
In contrast, proponents of the 'political cost hypothesis' claim that large firms are
subjected to greater government scrutiny and wealth transfers than smaller firms are,
which should translate into higher corporate tax burdens for large firms.5 However, the
empirical evidence is mixed. Siegfried (1972), Stickney and McGee (1982), and Porcano
(1986) each find a significantly negative association between ETRs and firm size. In
contrast, Zimmerman (1983) and Omer, Molloy, and Ziebart (1993) document a
significantly positive relation between ETRs and firm size, while Jacob (1996), Gupta
and Newberry (1997), and Mills, Erickson, and Maydew (1998) do not find any link.
Differences in results have been attributed to sample selection (industry composition,
inclusion/exclusion of foreign firms), ETR definition (U.S. federal income tax,
worldwide income tax, inclusion/exclusion of deferred taxes), and the time period under
investigation. 6
A substantial portion of previous research applies univariate analysis to examine
variation in ETRs across firms. Gupta and Newberry (1997) note the limitations of such
studies and examine variation in ETRs in a multivariate framework. Nonetheless, Gupta
and Newberry state that a complete model of ETR variability would include additional
factors not included in their model, such as the extent of foreign operations. In this
paper, I empirically model ETRs as a function of foreign operations and attempt to
reconcile the results in the prior literature.
The usual definition of ETRs is income taxes currently payable divided by pre-tax
accounting income. Since ETRs compare the current tax liability generated by taxable
income to pre-tax income based on generally accepted accounting principles, ETRs
measure the proficiency of a corporation to reduce its current tax liability relative to its
7
pre-tax accounting income. As a result, ETRs reflect the relative tax burden across
firms.7
Tax avoidance activities affect ETRs in at least two ways. First, tax avoidance
activities often create book-tax differences.8 Book-tax differences are both temporary
and permanent differences between a firm’s financial accounting and taxable incomes.
Book-tax differences create variation in ETRs because the numerator is based on taxable
income, whereas the denominator is based on financial accounting income. Tax
motivated transactions, such as foreign sales corporations, tax-exempt income, tax
credits, and deferral of income recognition for tax purposes typically reduce a firm's
ETR.
Second, multinational corporations frequently use their foreign operations to
avoid income taxation, and ETRs capture this type of tax avoidance. For example,
shifting income from a high-tax jurisdiction to a low-tax jurisdiction reduces a
multinational corporation’s worldwide ETR. The worldwide ETR is reduced because the
denominator has remained constant (pre-tax accounting income has not changed), while
the numerator is smaller (income taxes currently payable has decreased). In general,
firms that avoid income taxes by reducing their taxable income while maintaining their
financial accounting income will have lower ETRs, making ETRs a reasonable measure
of effective tax planning.
2.2 Hypothesis Development
Slemrod (1998) and Grubert and Slemrod (1996) develop economic models of
taxpayer behavior. These models assume that taxpayers with greater income and capital
8
investment have lower average and marginal costs of tax avoidance. Consistent with
these theoretical predictions, Mills, Erickson, and Maydew (1998) conclude from their
empirical tests that larger firms have lower average costs of tax planning. Slemrod
(1998) also suggests that the pattern of multinational operations influences a taxpayer's
costs of tax avoidance. In particular, the costs of avoidance should be lower for firms
that have operations in low-tax jurisdictions.
Thus, prior research indicates that the costs of tax planning are decreasing in firm
size, income, and foreign operations. While firm size reflects economic scale, and
foreign operations reflect economic scope, the level of income reflects both economic
scale and scope. The level of income reflects economic scale because the amount of pre-
tax income is related to firm size; e.g., consider the income of large, multinational oil
companies compared to the income of smaller, regional oil companies. The level of
income reflects economic scope because firms with greater income likely have multiple
business segments and are able to offset net operating losses from less profitable business
segments against the income of more profitable business segments.9 All else equal,
negative relations between the marginal costs of tax planning and, respectively, firm size,
income, and foreign operations, should translate into more effective tax planning and
lower ETRs for firms of greater economic scale and scope.
Consistent with economies of scale to tax planning, large firms generally engage
in more business activities and more financial transactions than small firms do, thereby
providing more opportunities to avoid income taxes. For example, large firms may be
able to avoid income taxation through inter-company transactions, tax-advantaged leasing
and financing arrangements, and the complex use of flow-through entities such as
9
partnerships and real estate investment trusts.10 However, proponents of the political cost
hypothesis argue that larger firms are likely to pay more income taxes than smaller firms
do, as a result of increased visibility and government scrutiny and expropriation of
resources. Thus, the relation between worldwide ETRs and firm size is an unresolved
empirical question, suggesting the following hypothesis:
H1: Worldwide ETRs of large and small firms differ. If economies of scale in tax
planning generate more (less) tax benefits than the tax costs of greater public
scrutiny, then large firms will have lower (higher) worldwide ETRs than smaller
firms do.
Wilkie (1988) and Wilkie and Limberg (1993) document a positive relation
between ETRs and pre-tax income. However, these studies present univariate results that
do not control for firm size, which omits an important correlated variable. Holding firm
size constant, firms with greater pre-tax income are likely to avoid more income taxes
than firms with less pre-tax income, since firms with greater income have lower costs of
tax avoidance. Manzon and Plesko (2001) argue that profitable firms can make more
efficient use of tax deductions, credits, and exemptions relative to less profitable firms,
resulting in greater book-tax differences. Finally, firms with greater pre-tax income
should have greater incentives and resources to engage in tax planning. This suggests the
following hypothesis, stated in alternative form:
H2: Firms with greater pre-tax income avoid proportionately more income taxes than do
firms with less income, resulting in lower worldwide ETRs.
10
Multinational corporations are fundamentally different from their domestic
counterparts as they operate in multiple political, cultural, and economic environments, as
well as different tax jurisdictions. Several studies have considered foreign operations as a
determinant of ETRs, but none has designed empirical tests to specifically examine the
impact of foreign operations on ETRs. Mills, Erickson, and Maydew (1998) use a
dummy variable to indicate the existence of foreign operations and find a significantly
positive relationship between ETRs and the foreign operations variable. In contrast,
Stickney and McGee (1982) and Jacob (1996) use the ratio of foreign sales to total
worldwide sales as a proxy for the extent of foreign operations, but neither study
produces compelling results. In addition, all three papers rely on relatively small sample
sizes, which means their results may not generalize to the population of firms.
Firms with more extensive foreign operations have opportunities to avoid income
taxes that are not available to domestic-only firms. For example, they can avoid income
taxes by locating operations in low-tax rate countries, by shifting income from high-tax
locations to low-tax locations, by exploiting differences in the tax rules of different
countries, by taking advantage of tax subsidy agreements with host countries, and by
engaging in complex property transactions, including §357(c) basis-shift transactions
(U.S. Department of Treasury, 1999).
On the other hand, foreign operations are frequently subject to higher foreign
statutory tax rates compared to the U.S. statutory tax rate.11 In a broad sample of
multinational and U.S. domestic-only firms, higher foreign statutory tax rates on average
would produce a positive relation between the extent of foreign operations and worldwide
ETRs. Thus, while foreign operations provide multinational corporations with more
11
opportunities to avoid income taxation, they can also expose multinationals to higher
foreign tax rates. This suggests the following hypothesis, stated in alternative form:
H3: Ceteris paribus, firms with more extensive foreign operations have lower worldwide
ETRs than do firms with less extensive foreign operations.
3. Empirical Tests
3.1 Methodology
I estimate the following ordinary least squares regression using a broad sample of
firms to test H1, H2, and H3:
εααα
αααααα
++++
+++++=
∑∑∑=
+=
+=
+
7
123
6
117
12
15
543210
kkk
jjj
iii YEARINDUSLOCATION
MNCxPTIMNCxSIZEMNCPTISIZEWWETR (1)
where WWETR is the worldwide ETR. To be consistent with prior ETR research and to
capture the impact of both temporary and permanent book-tax differences, I define ETRs
as income taxes currently payable divided by pre-tax accounting income.12 SIZE is the
natural log of total net sales and PTI is the natural log of pre-tax accounting income.13
MNC, a dummy variable, equals 1 for firms reporting foreign assets or foreign income, 0
otherwise. These variables represent a firm's worldwide economic scale and scope.
MNCxSIZE is the interaction of MNC and SIZE, and MNCxPTI is the interaction of
MNC and PTI. Table 1 contains the variable definitions.
[Insert Table 1]
12
The MNC interaction terms, MNCxSIZE and MNCxPTI, test whether
multinational corporations have systematically different relations between worldwide
ETRs and firm size and between worldwide ETRs and pre-tax income, than purely
domestic companies have. H1, H2, and H3 predict significantly negative coefficients on
SIZE, PTI, MNC, and the interaction of those terms.
Prior research controls for industry membership in tax burden regressions
(Zimmerman, 1983; Wilkie, 1988; Harris, 1993; Collins and Shackelford, 1996; and
Jacob, 1996); furthermore, Altshuler, Grubert, and Newlon, (1997) and Grubert (1997)
show that ETRs vary through time. Accordingly, I include dummy variables for industry
membership and year in equation (1).14 In addition, statutory tax rates vary substantially
around the world, ranging from 0% in some tax havens to more than 50% in Japan and
India. Unfortunately, firms are not required to disclose the statutory tax rates of the
geographic segments they report. I include a location dummy variable in equation (1) to
at least partially control for variation in statutory tax rates around the world.15
I use two different proxies for foreign operations in the empirical tests. I use the
MNC dummy variable in equation (1) to determine whether multinational firms have
lower or higher ETRs than other firms. I use the ratio of foreign assets to total worldwide
assets, FOROPER, in equation (2) to determine whether firms with more extensive
foreign operations have lower or higher ETRs than other firms:
εααα
αααααααα
++++
+++++++=
∑∑∑=
+=
+=
+
7
125
6
119
12
17
765
243210
kkk
jjj
iii YEARINDUSLOCATION
MNCxPTIMNCxSIZEMNCFOROPERFOROPERPTISIZEWWETR
(2)
13
In contrast to the MNC dummy variable, FOROPER is a continuous variable that
measures the extent of foreign operations.16 While MNC tests whether systematic
differences exist between the ETRs of multinational and domestic-only companies,
FOROPER tests whether economies of scope exist for foreign tax planning. Finally,
because the extent of foreign operations and ETRs may not be linearly related, the square
of the extent of foreign operations, FOROPER2, controls for any non- linearities that may
exist.
I perform the following two regression analyses on a sample of multinational
corporations only, to determine whether the relations between ETRs and the extent of
foreign operations are different from the broader sample of firms:
εααα
ααααα
++++
++++=
∑ ∑∑= =
++=
+
6
1
7
12216
12
14
243210
j kkkjj
iii YEARINDUSLOCATION
FOROPERFOROPERPTISIZEWWETR (3
? )
εα
ααα
ααααα
++
+++
++++=
∑
∑∑
=+
=+
=+
7
123
6
117
12
15
25
43210
kkk
jjj
iii
YEAR
INDUSLOCATIONFOROPER
FOROPERFORPTIUSPTISIZEWWETR
(4)
Equation (4) decomposes total pre-tax income into U.S. and foreign pre-tax
income (USPTI and FORPTI) to test whether U.S. and foreign pre-tax income affect
14
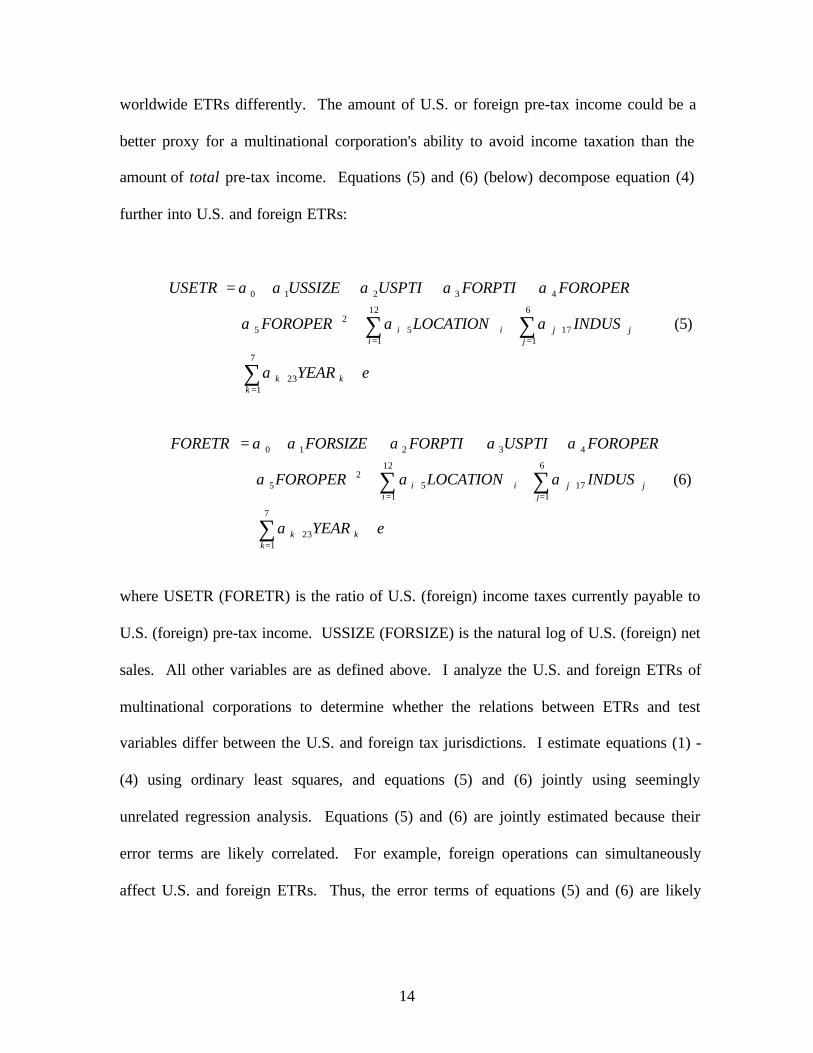
worldwide ETRs differently. The amount of U.S. or foreign pre-tax income could be a
better proxy for a multinational corporation's ability to avoid income taxation than the
amount of total pre-tax income. Equations (5) and (6) (below) decompose equation (4)
further into U.S. and foreign ETRs:
εα
ααα
ααααα
++
+++
++++=
∑
∑∑
=+
=+
=+
7
123
6
117
12
15
25
43210
kkk
jjj
iii
YEAR
INDUSLOCATIONFOROPER
FOROPERFORPTIUSPTIUSSIZEUSETR
(5)
εα
ααα
ααααα
++
+++
++++=
∑
∑∑
=+
=+
=+
7
123
6
117
12
15
25
43210
kkk
jjj
iii
YEAR
INDUSLOCATIONFOROPER
FOROPERUSPTIFORPTIFORSIZEFORETR
(6)
where USETR (FORETR) is the ratio of U.S. (foreign) income taxes currently payable to
U.S. (foreign) pre-tax income. USSIZE (FORSIZE) is the natural log of U.S. (foreign) net
sales. All other variables are as defined above. I analyze the U.S. and foreign ETRs of
multinational corporations to determine whether the relations between ETRs and test
variables differ between the U.S. and foreign tax jurisdictions. I estimate equations (1) -
(4) using ordinary least squares, and equations (5) and (6) jointly using seemingly
unrelated regression analysis. Equations (5) and (6) are jointly estimated because their
error terms are likely correlated. For example, foreign operations can simultaneously
affect U.S. and foreign ETRs. Thus, the error terms of equations (5) and (6) are likely
15
correlated and seemingly unrelated regression accounts for this cross-equation error
correlation.
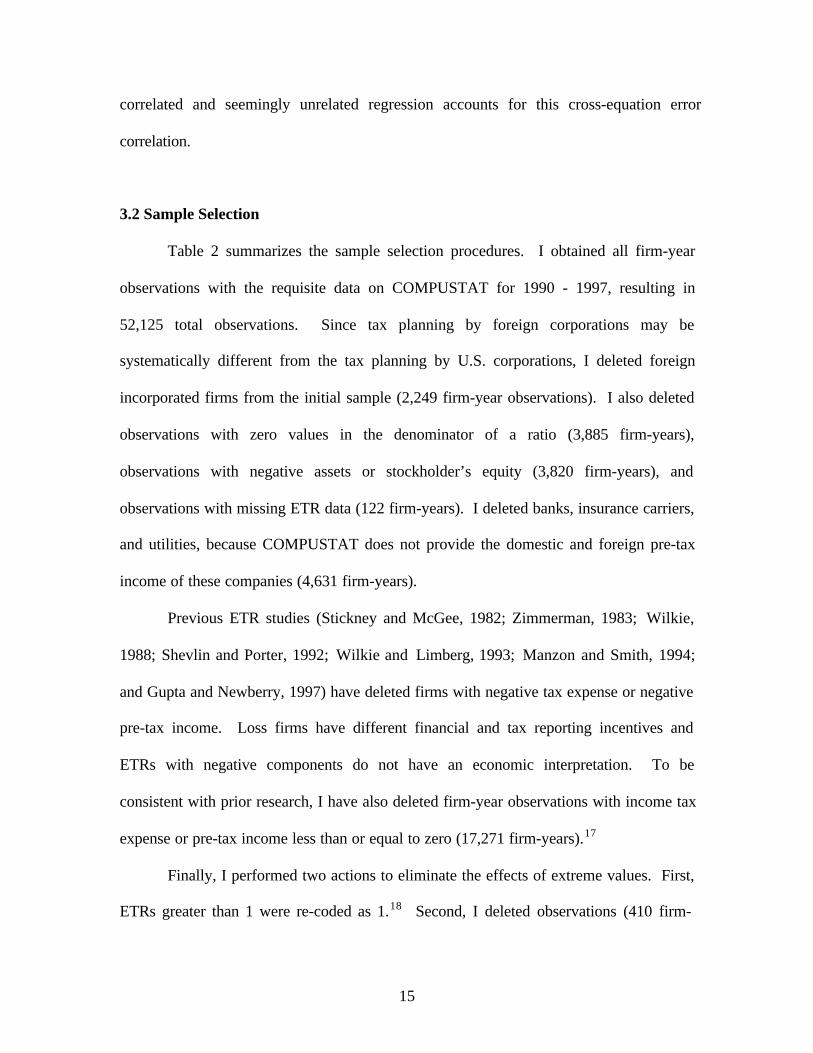
3.2 Sample Selection
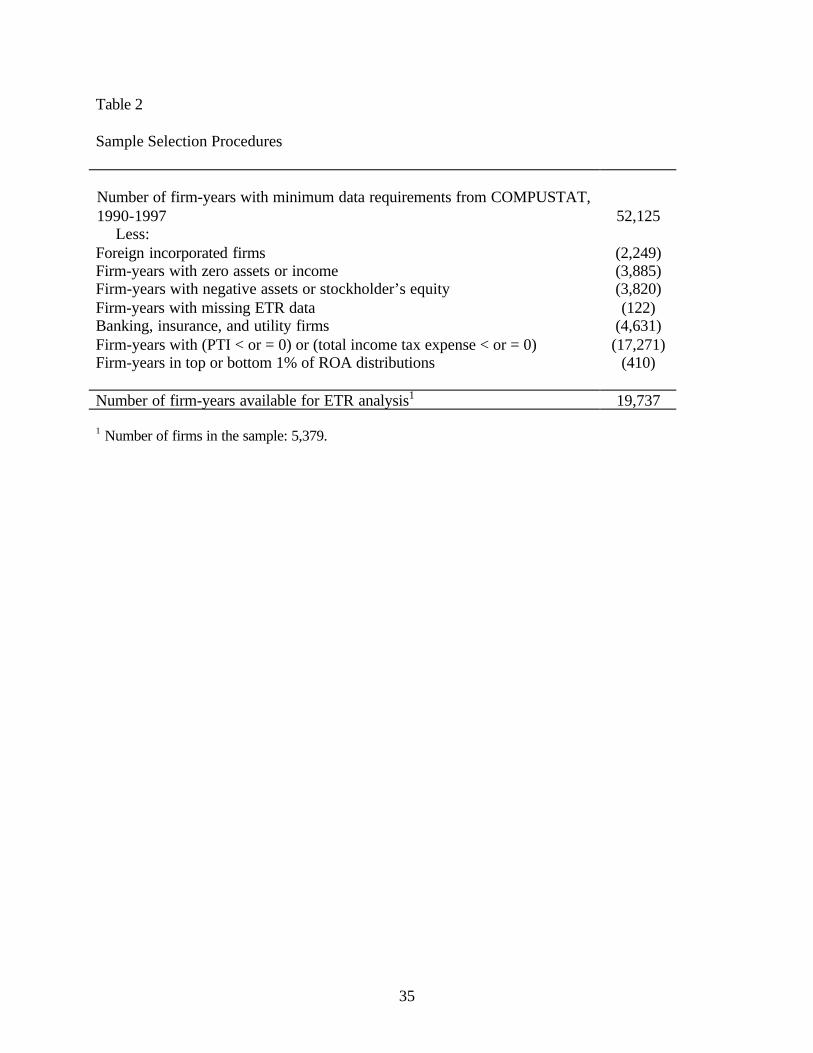
Table 2 summarizes the sample selection procedures. I obtained all firm-year
observations with the requisite data on COMPUSTAT for 1990 - 1997, resulting in
52,125 total observations. Since tax planning by foreign corporations may be
systematically different from the tax planning by U.S. corporations, I deleted foreign
incorporated firms from the initial sample (2,249 firm-year observations). I also deleted
observations with zero values in the denominator of a ratio (3,885 firm-years),
observations with negative assets or stockholder’s equity (3,820 firm-years), and
observations with missing ETR data (122 firm-years). I deleted banks, insurance carriers,
and utilities, because COMPUSTAT does not provide the domestic and foreign pre-tax
income of these companies (4,631 firm-years).
Previous ETR studies (Stickney and McGee, 1982; Zimmerman, 1983; Wilkie,
1988; Shevlin and Porter, 1992; Wilkie and Limberg, 1993; Manzon and Smith, 1994;
and Gupta and Newberry, 1997) have deleted firms with negative tax expense or negative
pre-tax income. Loss firms have different financial and tax reporting incentives and
ETRs with negative components do not have an economic interpretation. To be
consistent with prior research, I have also deleted firm-year observations with income tax
expense or pre-tax income less than or equal to zero (17,271 firm-years).17
Finally, I performed two actions to eliminate the effects of extreme values. First,
ETRs greater than 1 were re-coded as 1.18 Second, I deleted observations (410 firm-
16
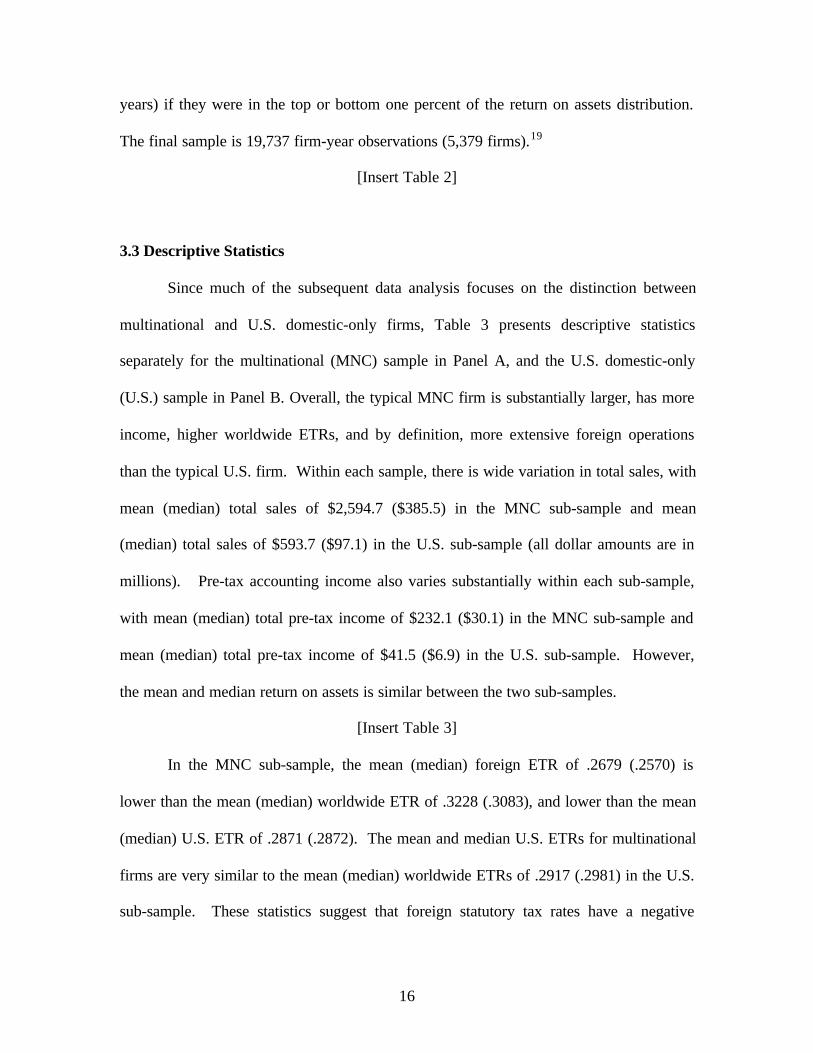
years) if they were in the top or bottom one percent of the return on assets distribution.
The final sample is 19,737 firm-year observations (5,379 firms).19
[Insert Table 2]
3.3 Descriptive Statistics
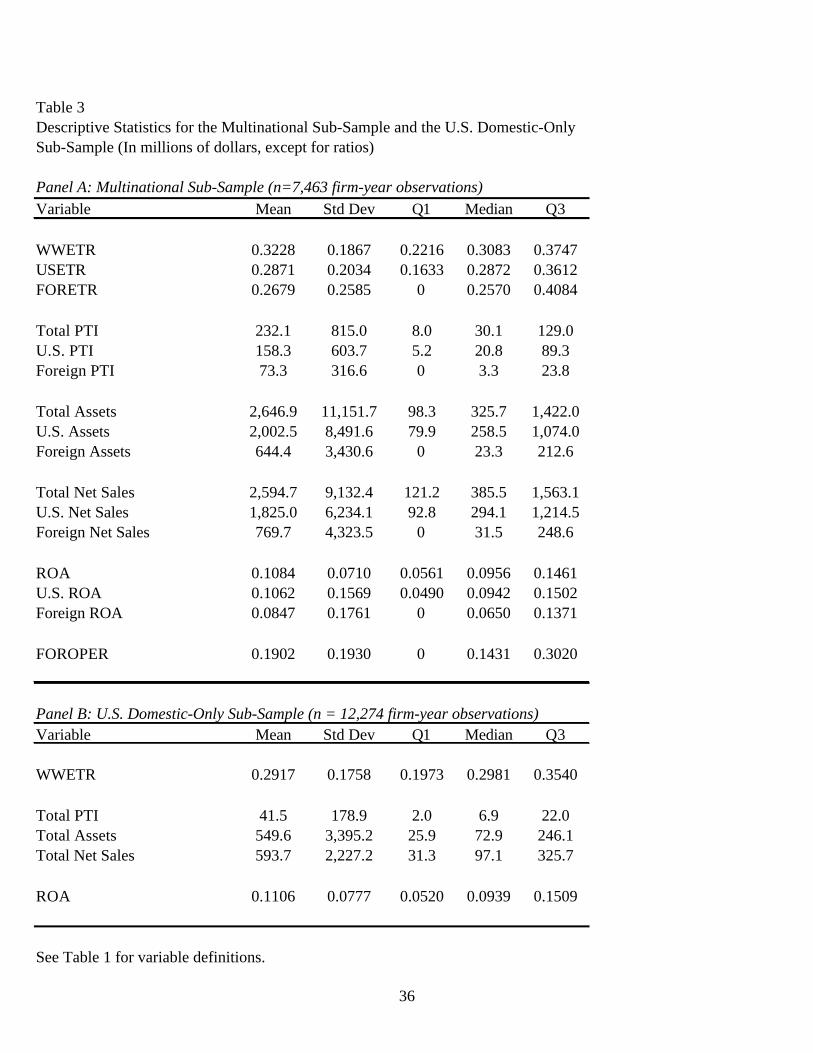
Since much of the subsequent data analysis focuses on the distinction between
multinational and U.S. domestic-only firms, Table 3 presents descriptive statistics
separately for the multinational (MNC) sample in Panel A, and the U.S. domestic-only
(U.S.) sample in Panel B. Overall, the typical MNC firm is substantially larger, has more
income, higher worldwide ETRs, and by definition, more extensive foreign operations
than the typical U.S. firm. Within each sample, there is wide variation in total sales, with
mean (median) total sales of $2,594.7 ($385.5) in the MNC sub-sample and mean
(median) total sales of $593.7 ($97.1) in the U.S. sub-sample (all dollar amounts are in
millions). Pre-tax accounting income also varies substantially within each sub-sample,
with mean (median) total pre-tax income of $232.1 ($30.1) in the MNC sub-sample and
mean (median) total pre-tax income of $41.5 ($6.9) in the U.S. sub-sample. However,
the mean and median return on assets is similar between the two sub-samples.
[Insert Table 3]
In the MNC sub-sample, the mean (median) foreign ETR of .2679 (.2570) is
lower than the mean (median) worldwide ETR of .3228 (.3083), and lower than the mean
(median) U.S. ETR of .2871 (.2872). The mean and median U.S. ETRs for multinational
firms are very similar to the mean (median) worldwide ETRs of .2917 (.2981) in the U.S.
sub-sample. These statistics suggest that foreign statutory tax rates have a negative
17
impact on worldwide ETRs and, on average, the income tax rates of the foreign countries
where U.S. multinational corporations pay taxes are lower than the U.S. tax rate.
Finally, the mean (median) extent of foreign operations (FOROPER) of the MNC
sub-sample is .1902 (.1431). Thus, the typical multinational firm has material foreign
operations, as well as greater overall sales and income than a purely domestic company.
However, return on assets and U.S. ETRs are strikingly similar between the two sub-
samples.
Panel C displays the frequencies of the control variables, LOCATION, INDUS,
and YEAR. While few firm-year observations report operations in the Middle East
(2.58%), Africa (3.53%), and Japan (5.68%), many firm-year observations report
operations in Europe (23.68%), Canada (18.42%), and Asia (14.56%). The most
frequently reported industries are SIC codes 3000-4000 (32.2% of the sample), with
many firms also reporting SIC codes 2000-3000 (15.87%) and 5000-6000 (13.53%).20
Unfortunately, 15.13% of the sample reported their SIC code as missing. 21 Finally, Panel
C shows that firm-year observations are fairly evenly distributed throughout 1990-1997,
with somewhat fewer observations originating in 1990 (10.63%) and 1991 (10.36%).
4. Results
4.1 Entire Sample
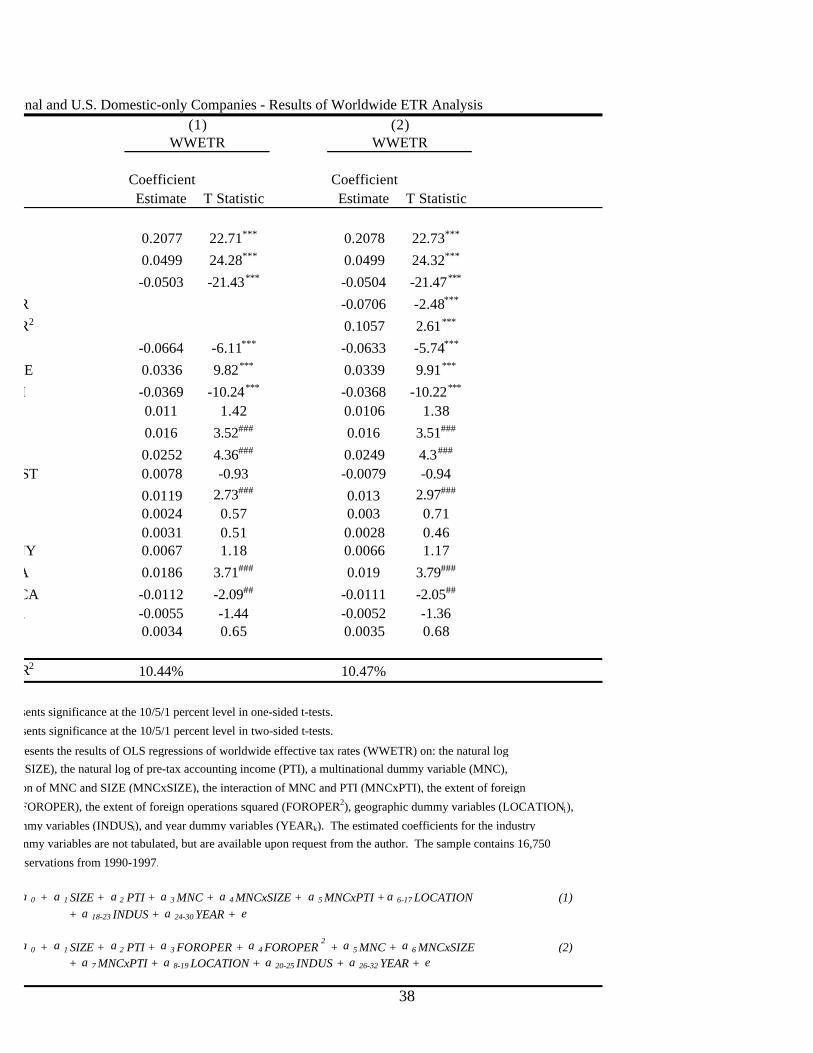
Table 4 presents the results of empirical tests using the entire sample of U.S.
multinational and domestic-only companies. In particular, Table 4 presents estimated
coefficients for equations (1) and (2). H1, H2, and H3 predict that larger firms with
18
greater income and more extensive foreign operations avoid more income taxes, resulting
in lower worldwide ETRs.
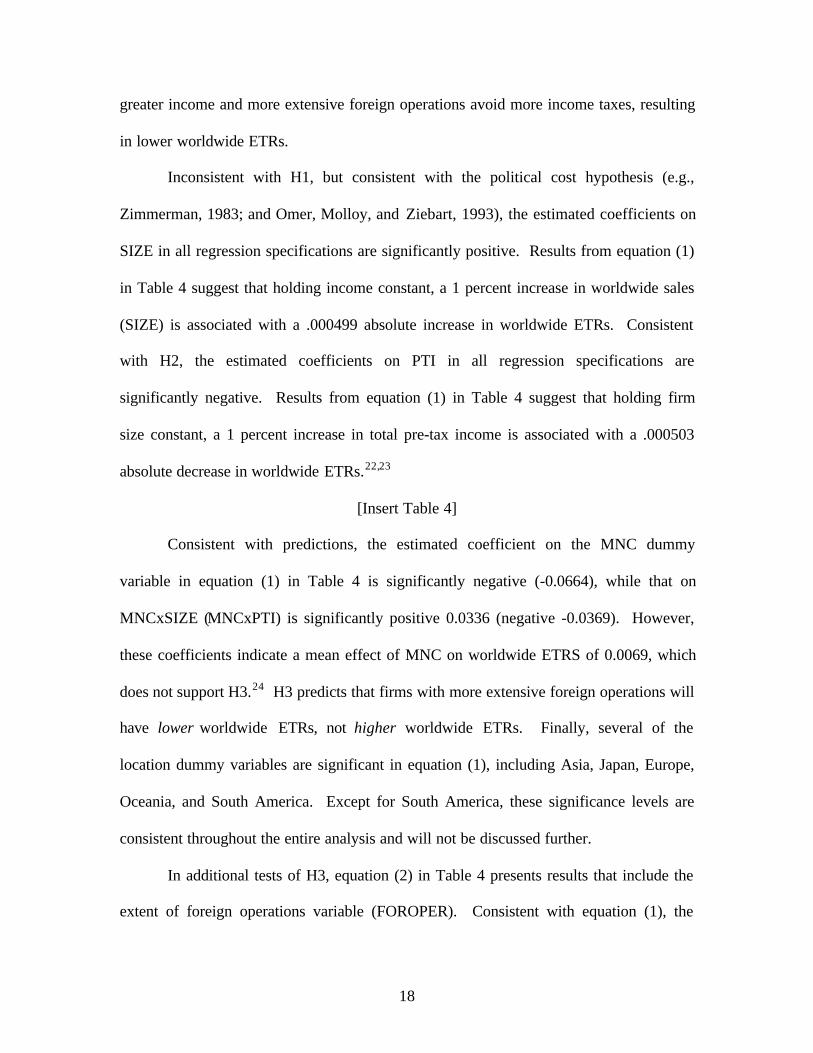
Inconsistent with H1, but consistent with the political cost hypothesis (e.g.,
Zimmerman, 1983; and Omer, Molloy, and Ziebart, 1993), the estimated coefficients on
SIZE in all regression specifications are significantly positive. Results from equation (1)
in Table 4 suggest that holding income constant, a 1 percent increase in worldwide sales
(SIZE) is associated with a .000499 absolute increase in worldwide ETRs. Consistent
with H2, the estimated coefficients on PTI in all regression specifications are
significantly negative. Results from equation (1) in Table 4 suggest that holding firm
size constant, a 1 percent increase in total pre-tax income is associated with a .000503
absolute decrease in worldwide ETRs.22,23
[Insert Table 4]
Consistent with predictions, the estimated coefficient on the MNC dummy
variable in equation (1) in Table 4 is significantly negative (-0.0664), while that on
MNCxSIZE (MNCxPTI) is significantly positive 0.0336 (negative -0.0369). However,
these coefficients indicate a mean effect of MNC on worldwide ETRS of 0.0069, which
does not support H3.24 H3 predicts that firms with more extensive foreign operations will
have lower worldwide ETRs, not higher worldwide ETRs. Finally, several of the
location dummy variables are significant in equation (1), including Asia, Japan, Europe,
Oceania, and South America. Except for South America, these significance levels are
consistent throughout the entire analysis and will not be discussed further.
In additional tests of H3, equation (2) in Table 4 presents results that include the
extent of foreign operations variable (FOROPER). Consistent with equation (1), the
19
estimated coefficients are significantly positive (negative) on SIZE and MNCxSIZE (PTI
and MNCxPTI). The significantly negative estimated coefficient on FOROPER (-.0706)
supports H3 and indicates that even after controlling for multinational status (MNC,
which maintains a significantly negative estimated coefficient of -.0633), multinational
corporations with more extensive foreign operations have lower worldwide ETRs than
firms with less extensive foreign operations. This result is consistent with economies of
scope to tax planning. That is, firms with more extensive foreign operations are able to
perform more effective tax planning than firms with less extensive foreign operations.
However, the estimated coefficient on FOROPER2 is significantly positive (.1057),
indicating that the returns to tax planning decrease as multinational corporations continue
to expand their foreign operations.25
4.2 Multinational Corporations Only Sample
Table 5 presents results of regressions of worldwide ETRs on test and control
variables, for a sample of multinational corporations only. In particular, Table 5 presents
estimated coefficients for equations (3) and (4). I perform these regressions to determine
whether the relations between ETRs and the extent of foreign operations in a sample of
multinational corporations only are different from the broader sample of firms.
Consistent with Table 4, the results in Table 5 indicates that holding income constant,
larger firms have higher worldwide ETRs (estimated coefficient on SIZE = .0865 in
equation (3) and .0496 in equation (4)).
[Insert Table 5]
20
Consistent with equations (1) and (2) and H2, the estimated coefficient on pre-tax
income is significantly negative in equation (3) (estimated coefficient = -.0889).
However, equation (4) decomposes worldwide pre-tax income into U.S. and foreign pre-
tax income. This decomposition controls for the fact that the amount of U.S. or foreign
pre-tax income could be a better proxy for a multinational corporation's ability to avoid
income taxation than the amount of total pre-tax income. The results for equation (4) in
Table 5 show that larger amounts of U.S. and foreign pre-tax income are both associated
with lower worldwide ETRs. However, the estimated coefficient on U.S. pre-tax income
(-.0434) is of larger magnitude than that on foreign pre-tax income (-.0149).
Finally, consistent with H3, the estimated coefficients on FOROPER (-.0722) and
FOROPER2 (.1089) in equation (3) are similar to the estimated coefficients for the
broader sample of firms. Thus, firms with more extensive foreign operations report
lower worldwide ETRs, consistent with economies of scope to tax planning. However,
the returns to tax planning decrease as multinational corporations continue to expand
their foreign operations. The estimated coefficients on FOROPER (-.0447) and
FOROPER2 (.0296) in equation (4) are consistent with this story, but only FOROPER is
statistically significant.
Table 6 presents results of regressions of U.S. and foreign ETRs on test and
control variables for the sample of multinational corporations only. In particular, Table 6
presents estimated coefficients for equations (5) and (6). I perform these regressions to
determine whether the relations between ETRs and test variables differ between the U.S.
and foreign tax jurisdictions. Consistent with Tables 4 and 5, the results in Table 6
indicate that holding income constant, larger firms have higher U.S. and foreign ETRs
21
(estimated coefficient on SIZE = .0663 in equation (5) and .0008 in equation (6)).
However, foreign ETRs are not significantly related to firm size.
[Insert Table 6]
Similar to equation (4), equations (5) and (6) contain both U.S. and foreign pre-
tax income. I include both measures of income because the amount of income earned in
other tax jurisdictions can affect U.S. and foreign ETRs. For example, U.S. ETRs will be
higher in the year of foreign-source income repatriation for firms in an "excess limit"
foreign tax credit position. The U.S. ETRs will be higher because additional U.S. tax will
be due upon repatriation of the foreign-source income (so the numerator of ETRs will be
higher), but the repatriated income will be eliminated in the financial accounting
consolidation process (so the denominator of ETRs will not change). If foreign-source
income repatriations are correlated with foreign pre-tax income, then foreign pre-tax
income should be positively related to U.S. ETRs for firms in an "excess credit" foreign
tax credit position. 26 Further, income shifting between U.S. and foreign tax jurisdictions
could systematically affect U.S. and foreign ETRs. Consequently, I have included both
U.S. and foreign pre-tax income in equations (5) and (6) and I jointly estimate these
equations using seemingly unrelated regression methodology to account for the fact that
the error terms between these two equations are likely correlated.
Consistent with Tables 4 and 5 and H2, the results in Table 6 reveal that U.S. and
foreign ETRs are decreasing in U.S. pre-tax income. Thus, firms that report higher levels
of U.S. pre-tax income likely engage in multinational tax planning, which reduces their
U.S. and foreign tax burdens. However, the estimated coefficient on foreign pre-tax
income is positive and marginally significant in equation (5) (estimated coefficient =
22
.003) and significantly positive in equation (6) (estimated coefficient = .0347).
Contradicting the predictions of H2, these results suggest that higher levels of foreign
pre-tax income are associated with higher ETRs, not lower ETRs.
Consistent with equations (2), (3), and (4) and H3, the estimated coefficient on
FOROPER is negative but not significant in equation (5) (estimated coefficient = -.0361)
and significantly negative in equation (6) (estimated coefficient = -.3131). The estimated
coefficient on FOROPER2 is significantly positive in equations (5) and (6) (estimated
coefficients = .1736 and .1875, respectively). These results suggest that firms with more
extensive foreign operations engage in tax planning and report lower U.S. and foreign
ETRs. However, the returns to tax planning decrease as multinational corporations
continue to expand their foreign operations. 27
4.3 Sensitivity Analysis
I performed sensitivity analysis (untabulated) to determine the strength of the
main results. Specifically, I tested whether the results are sensitive to (1) the inclusion of
additional control variables, (2) the inclusion of deferred taxes, (3) the inclusion of loss
firms, and (4) year-by-year regressions.
Previous research has found significant relationships between ETRs and firm
leverage and between ETRs and capital intensity (Stickney and McGee, 1982; Gupta and
Newberry, 1997; Mills, Erickson, and Maydew, 1998). Inclusion of these control
variables does not change the sign or significance level of any of the estimated
coefficients in Tables 4, 5, or 6. Thomas (1988), Scholes, Wilson, and Wolfson (1990),
Shevlin (1990), Wang (1991), Manzon (1994), and Graham (1996) document the
23
importance of controlling for net operating losses (NOLs) when estimating marginal and
average effective tax rates. Neither the inclusion of a dummy variable for NOL
carryforwards, nor the inclusion of the change in NOL carryforwards, qualitatively alters
the estimated coefficients in Tables 4, 5, or 6.28
Although the most common definition of average ETR in previous research has
been the ratio of income taxes currently payable to pre-tax accounting income, some
studies have included deferred income taxes in the numerator, as well. To examine
whether my results are sensitive to the inclusion of deferred taxes, I performed the
regression analyses with ETRs that include both current and deferred income taxes in the
numerators. The inclusion of deferred taxes in the numerator of ETRs does not
qualitatively alter any of the estimated coefficients in Tables 4, 5, or 6.
To examine the impact of deleting loss firms from my sample, I performed
sensitivity analyses that retained the loss firms. Consistent with Shevlin (1990), and
similar to Manzon and Plesko (2002), I control for negative pre-tax income and negative
income tax expense by adding loss dummy variables to equations (1) - (6). Specifically,
if a firm-year observation reported negative pre-tax income, then a BOOKLOSS dummy
variable was coded as 1, 0 otherwise. If a firm-year observation reported zero or negative
income tax expense, then a TAXLOSS dummy variable was coded as 1, 0 otherwise. In
addition, if a firm-year observation had both BOOKLOSS and TAXLOSS coded as 1,
then a DOUBLOSS dummy variable was coded as 1, 0 otherwise. Table 7 presents
results of regressions of equations (1) and (2) where loss firms are included in the sample.
The inclusion of loss firms in the sample modified several results from Tables 4 and 5.
The estimated coefficients on MNC become significantly positive, rather than
24
significantly negative, and the estimated coefficients on MNCxSIZE and MNCxPTI are
no longer significant. This suggests that the U.S. domestic-only sample includes
substantially more loss firm-years than the multinational sample, shifting the mean
worldwide ETR of the U.S. sample below that of the multinational sample.29
Because Tables 4, 5, and 6 estimate regressions using pooled, cross-sectional
data, I investigated whether correlated error terms inflated the statistical significance of
my estimated coefficients. I estimated equations (2), (3), (5), and (6) on a year-by-year
basis and analyzed the estimated coefficients (untabulated). First, the year-by-year t-
statistics for each regression are similar to those reported in Tables 4, 5, and 6. Second, I
computed Fama - MacBeth t-statistics, which also indicate that the year-by-year results
are qualitatively the same as those reported in Tables 4, 5, and 6.30 Thus, I conclude that
correlated error terms do not account for the statistical significance of my results.
5. Conclusions
This paper investigates whether economies of scale and scope exist for tax
planning such that firms of greater economic scale and scope avoid more income taxes
than other firms. In particular, I examine the ETRs of multinational corporations
compared to the ETRs of U.S. domestic-only companies. Relative to prior ETR research,
this study examines a larger sample of firms in a multivariate framework. For the time
period under investigation (1990 - 1997), I conclude that after controlling for pre-tax
income, foreign operations, industry membership, year, and geographic location, larger
firms have higher ETRs. This result holds under all regression specifications and is
25
consistent with some prior research, which concludes larger firms face political costs that
increase their ETRs.
I also document that after controlling for firm size, corporations with greater pre-
tax income have lower ETRs. This result holds under all regression specifications and
suggests that firms with greater income avoid more income taxes than other firms. This
negative relation between ETRs and pre-tax income was not found in prior research,
which did not control for firm size. My results also indicate that multinational
corporations with more extensive foreign operations have lower worldwide, U.S., and
foreign ETRs. Prior research, which finds that large firms report lower ETRs than
smaller firms, does not control for pre-tax income or the extent of foreign operations. I
conclude that the prior contradictory findings regarding the relation between ETRs and
firm size are likely due to model misspecification.
The empirical results for the sample of multinational corporations only are
substantially the same as those for the broader sample. However, the results show that
while higher levels of U.S. pre-tax income are associated with lower U.S. and foreign
ETRs, higher levels of foreign pre-tax income are associated with higher U.S. and foreign
ETRs. Thus, large amounts of foreign pre-tax income are associated with higher
corporate tax burdens. Overall, this paper finds substantial evidence of economies of
scale and economies of scope to tax planning, and responds to Collins and Shackelford
(1999) who cite a lack of empirical evidence regarding the ability of multinational
corporations to pay less income tax than domestic-only firms.
26
1 For purposes of this paper, economic scale refers to the size of a firm’s operations and economic scope
refers to the range of a firm’s operations. Researchers frequently measure firm size with total assets,
equity, or sales, while range of operations can be measured by the number of industries a firm operates in,
the number of geographic locations, the extent of vertical integration, or the complexity of operations.
2 As used in this paper, the term 'tax avoidance' includes any tax planning method that taxpayers use to
legally reduce their income tax payments. Tax evasion (fraud) is not considered 'tax avoidance' for
purposes of this paper.
3 While firm size proxies for economic scale, pre-tax income proxies for both economic scale and scope in
this paper. See section 2.2 for additional discussion.
4 See Siegfried (1972), U.S. Treasury (1978), Stickney and McGee (1982), and Zimmerman (1983).
5 See Zimmerman (1983) for a detailed discussion of the 'political cost hypothesis'.
6 See Kern and Morris (1992) for a reconciliation of Zimmerman's (1983) results to those of Porcano
(1986).
7 Hanlon and Shevlin (2002) and Manzon and Plesko (2002) document that the financial accounting rules
for non-qualified stock options (NQSOs) overstate current tax expense, and consequently, ETRs as defined
in this paper. The possible correlation of NQSO exercise with the independent variables in equations (1) -
(6) is a limitation of this study. In particular, the accounting for NQSOs may influence the finding that
larger firms pay more tax.
8 Mills (1998) documents that firms with greater book-tax differences have larger IRS audit adjustments,
consistent with greater tax avoidance activities.
9 Mackie (1999) also claims that higher profitability allows a firm to utilize net operating loss carryovers
from prior years. In fact, he cites rising profitability during the 1990's as the most important factor
explaining the fall in the average tax rate during that time period.
10 Large firms would have the capital necessary to finance the shelters discussed in the U.S. Treasury report
regarding corporate tax shelters (U.S. Department of Treasury, 1999). Several of these shelters involve the
27
complex use of flow-through entities, including contingent installment sale note transactions, liquidating
REIT shelters, and fast pay stock transactions.
11 In an unrelated project, I compared the 1992 corporate statutory tax rates of 60 countries (including
OECD countries) to that of the United States. I found that only 17 countries had corporate statutory tax
rates less than the U.S. statutory rate of 35 percent.
12 Excluding deferred taxes from the numerator of ETRs more closely reflects the time value of money,
since ceteris paribus firms defer payment of income taxes whenever possible. However, this definition of
ETRs is vulnerable to firms that manage accounting earnings (pre-tax income) upwards, without modifying
their taxable income. Inclusion of deferred taxes in the numerator of ETRs would control for such earnings
management activities, since income-increasing earnings management increases both the denominator (pre-
tax income), and the numerator (deferred taxes) of ETRs. As discussed in section 4.3, inclusion of deferred
taxes in the numerator does not affect the main results of this paper, and thus I conclude that earnings
management does not drive the main results of this paper.
13 Since the natural log of any number between 0 and 1 is a negative number, I have added 1 (i.e., one
million dollars) to reported net sales and pre-tax income. The results are qualitatively the same without this
transformation. In addition, if I simply delete firm-year observations that report sales or pre-tax income
between 0 and 1, the results are qualitatively the same as those reported in Tables 4, 5, and 6.
14 The inclusion of year dummy variables assumes that year of observation influences all firms similarly.
Another approach is to average ETRs and explanatory variables over time, and to test the same relations. I
averaged ETRs, SIZE, and PTI over five years, then I interacted MNC with five-year average SIZE and
PTI and performed regressions similar to equation (1). While the adjusted R2 from this sensitivity analysis
drops to 1.66%, inferences are the same as those in Table 4.
15 COMPUSTAT provides geographic segment data that indicates whether a corporation reports operations
in specific geographic regions, including Africa, Asia, Middle East, Europe, Oceania (Australia and Pacific
countries), South America, and North America. I have used country specific data where available (Japan,
U.K., France, Germany, Canada, U.S., and Mexico).
16 While foreign sales and foreign operating profit are also available on COMPUSTAT’s geographic
segment data, foreign assets are the most reliable indicator of the location of a firm’s operating activities.
28
Foreign sales and operating profit are susceptible to manipulation through income shifting and tax
avoidance activities and thus are not as reliable indicators of the location of a firm’s operating activities.
Nonetheless, sensitivity tests were performed with sales and operating profit as indicators of the extent of
foreign operations. The results are substantially the same, regardless which definition of the extent of
foreign operations is used.
17 I also perform empirical tests on a sample that includes loss firms and controls for negative pre-tax
income and negative income tax expense. The results are qualitatively the same as those excluding loss
firms from the sample. See Table 7 and the discussion in Section 4.3 for further details.
18 Because I deleted loss firms in a previous step, no remaining firms reported ETRs < 0. However, 405
firm-year observations reported ETRs > 1.
19 If I do not trim firm-year observations in the top and bottom one percent of the return on assets
distribution the results are qualitatively the same as those reported in Tables 4, 5, and 6.
20 SIC codes 3000-4000 include metal, machinery, equipment, and other heavy manufacturing firms. SIC
codes 2000-3000 include food, apparel, paper, and chemical products firms. SIC codes 5000-6000 include
wholesale and retail firms.
21 While these firm-year observations are included in Tables 2 and 3, they are excluded from Tables 4-6.
22 For example, if firm A doubles its total pre-tax income from $1,000,000 to $2,000,000 (i.e., pre-tax
income increases by 100%), its worldwide ETR will decrease 5.03%, which translates into $50,300 in tax
savings. If firm B doubles its total pre-tax income from $10 million to $20 million, its worldwide ETR will
also decrease by 5.03%, which translates into $503,000 in tax savings.
23 SIZE and PTI are highly correlated (Pearson correlation = .89), potentially causing multicollinearity
problems for equations (1), (2), and (3). Greene (p. 267) lists the symptoms of multicollinearity as: (1)
small changes in the data can produce wide swings in parameter estimates, (2) coefficients with large
standard errors and low significance levels, and (3) coefficients with the wrong sign or of implausible
magnitude. While the magnitudes of the estimated coefficients on SIZE and PTI vary somewhat in
sensitivity tests and between tables 4 and 5, the basic conclusions are always the same: WWETRs are
increasing in SIZE and decreasing in PTI. The sensitivity analyses included dropping SIZE (PTI) from
equations (1), (2), and (3). When SIZE (PTI) is dropped from these equations, the estimated coefficient on
29
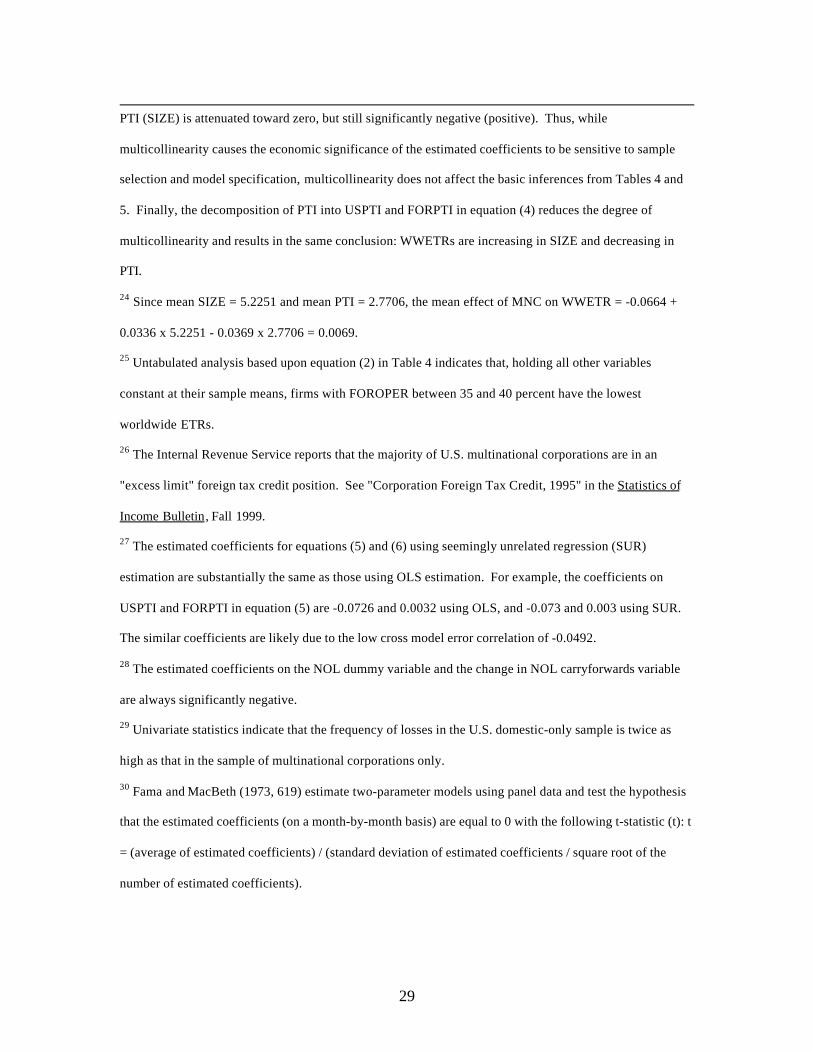
PTI (SIZE) is attenuated toward zero, but still significantly negative (positive). Thus, while
multicollinearity causes the economic significance of the estimated coefficients to be sensitive to sample
selection and model specification, multicollinearity does not affect the basic inferences from Tables 4 and
5. Finally, the decomposition of PTI into USPTI and FORPTI in equation (4) reduces the degree of
multicollinearity and results in the same conclusion: WWETRs are increasing in SIZE and decreasing in
PTI.
24 Since mean SIZE = 5.2251 and mean PTI = 2.7706, the mean effect of MNC on WWETR = -0.0664 +
0.0336 x 5.2251 - 0.0369 x 2.7706 = 0.0069.
25 Untabulated analysis based upon equation (2) in Table 4 indicates that, holding all other variables
constant at their sample means, firms with FOROPER between 35 and 40 percent have the lowest
worldwide ETRs.
26 The Internal Revenue Service reports that the majority of U.S. multinational corporations are in an
"excess limit" foreign tax credit position. See "Corporation Foreign Tax Credit, 1995" in the Statistics of
Income Bulletin, Fall 1999.
27 The estimated coefficients for equations (5) and (6) using seemingly unrelated regression (SUR)
estimation are substantially the same as those using OLS estimation. For example, the coefficients on
USPTI and FORPTI in equation (5) are -0.0726 and 0.0032 using OLS, and -0.073 and 0.003 using SUR.
The similar coefficients are likely due to the low cross model error correlation of -0.0492.
28 The estimated coefficients on the NOL dummy variable and the change in NOL carryforwards variable
are always significantly negative.
29 Univariate statistics indicate that the frequency of losses in the U.S. domestic-only sample is twice as
high as that in the sample of multinational corporations only.
30 Fama and MacBeth (1973, 619) estimate two-parameter models using panel data and test the hypothesis
that the estimated coefficients (on a month-by-month basis) are equal to 0 with the following t-statistic (t): t
= (average of estimated coefficients) / (standard deviation of estimated coefficients / square root of the
number of estimated coefficients).
30
References
Abarbanell, J., Bushee, B., 1998. Abnormal Returns to a Fundamental Analysis Strategy. The
Accounting Review 73, 19-45.
Altshuler, R., Grubert, H., Newlon, S., 1997. Has U.S. Investment Abroad Become More
Sensitive to Tax Rates? Working paper.
Citizens for Tax Justice, 1984. Corporate Income Taxes in the Reagan Years. Washington, DC:
Citizens for Tax Justice.
Citizens for Tax Justice, 1985. Corporate Taxpayers and Corporate Freeloaders: Four Years of
Continuing, Legalized Tax Avoidance by America's Largest Corporations, 1981-1984.
Washington, DC: Citizens for Tax Justice.
Citizens for Tax Justice, 1986. 130 Reasons Why We Need Tax Reform. Washington, DC:
Citizens for Tax Justice.
Collins, J., Shackelford, D., 1996. Corporate Domicile and Average Effective Tax Rates: The
Cases of Canada, Japan, the United Kingdom, and the United States. In: Slemrod, J.
(Ed.), The Taxation of Multinational Corporations, Kluwer Academic Publishers,
Boston, pp. 51-79.
Collins, J., Shackelford, D., 1999. Writers Challenge Claim of Favorable Cross-Border
Taxation. Tax Notes 1/4/99, 131-134.
Fama, E., MacBeth, J., 1973. Risk, Return, and Equilibrium: Empirical Tests. The Journal of
Political Economy 81, 607-636.
Graham, J., 1996. Proxies for the Corporate Marginal Tax Rate. Journal of Financial
Economics 42, 187-221.
Greene, W., 1993. Econometric Analysis, Prentice-Hall, Inc., New Jersey.
31
Grubert, H., 1997. Tax Planning by Companies and Tax Competition by Governments: Is There
Evidence of Changes in Behavior? Working paper. U.S. Treasury Department.
Grubert, H., Slemrod, J., 1996. The Effect of Taxes on Investment and Income Shifting to
Puerto Rico. Working paper. University of Michigan.
Gupta, S., Newberry, K., 1997. Determinants of the Variability in Corporate Effective Tax
Rates: Evidence from Longitudinal Data. Journal of Accounting and Public Policy 16, 1-
34.
Hanlon, M., Shevlin, T., 2002. Accounting for Tax Benefits of Employee Stock Options and
Implications for Research. Accounting Horizons 16, 1-16.
Harris, D., (1993). The Impact of U.S. Tax Law Revision on Multinational Corporations’
Capital Location and Income shifting Decisions. Journal of Accounting Research
Supplement, 111-140.
Jacob, J., 1996. Taxes and Transfer Pricing: Income Shifting and the Volume of Intrafirm
Transfers. Journal of Accounting Research 34, 301-312.
Kern, B., Morris, M., 1992. Taxes and Firm Size: the Effects of Tax Legislation During the
1980’s. The Journal of the American Taxation Association 14, 80-96.
Leblang, S., 1998. International Double Nontaxation. Tax Notes International 7/20/98, 181-
183.
Levenson, A., 1999. Worldly Planning for Global Firms. Electronic News 7/5/99, 16.
Mackie, J., 1999. The Puzzling Comeback of the Corporate Income Tax. National Tax Journal
Conference Proceedings, 93-102.
Manzon, G., 1994. The Role of Debt in Early Debt Retirement. The Journal of the American
Taxation Association 16, 87-100.
32
Manzon, G., Plesko, G., 2002. The Relation between Financial and Tax Reporting Measures of
Income. Tax Law Review, forthcoming.
Manzon, G., Smith, W., 1994. The Effect of the Economic Recovery Tax Act of 1981 and the
Tax Reform Act of 1986 on the Distribution of Effective Tax Rates. Journal of
Accounting and Public Policy 13, 349-362.
Mills, L., 1998. Book-Tax Differences and Internal Revenue Service Adjustments. Journal of
Accounting Research 36, 343-356.
Mills, L., Erickson, M., Maydew, E., 1998. Investments in Tax Planning. The Journal of the
American Taxation Association 20, 1-20.
Omer, T., Molloy, K., Ziebart, D., 1993. An Investigation of the Firm Size - Effective Tax Rate
Relation in the 1980s. Journal of Accounting, Auditing, and Finance 8, 167-182.
Phillips, J., 2001. Corporate Tax Planning Effectiveness: The Role of Incentives. Working
paper. University of Connecticut.
Porcano, T., 1986. Corporate Tax Rates: Progressive, Proportional, or Regressive. The Journal
of the American Taxation Association 7, 17-31.
Scholes, M. S., Wilson, G. P., Wolfson, M. A., 1990. Tax Planning, Regulatory Capital
Planning, and Financial Reporting Strategy for Financial Institutions. The Review of
Financial Studies 3: 625-650.
Shevlin, T., 1990. Estimating Corporate Marginal Tax Rates with Asymmetric Tax Treatment of
Gains and Losses. The Journal of the American Taxation Association 12, 51-67.
Shevlin, T., Porter, S., 1992. The Corporate Tax Comeback in 1987: Some Further Evidence.
The Journal of the American Taxation Association 14, 58-79.
33
Siegfried, J., 1972. The Relationship between Economic Structure and the Effect of Political
Influence: Empirical Evidence from the Federal Corporation Income Tax Program. Ph.D.
dissertation. University of Wisconsin.
Slemrod, J., 1998. A General Model of the Behavioral Response to Taxation. National Bureau
of Economic Research working paper no. 6582.
Stickney, C., McGee, V., 1982. Effective Corporate Tax Rates: The Effect of Size, Capital
Intensity, Leverage, and Other Factors. Journal of Accounting and Public Policy 1, 125-
152.
Swenson, C., 1999. Increasing stock market value by reducing effective tax rates. Tax Notes
6/7/99, 1503-1505.
Thomas, J., 1988. Corporate Taxes and Defined Benefit Pension Plans. Journal of Accounting
and Economics 10: 199-238.
U.S. Department of Treasury, 1999. The Problem of Corporate Tax Shelters. Washington, D.C.,
Government Printing Office.
Wang, S., 1991. “The Relation between Firm Size and Effective Tax Rates: a Test of Firms’
Political Success. The Accounting Review 66, 158-169.
Wilkie, P., 1988. Corporate Average Effective Tax Rates and Inferences about Relative Tax
Preferences. The Journal of the American Taxation Association 10, 75-88.
Taxpayers: An Alternative to Average Effective Tax Rates. The Journal of the American
Taxation Association 15, 46-71.
Zimmerman, J., 1983. Taxes and Firm Size. Journal of Accounting and Economics 5, 119-149.
34
Table 1
Variable Definitions
Variable Definition COMPUSTAT Item:
WWETR = Worldwide current income tax exp / total PTI (#63 + #64) / #170USETR = U.S. current income tax exp / U.S. PTI #63 / #272FORETR = Foreign current income tax exp / foreign PTI #64 / #273
FOROPER* = foreign assets / total assets G.S.#5 / #6
MNC = 1 if FORPTI > 0 or FOROPER > 0; 0 otherwise
MNCxPTI = MNC * PTIMNCxSIZE = MNC * SIZE
INDUS = dummy variables for 1-digit SIC codes DNUMYEAR = dummy variables for year of observation YEARLOCATION* = dummy variables for location of foreign assets GAREA
* These variables use COMPUSTAT’s geographic segment(G.S.) data.
35
Table 2
Sample Selection Procedures
Number of firm-years with minimum data requirements from COMPUSTAT,1990-1997 52,125 Less:Foreign incorporated firms (2,249)Firm-years with zero assets or income (3,885)Firm-years with negative assets or stockholder’s equity (3,820)Firm-years with missing ETR data (122)Banking, insurance, and utility firms (4,631)Firm-years with (PTI < or = 0) or (total income tax expense < or = 0) (17,271)Firm-years in top or bottom 1% of ROA distributions (410)
Number of firm-years available for ETR analysis1 19,737
1 Number of firms in the sample: 5,379.
36
Table 3Descriptive Statistics for the Multinational Sub-Sample and the U.S. Domestic-OnlySub-Sample (In millions of dollars, except for ratios)
Panel A: Multinational Sub-Sample (n=7,463 firm-year observations)Variable Mean Std Dev Q1 Median Q3
represents significance at the 10/5/1 percent level in one-sided t-tests.
represents significance at the 10/5/1 percent level in two-sided t-tests.
This table presents the results of OLS regressions of worldwide effective tax rates (WWETR) on: the natural log of net sales (SIZE), the natural log of pre-tax accounting income (PTI), a multinational dummy variable (MNC),
the interaction of MNC and SIZE (MNCxSIZE), the interaction of MNC and PTI (MNCxPTI), the extent of foreign
operations (FOROPER), the extent of foreign operations squared (FOROPER2), geographic dummy variables (LOCATIONi),
industry dummy variables (INDUSj), and year dummy variables (YEARk). The estimated coefficients for the industry and year dummy variables are not tabulated, but are available upon request from the author. The sample contains 16,750
Table 5Multinational Corporations Only - Results of Worldwide ETR Regression Analysis
(3) (4)OLS Estimation OLS Estimation
WWETR WWETR
Coefficient CoefficientEstimate T Statistic Estimate T Statistic
Intercept 0.1279 6.81*** 0.2013 11.02***
SIZE 0.0865 28.92*** 0.0496 24.01***
PTI -0.0889 -30.63***
USPTI -0.0434 -30.63***
FORPTI -0.0149 -10.89***
FOROPER -0.0722 -2.46*** -0.0447 -1.52*
FOROPER2 0.1089 2.61*** 0.0296 0.71
Adjusted R2 13.44% 14.01%Notes:
**/ * represents significance at the 10/5/1 percent level in one-sided t-tests.
This table presents the results of OLS regressions of worldwide effective tax rates (WWETR) on: the natural log of net sales (SIZE), the natural log of pre-tax accounting income (PTI, USPTI, FORPTI), the extent
of foreign operations (FOROPER), the extent of foreign operations squared (FOROPER2), geographic
dummy variables (LOCATION i), industry dummy variables (INDUSTRYj), and year dummy variables (YEARk). The estimated coefficients for the location, industry, and year dummy variables are not tabulated but are available upon request from the author. The WWETR regression contains 6,740 firm-year
/* represents significance at the 10/5/1 percent level in one-sided t-tests.
This table presents the results of regressions of U.S. and foreign effective tax rates (USETR, FORETR) on: the natural log of net sales (USSIZE, FORSIZE), the natural log of pre-tax accounting income (USPTI, FORPTI),
the extent of foreign operations (FOROPER), the extent of foreign operations squared (FOROPER2),
geographic dummy variables (LOCATIONi), industry dummy variables (INDUSTRYj), and year dummy variables (YEARk). The estimated coefficients for the location, industry, and year dummy variables are not tabulated but are available upon request from the author. The USETR and FORETR regressions contain 5,216 firm-year
/* represents significance at the 10/5/1 percent level in one-sided t-tests.##/# represents significance at the 10/5/1 percent level in two-sided t-tests.
This table presents the results of OLS regressions of worldwide effective tax rates (WWETR) on: the natural log of net sales (SIZE), the natural log of pre-tax accounting income (PTI), a multinational dummy variable
(MNC), the interaction of MNC and SIZE (MNCxSIZE), the interaction of MNC and PTI (MNCxPTI), the extent of foreign operations (FOROPER), the extent of foreign operations squared (FOROPER2), dummy variables for
book losses (BOOKLOSS), tax losses (TAXLOSS), and both book and tax losses (DOUBLOSS), geographic dummy variables (LOCATION i), industry dummy variables (INDUS j), and year dummy variables (YEARk).
The estimated coefficients for the geographic, industry, and year dummy variables are not tabulated, but are available upon request from the author. The sample contains 30,414 firm-year observations from 1990-1997.