51

Introduction to 02
Financial Overview76
Messages from the Chairperson and the Executive Director
04 Team08
Advocacy12 Marketing and Communications16 Sustainability30
Training48 Plastics Statistics60 Partnerships74
Plastics|SA Annual Review
This Annual Report was compiled by ’s Marketing and Communications Division
Design and layout by www.redcreativestudio.com
W H E R E C A N I G E T M O R E I N F O R M AT I O N ?
+27 (0) 11 314 4021 | [email protected] | www.plasticsinfo.co.za
O P E R AT E S F R O M T H R E E C E N T R E S :
Head Office Midrand, GautengTwo regional centres Pinetown, Kwa-Zulu Natal and Maitland, Cape Town.
Introduction to Plastics|SA
Introduction to Plastics|SA
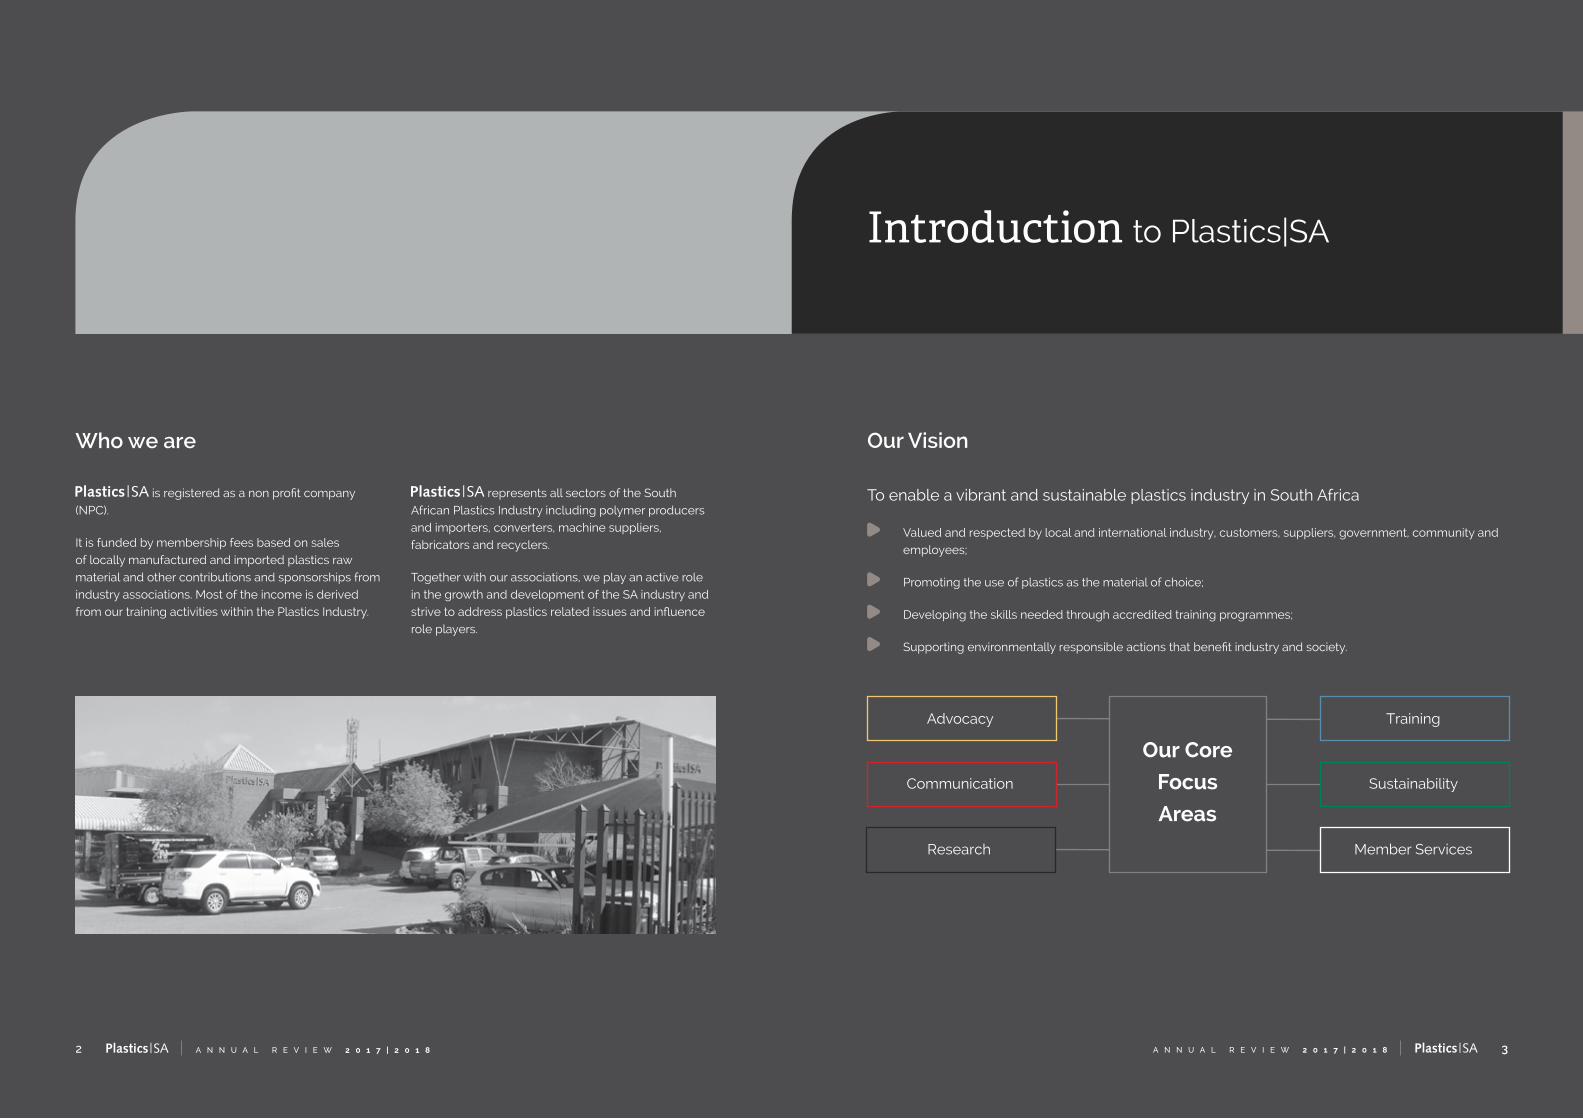
is registered as a non profit company (NPC).
It is funded by membership fees based on sales of locally manufactured and imported plastics raw material and other contributions and sponsorships from industry associations. Most of the income is derived from our training activities within the Plastics Industry.
represents all sectors of the South African Plastics Industry including polymer producers and importers, converters, machine suppliers, fabricators and recyclers.
Together with our associations, we play an active role in the growth and development of the SA industry and strive to address plastics related issues and influence role players.
3A N N U A L R E V I E W 2 0 1 7 | 2 0 1 8
Our Vision
To enable a vibrant and sustainable plastics industry in South Africa
Valued and respected by local and international industry, customers, suppliers, government, community and employees;
Promoting the use of plastics as the material of choice;
Developing the skills needed through accredited training programmes;
Supporting environmentally responsible actions that benefit industry and society.
Who we are
TrainingAdvocacy
SustainabilityCommunication
Member ServicesResearch
Our Core
Focus
Areas
2 A N N U A L R E V I E W 2 0 1 7 | 2 0 1 8
Messages from the
Chairperson
and the Executive Director
Chairperson’s message
Bernhard Mahl Chairperson
Board
5A N N U A L R E V I E W 2 0 1 7 | 2 0 1 84 A N N U A L R E V I E W 2 0 1 7 | 2 0 1 8
Public perception of plastics
The concept of ‘A life without plastics’, specifically single-use plastics, has become a
worldwide trend. Social media offers platforms for a plethora of anti-plastics messages
and campaigns, fuelling the negative perception of plastics on a daily basis.
Pressure is mounting from all sides to minimise the environmental impact of plastics packaging. It started with the plastic bag that stirred up emotions and environmental concerns and the most recent video of a sea turtle with a straw lodged in its nose went viral on social media and started the turmoil around plastic drinking straws.
International beach clean-up data from the Ocean Conservancy shows that plastic drinks bottles, food wrappers, plastic bottle caps, straws and stirrers, plastic bags and plastic lids are amongst the top ten most common items collected globally.
There is a huge gap between industry telling the positive plastics story and the visible evidence of plastics ending their valuable life in the ocean. Plastics industry leaders believe that plastics play a role in helping save the environment, but it has little to zero impact on the growing sentiment to refuse or even ban single-use plastics.
The plastics industry believes that government does not do enough to ensure proper waste management in the country. The consumer blames plastic products for the pollution. Government thinks the responsibility lies with the plastic producer. Unfortunately, behaviour needs to change, but without the necessary infrastructure, there is no incentive to change.
Moving towards a circular economy
supports the vision of a circular economy and is committed to ensuring that plastics do not end up in the environment.
As the industry body, we believe that the solution to marine plastic pollution is to create robust recovery systems, ensuring that valuable plastics packaging is recovered and doesn’t end up in our waterways.
Post-consumer recycled content creates demand in addition to supply. Neither of these actions come without investment, but the alternative scenario is one in which governments, brand owners and retailers crack down on the use of all plastic packaging.
Packaging is the first thing that consumers see and can influence their buying behaviour. Unsustainable packaging can make environmentally conscious consumers decide against even the most sustainable products.
The idea of increasing the use of other packaging material is not a sustainable solution and there is no guarantee that they will be recycled and will avoid ending up in the ocean as well.
How do we change the negative perception of plastics?
conducted a survey among ordinary South Africans using the AfricanPulse survey panel, an African Response online platform of almost 8 000 members. The sample was set at 400 although the realized sample was 609.
Based on the aim to gain an understanding of the drivers behind the negative perceptions of plastics and the plastics industry, this survey investigated, across SA, the extent and depth of perceptions held, whether positive or negative.
The results were segmented into five segments. These segments or behaviour groups represent a
broad overview of the perceptions held by the public at large.
PR Companies interpreted the results of the perception survey and pitched their PR campaigns aimed at changing the public’s perception of plastics.
The time is now
For a long time plastics have been the scapegoat. It is time for the plastics industry to be more pro-active, to determine the public agenda, take part in public debates and form public opinion on plastics - as the material of the future.
It is imperative that we engage government if we are to succeed. Let us resume our position as a critical role player in society and in the government space.
I am not saying that it will be easy, but it will definitely be worth it!
Thank you to the team for your
contribution and hard work. Let us explore the
concept of the circular economy in the South African
context and develop an all-inclusive and collective
circular economy strategic plan for the industry.
Berhard Mahl
Chairperson Board
Executive Director’s message
‘Every cloud has a silver lining’.
This proverb usually applies when encouraging someone facing difficulty, and who is unable to see any positive way forward. This is true for the current worldwide pressure on plastics too. With the world’s negative focus on single use plastics and marine litter, Industry has been forced to be proactive and look at things differently, with Design for Recycling becoming an integral part of manufacturing. It has also resulted in more successful collaboration across the value chain as brand owners, retailers and governments seek new technologies to solve industry challenges and change behavior as we collectively address the global marine litter tragedy.
This also fits in with our industry’s need to facilitate a circular economy, closing the loop through reuse and recycling and ensuring a restorative and regenerative economy where the value of plastic is not lost by being thrown away. This will assist in economic growth, jobs and a more sustainable environment for South Africa. We are proud to report that for the seventh year running, plastics recycling in South Africa has continued
to grow, with more than 334 727 tons recycled back into raw material.
This gives South Africa an input recycling rate of 43.7% - well above that of
Europe’s recycling rate that currently sits at 31.1%.
South Africa is doing phenomenally well with its recycling, and I believe the latest results show that we are slowly but steadily beating the odds.
Plastics recycling provided an income to more than 58 100 workers in 2017. This figure includes self-employed waste pickers, employees of smaller entrepreneurial collectors and formal jobs in the recycling factories. Through the procurement of
recyclables, an estimated R 448 million was injected into the economy at primary sourcing level.
Packaging and Paper Industry Waste Management Plan
The National Department of Environmental Affairs (DEA) issued the Section 28 Call for Industry Waste Management Plans on 6th December 2017. In response, a consolidated multi-stream Industry Waste Management Plan for the paper and packaging sector based on the Extended Producer Responsibility Model was submitted to the DEA and we await their response.
Thanks to the team for your hard work and dedication. This was definitely one of the most difficult years for the plastics industry and perhaps the country as well, due to the technical recession that our economy currently faces.
Thanks to the Board members for your guidance and our industry partners for your continued support and financial contribution.
There are still many success stories, despite the challenges! Let’s not lose focus,
let’s stay positive and pro-active in an ever-changing environment. I hereby present
our Annual Review 2017/18.
Anton Hanekom
Executive Director
7A N N U A L R E V I E W 2 0 1 7 | 2 0 1 86 A N N U A L R E V I E W 2 0 1 7 | 2 0 1 8
South Africa
is doing
phenomenally
well with its
recycling, and
I believe the
latest results
show that we
are slowly
but steadily
beating the
odds.
Anton HanekomExecutive Director

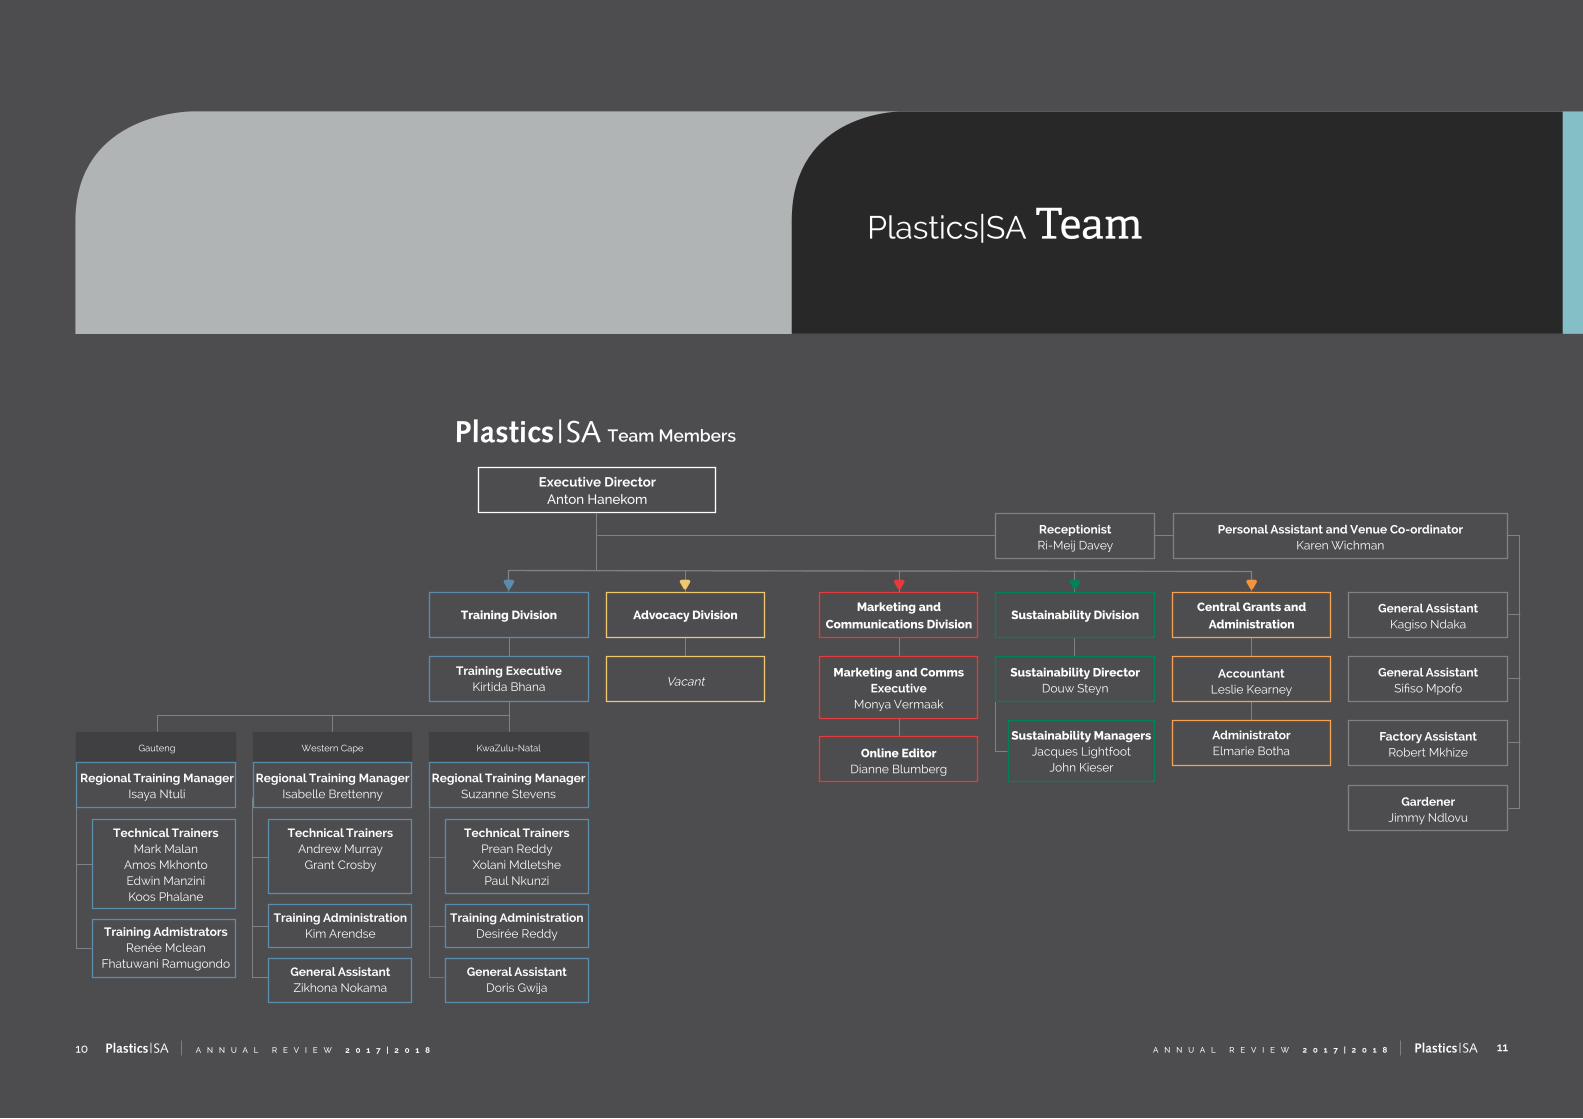
Plastics|SA Team
Plastics|SA Team
A N N U A L R E V I E W 2 0 1 7 | 2 0 1 88 A N N U A L R E V I E W 2 0 1 7 | 2 0 1 8
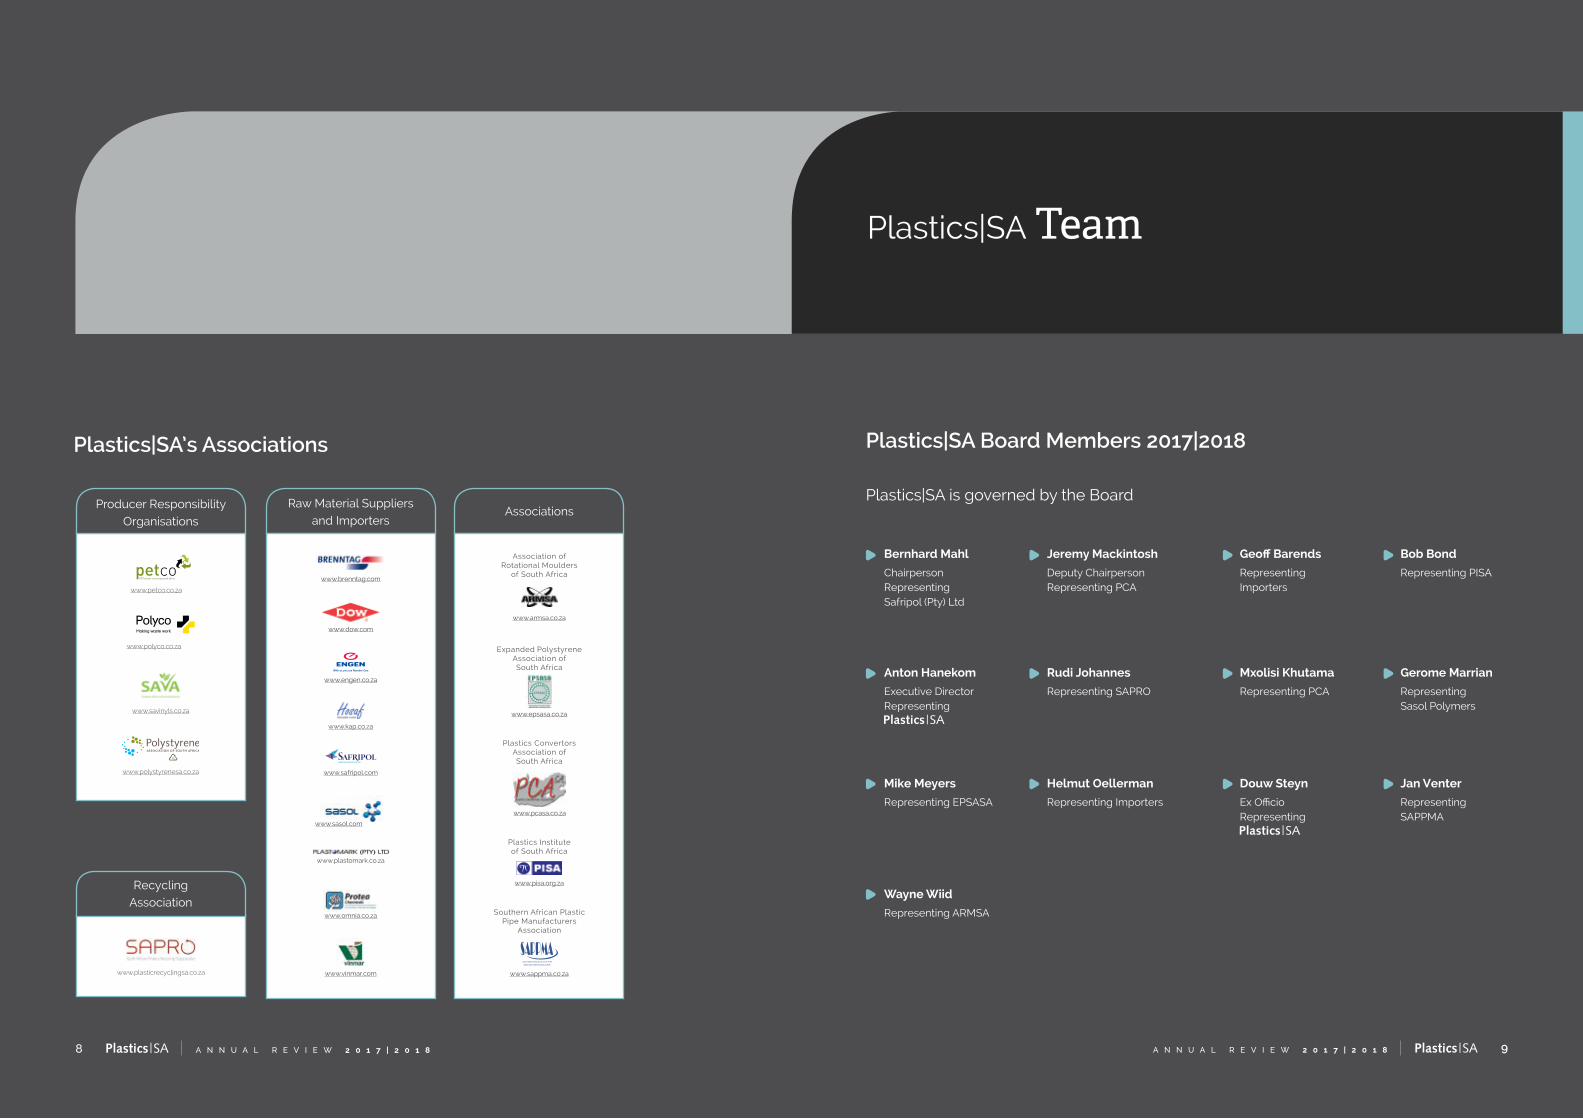
Plastics|SA Board Members 2017|2018
Plastics|SA is governed by the Board
Plastics|SA’s Associations
Producer Responsibility Organisations
www.savinyls.co.za
www.petco.co.za
www.polyco.co.za
www.polystyrenesa.co.za
Wayne Wiid
Representing ARMSA
Bernhard Mahl
ChairpersonRepresentingSafripol (Pty) Ltd
Jeremy Mackintosh
Deputy ChairpersonRepresenting PCA
Geoff Barends
Representing Importers
Bob Bond
Representing PISA
Anton Hanekom
Executive DirectorRepresenting
Rudi Johannes
Representing SAPRO
Mxolisi Khutama
Representing PCA
Gerome Marrian
Representing Sasol Polymers
Mike Meyers
Representing EPSASA
Helmut Oellerman
Representing Importers
Douw Steyn
Ex OfficioRepresenting
Jan Venter
Representing SAPPMA
9
Raw Material Suppliers and Importers
www.kap.co.za
www.omnia.co.za
www.plastomark.co.za
www.vinmar.com
www.engen.co.za
www.sasol.com
www.dow.com
www.safripol.com
www.brenntag.com
Associations
Association of Rotational Moulders
of South Africa
www.armsa.co.za
Southern African Plastic Pipe Manufacturers
Association
SOUTHERN AFRICAN PLASTIC PIPEMANUFACTURERS ASSOCIATION
www.sappma.co.za
Expanded Polystyrene Association of South Africa
www.epsasa.co.za
Plastics Institute of South Africa
www.pisa.org.za
www.pcasa.co.za
Plastics Convertors Association of South Africa
www.plasticrecyclingsa.co.za
Recycling Association
Plastics|SA Team
11A N N U A L R E V I E W 2 0 1 7 | 2 0 1 810 A N N U A L R E V I E W 2 0 1 7 | 2 0 1 8
Training Division
Training ExecutiveKirtida Bhana
Advocacy Division
Vacant
Sustainability Division
Sustainability DirectorDouw Steyn
Sustainability ManagersJacques Lightfoot
John Kieser
Central Grants and
Administration
AccountantLeslie Kearney
AdministratorElmarie Botha
Marketing and
Communications Division
Marketing and Comms Executive
Monya Vermaak
Online EditorDianne Blumberg
Executive DirectorAnton Hanekom
ReceptionistRi-Meij Davey
Personal Assistant and Venue Co-ordinatorKaren Wichman
General AssistantKagiso Ndaka
General AssistantSifiso Mpofo
Factory AssistantRobert Mkhize
GardenerJimmy Ndlovu
Regional Training ManagerSuzanne Stevens
Technical TrainersPrean Reddy
Xolani MdletshePaul Nkunzi
Training AdministrationDesirée Reddy
General AssistantDoris Gwija
Regional Training ManagerIsabelle Brettenny
Technical TrainersAndrew Murray
Grant Crosby
Training AdministrationKim Arendse
General AssistantZikhona Nokama
Regional Training ManagerIsaya Ntuli
Technical TrainersMark Malan
Amos MkhontoEdwin ManziniKoos Phalane
Training AdmistratorsRenée Mclean
Fhatuwani Ramugondo
Team Members
KwaZulu-NatalWestern CapeGauteng

Advocacy
Advocacy
13A N N U A L R E V I E W 2 0 1 7 | 2 0 1 812 A N N U A L R E V I E W 2 0 1 7 | 2 0 1 8
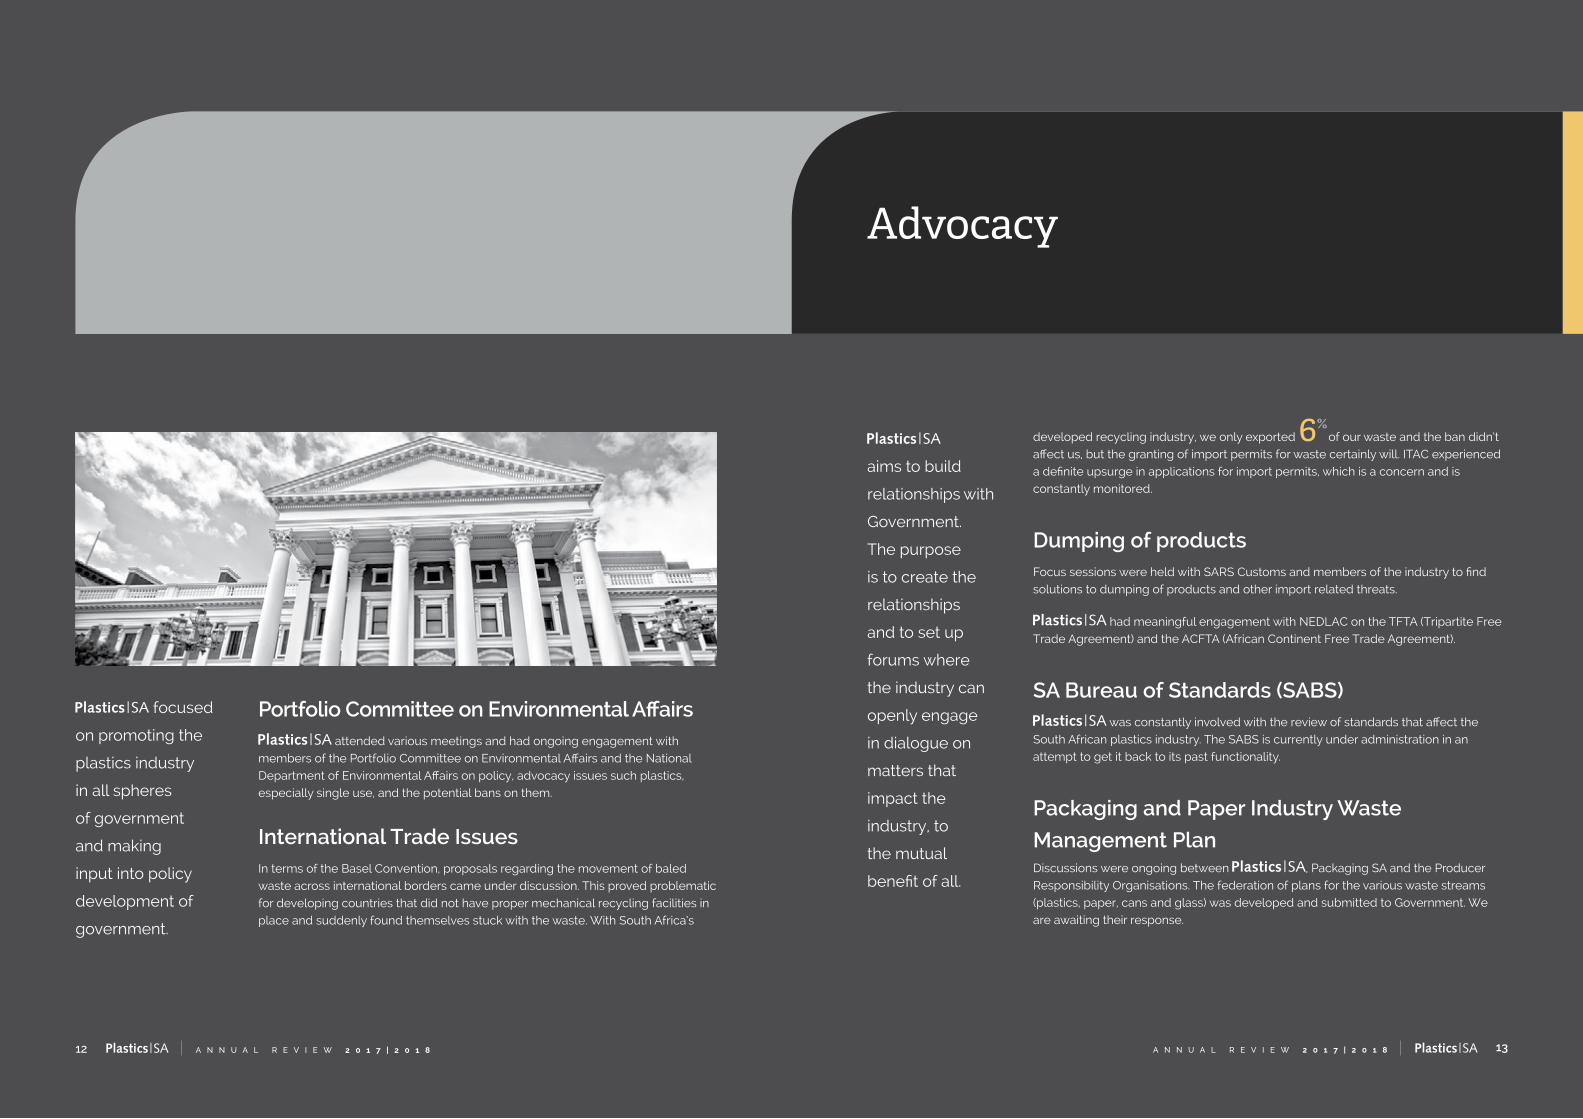
Portfolio Committee on Environmental Affairs attended various meetings and had ongoing engagement with
members of the Portfolio Committee on Environmental Affairs and the National Department of Environmental Affairs on policy, advocacy issues such plastics, especially single use, and the potential bans on them.
International Trade IssuesIn terms of the Basel Convention, proposals regarding the movement of baled waste across international borders came under discussion. This proved problematic for developing countries that did not have proper mechanical recycling facilities in place and suddenly found themselves stuck with the waste. With South Africa’s
focused
on promoting the
plastics industry
in all spheres
of government
and making
input into policy
development of
government.
developed recycling industry, we only exported 6%of our waste and the ban didn’t
affect us, but the granting of import permits for waste certainly will. ITAC experienced a definite upsurge in applications for import permits, which is a concern and is constantly monitored.
Dumping of productsFocus sessions were held with SARS Customs and members of the industry to find solutions to dumping of products and other import related threats.
had meaningful engagement with NEDLAC on the TFTA (Tripartite Free Trade Agreement) and the ACFTA (African Continent Free Trade Agreement).
SA Bureau of Standards (SABS) was constantly involved with the review of standards that affect the
South African plastics industry. The SABS is currently under administration in an attempt to get it back to its past functionality.
Packaging and Paper Industry Waste
Management PlanDiscussions were ongoing between , Packaging SA and the Producer Responsibility Organisations. The federation of plans for the various waste streams (plastics, paper, cans and glass) was developed and submitted to Government. We are awaiting their response.
aims to build
relationships with
Government.
The purpose
is to create the
relationships
and to set up
forums where
the industry can
openly engage
in dialogue on
matters that
impact the
industry, to
the mutual
benefit of all.
Advocacy
15A N N U A L R E V I E W 2 0 1 7 | 2 0 1 814 A N N U A L R E V I E W 2 0 1 7 | 2 0 1 8
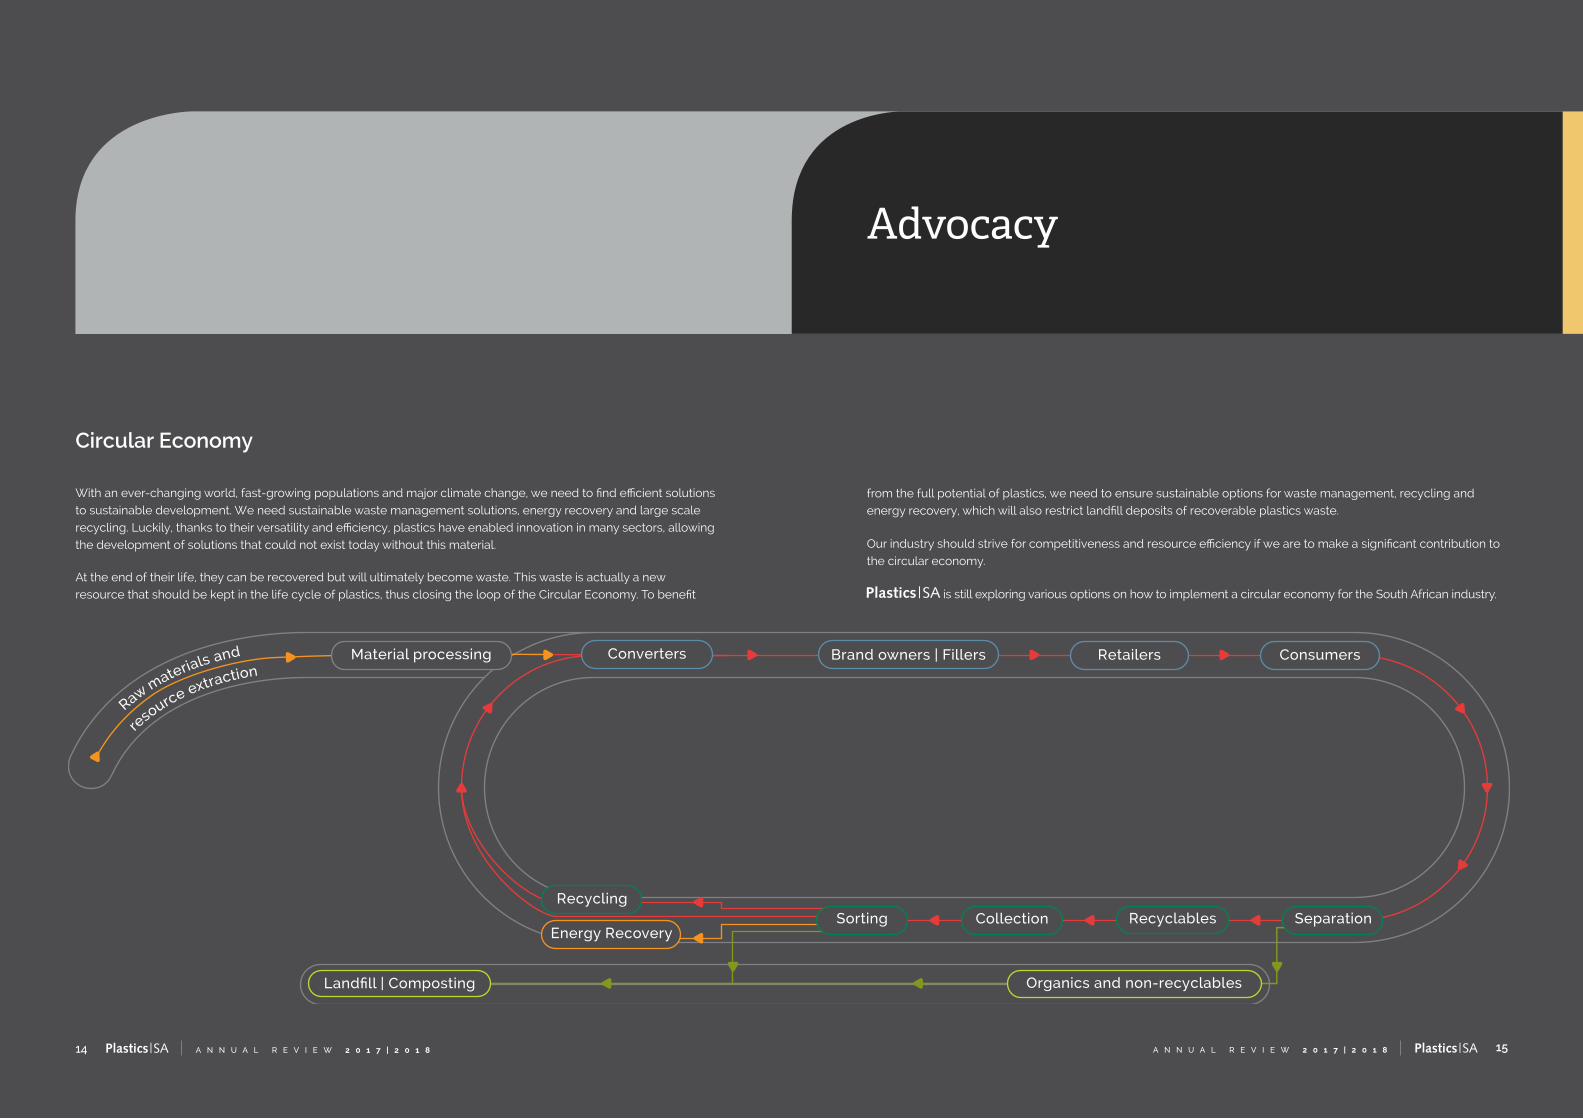
Circular Economy
With an ever-changing world, fast-growing populations and major climate change, we need to find efficient solutions to sustainable development. We need sustainable waste management solutions, energy recovery and large scale recycling. Luckily, thanks to their versatility and efficiency, plastics have enabled innovation in many sectors, allowing the development of solutions that could not exist today without this material.
At the end of their life, they can be recovered but will ultimately become waste. This waste is actually a new resource that should be kept in the life cycle of plastics, thus closing the loop of the Circular Economy. To benefit
from the full potential of plastics, we need to ensure sustainable options for waste management, recycling and energy recovery, which will also restrict landfill deposits of recoverable plastics waste.
Our industry should strive for competitiveness and resource efficiency if we are to make a significant contribution to the circular economy.
is still exploring various options on how to implement a circular economy for the South African industry.
re
source extraction
R
aw materials and Material processing Converters
RecyclingSorting
Brand owners | Fillers Retailers Consumers
Collection Recyclables SeparationEnergy Recovery
Organics and non-recyclablesLandfill | Composting

Marketing and Communications
Marketing and Communications
17A N N U A L R E V I E W 2 0 1 7 | 2 0 1 816 A N N U A L R E V I E W 2 0 1 7 | 2 0 1 8
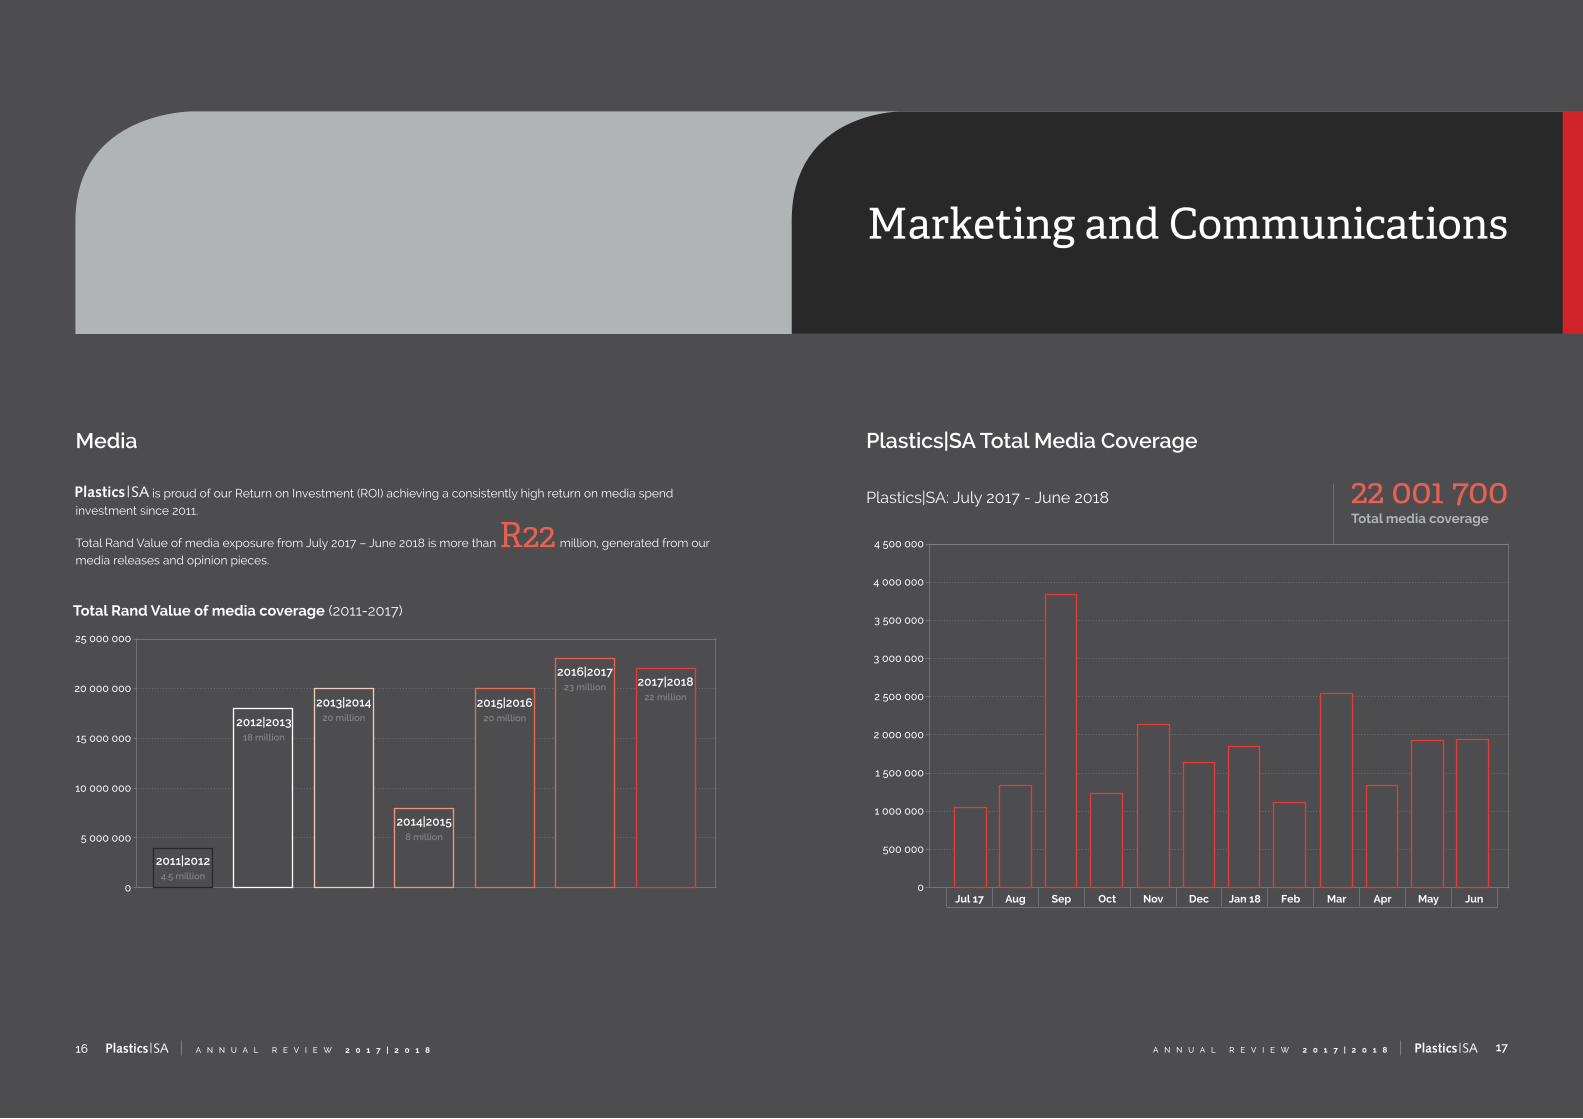
Media
is proud of our Return on Investment (ROI) achieving a consistently high return on media spend investment since 2011.
Total Rand Value of media exposure from July 2017 – June 2018 is more than R22 p.a million, generated from our media releases and opinion pieces.
Total Rand Value of media coverage (2011-2017)
25 000 000
20 000 000
15 000 000
10 000 000
5 000 000
0
4 500 000
4 000 000
3 500 000
3 000 000
2 500 000
2 000 000
1 500 000
1 000 000
500 000
0
2011|20124.5 million
2012|201318 million
2013|201420 million
2014|20158 million
2015|201620 million
2016|20172017|201823 million
22 million
Plastics|SA Total Media Coverage
Plastics|SA: July 2017 - June 2018
Jul 17 Aug Sep Oct Nov Dec Jan 18 Feb Mar Apr May Jun
22 001 700Total media coverage
Marketing and Communications
19A N N U A L R E V I E W 2 0 1 7 | 2 0 1 818 A N N U A L R E V I E W 2 0 1 7 | 2 0 1 8
1 200 000
1 000 000
800 000
600 000
400 000
200 000
0
1 600 000
1 400 000
1 200 000
1 000 000
800 000
600 000
400 000
200 000
0
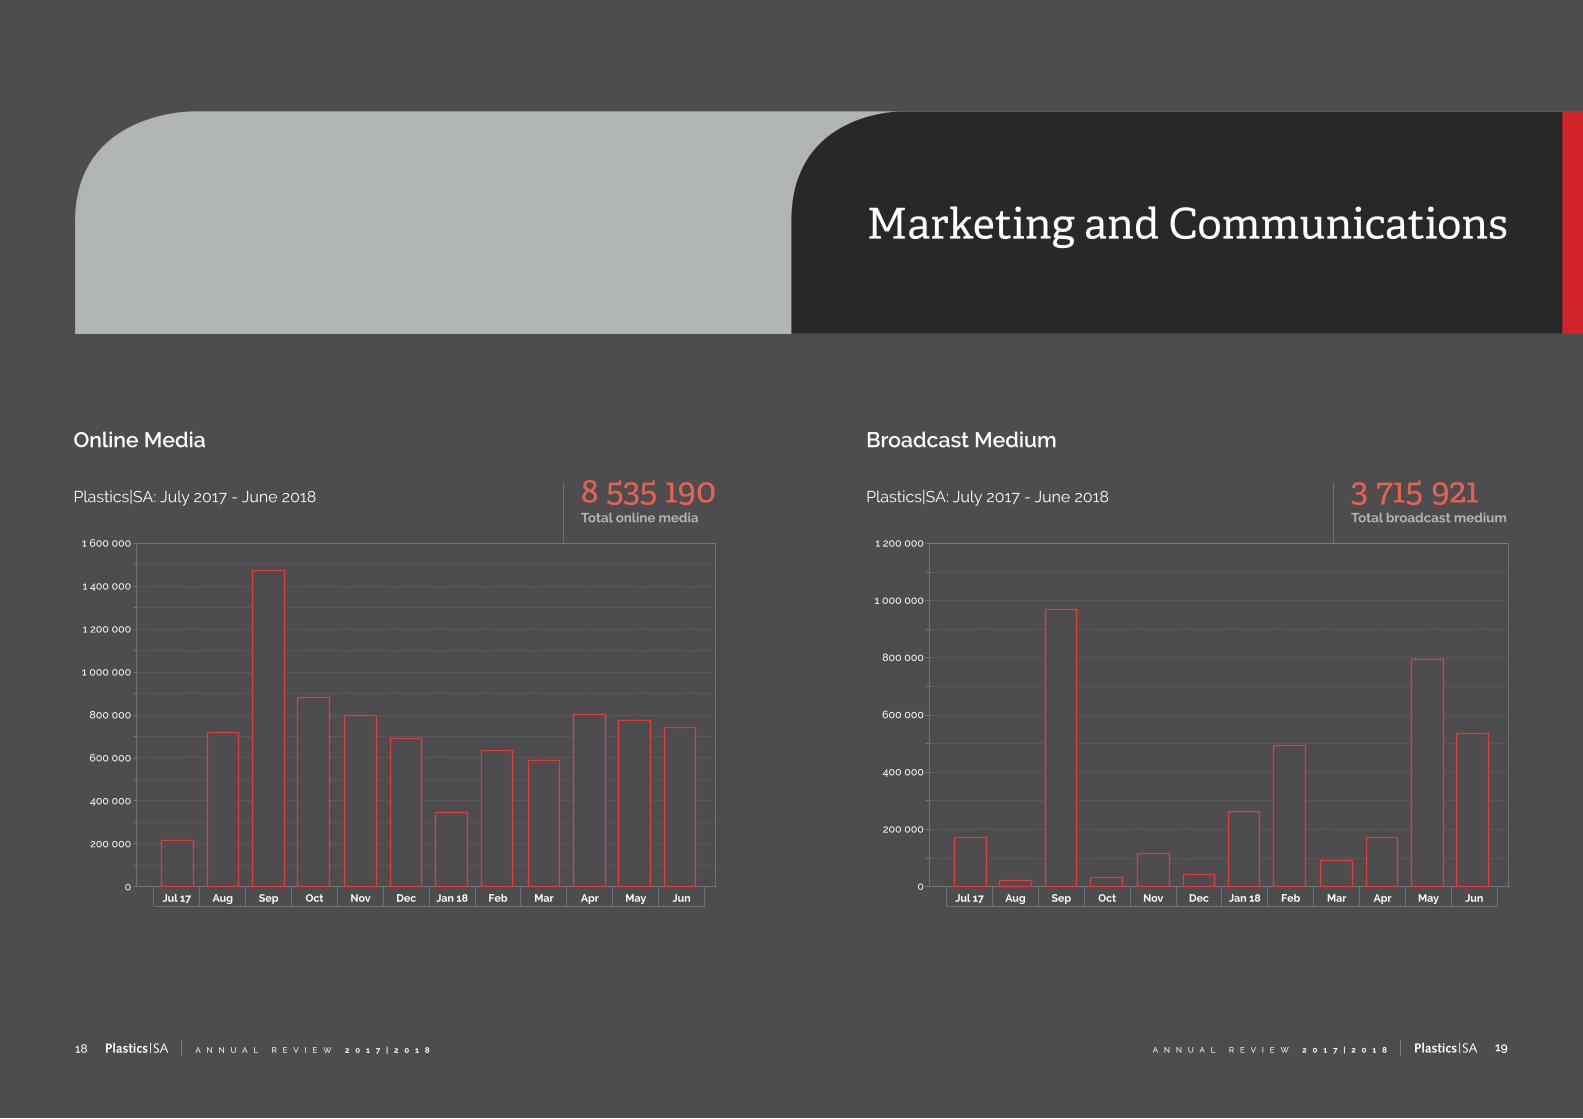
Broadcast Medium
Plastics|SA: July 2017 - June 2018
Online Media
Plastics|SA: July 2017 - June 2018
Jul 17 Aug Sep Oct Nov Dec Jan 18 Feb Mar Apr May JunJul 17 Aug Sep Oct Nov Dec Jan 18 Feb Mar Apr May Jun
3 715 921Total broadcast medium
8 535 190Total online media
Marketing and Communications
21A N N U A L R E V I E W 2 0 1 7 | 2 0 1 820 A N N U A L R E V I E W 2 0 1 7 | 2 0 1 8
2 000 000
1 800 000
1 600 000
1 400 000
1 200 000
1 000 000
800 000
600 000
400 000
200 000
0
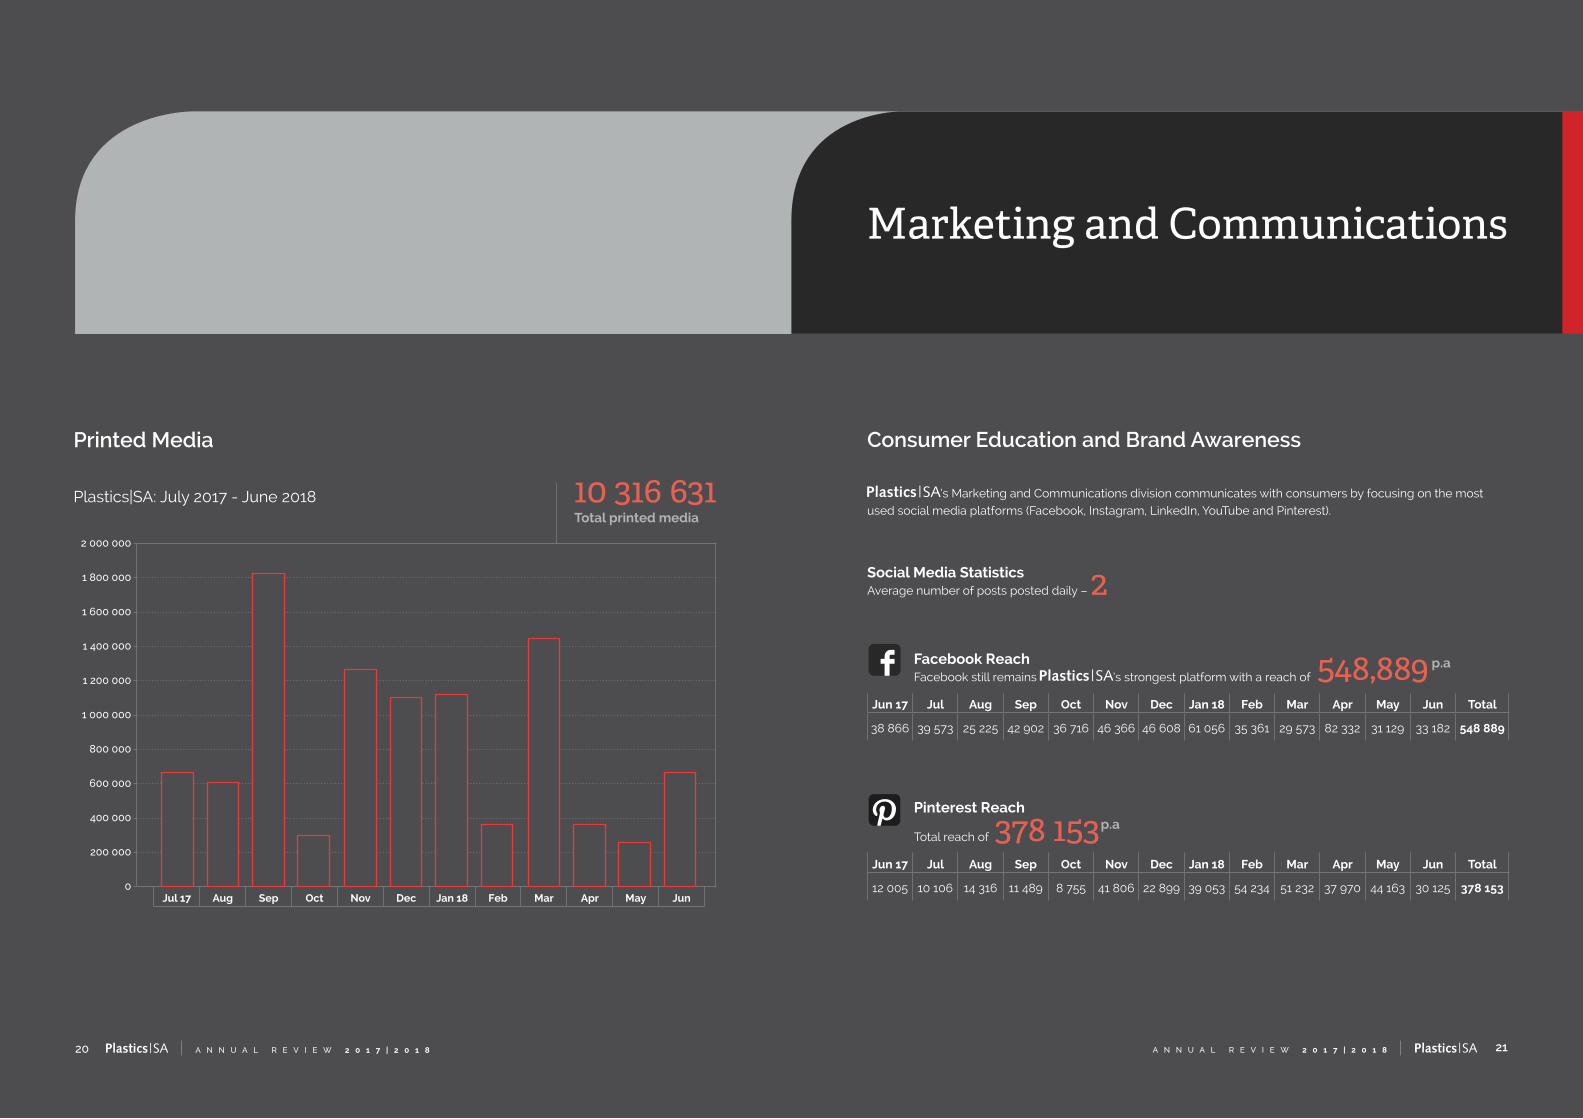
Printed Media
Plastics|SA: July 2017 - June 2018
Jul 17 Aug Sep Oct Nov Dec Jan 18 Feb Mar Apr May Jun
10 316 631Total printed media
Consumer Education and Brand Awareness
’s Marketing and Communications division communicates with consumers by focusing on the most used social media platforms (Facebook, Instagram, LinkedIn, YouTube and Pinterest).
Jun 17 Jul Aug Sep Oct Nov Dec Jan 18 Feb Mar Apr May Jun Total
12 005 10 106 14 316 11 489 8 755 41 806 22 899 39 053 54 234 51 232 37 970 44 163 30 125 378 153
Pinterest Reach
Total reach of 378 153 p.a
p.a
Jun 17 Jul Aug Sep Oct Nov Dec Jan 18 Feb Mar Apr May Jun Total
38 866 39 573 25 225 42 902 36 716 46 366 46 608 61 056 35 361 29 573 82 332 31 129 33 182 548 889
Facebook ReachFacebook still remains ’s strongest platform with a reach of 548,889 p.a
p.a
Social Media StatisticsAverage number of posts posted daily – 2
23A N N U A L R E V I E W 2 0 1 7 | 2 0 1 822 A N N U A L R E V I E W 2 0 1 7 | 2 0 1 8
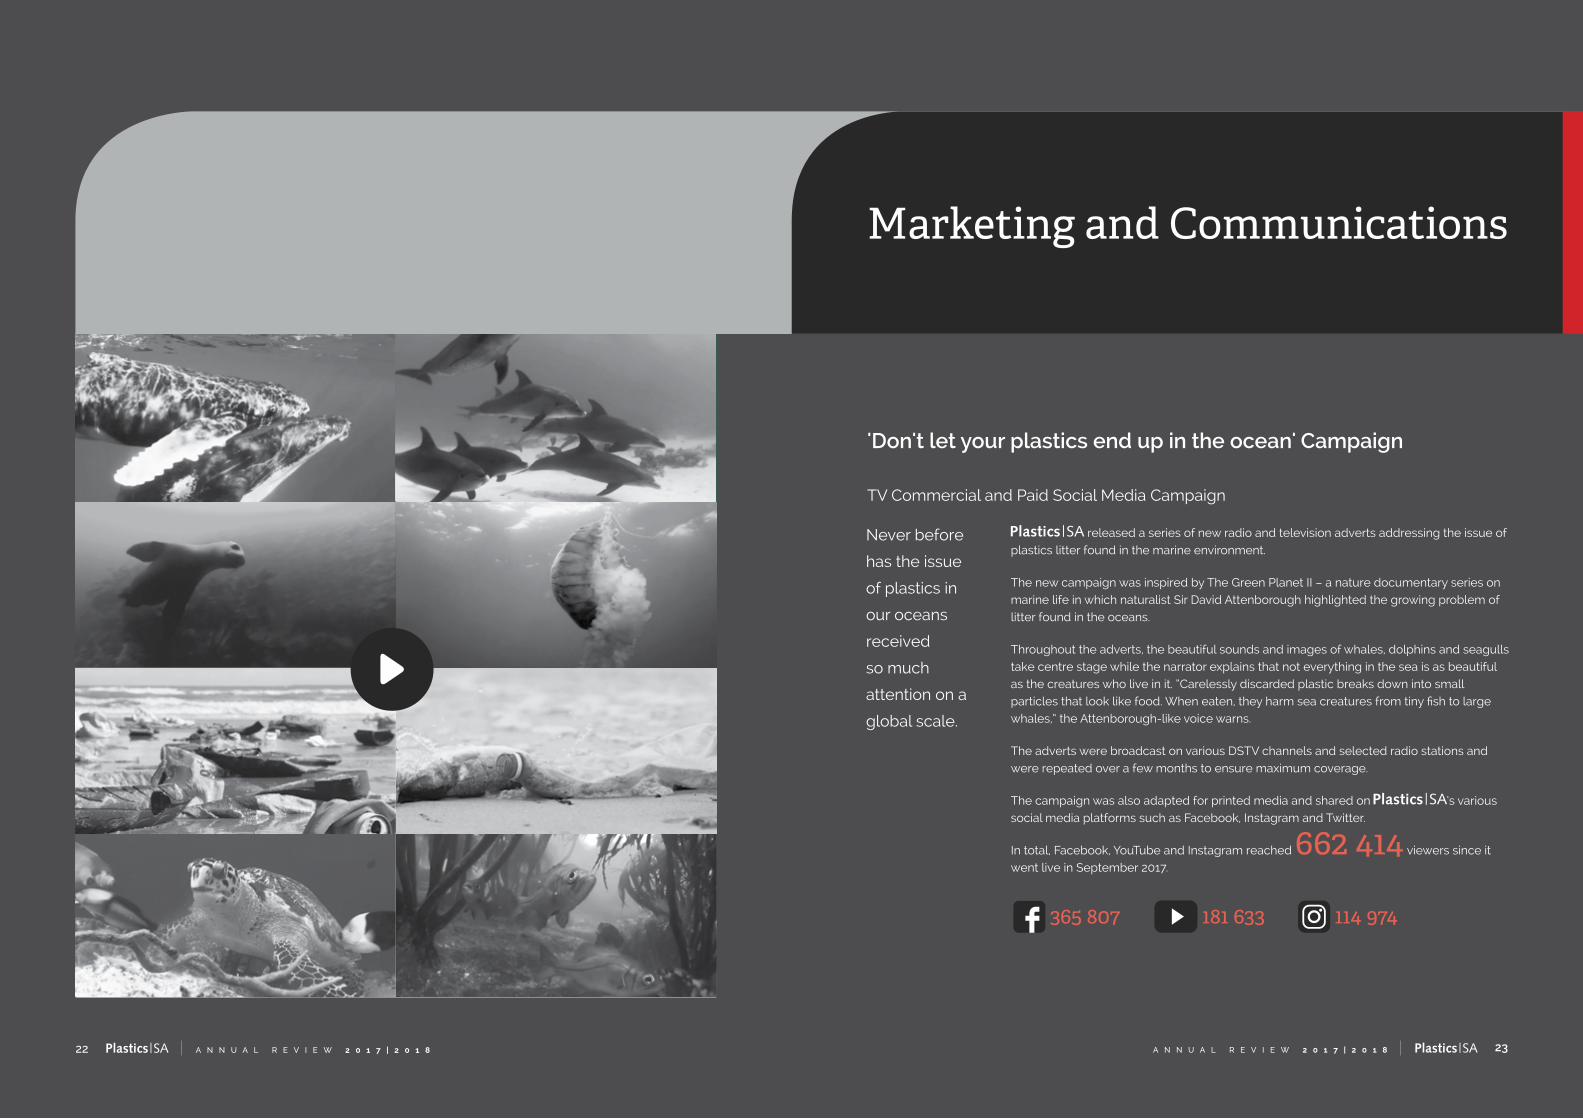
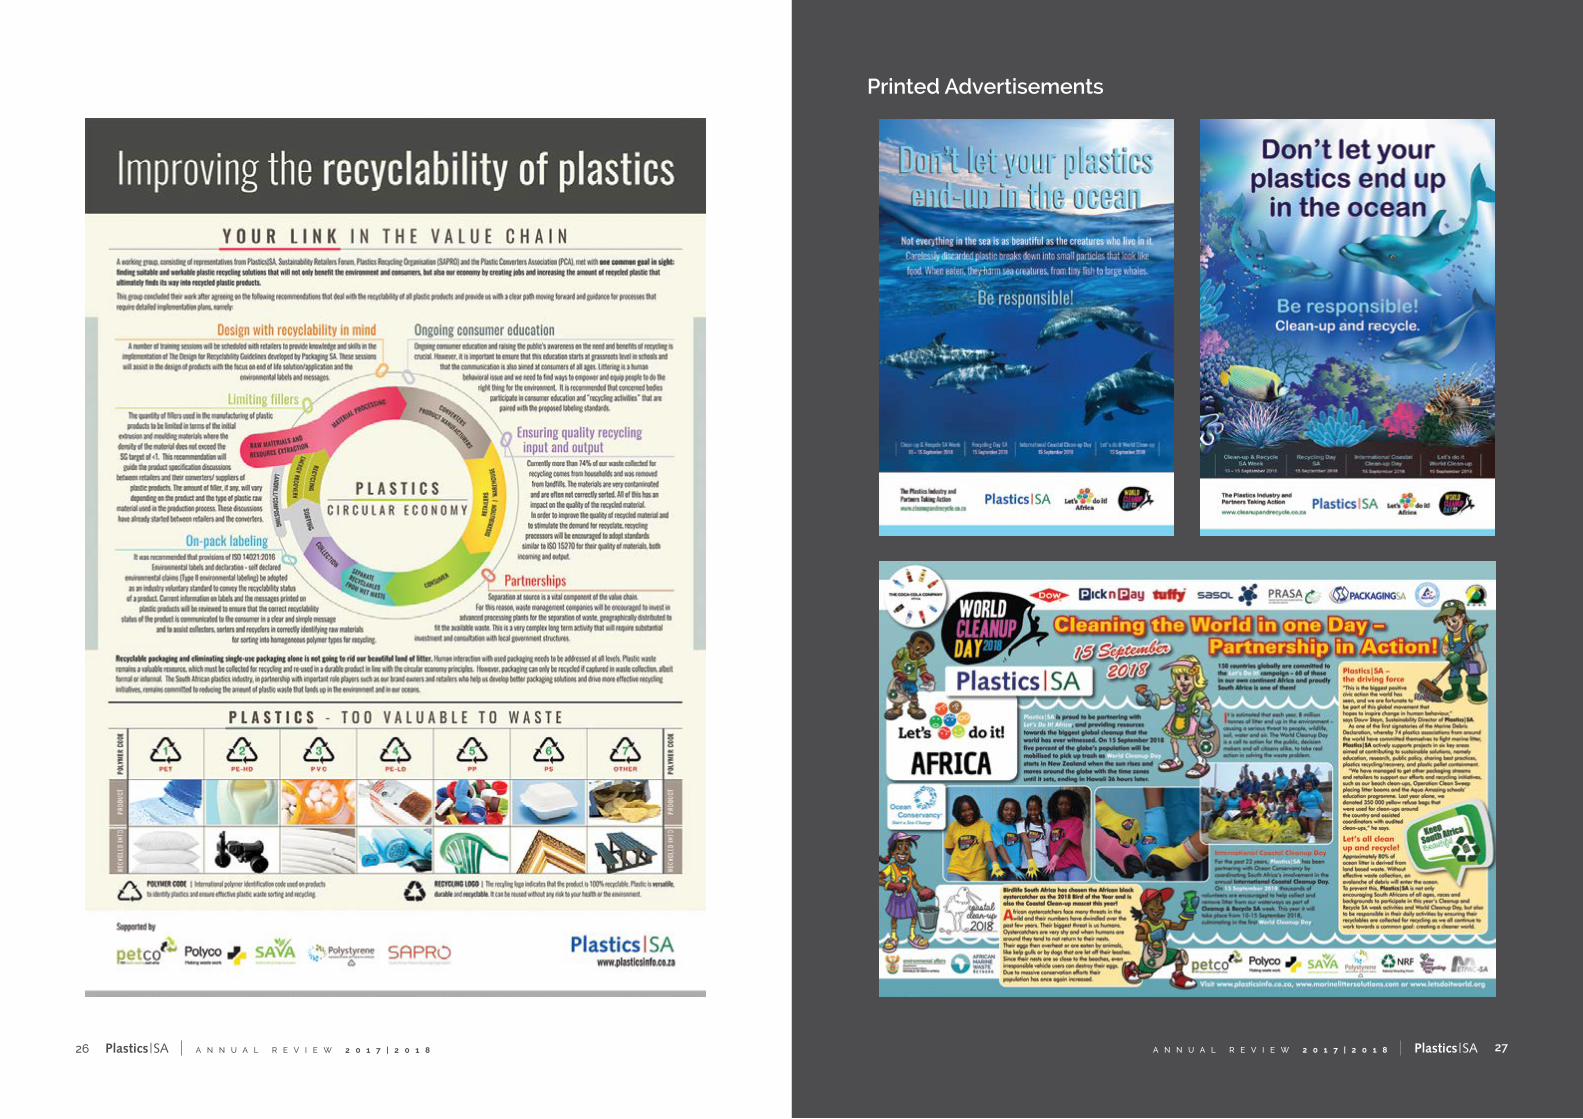
'Don't let your plastics end up in the ocean' Campaign
TV Commercial and Paid Social Media Campaign
released a series of new radio and television adverts addressing the issue of plastics litter found in the marine environment.
The new campaign was inspired by The Green Planet II – a nature documentary series on marine life in which naturalist Sir David Attenborough highlighted the growing problem of litter found in the oceans.
Throughout the adverts, the beautiful sounds and images of whales, dolphins and seagulls take centre stage while the narrator explains that not everything in the sea is as beautiful as the creatures who live in it. “Carelessly discarded plastic breaks down into small particles that look like food. When eaten, they harm sea creatures from tiny fish to large whales,” the Attenborough-like voice warns.
The adverts were broadcast on various DSTV channels and selected radio stations and were repeated over a few months to ensure maximum coverage.
The campaign was also adapted for printed media and shared on ’s various social media platforms such as Facebook, Instagram and Twitter.
In total, Facebook, YouTube and Instagram reached 662 414 viewers since it went live in September 2017.
365 807 181 633 114 974
Never before
has the issue
of plastics in
our oceans
received
so much
attention on a
global scale.
Marketing and Communications
Marketing and Communications
25A N N U A L R E V I E W 2 0 1 7 | 2 0 1 824 A N N U A L R E V I E W 2 0 1 7 | 2 0 1 8
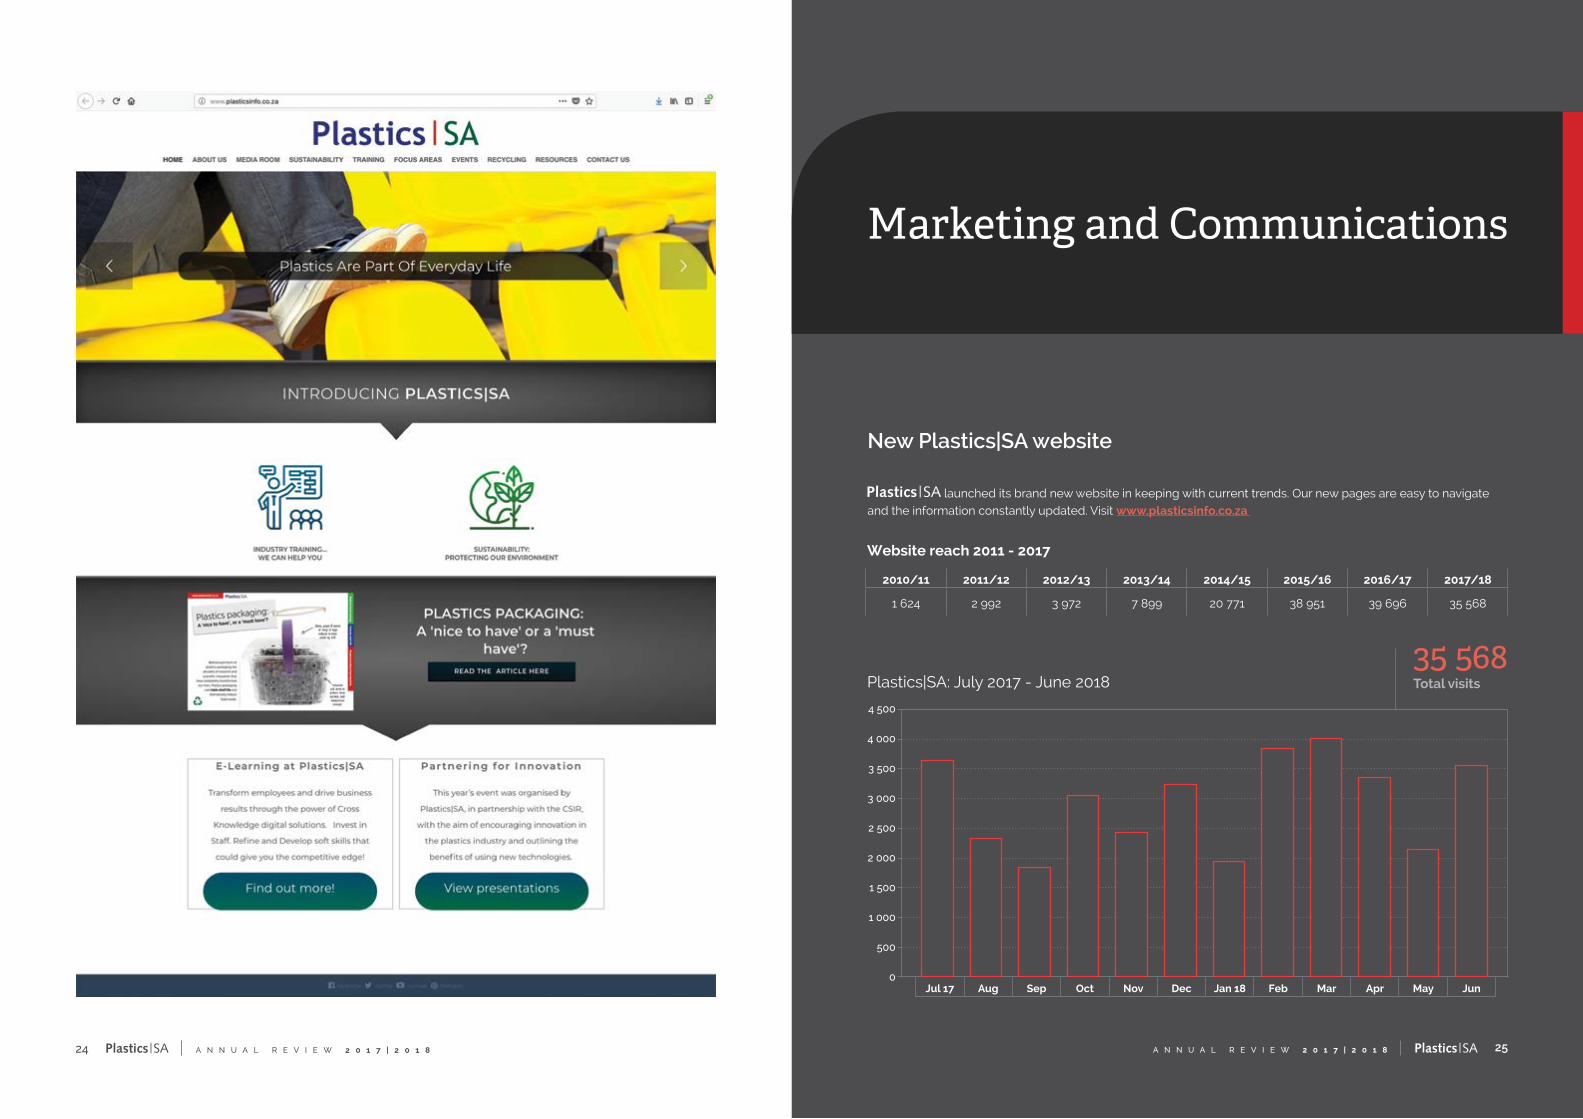
New Plastics|SA website
launched its brand new website in keeping with current trends. Our new pages are easy to navigate and the information constantly updated. Visit www.plasticsinfo.co.za
Website reach 2011 - 2017
2010/11 2011/12 2012/13 2013/14 2014/15 2015/16 2016/17 2017/18
1 624 2 992 3 972 7 899 20 771 38 951 39 696 35 568
4 500
4 000
3 500
3 000
2 500
2 000
1 500
1 000
500
0
Plastics|SA: July 2017 - June 2018
Jul 17 Aug Sep Oct Nov Dec Jan 18 Feb Mar Apr May Jun
35 568Total visits
27A N N U A L R E V I E W 2 0 1 7 | 2 0 1 826 A N N U A L R E V I E W 2 0 1 7 | 2 0 1 8
Printed Advertisements

29A N N U A L R E V I E W 2 0 1 7 | 2 0 1 828 A N N U A L R E V I E W 2 0 1 7 | 2 0 1 8
Press releases and Opinion Pieces
40 Press releases/opinion pieces were generated from July 2017 – June 2018
Marketing and Communications
Sustainability

Sustainability
31A N N U A L R E V I E W 2 0 1 7 | 2 0 1 830 A N N U A L R E V I E W 2 0 1 7 | 2 0 1 8
Plastics|SA Sustainability Advisory Board
Sustainability is one of the six core functions of .
The Sustainability Division, together with the Sustainability Advisory Board, provides strategic leadership to the industry on sustainability issues. This body determines the strategic direction of Sustainability activities ensuring that action plans are formulated for key issues affecting the plastics industry and the environment. Participation in global alliances is of the utmost importance and features high on the priority list of this Board.
The Sustainability Division works closely with the
Producer Responsibility Organisations,
The SA Plastics Recycling Organisation,
Retail Industry and specialist groups such as Packaging SA and the CSIR
who annually determine the programs and projects embarked on and the funding thereof.
Dr. Thommie Burger (CEO - Wildlife and Environment Society), Annabe Pretorius (Plastics 911 – Plastics Expert), Rowan Le Roux (Operations Manager- Polyoak Packaging), Shabeer Jhetam (CEO - Packaging SA), Cecilia Kinuthia-Njenga (UN Environment – Head, UN Environment Office in SA), Douw Steyn (Director Sustainability – Plastics SA), Prof. Linda Godfrey (Manager – Waste RDI Roadmap Implementation Unit - CSIR), Anton Hanekom (Executive Director – Plastics SA), Charles Muller (Tufflex).
Sustainability
33A N N U A L R E V I E W 2 0 1 7 | 2 0 1 832 A N N U A L R E V I E W 2 0 1 7 | 2 0 1 8
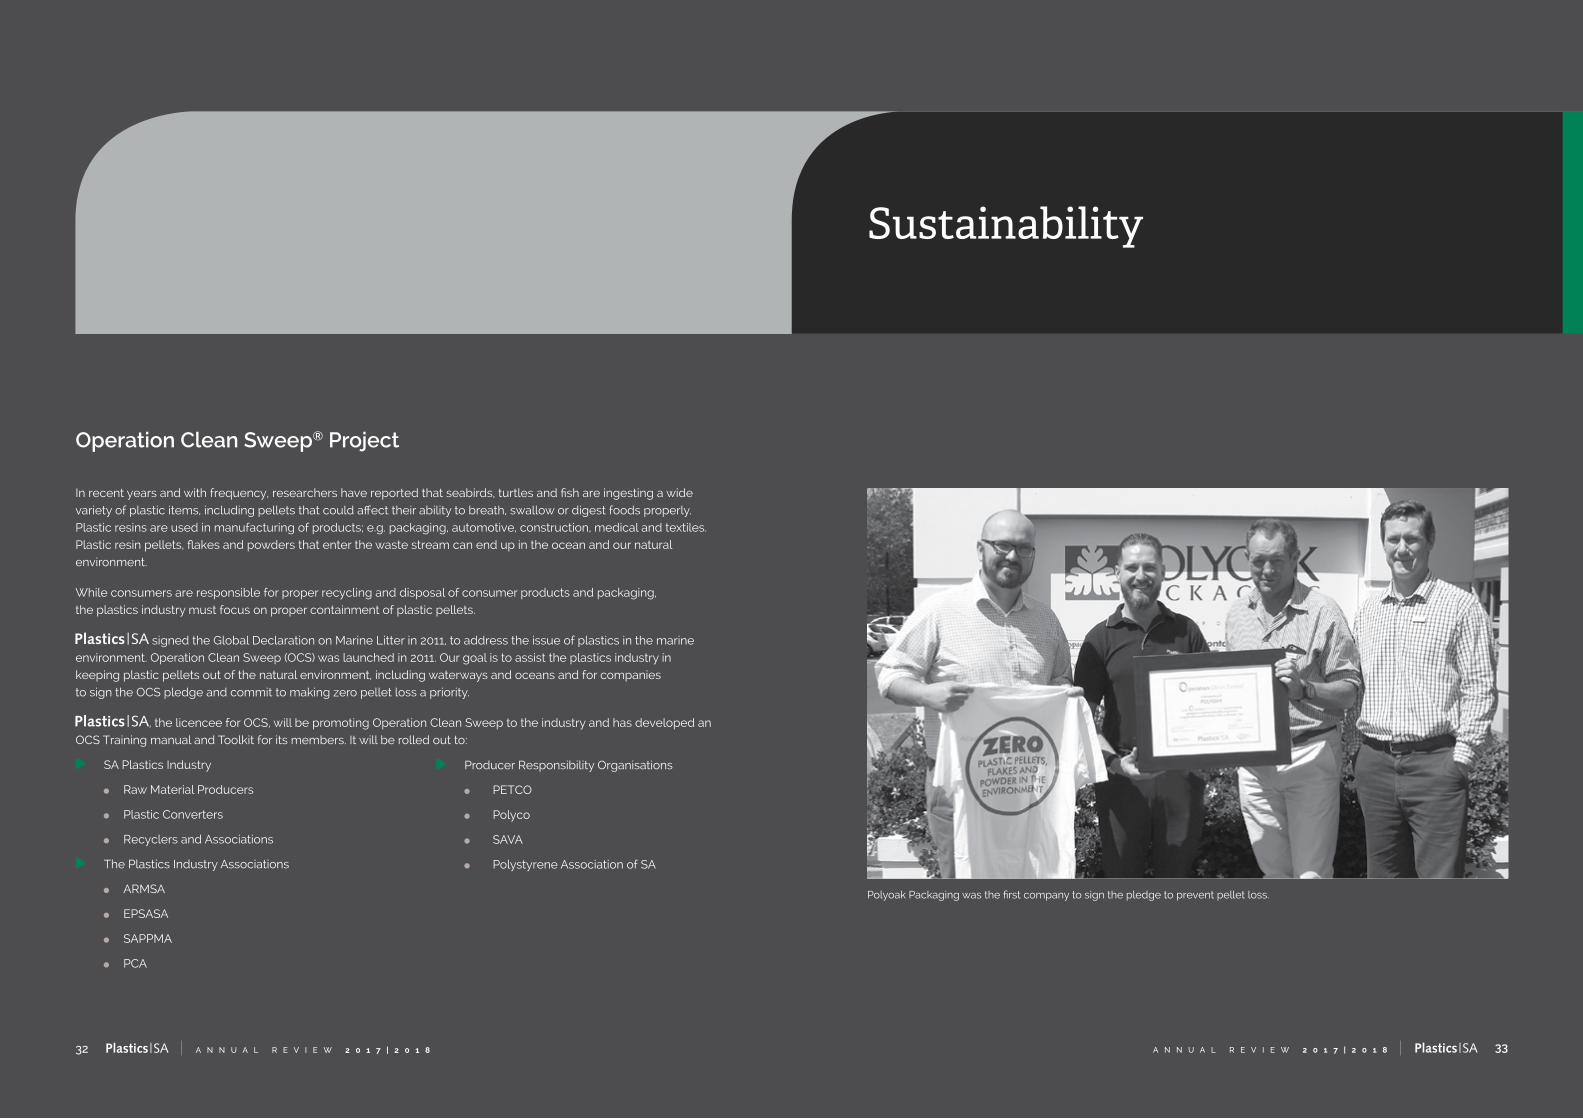
Operation Clean Sweep® Project
In recent years and with frequency, researchers have reported that seabirds, turtles and fish are ingesting a wide variety of plastic items, including pellets that could affect their ability to breath, swallow or digest foods properly. Plastic resins are used in manufacturing of products; e.g. packaging, automotive, construction, medical and textiles. Plastic resin pellets, flakes and powders that enter the waste stream can end up in the ocean and our natural environment.
While consumers are responsible for proper recycling and disposal of consumer products and packaging, the plastics industry must focus on proper containment of plastic pellets.
signed the Global Declaration on Marine Litter in 2011, to address the issue of plastics in the marine environment. Operation Clean Sweep (OCS) was launched in 2011. Our goal is to assist the plastics industry in keeping plastic pellets out of the natural environment, including waterways and oceans and for companies to sign the OCS pledge and commit to making zero pellet loss a priority.
, the licencee for OCS, will be promoting Operation Clean Sweep to the industry and has developed an OCS Training manual and Toolkit for its members. It will be rolled out to:
SA Plastics Industry
Raw Material Producers
Plastic Converters
Recyclers and Associations
The Plastics Industry Associations
ARMSA
EPSASA
SAPPMA
PCA
Producer Responsibility Organisations
PETCO
Polyco
SAVA
Polystyrene Association of SA
Polyoak Packaging was the first company to sign the pledge to prevent pellet loss.
35A N N U A L R E V I E W 2 0 1 7 | 2 0 1 834 A N N U A L R E V I E W 2 0 1 7 | 2 0 1 8
Sustainability
SA Bioplastics Forum
SA Bioplastics website
The SA Bioplastics website was launched in January 2018. Bioplastics are plastics derived from renewable biomass sources, such as vegetable fats and oils, starch or microbiota. Bioplastics provide new and forward-looking solutions for the plastics industry and are potential applications in all market segments. Some Bioplastics materials even offer new end-of-life options such as biodegradability, which can benefit certain products.
has established the ‘SA Bioplastics Forum’ to engage with Bioplastics industry players.
Visit www.sabioplastics.co.za
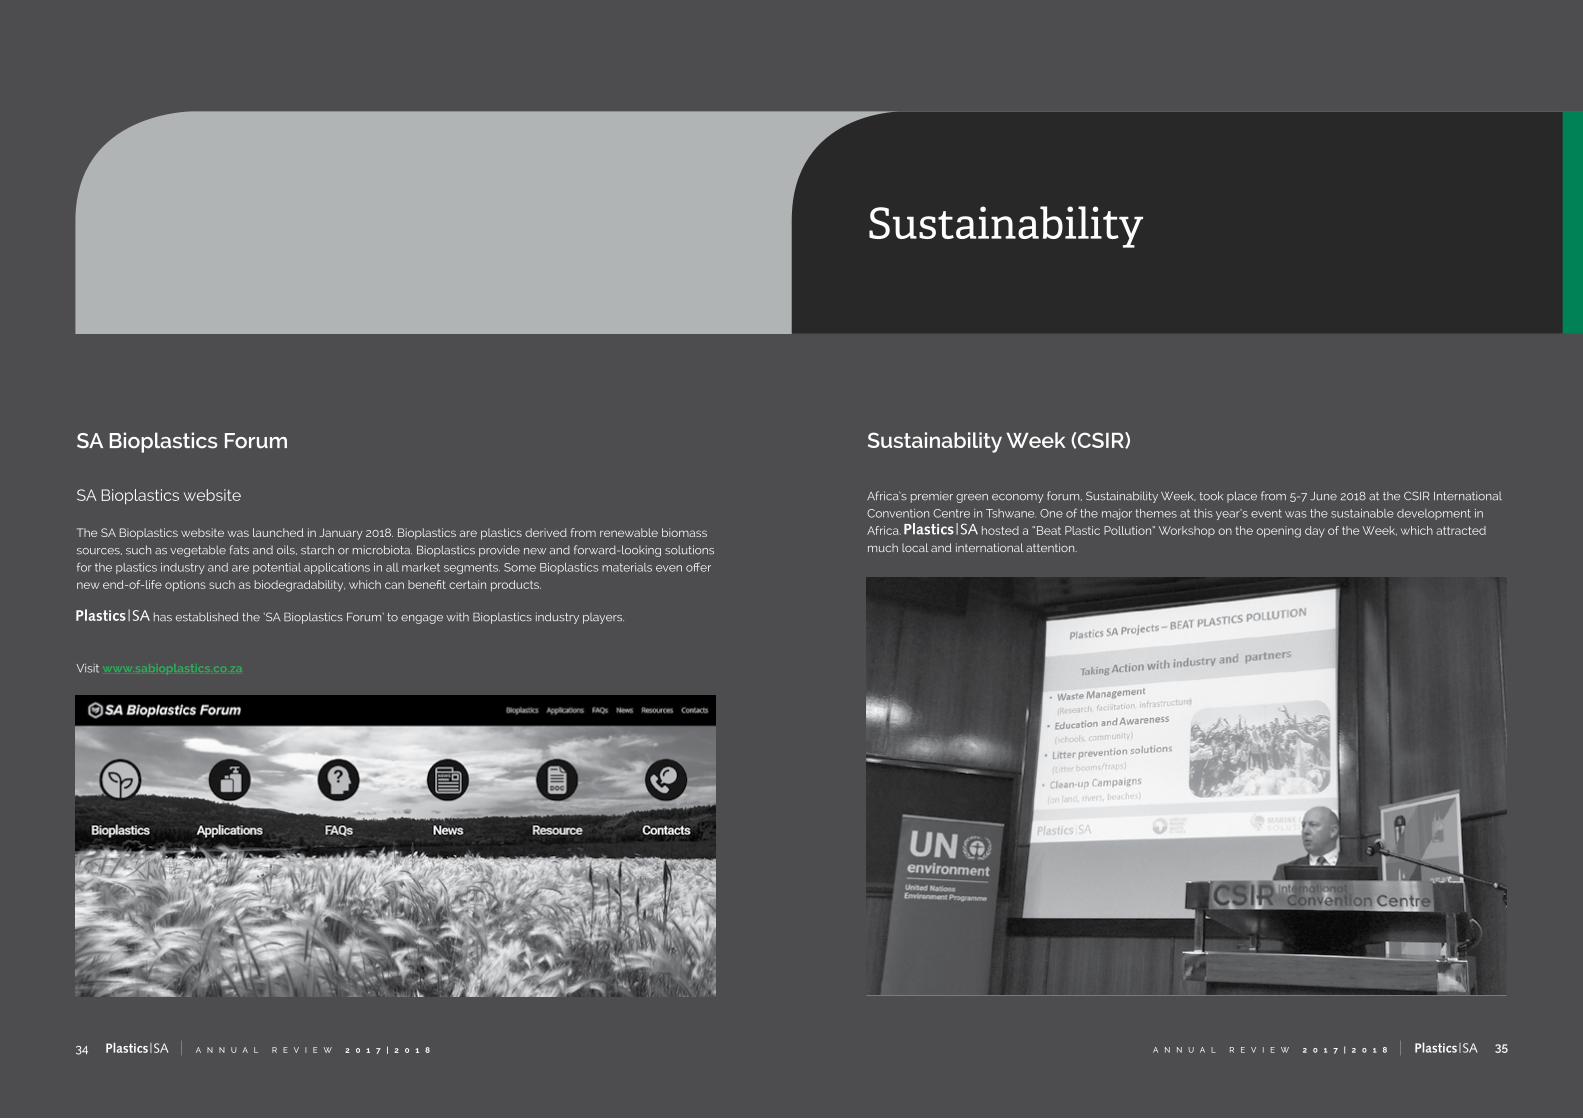
Sustainability Week (CSIR)
Africa’s premier green economy forum, Sustainability Week, took place from 5-7 June 2018 at the CSIR International Convention Centre in Tshwane. One of the major themes at this year’s event was the sustainable development in Africa. hosted a “Beat Plastic Pollution” Workshop on the opening day of the Week, which attracted much local and international attention.
37A N N U A L R E V I E W 2 0 1 7 | 2 0 1 836 A N N U A L R E V I E W 2 0 1 7 | 2 0 1 8
River Catchment Projects
Waste Management and Recycling
Special environmental days, such as Sustainability Week (5 – 7 June 2018), World Environment Day (5 June 2018), World Oceans Day (9 June) and Clean-up and Recycle SA Week help us to focus on the importance of individuals, governments, the public and private sector collaboration.
More than 80% of marine pollution and litter comes from land-based sources. There is a need to identify pathways of pollution, from land to sea, using a Source-to-Sea approach, and take necessary action. We aim to ensure that the public is educated on river and marine pollution and aware of the benefits of recycling plastics.
has identified four river catchment areas
eThekwini River Catchment (Durban Functional Region, KZN)
Zwartkops Estuary (Port Elizabeth, Eastern Cape)
Black River Catchment (Cape Town, Western Cape)
Sabie River Catchment (Hazyview), Mpumalanga.
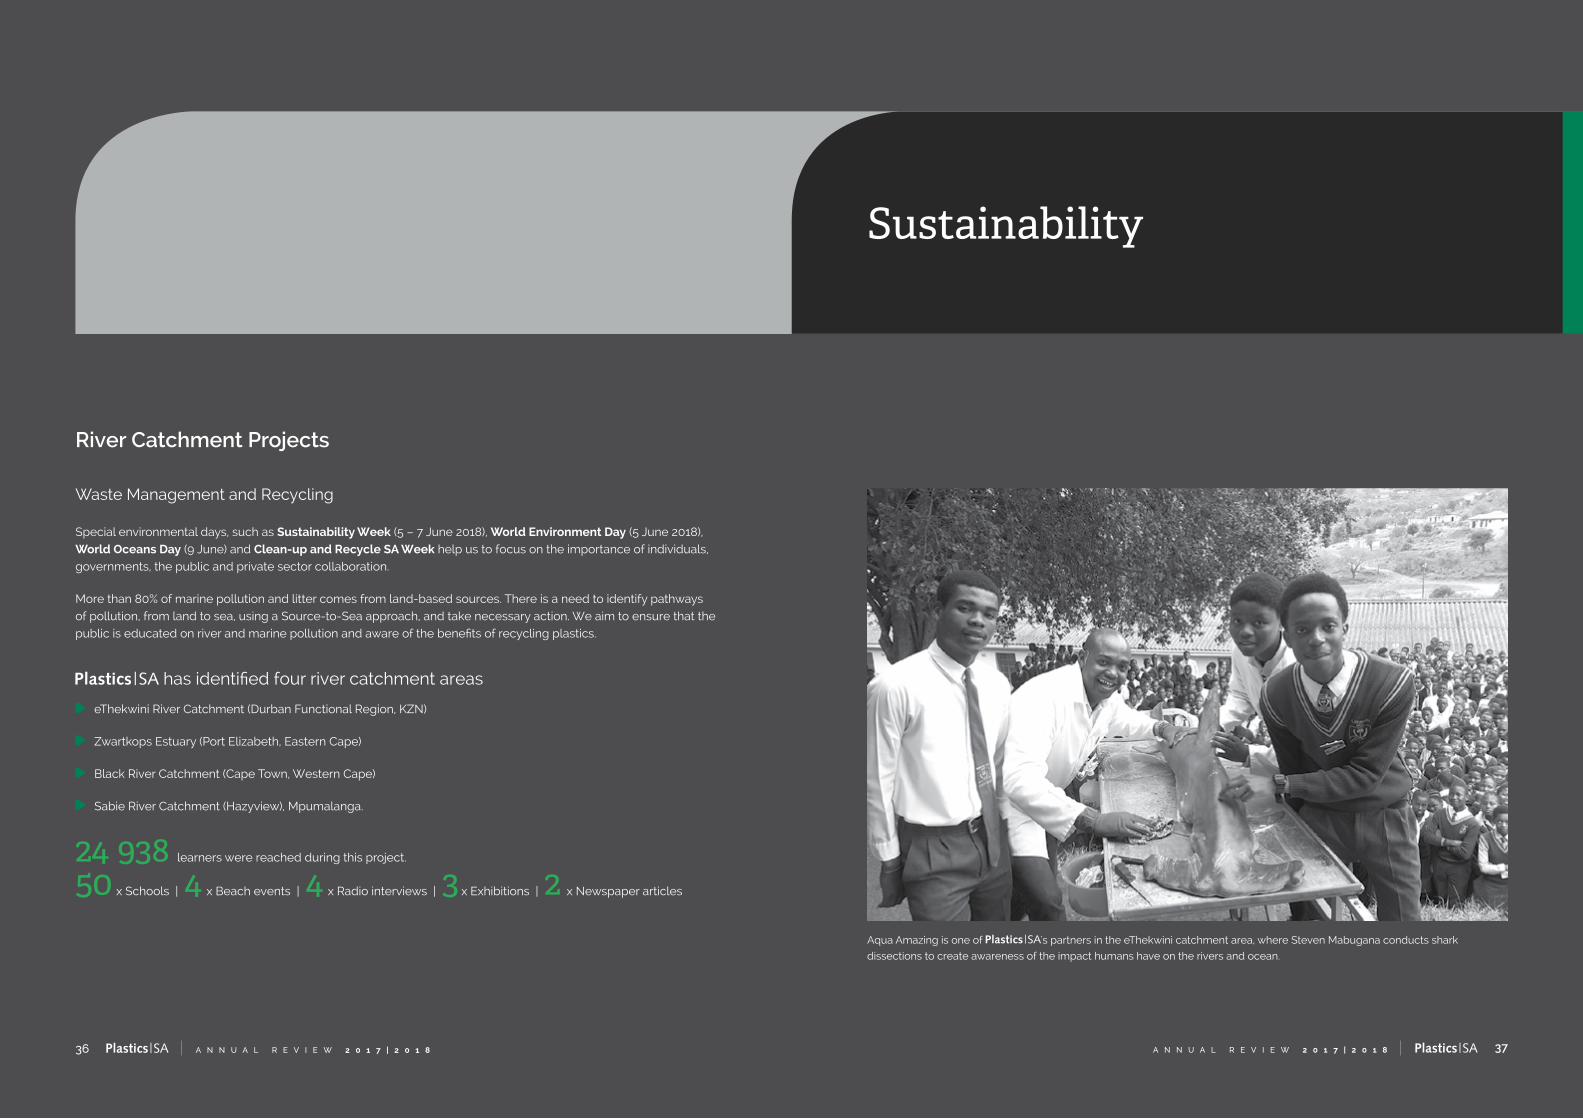
24 938 learners were reached during this project.
50 x Schools | 4 x Beach events | 4 x Radio interviews | 3 x Exhibitions | 2 x Newspaper articles
Sustainability
Aqua Amazing is one of 's partners in the eThekwini catchment area, where Steven Mabugana conducts shark
dissections to create awareness of the impact humans have on the rivers and ocean.

39A N N U A L R E V I E W 2 0 1 7 | 2 0 1 838 A N N U A L R E V I E W 2 0 1 7 | 2 0 1 8
Sustainability
Litter Booms to prevent plastic pollution
joined forces with environmentalists north of Durban, to fight ocean pollution, by installing a litter boom at the Umhlanga Lagoon. The boom was designed to trap litter and prevent it from entering the ocean and was launched in celebration of World Oceans Day in June 2018.
The aim is to reduce the amount of litter that washes into the sea from the Ohlanga River. The litter boom floats on the surface of the water and acts as a trap that prevents all the floating litter from washing down into the estuary and into the sea. It then allows for that litter to be collected at one point. The device does not pose a risk to any species found in the lagoon. A similar boom has also recently been launched at the Black River in Cape Town as part of the Kader Asmal Integrated Catchment Management Project. Funds raised from the collection of the waste are used to purchase polywood furniture for local schools and to improve the facilities of the local communities.
Fishing line bins
, the Dyer Island Conservation Trust and the Wildlife and Environmental Society of Southern Africa (WESSA) joined hands in helping to reduce marine debris. With funding from DPI Plastics and the South African Plastics Pipe Manufacturers Association (SAPPMA), we are building a nationwide network of monofilament recycling locations to make proper disposal of fishing line more accessible.

41A N N U A L R E V I E W 2 0 1 7 | 2 0 1 840 A N N U A L R E V I E W 2 0 1 7 | 2 0 1 8
Sustainability
Education and training
educated society about the benefits of recycling and its effect on the environment and initiated plastics awareness and educational programs with specific focus areas, target audiences and projects.
2017 Sasol Techno X Exhibition
Took place in Sasolburg in August 2017 and attracted more than 19 000 visitors. and AquaAmazing teamed up to highlight the value of plastics and why they should be recycled. This message was conveyed through shark dissection displays where the learners got up close and personal with sharks as Steven Mabugana told them why their litter should not end up in the stomachs of our sea creatures.
Mpumalanga Municipal Councillors learn more about recycling
40 municipal councillors of the 18 municipalities of the Mpumalanga Province received in-depth training into the recycling of packaging material at a 2-day workshop arranged by Packaging SA and hosted by in November.
This workshop was a joint initiative of the South African Local Government Association (SALGA) and the Departments of Agriculture, Rural Development, Land and Environmental Affairs (DARDLEA) and Environmental Affairs (DEA) and was an excellent example of the first fruits being reaped after a concerted effort to improve public-private partnerships.
43A N N U A L R E V I E W 2 0 1 7 | 2 0 1 842 A N N U A L R E V I E W 2 0 1 7 | 2 0 1 8
Sustainability
Recycling Training
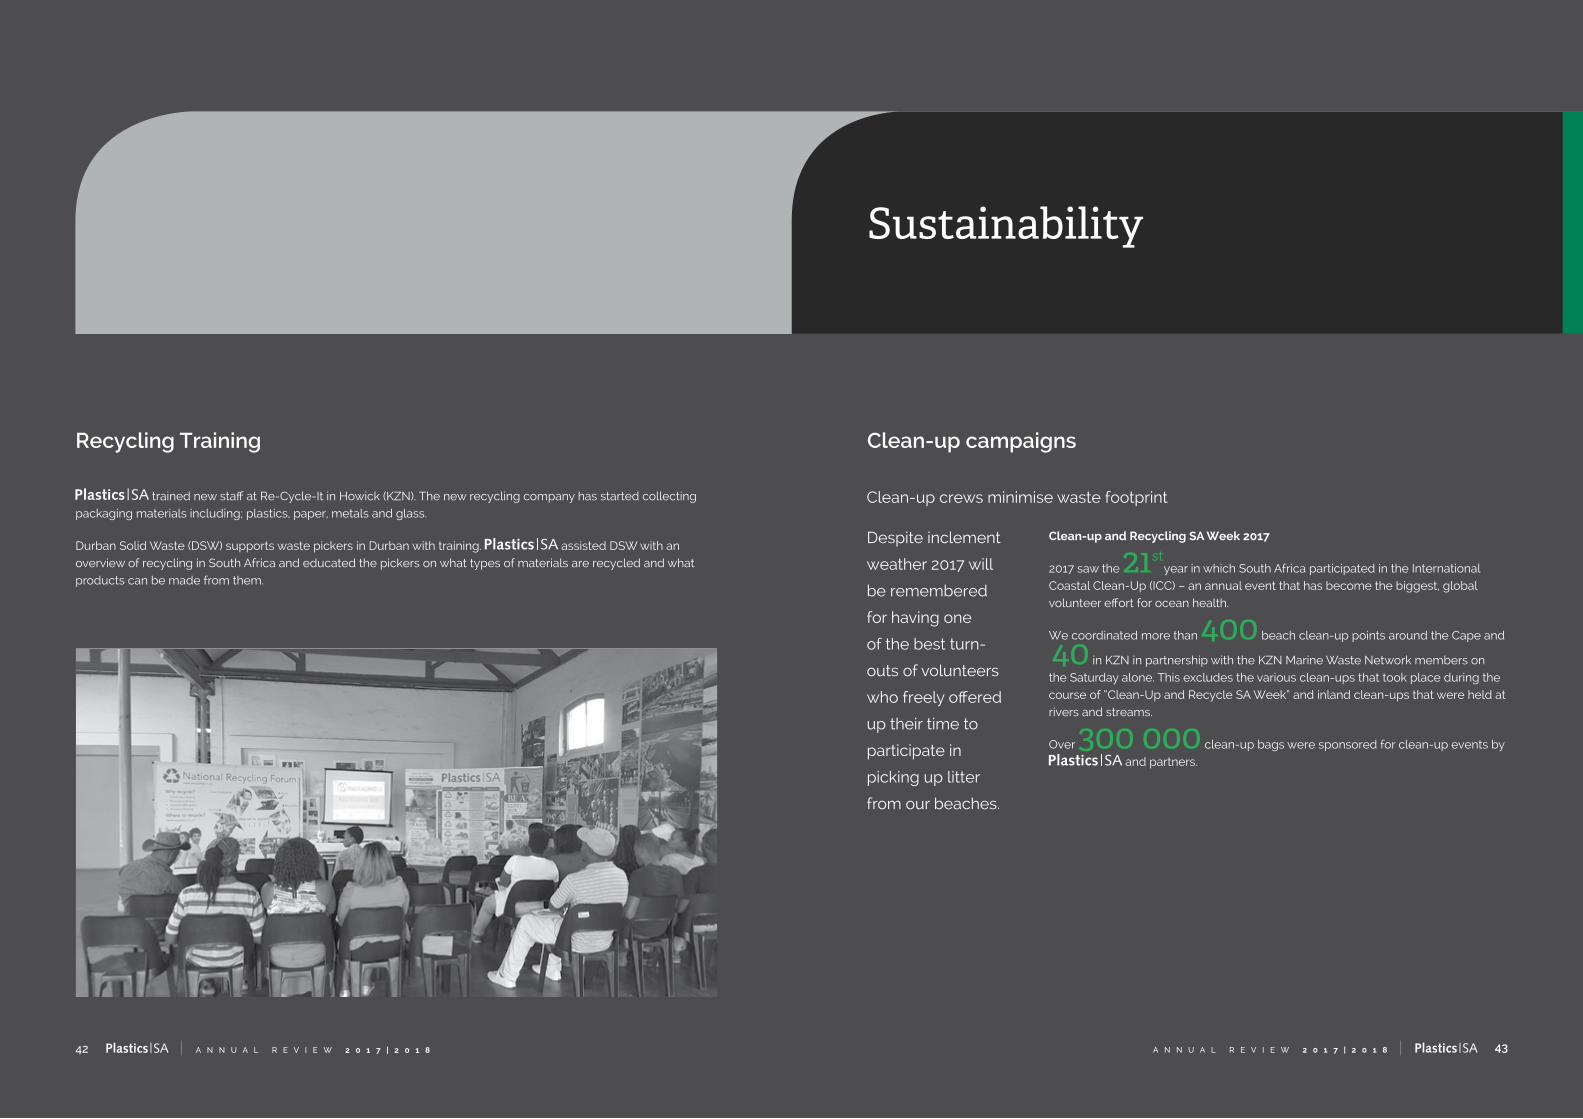
trained new staff at Re-Cycle-It in Howick (KZN). The new recycling company has started collecting packaging materials including; plastics, paper, metals and glass.
Durban Solid Waste (DSW) supports waste pickers in Durban with training. assisted DSW with an overview of recycling in South Africa and educated the pickers on what types of materials are recycled and what products can be made from them.
Clean-up campaigns
Clean-up and Recycling SA Week 2017
2017 saw the 21styear in which South Africa participated in the International
Coastal Clean-Up (ICC) – an annual event that has become the biggest, global volunteer effort for ocean health.
We coordinated more than 400 beach clean-up points around the Cape and
40 in KZN in partnership with the KZN Marine Waste Network members on the Saturday alone. This excludes the various clean-ups that took place during the course of “Clean-Up and Recycle SA Week” and inland clean-ups that were held at rivers and streams.
Over 300 000 clean-up bags were sponsored for clean-up events by and partners.
Clean-up crews minimise waste footprint
Despite inclement
weather 2017 will
be remembered
for having one
of the best turn-
outs of volunteers
who freely offered
up their time to
participate in
picking up litter
from our beaches.
45A N N U A L R E V I E W 2 0 1 7 | 2 0 1 844 A N N U A L R E V I E W 2 0 1 7 | 2 0 1 8
Sustainability
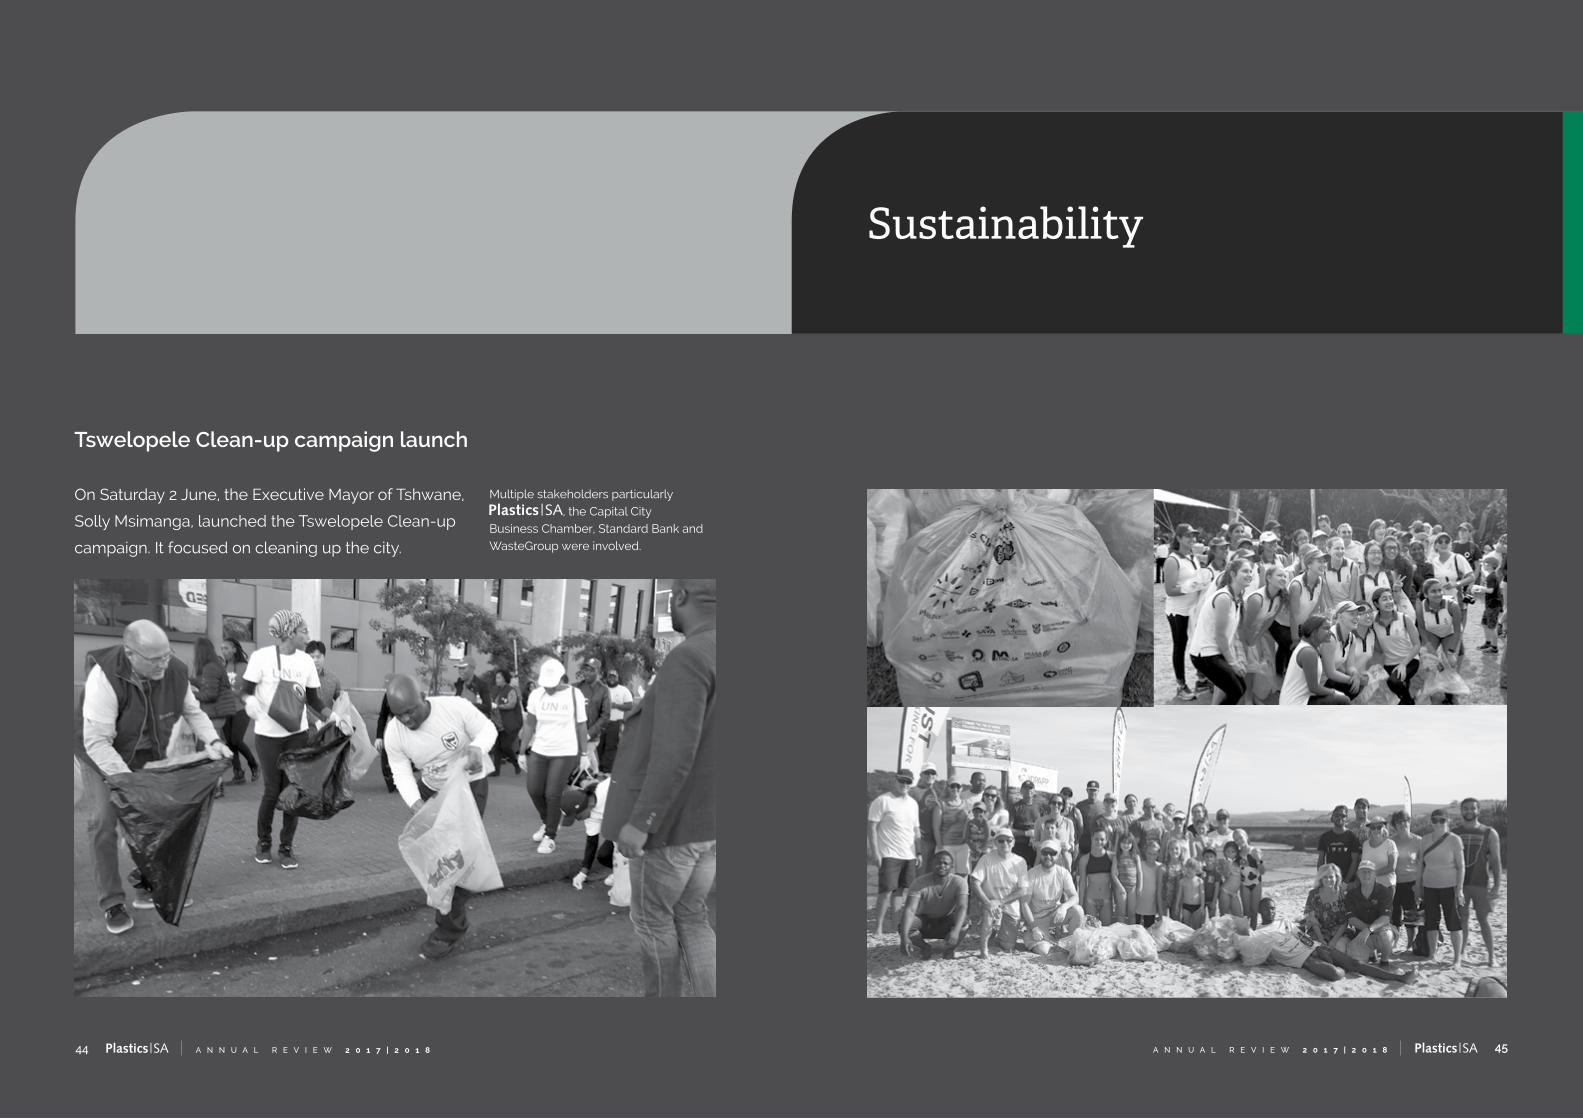
Tswelopele Clean-up campaign launch
Multiple stakeholders particularly , the Capital City
Business Chamber, Standard Bank and WasteGroup were involved.
On Saturday 2 June, the Executive Mayor of Tshwane,
Solly Msimanga, launched the Tswelopele Clean-up
campaign. It focused on cleaning up the city.
47A N N U A L R E V I E W 2 0 1 7 | 2 0 1 846 A N N U A L R E V I E W 2 0 1 7 | 2 0 1 8
Sustainability
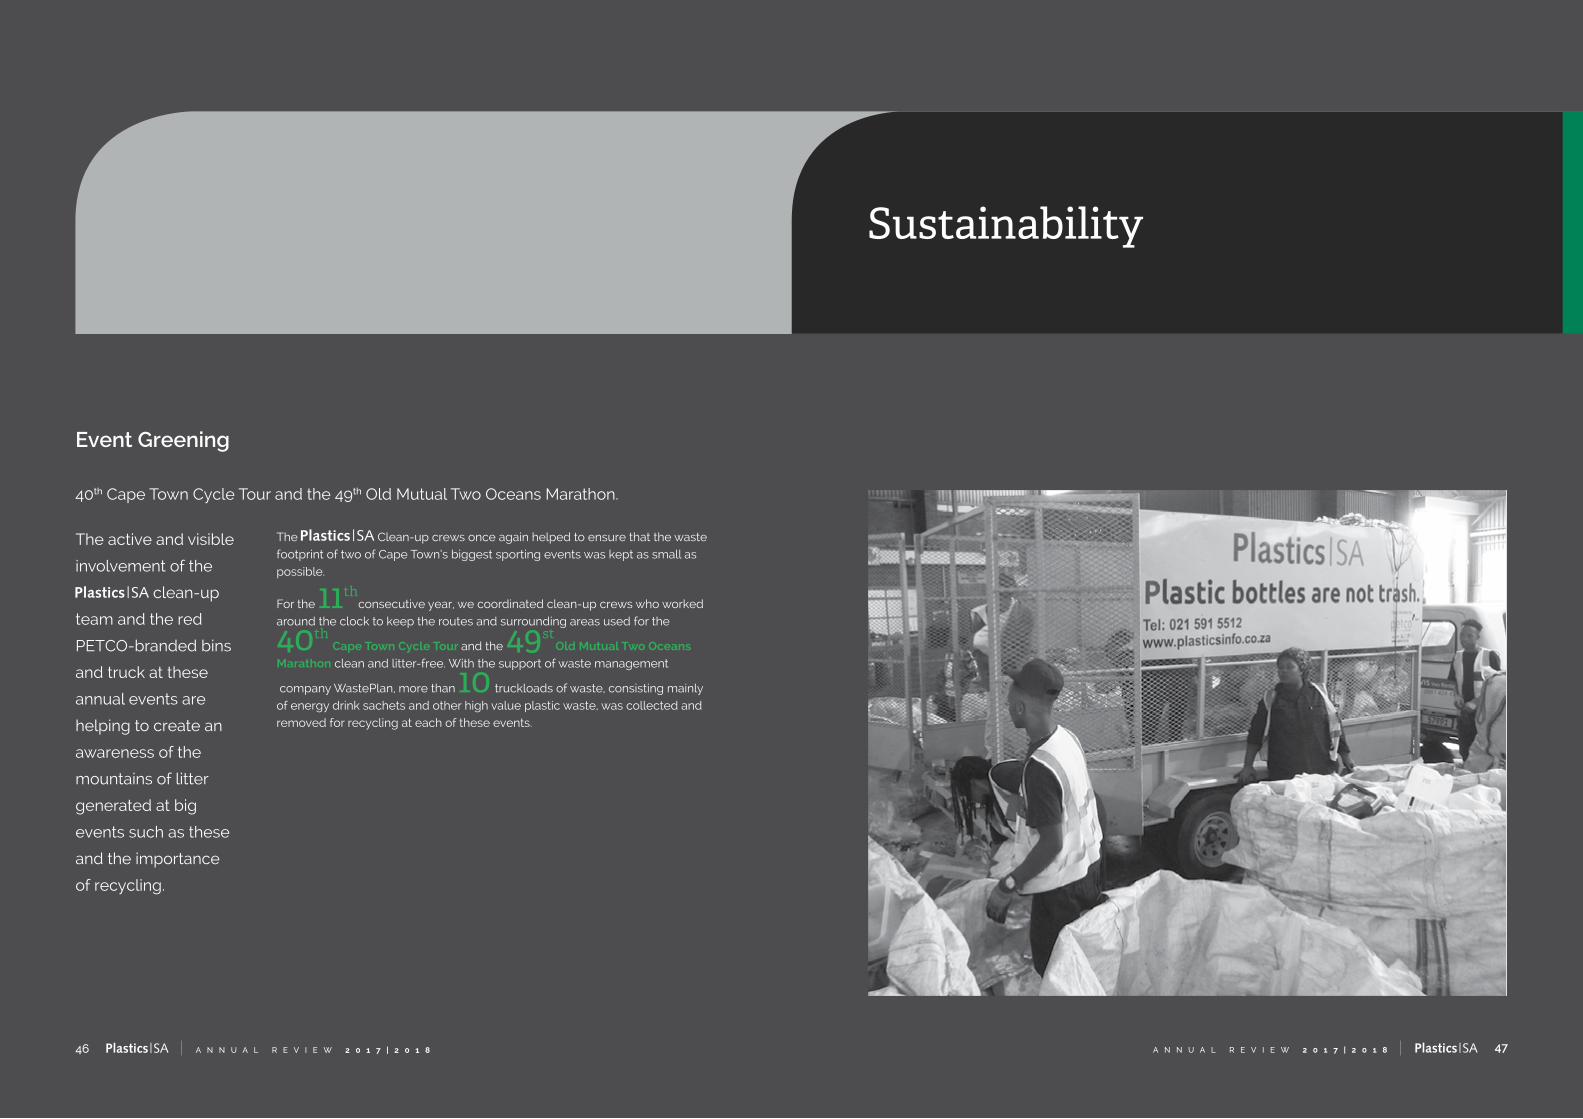
The Clean-up crews once again helped to ensure that the waste footprint of two of Cape Town’s biggest sporting events was kept as small as possible.
For the 11thconsecutive year, we coordinated clean-up crews who worked
around the clock to keep the routes and surrounding areas used for the
40thCape Town Cycle Tour and the 49st
Old Mutual Two Oceans
Marathon clean and litter-free. With the support of waste management
company WastePlan, more than 10 truckloads of waste, consisting mainly of energy drink sachets and other high value plastic waste, was collected and removed for recycling at each of these events.
Event Greening
40th Cape Town Cycle Tour and the 49th Old Mutual Two Oceans Marathon.
The active and visible
involvement of the
clean-up
team and the red
PETCO-branded bins
and truck at these
annual events are
helping to create an
awareness of the
mountains of litter
generated at big
events such as these
and the importance
of recycling.
Training
Training
Generic Management
is a newly available qualification which targets managers, supervisors and all learners who have completed the NQF 4 and Supervisory Management Programmes. Each learning programme addresses the outcomes required for specific Unit Standards included in the National Certificate Generic Management – Generic Manufacturing on NQF 5.
Phase 1 Workforce Management (31 credits)
Phase 2 Workplace Operations, Change Management and Communication (32 credits)
Phase 3 Workplace Risk, Coaching and Knowledge Management (30 credits)
Phase 4 Workplace Process Optimisation and Efficiencies (36 credits)
Phase 5 Workplace Project Management and Finances (34 credits)
The Training Division’s role in industry is about facilitating change in technology advances by addressing skills gaps. We are so excited that SMART Factories are no longer Sci-Fi but the new tomorrow in our country.
To us in the Training Division it means that our ‘near future’ skills offerings need to involve the following technologies:
1. Digital Assistant Systems
Augmented Reality
Gesture Control
Wearables and Cobots
Sensitive industrial robots
2. Advanced Robotics
3. Machine Learning
4. Autonomous Systems: software, sensors, artificial intelligence
We therefore invite all converters to involve the Training Division in the ‘SMART’ elements you have introduced into your organisations, so that together we are able to adequately transfer the right skills to your staff.
Let’s shape the new world order to suit our economy. Remember: It’s always better to be involved with the change so that it’s tailor-made to fit rather than force-fitting just to keep up with the times.
Kirtida Bhana, Training Executive
Skills Development
The new world
order is here and
moving along
at a rather rapid
rate. Industry
4.0, Advanced
Manufacturing,
Big Data, the
Internet of Things
(IOT) and the
circular economy
are no longer just
buzzwords but our
new reality.
49A N N U A L R E V I E W 2 0 1 7 | 2 0 1 848 A N N U A L R E V I E W 2 0 1 7 | 2 0 1 8

Training
Upskilling in the Training Division
Trainers Meeting to refine ‘pockets of excellence’ within the Training Division
Our trainers participated in a stimulating 2-day session in January 2018. Energised and inspired, trainers found common values during the initial ‘Walt Disney Productions’ session, identifying challenges and discussing opportunities. The second session - ‘Making learning stick’ - about creating an exciting and active learning environment, allows learners to engage in their learning process. Day 2 included sessions on ‘Learning Material Design and Development’ and ‘How to market to a captive audience’.
These interactive workshops uplifted team morale and allowed members of the team to revisit the transformative nature of their jobs and their influence on learners’ lives through uplifting skills, building confidence and ultimately replenishing dignity.
The team left the meeting having no doubts about their role in the organisation, their contribution to the Training Division and the expectations in terms of performance.
51A N N U A L R E V I E W 2 0 1 7 | 2 0 1 850 A N N U A L R E V I E W 2 0 1 7 | 2 0 1 8
Annual Information Sharing Breakfasts
In March 2018, ’s
Training Division hosted
a series of well-attended
information sharing
breakfasts in Cape
Town, Port Elizabeth,
Johannesburg and Durban,
offering their current and
potential customers the
opportunity to familiarise
themselves with the
Training Division’s offerings.
The training teams were on
hand to answer questions
regarding funding, course
content or tailoring courses
to companies’ specific
needs.
Training
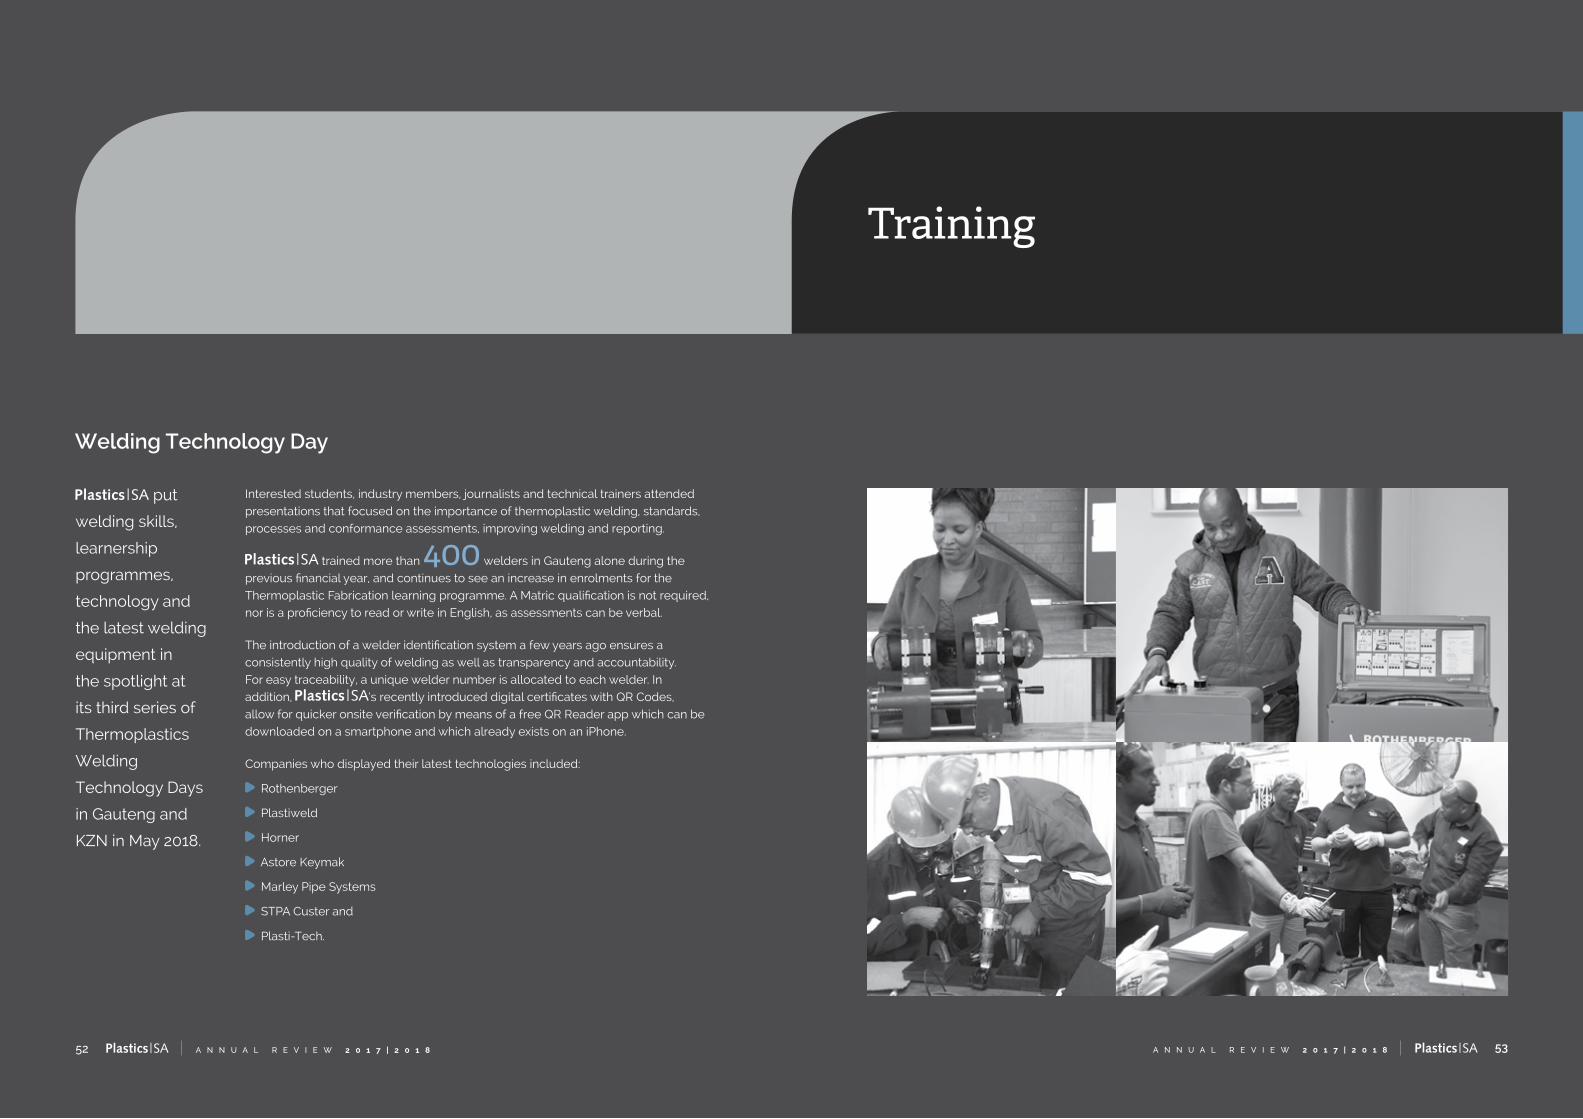
Welding Technology Day
Interested students, industry members, journalists and technical trainers attended presentations that focused on the importance of thermoplastic welding, standards, processes and conformance assessments, improving welding and reporting.
trained more than 400 welders in Gauteng alone during the previous financial year, and continues to see an increase in enrolments for the Thermoplastic Fabrication learning programme. A Matric qualification is not required, nor is a proficiency to read or write in English, as assessments can be verbal.
The introduction of a welder identification system a few years ago ensures a consistently high quality of welding as well as transparency and accountability. For easy traceability, a unique welder number is allocated to each welder. In addition, ’s recently introduced digital certificates with QR Codes, allow for quicker onsite verification by means of a free QR Reader app which can be downloaded on a smartphone and which already exists on an iPhone.
Companies who displayed their latest technologies included:
Rothenberger
Plastiweld
Horner
Astore Keymak
Marley Pipe Systems
STPA Custer and
Plasti-Tech.
put
welding skills,
learnership
programmes,
technology and
the latest welding
equipment in
the spotlight at
its third series of
Thermoplastics
Welding
Technology Days
in Gauteng and
KZN in May 2018.
53A N N U A L R E V I E W 2 0 1 7 | 2 0 1 852 A N N U A L R E V I E W 2 0 1 7 | 2 0 1 8
Training
55A N N U A L R E V I E W 2 0 1 7 | 2 0 1 854 A N N U A L R E V I E W 2 0 1 7 | 2 0 1 8
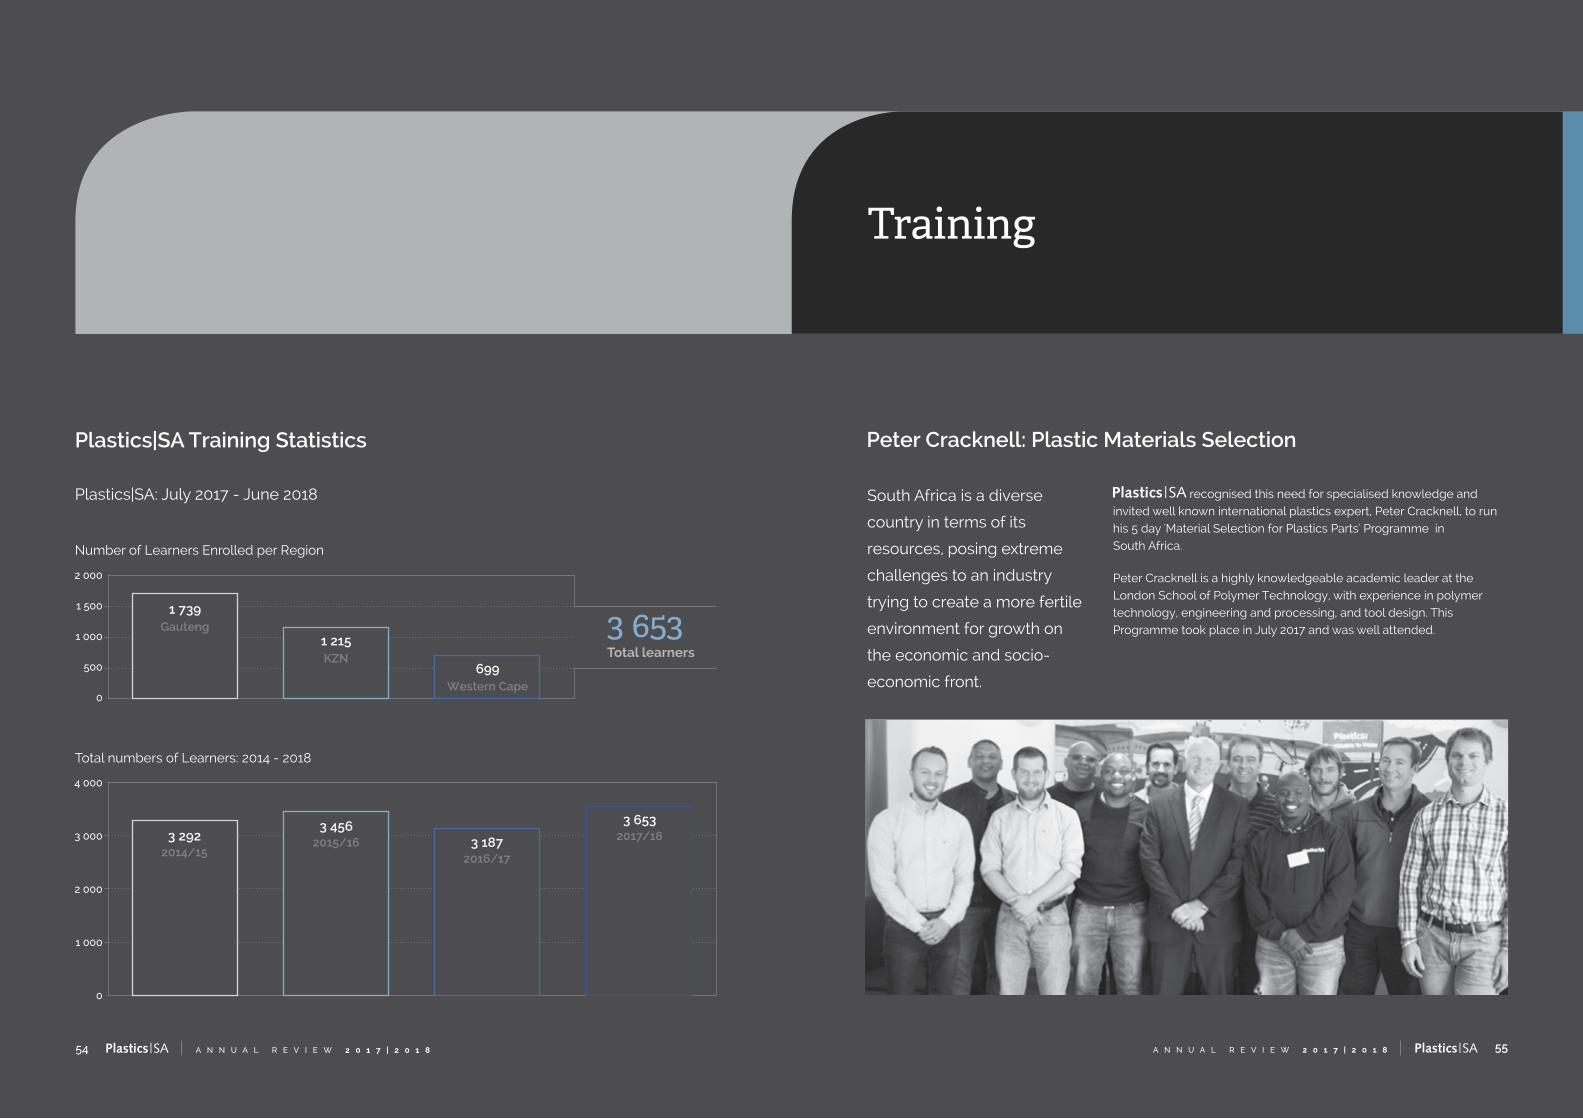
South Africa is a diverse
country in terms of its
resources, posing extreme
challenges to an industry
trying to create a more fertile
environment for growth on
the economic and socio-
economic front.
Peter Cracknell: Plastic Materials Selection
recognised this need for specialised knowledge and invited well known international plastics expert, Peter Cracknell, to run his 5 day 'Material Selection for Plastics Parts' Programme in South Africa.
Peter Cracknell is a highly knowledgeable academic leader at the London School of Polymer Technology, with experience in polymer technology, engineering and processing, and tool design. This Programme took place in July 2017 and was well attended.
Plastics|SA Training Statistics
Plastics|SA: July 2017 - June 2018
Number of Learners Enrolled per Region
Total numbers of Learners: 2014 - 2018
4 000
3 000
2 000
1 000
0
3 2923 456 3 653
3 1872014/15
2015/16 2017/18
2016/17
2 000
1 500
1 000
500
0
1 739
1 215
699
Gauteng
KZN
Western Cape
3 653Total learners
Training
57A N N U A L R E V I E W 2 0 1 7 | 2 0 1 856 A N N U A L R E V I E W 2 0 1 7 | 2 0 1 8
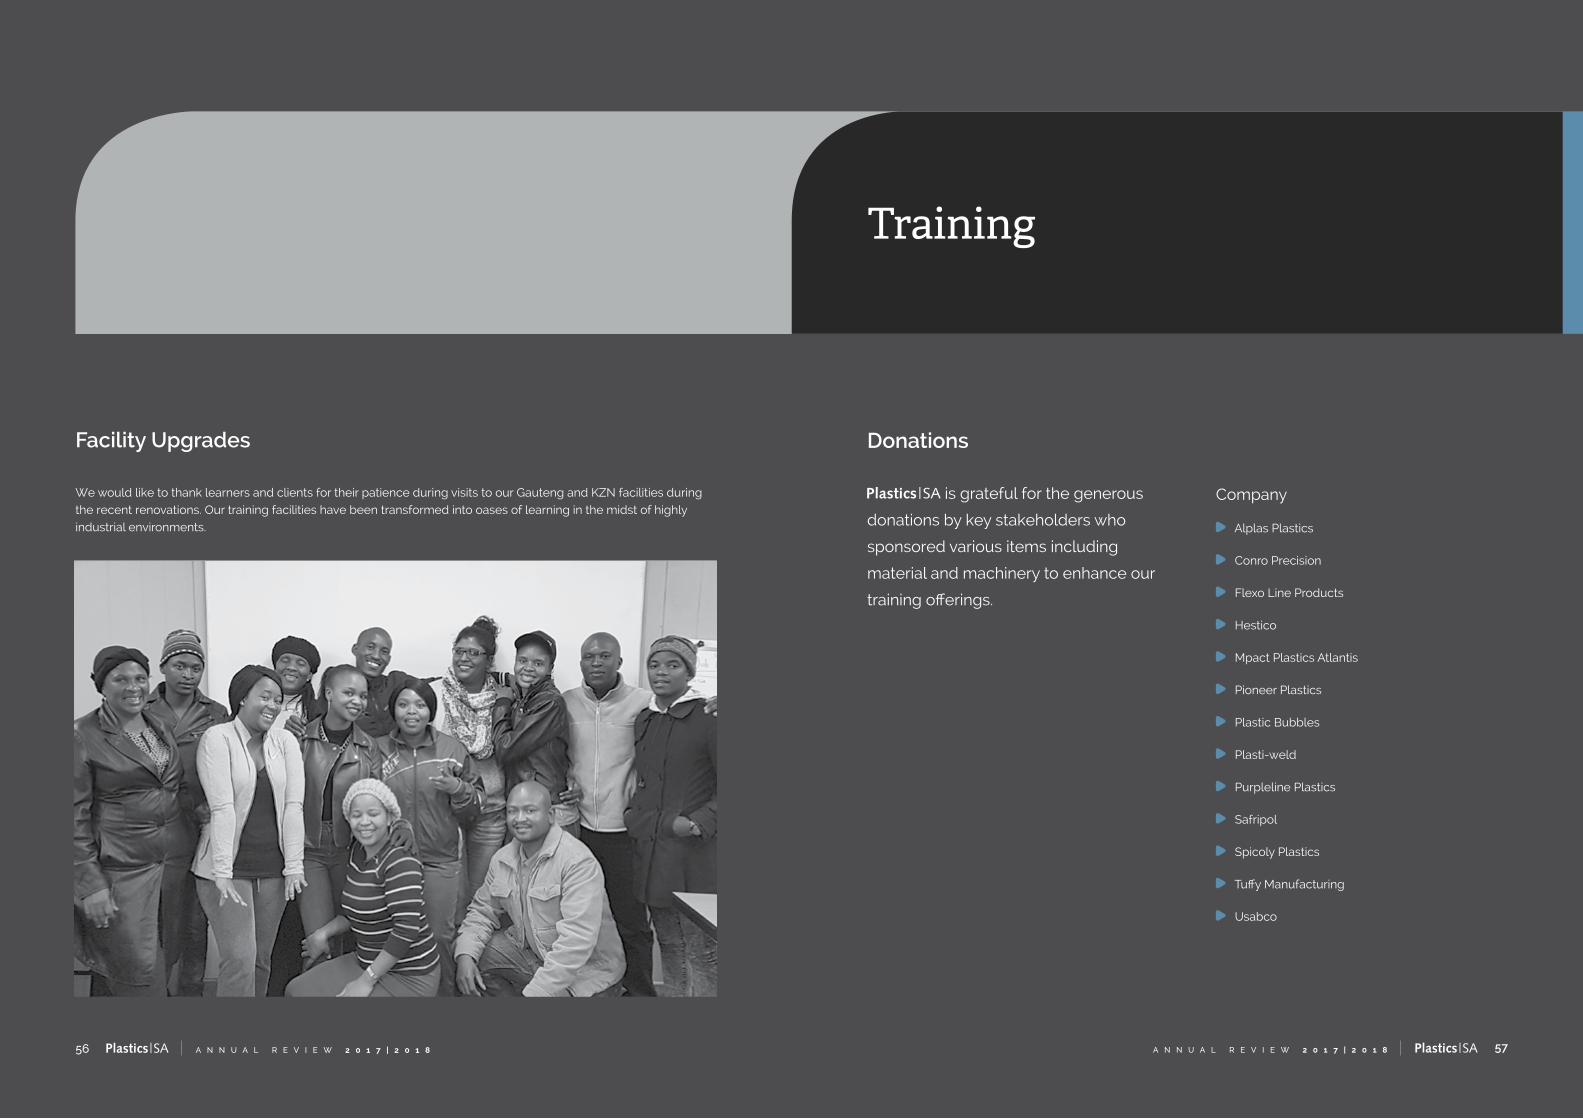
Facility Upgrades
We would like to thank learners and clients for their patience during visits to our Gauteng and KZN facilities during the recent renovations. Our training facilities have been transformed into oases of learning in the midst of highly industrial environments.
Donations
Company
Alplas Plastics
Conro Precision
Flexo Line Products
Hestico
Mpact Plastics Atlantis
Pioneer Plastics
Plastic Bubbles
Plasti-weld
Purpleline Plastics
Safripol
Spicoly Plastics
Tuffy Manufacturing
Usabco
is grateful for the generous
donations by key stakeholders who
sponsored various items including
material and machinery to enhance our
training offerings.

Training
59A N N U A L R E V I E W 2 0 1 7 | 2 0 1 858 A N N U A L R E V I E W 2 0 1 7 | 2 0 1 8
Customised Learning Programmes
The following customised programmes were developed:
Pailpac
An overview of the Plastics Industry in South Africa, materials, quality and environmental impact
Plastic Materials
The impact of Quality
The impact of Plastics
Mahle
Raw Materials and Quality
We thank
our Industry Partners who trained with us this financial year and we look forward to strengthening our relationship in the future.
each and every learner and wish them much success in their path of knowledge. Ngikufisela inhanhla!
A huge SHOUT OUT to the amazing individuals who make up the Training Division. Tenacity, determination,
dedication and a passion for developing people, are but a few of the invaluable qualities they possess!
customised a one-year learning programme for Venture Diversified
Products’ 13 learners, comprehensively covering all aspects of knowledge, practical skills and workplace experiential components of the Injection Moulding Machine Setter Occupation.
Owing to the fact that knowledge and an understanding of pneumatics and hydraulics were vital to this group of learners, called upon the assistance of Festo - a leading, global supplier of automation technology and the performance leader in industrial training and education programmes.
Festo provided a fully equipped “classroom on wheels”, which remained parked at ’s premises for the duration of the training, allowing for a highly engaging
experience as the students interacted with technology used in today’s advanced manufacturing environment.
Classroom on Wheels – Venture Setter Training
offers
personalised
learning
programmes and
training modules
for customers
who specifically
request a
modified version
for their staff.
Plastics Statistics
61A N N U A L R E V I E W 2 0 1 7 | 2 0 1 860 A N N U A L R E V I E W 2 0 1 7 | 2 0 1 8
Plastics Statistics
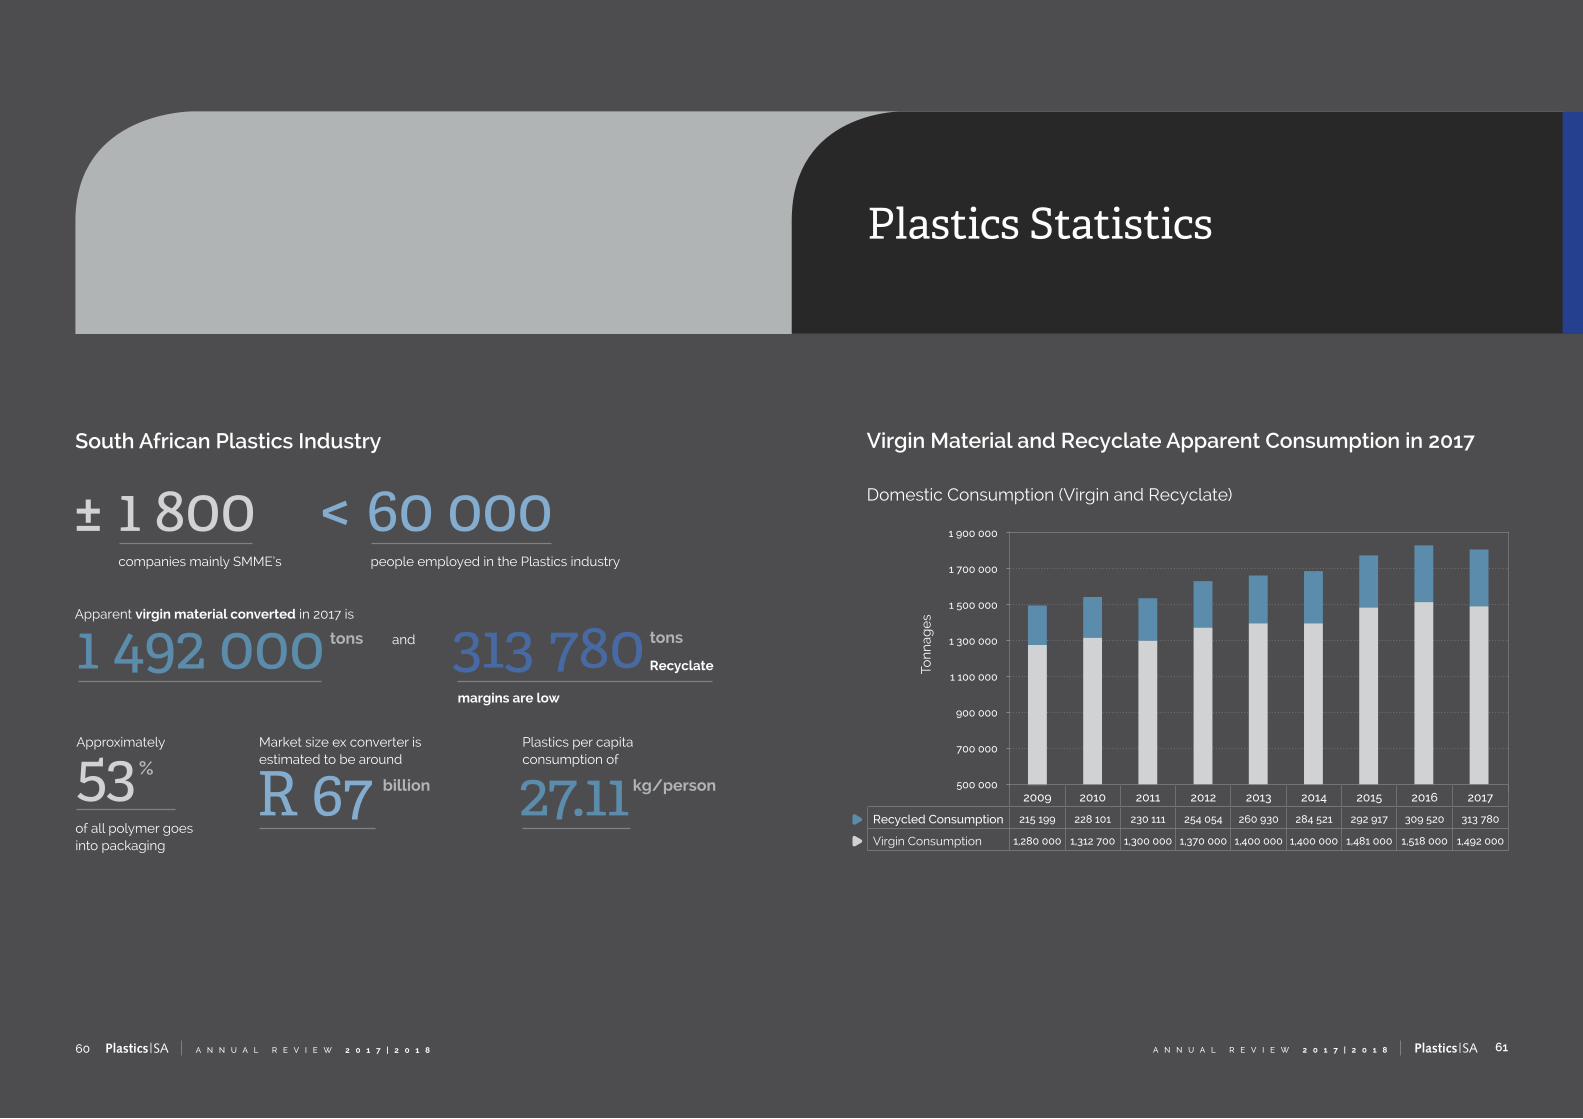
Virgin Material and Recyclate Apparent Consumption in 2017
Domestic Consumption (Virgin and Recyclate)
Ton
nag
es
1 900 000
1 700 000
1 500 000
1 300 000
1 100 000
900 000
700 000
500 000
South African Plastics Industry
companies mainly SMME’s
± 1 800people employed in the Plastics industry
< 60 000Apparent virgin material converted in 2017 is
andtons1 492 000 Recyclate
margins are low
tons313 780
%
of all polymer goes into packaging
Approximately
53Market size ex converter is estimated to be around
R 67 billion
Plastics per capita consumption of
27.11 kg/person2009 2010 2011 2012 2013 2014 2015 2016 2017
Recycled Consumption 215 199 228 101 230 111 254 054 260 930 284 521 292 917 309 520 313 780
Virgin Consumption 1,280 000 1,312 700 1,300 000 1,370 000 1,400 000 1,400 000 1,481 000 1,518 000 1,492 000
63A N N U A L R E V I E W 2 0 1 7 | 2 0 1 862 A N N U A L R E V I E W 2 0 1 7 | 2 0 1 8
Plastics Statistics
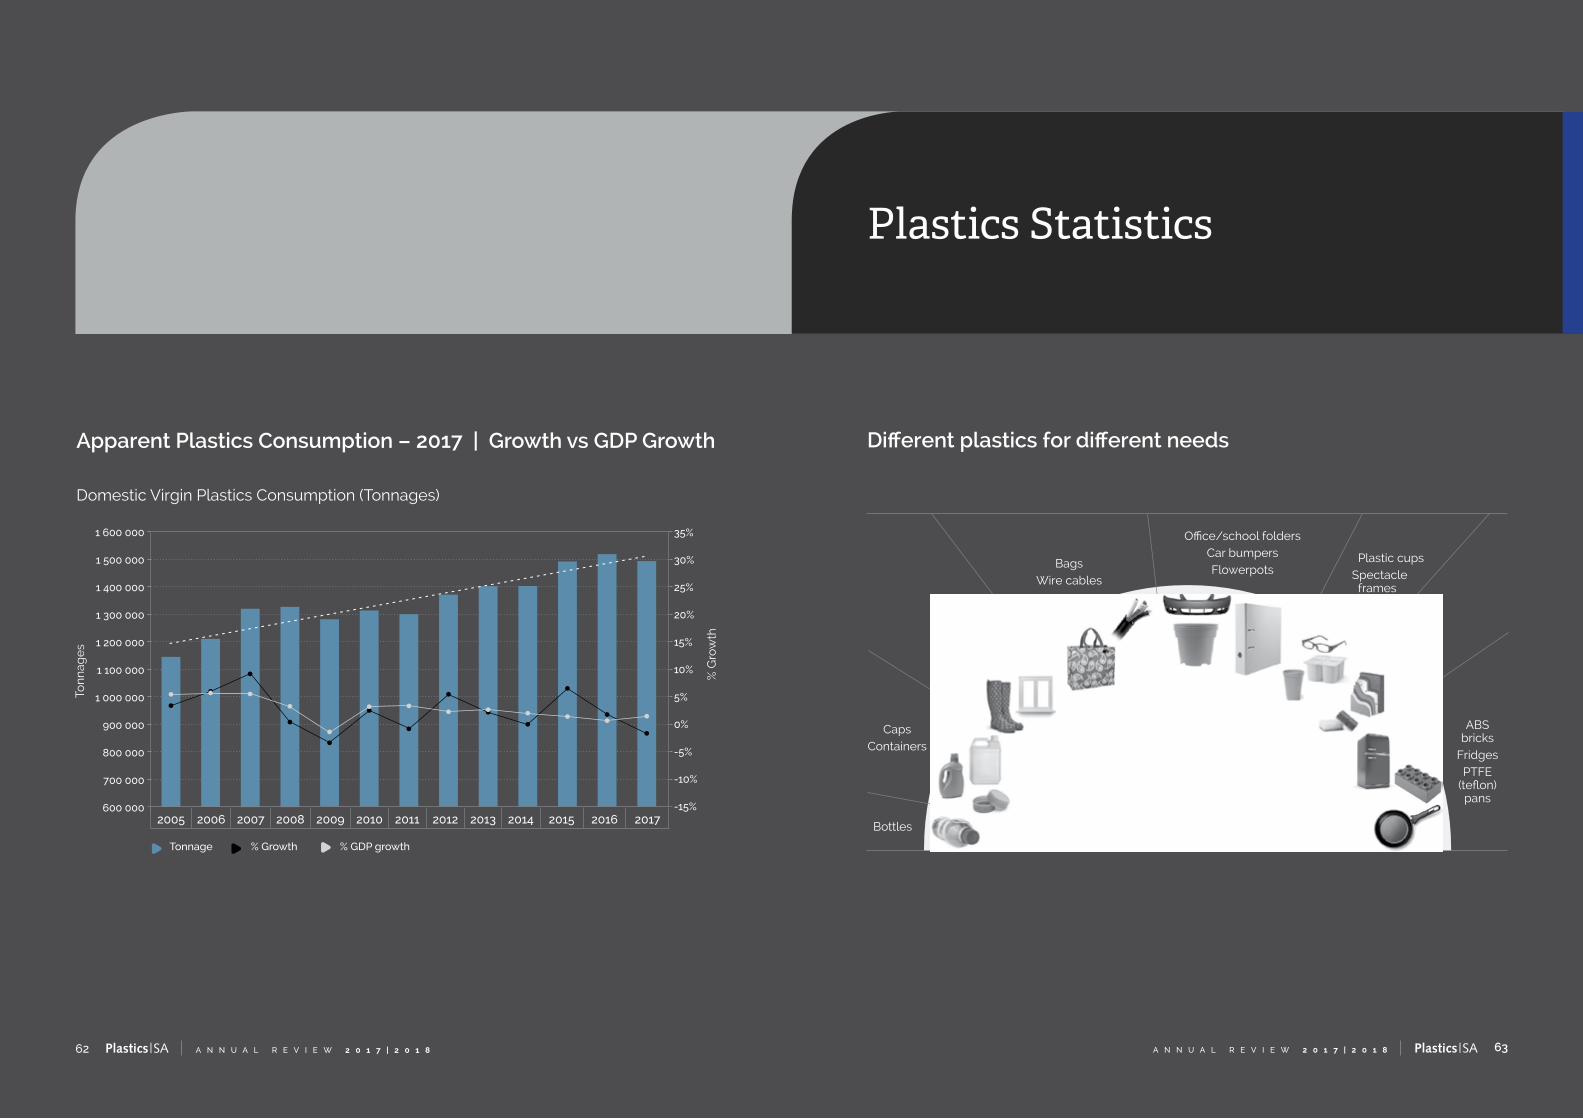
Apparent Plastics Consumption – 2017 | Growth vs GDP Growth
Domestic Virgin Plastics Consumption (Tonnages)
Ton
nag
es
% G
row
th
1 600 000
1 500 000
1 400 000
1 300 000
1 200 000
1 100 000
1 000 000
900 000
800 000
700 000
600 000
Tonnage % Growth % GDP growth
35%
30%
25%
20%
15%
10%
5%
0%
-5%
-10%
-15%
Different plastics for different needs
2005 2006 2007 2008 2009 2010 2011 2012 2013 2014 2015 2016 2017 1 492 000 tons
consumptionBottles
CapsContainers
BagsWire cables
Office/school foldersCar bumpersFlowerpots
12,7%
15,2%
10,5%
22,8% 21,1%3,4%
3,2%
10,8%
Plastic cups Spectacle frames Yoghurt tubs
SpongeIsolation
ABS bricks
FridgesPTFE
(teflon) pans
PE
T
P
E-H
D
PVC
PE-LD, PE-LLD PP PS, PS-E PUR O
THE
RS
BootsWindows
65A N N U A L R E V I E W 2 0 1 7 | 2 0 1 864 A N N U A L R E V I E W 2 0 1 7 | 2 0 1 8
Plastics Statistics
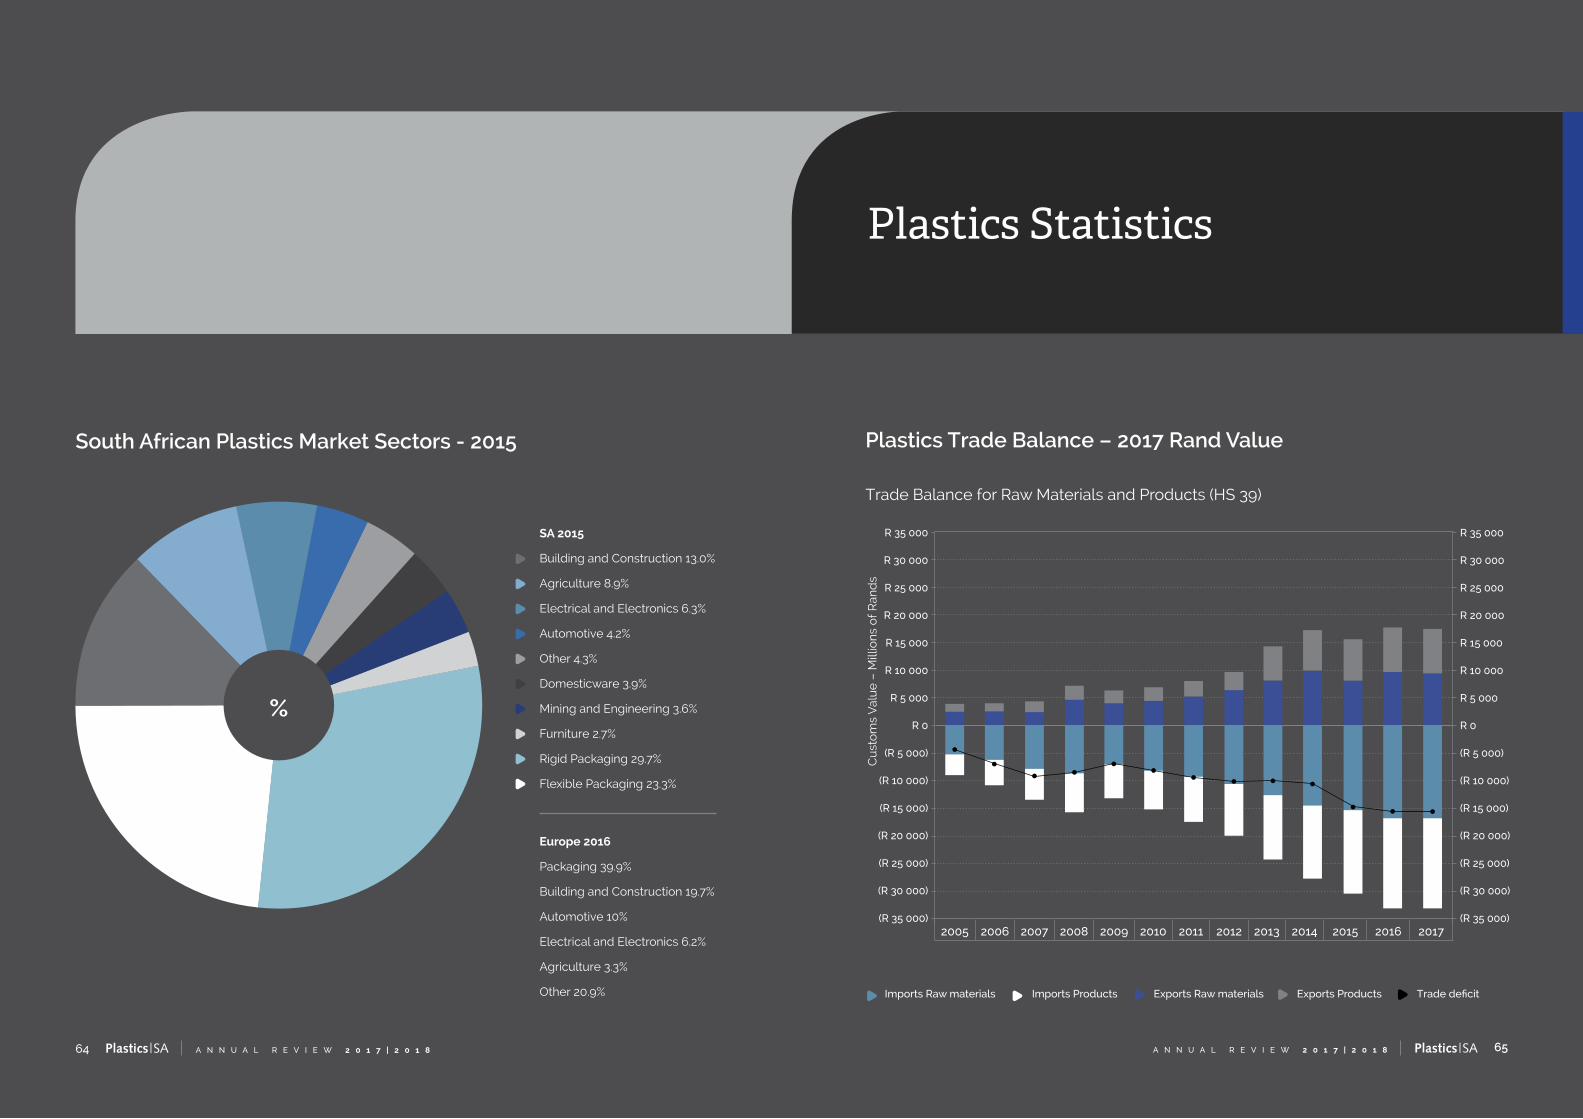
South African Plastics Market Sectors - 2015
SA 2015
Building and Construction 13.0%
Agriculture 8.9%
Electrical and Electronics 6.3%
Automotive 4.2%
Other 4.3%
Domesticware 3.9%
Mining and Engineering 3.6%
Furniture 2.7%
Rigid Packaging 29.7%
Flexible Packaging 23.3%
Europe 2016
Packaging 39.9%
Building and Construction 19.7%
Automotive 10%
Electrical and Electronics 6.2%
Agriculture 3.3%
Other 20.9%
%
Plastics Trade Balance – 2017 Rand Value
Trade Balance for Raw Materials and Products (HS 39)
Cu
sto
ms
Val
ue
– M
illio
ns
of
Ran
ds
R 35 000
R 30 000
R 25 000
R 20 000
R 15 000
R 10 000
R 5 000
R 0
(R 5 000)
(R 10 000)
(R 15 000)
(R 20 000)
(R 25 000)
(R 30 000)
(R 35 000)
R 35 000
R 30 000
R 25 000
R 20 000
R 15 000
R 10 000
R 5 000
R 0
(R 5 000)
(R 10 000)
(R 15 000)
(R 20 000)
(R 25 000)
(R 30 000)
(R 35 000)
Imports Raw materials Imports Products Exports Raw materials Exports Products Trade deficit
2005 2006 2007 2008 2009 2010 2011 2012 2013 2014 2015 2016 2017
67A N N U A L R E V I E W 2 0 1 7 | 2 0 1 866 A N N U A L R E V I E W 2 0 1 7 | 2 0 1 8
Plastics Statistics
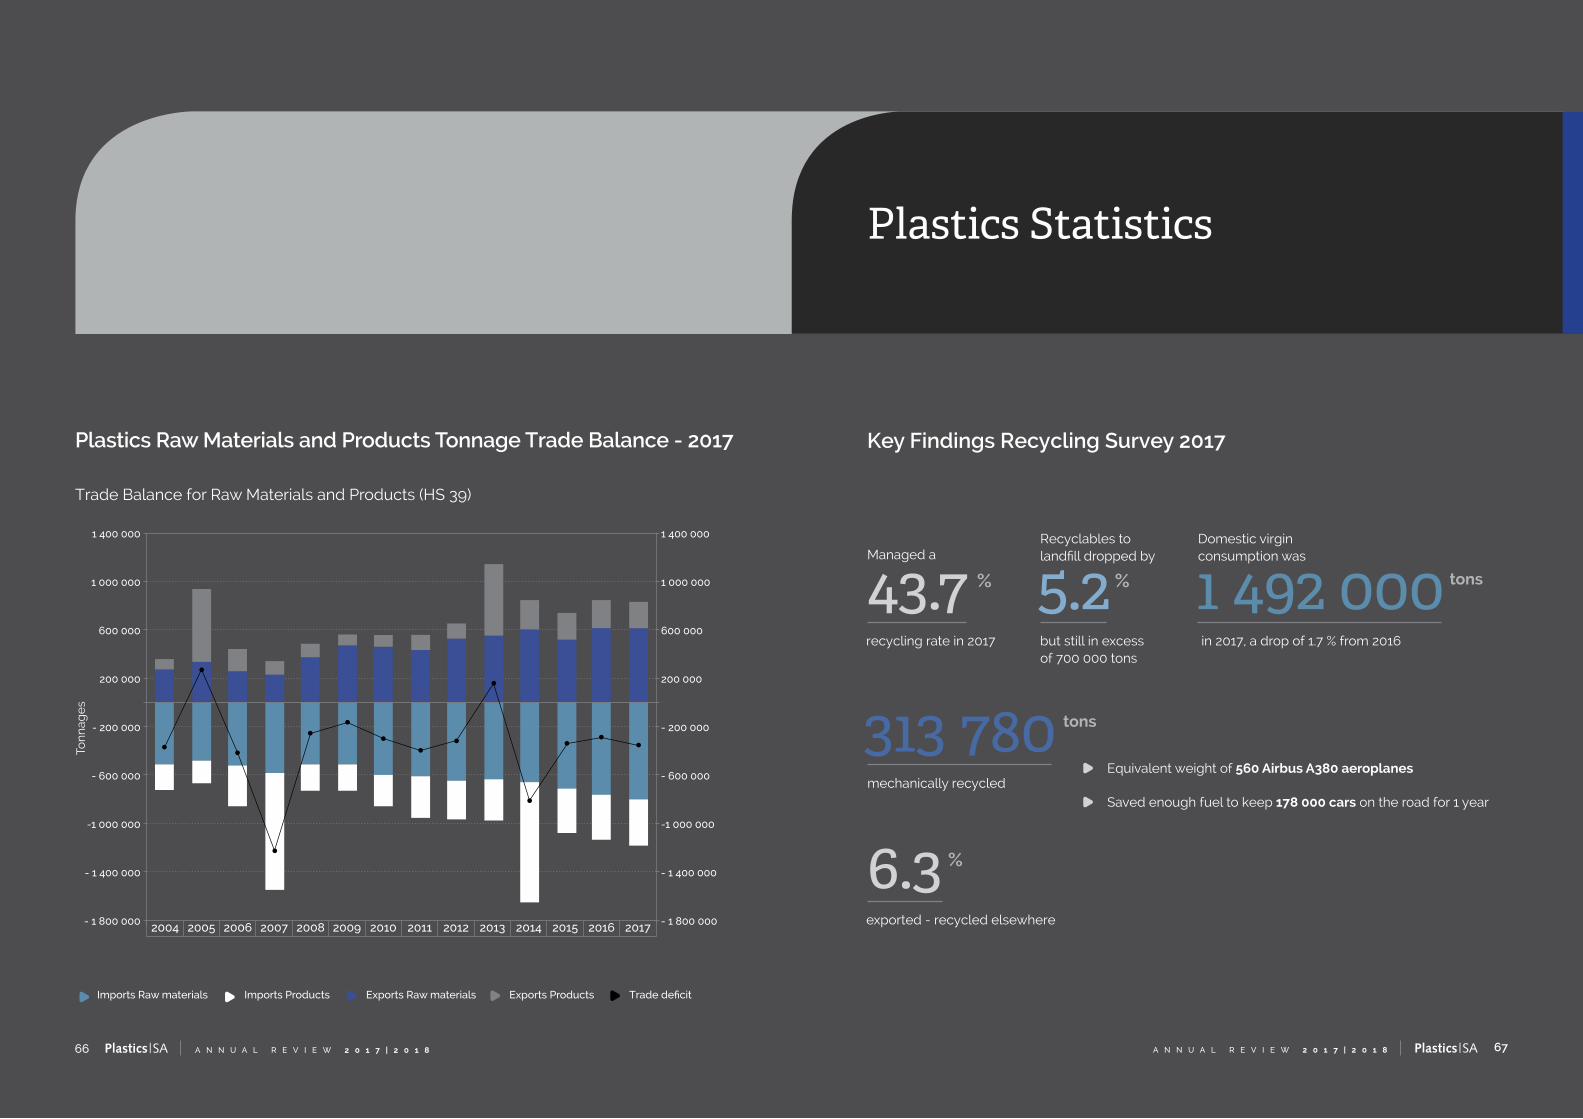
Key Findings Recycling Survey 2017Plastics Raw Materials and Products Tonnage Trade Balance - 2017
Trade Balance for Raw Materials and Products (HS 39)
Ton
nag
es
1 400 000
1 000 000
600 000
200 000
- 200 000
- 600 000
-1 000 000
- 1 400 000
- 1 800 000
1 400 000
1 000 000
600 000
200 000
- 200 000
- 600 000
-1 000 000
- 1 400 000
- 1 800 000
Imports Raw materials Imports Products Exports Raw materials Exports Products Trade deficit
2004 2005 2006 2007 2008 2009 2010 2011 2012 2013 2014 2015 2016 2017
%
%
recycling rate in 2017
exported - recycled elsewhere
Managed a
43.7
6.3
% tons
but still in excess of 700 000 tons
in 2017, a drop of 1.7 % from 2016
Recyclables to landfill dropped by
Domestic virgin consumption was
5.2 1 492 000
mechanically recycledEquivalent weight of 560 Airbus A380 aeroplanes
Saved enough fuel to keep 178 000 cars on the road for 1 year
313 780 tons

69A N N U A L R E V I E W 2 0 1 7 | 2 0 1 868 A N N U A L R E V I E W 2 0 1 7 | 2 0 1 8
Plastics Statistics
Key Findings Recycling Survey 2017Key Findings Recycling Survey 2017
%
of all materials recycled originated from landfill and other post-consumer sources
74
Recyclers procure mainly sorted, baled materials from Waste Management Companies;
%of all recyclables were sourced as bales
60 %sorted in bulk format
12 %sourced from waste pickers
3
are key to the value chain in sourcing recyclables from the communities
Waste pickers Jobs in the recycling industry
58 100Recycled tonnages increased for
PET, PE-HD, PP and PVC
The tonnages recycled in 2017
saved
enough214 220 landfill spaceto fill 714 Olympic size swimming pools.
%2 direct result of
PE-LD tonnages declined by
the impact of the drought on agriculture
the economic decline in the building industry
tons of CO2
71A N N U A L R E V I E W 2 0 1 7 | 2 0 1 870 A N N U A L R E V I E W 2 0 1 7 | 2 0 1 8
Plastics Statistics
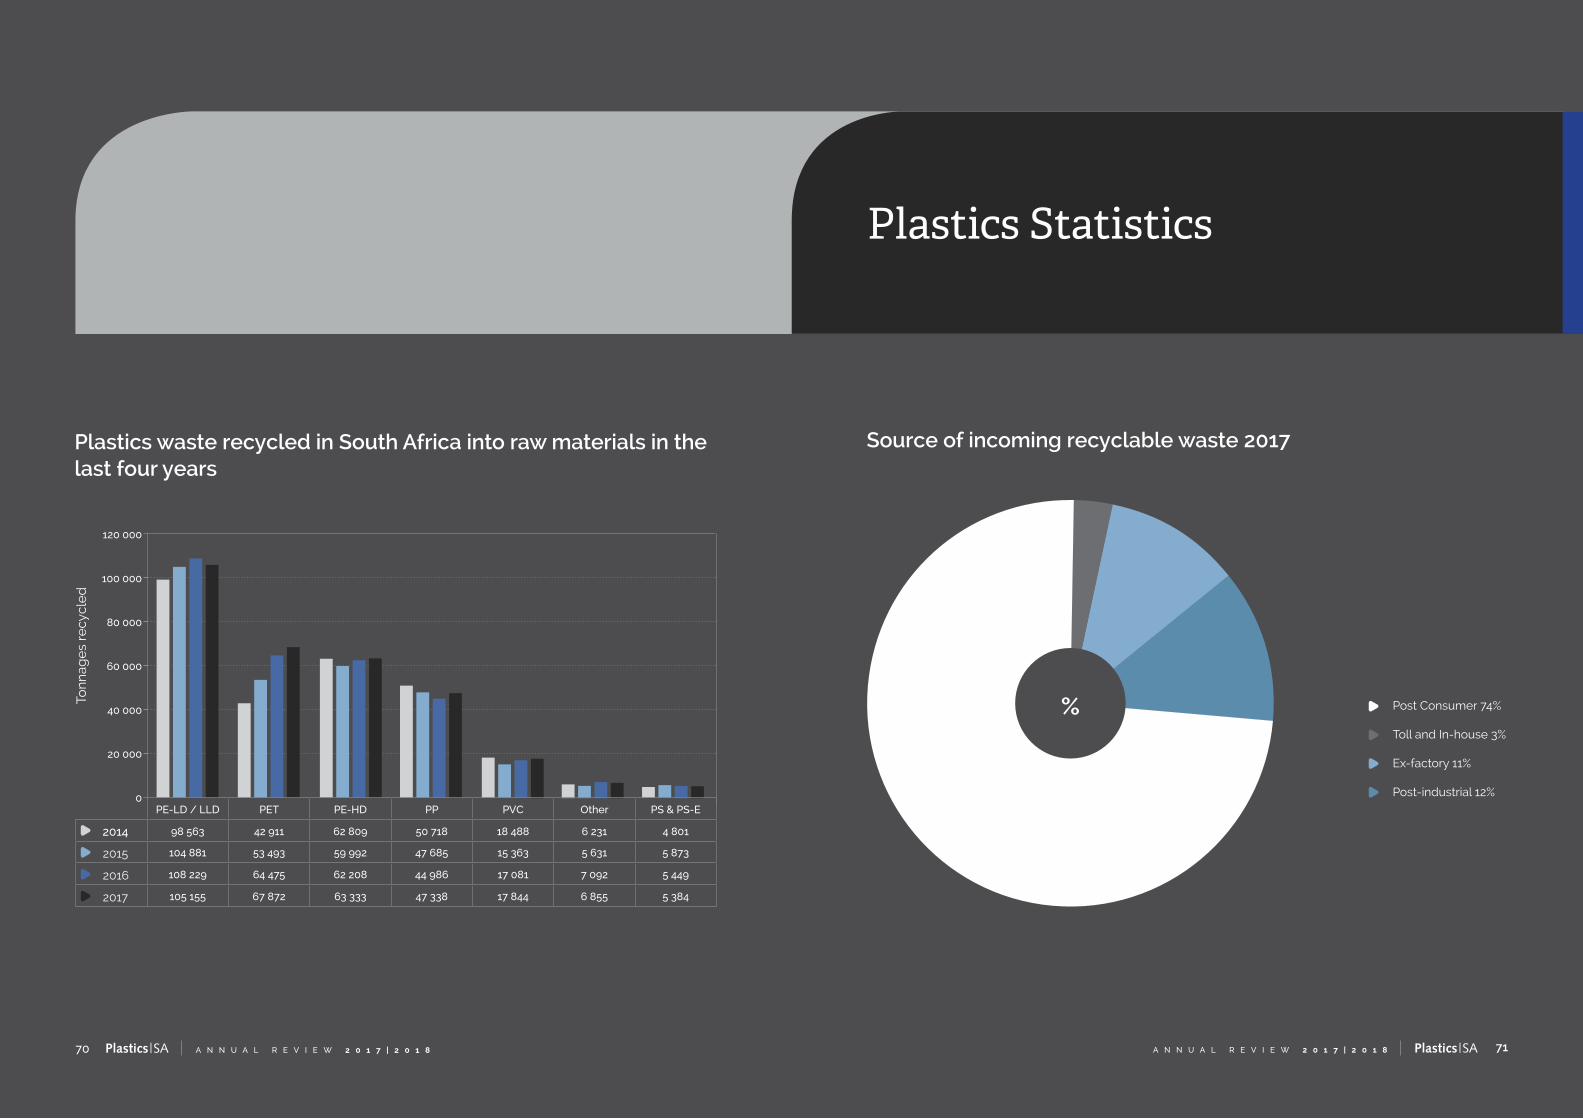
Plastics waste recycled in South Africa into raw materials in the last four years
Ton
nag
es
recy
cle
d
120 000
100 000
80 000
60 000
40 000
20 000
0
Source of incoming recyclable waste 2017
Post Consumer 74%
Toll and In-house 3%
Ex-factory 11%
Post-industrial 12%
%
PE-LD / LLD PET PE-HD PP PVC Other PS & PS-E
2014 98 563 42 911 62 809 50 718 18 488 6 231 4 801
2015 104 881 53 493 59 992 47 685 15 363 5 631 5 873
2016 108 229 64 475 62 208 44 986 17 081 7 092 5 449
2017 105 155 67 872 63 333 47 338 17 844 6 855 5 384
73A N N U A L R E V I E W 2 0 1 7 | 2 0 1 872 A N N U A L R E V I E W 2 0 1 7 | 2 0 1 8
Plastics Statistics
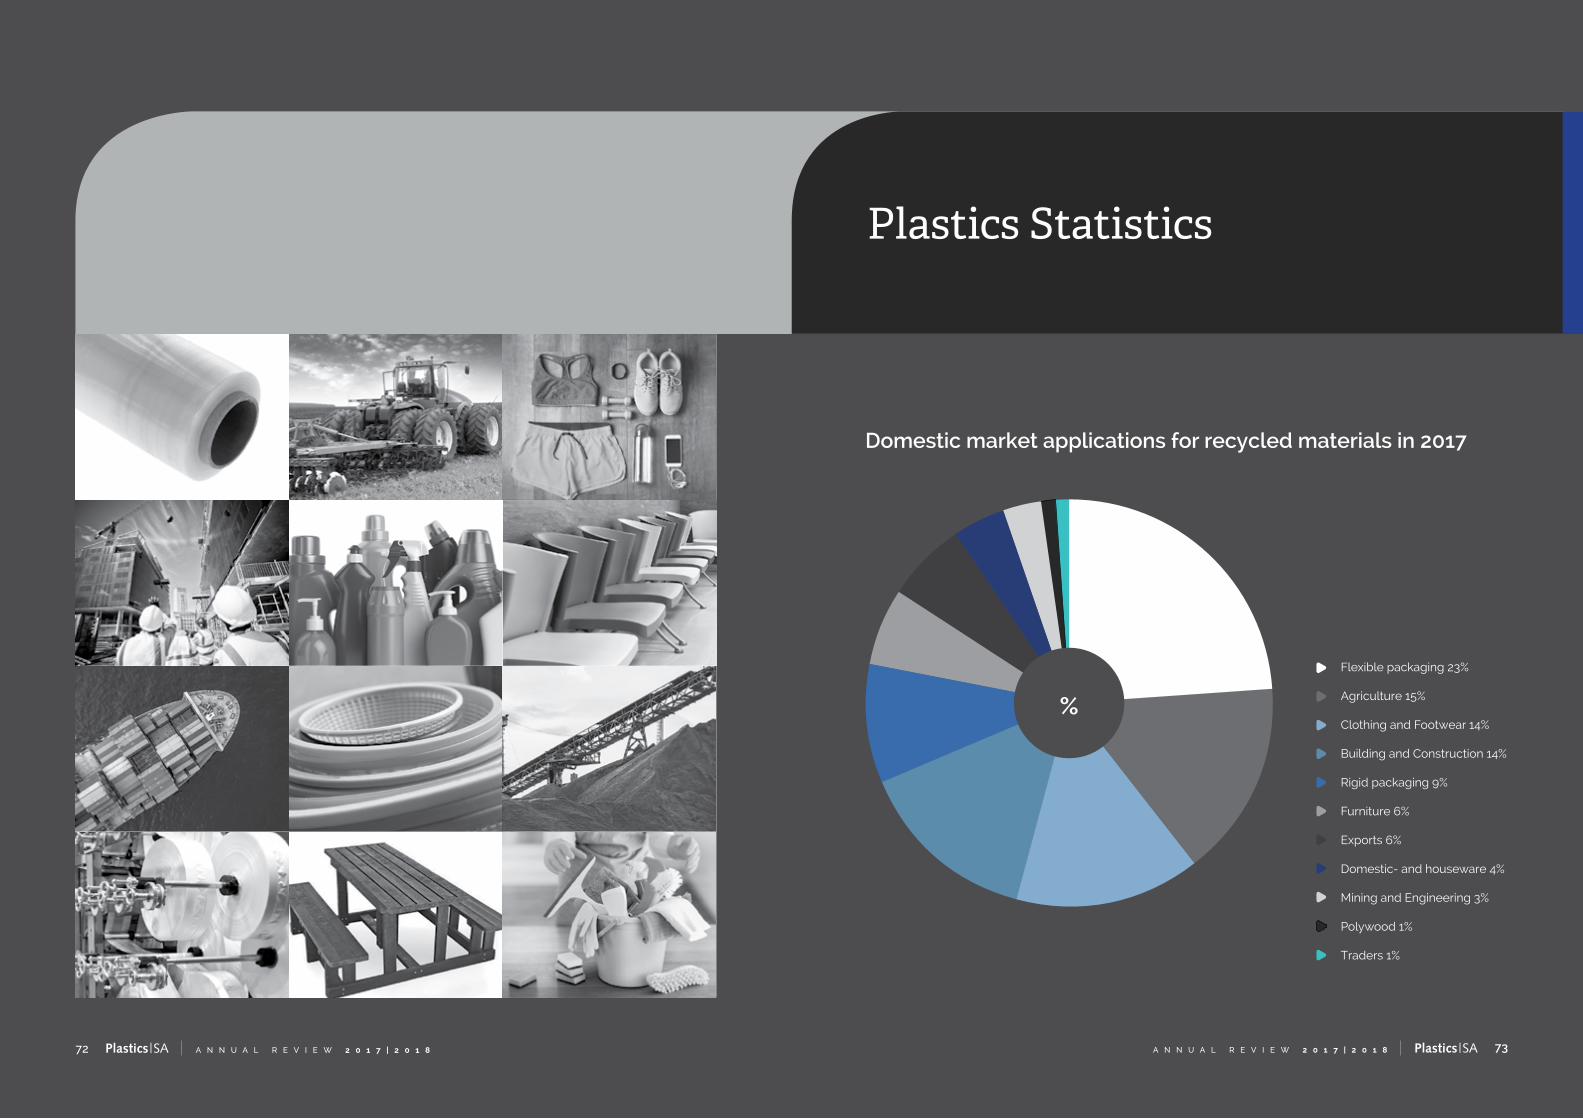
Domestic market applications for recycled materials in 2017
Flexible packaging 23%
Agriculture 15%
Clothing and Footwear 14%
Building and Construction 14%
Rigid packaging 9%
Furniture 6%
Exports 6%
Domestic- and houseware 4%
Mining and Engineering 3%
Polywood 1%
Traders 1%
%
Partnerships

Thank you to
our industry
partners for their
continued financial
contributions and
support
– without them,
none of this would
be possible.
75A N N U A L R E V I E W 2 0 1 7 | 2 0 1 874 A N N U A L R E V I E W 2 0 1 7 | 2 0 1 8
Partnerships
Raw Material Suppliers
Importers
Producer Responsibility Organisations
Recyclers
Financial Overview
76 A N N U A L R E V I E W 2 0 1 7 | 2 0 1 8
2018 R
2017 R
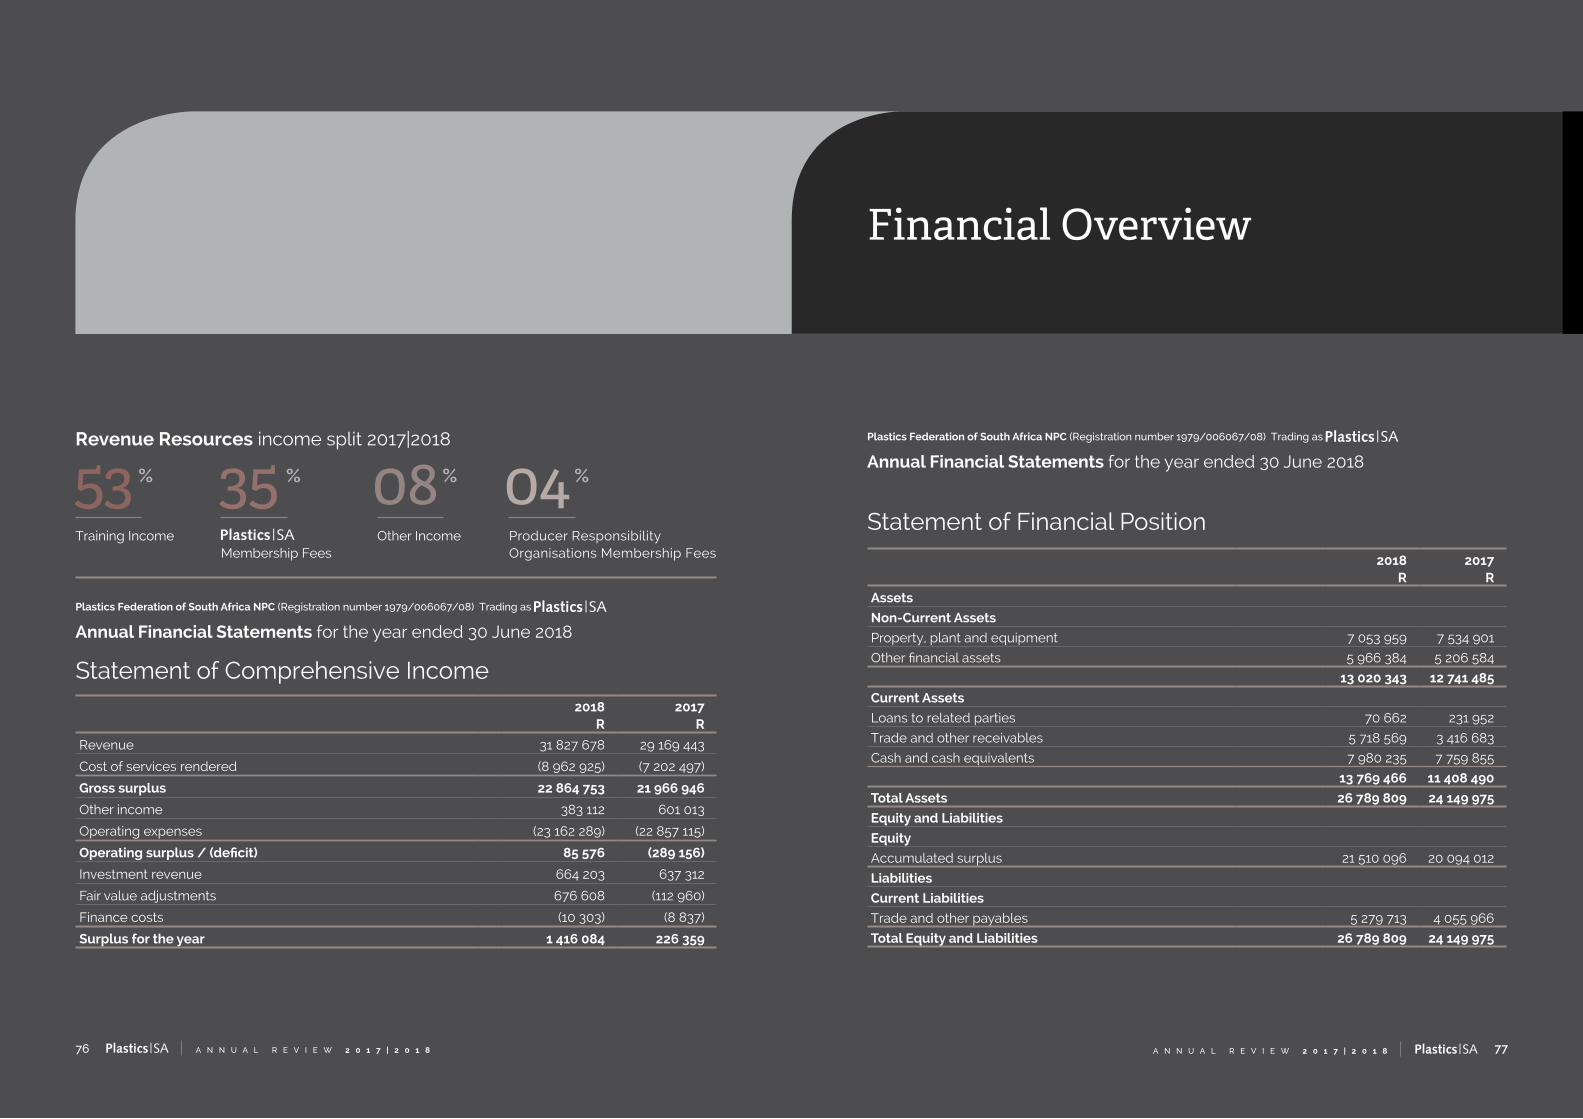
Revenue 31 827 678 29 169 443
Cost of services rendered (8 962 925) (7 202 497)
Gross surplus 22 864 753 21 966 946
Other income 383 112 601 013
Operating expenses (23 162 289) (22 857 115)
Operating surplus / (deficit) 85 576 (289 156)
Investment revenue 664 203 637 312
Fair value adjustments 676 608 (112 960)
Finance costs (10 303) (8 837)
Surplus for the year 1 416 084 226 359
Statement of Comprehensive Income
Plastics Federation of South Africa NPC (Registration number 1979/006067/08) Trading as
%
Producer Responsibility Organisations Membership Fees
04%
Other Income
08%
Membership Fees
35Training Income
53 %
Annual Financial Statements for the year ended 30 June 2018
Revenue Resources income split 2017|2018
77A N N U A L R E V I E W 2 0 1 7 | 2 0 1 8
2018 R
2017 R
Assets
Non-Current Assets
Property, plant and equipment 7 053 959 7 534 901
Other financial assets 5 966 384 5 206 584
13 020 343 12 741 485
Current Assets
Loans to related parties 70 662 231 952
Trade and other receivables 5 718 569 3 416 683
Cash and cash equivalents 7 980 235 7 759 855
13 769 466 11 408 490
Total Assets 26 789 809 24 149 975
Equity and Liabilities
Equity
Accumulated surplus 21 510 096 20 094 012
Liabilities
Current Liabilities
Trade and other payables 5 279 713 4 055 966
Total Equity and Liabilities 26 789 809 24 149 975
Statement of Financial Position
Plastics Federation of South Africa NPC (Registration number 1979/006067/08) Trading as
Annual Financial Statements for the year ended 30 June 2018
Financial Overview