39 ✰ ✰ ✰ ✰ ✰ ✰ ✰ Sabato Highlights 3 The 2000 Presidential and Congressional Contests Chaos in Florida, Predictability in Virginia Overall The disputed presidential election of 2000 passed quietly in Republican ☑ Virginia, with George W. Bush defeating Al Gore by the relatively comfortable margin of 52.5 percent to 44.4 percent. With the exception of 1964, when the Old Dominion voted for Lyndon B. Johnson, the state has gone Republican for president every four years since and including 1952. Time finally ran out for Democratic U.S. Senator and former Governor ☑ Charles S. Robb in 2000. Former Governor George F. Allen denied Robb his third term by the reasonably close margin of 52.3 percent to 47.7 percent. The combination of close presidential and Senate contests attracted a record ☑ 2.79 million Virginians to the polls—52.8 percent of those age 18 or older. This represented a 13 percent increase over the 1996 presidential election (which also featured a tight Senate race). Presidential Contest in Virginia The closeness of the election was reflected slightly in Virginia. George W. Bush’s ☑ father had carried the state by over 20 percentage points, nearly reaching the 60 percent mark in 1988, compared to his son’s less than 6-point lead over the combined liberal votes of Al Gore and the Green party’s Ralph Nader in 2000. Nonetheless, Bush had a broad-based win, sweeping 83 of 95 counties and 21 of 40 cities. More than any other single indicator, the gender gap explained the presidential ☑ result. Gore won women, 51 percent to 47 percent, but Bush won men by a much larger 58 percent to 37 percent—about twice as well as Bush did with men nationally. Racially, Bush easily outdistanced Gore among whites, 60 percent to 37 per- ☑ cent, while doing a bit better among African Americans (14 percent) than his national average of 9 percent.
Transcript
39
✰✰✰✰✰✰✰Sabato Highlights3 The 2000 Presidential and
Congressional Contests Chaos in Florida, Predictability in Virginia
Overall
The disputed presidential election of 2000 passed quietly in Republican ☑Virginia, with George W. Bush defeating Al Gore by the relatively comfortable margin of 52.5 percent to 44.4 percent. With the exception of 1964, when the Old Dominion voted for Lyndon B. Johnson, the state has gone Republican for president every four years since and including 1952.
Time fi nally ran out for Democratic U.S. Senator and former Governor ☑Charles S. Robb in 2000. Former Governor George F. Allen denied Robb his third term by the reasonably close margin of 52.3 percent to 47.7 percent.
The combination of close presidential and Senate contests attracted a record ☑2.79 million Virginians to the polls—52.8 percent of those age 18 or older. This represented a 13 percent increase over the 1996 presidential election (which also featured a tight Senate race).
Presidential Contest in Virginia
The closeness of the election was refl ected slightly in Virginia. George W. Bush’s ☑father had carried the state by over 20 percentage points, nearly reaching the 60 percent mark in 1988, compared to his son’s less than 6- point lead over the combined liberal votes of Al Gore and the Green party’s Ralph Nader in 2000. Nonetheless, Bush had a broad- based win, sweeping 83 of 95 counties and 21 of 40 cities.
More than any other single indicator, the gender gap explained the presidential ☑result. Gore won women, 51 percent to 47 percent, but Bush won men by a much larger 58 percent to 37 percent—about twice as well as Bush did with men nationally.
Racially, Bush easily outdistanced Gore among whites, 60 percent to 37 per- ☑cent, while doing a bit better among African Americans (14 percent) than his national average of 9 percent.
40 Virginia Votes ✰ 1999–2002
The core of Bush’s vote was rural and suburban; Gore ran well primarily in ☑central cities and black- majority localities.
U.S. Senate Race
In most voter categories, the Allen- Robb match- up closely paralleled the Bush- ☑ Gore results. For instance, Virginia Independents sided with the Republicans, with Bush receiving 56 percent and Allen 58 percent.
Regionally, Robb was strong only in Northern Virginia and majority African ☑American localities. Allen’s consistent backing in rural areas powered another statewide win for him.
U.S. House of Representatives
Eight incumbents were reelected to the U.S. House, and Republicans won the ☑three open seats (a net gain of one). The GOP’s Ed Schrock replaced retir-ing Democratic Congressman Owen Pickett in the Norfolk- Virginia Beach 2nd district. As of 2001, the Virginia U.S. House delegation consisted of six Republicans, four Democrats, and one Republican- leaning Independent (Virgil Goode of the 5th district).
Republican House candidates received 51.4 percent of the votes in the contests ☑where both parties had a nominee; the Democrats garnered 46.4 percent.
Campaign Money
The Senate race in Virginia was the seventh most expensive in the nation, cost- ☑ing $17.5 million between the two candidates. Allen outspent Robb, $10.9 million to $6.6 million.
Spending in Virginia’s U.S. House contests increased from $5.6 million in 1998 ☑to $9.4 million in 2000.
41
✰✰✰✰✰✰✰3 The 2000 Presidential and Congressional Contests Chaos in Florida, Predictability in Virginia
Introduction
The year 2000 witnessed one of the closest and most chaotic elections in United States history. From the introduction of “chad” to common usage; to a virtual tie in the Florida vote; to the United States Supreme Court eff ectively deciding the win-ner of the Presidential race, Election 2000 was full of surprises. To no one’s surprise, however, Virginia once again voted Republican in the 2000 presidential election. Virginia has voted Republican in every presidential election since 1948 except once: Lyndon B. Johnson in 1964. But, as in the elections of 1992 and 1996, the 2000 tally in Virginia was closer than expected. George W. Bush, Texas governor and Republican presidential nominee, had been expected to carry the Commonwealth handily—Virginia Governor Jim Gilmore was even a co- chairman of his campaign. In the fi nal weeks before Election Day, however, Virginia, like the rest of the nation, witnessed a surge by Vice President Al Gore that made the Virginia race a bit more competitive than projected.
In addition, the highly anticipated U.S. Senate race between incumbent Senator Charles S. Robb, Jr., Virginia’s only statewide Democratic offi cial, and for-mer Republican Governor George F. Allen received substantial national attention, but produced a surprisingly underwhelming victory for Allen. Robb, weakened by scandal and lackluster campaigning, only narrowly defeated the extremely contro-versial Oliver North in his 1994 re- election bid, and was expected to lose handily to Allen. Although both Allen and Bush carried the vast majority of Virginia counties and cities, and Virginia no longer boasts a single Democrat in statewide offi ce (a far cry from the Democratic dominance of the Byrd era), the election of 2000 builds on the belief that Virginia is not a permanent, absolute lock for the GOP.
General Election Results and Statistics
On November 7, 2000, Virginia voters once again delivered the Commonwealth’s electoral votes to a Republican presidential candidate from Texas named Bush. Governor George W. Bush of Texas, son of the 41st President of the United States, received 1,437,490 votes (52.5 percent) to Vice President Al Gore’s 1,217,290 (44.4 percent). Bush’s 220,000 vote victory over Gore was much closer than many ana-lysts and pollsters had predicted. Despite Virginia being controlled almost entirely by Republicans, the Gore vote plus the rather liberal vote for Green Party candidate Ralph Nader totaled 46.6 percent. It is also important to note that Vice President
42 Virginia Votes ✰ 1999–2002
Gore won the popular vote nationally by over half a million votes, making Bush the fourth President in U.S. history to be selected despite receiving fewer votes.
Although Bush carried 83 of Virginia’s 95 counties and 21 of the 40 cities (com-pared to 67 counties and 16 cities for Republican Bob Dole in 1996), Bush received a much smaller percentage of the vote than did his father, who carried Virginia 59.7 percent to 39.2 percent over Michael Dukakis in 1988. Besides Nader, who won a mere 2.2 percent, no other candidate on the presidential ballot received more than 0.6 percent of the Virginia vote.
Table 3.02 demonstrates that in over 50 years, no Democratic presidential candidate since Harry S. Truman, except Lyndon B. Johnson in 1964, has gotten
TABLE 3.01General Election Results in Virginia for President and U.S. Senate, 2000
Total Number of Votes Percent
PRESIDENT
Al Gore (D) 1,217,290 44.4George W. Bush (R) 1,437,490 52.5Ralph Nader (Green) 59,398 2.2Harry Browne (Libertarian) 15,198 0.6Pat Buchanan (Reform Party) 5,455 0.2Howard Phillips (Conservative) 1,809 0.1Write-ins 2,807 0.1Total 2,739,447 100%
U.S. SENATE
Charles S. Robb (D) 1,296,093 47.7George Allen (R) 1,420,460 52.3Write-ins 1,748 0
Total 2,718,301 100%
SOURCE: Offi cial election results from the State board of Elections.
NOTES: Party Affi liations are abbreviated as (D) = Democrats, (R) = Republicans. Write-in votes are not permitted on the Virginia ballot.
TABLE 3.02General Election Results in Virginia for President, 1948–2000
Year Democratic Candidate Percent of Vote Republican Candidate Percent of Vote
1948 Harry S. Truman* 47.90% Thomas E. Dewey 41.00%1952 Adlai E. Stevenson 43.4 Dwight D. Eisenhower* 56.31956 Adlai E. Stevenson 38.4 Dwight D. Eisenhower* 55.41960 John F. Kennedy 47 Richard M. Nixon* 52.41964 Lyndon B. Johnson* 53.5 Barry M. Goldwater 46.21968 Hubert H. Humphrey 32.5 Richard M. Nixon* 43.41972 George McGovern 30.1 Richard M. Nixon* 67.81976 Jimmy Carter 48 Gerald R. Ford* 49.31980 Jimmy Carter 40.3 Ronald Reagan* 531984 Walter Mondale 37.1 Ronald Reagan* 62.31988 Michael Dukakis 39.2 George Bush* 59.71992 Bill Clinton 40.6 George Bush* 451996 Bill Clinton 45.1 Robert Dole* 47.12000 Al Gore 44.4 George W. Bush* 52.5
Average 41.9 Average 52.2
SOURCE: Compiled from offi cial returns of the State Board of Elections.
NOTE: The percentages of votes for the Democratic and Republican candidates do not add to 100 percent because of votes received by the independents and third-party nominees.
* Denotes winner in Virginia.
CHAPTER 3 ✰ The 2000 Presidential and Congressional Contests 43
a plurality of the Virginia vote. In fact, Democratic candidates have averaged a paltry 41.3 percent of the vote since the Republican stranglehold began in 1952. Republicans by contrast have received an average of 53.2 percent since Dwight D. Eisenhower’s fi rst election. Bush compares relatively well at 52.5 percent, but he received a smaller percentage than any winning Republican candidate since Nixon in 1968. Interestingly, Bush received an almost identical percentage to Nixon’s tally in the fabled 1960 election, in which—countrywide—Kennedy narrowly defeated Nixon in the closest Presidential election in modern political history. Virginia was
FIGURE 3.01Comparison between George W. Bush in 2000 and George Bush in 1992, by Cities
SOURCE: Offi cial Election Results provided by the State Board of Elections.
FIGURE 3.02Comparison between George W. Bush in 2000 and George Bush in 1992, by Counties
SOURCE: Offi cial Election Results provided by the State Board of Elections.
44 Virginia Votes ✰ 1999–2002
even more conservative in that era, but there were many loyal conservative Democrats, which aff orded Kennedy a higher vote total than one might have expected.
Turnout in the congressional districts was fairly uniform, ranging from 67 to 70 percent of registered voting, except for the military- oriented 2nd district (which has a large “ghost” population on ships at sea) and the largely African American 3rd dis-trict. George W. Bush carried eight of Virginia’s eleven congressional districts. He re-ceived his best percentage in Central Virginia’s heavily Republican 7th district (62.6 percent), as well as sizeable margins in the Northern Neck 1st, the Norfolk / Virginia Beach 2nd, the Southside 5th, the Mountain- Valley6th, and the Northern Virginia 10th. He also received a wafer- thin plurality in the Tidewater 4th (49.3 percent to 49.1 percent). Bush narrowly lost the 11th, the Fairfax- area swing district that has a Republican congressman but is balanced very evenly by party. Overall, however, Bush lost the Northern Virginia vote, losing two of the three districts.
Gore bested Bush handily in the black- majority 3rd district (65.4 percent) and the largely Democratic 8th district (55.3 percent), and squeaked by 49.2 percent to 47.0 percent in the 11th district. Gore lost the Southwest Virginia 9th district, which had been won previously by Bill Clinton in 1992 and 1996. The loss in the 9th incidentally refl ects Gore’s inability to win neighboring Tennessee (Gore’s home state) and West Virginia (historically one of the most Democratic states) because of strong stances he made on guns, abortion rights, and the environment (aff ecting the coal industry). By contrast, Gore had won the 9th district handily in the 1988 Super Tuesday Presidential primary—it was one of the only two districts he carried (the other was the neighboring 6th).
The high- profi le Senate contest was closer than the Presidential race, although George Allen and George Bush received almost identical percentages of the vote (52.5 percent for Bush and 52.3 percent for Allen). George Allen, governor of the Commonwealth from 1994 to 1998, unseated two- term Democratic incumbent Senator Charles S. Robb, former Virginia governor and son- in- law of President Lyndon Johnson. The race marked an anticlimactic ending to the political career of Virginia’s former golden boy. Robb, who had served as lieutenant governor and governor of the Commonwealth, was elected to the United States Senate in 1988. He had been untouchable until scandals in the early 1990’s surrounding illicit parties in Virginia Beach and a wire- tapping incident involving former Governor L. Douglas Wilder. By 1994, Robb was a weakened candidate who was no longer considered mainstream by Virginia Republicans. He defeated right- wing GOP candidate Oliver North in 1994 only because of the candidacy of independent Republican Marshall Coleman. Robb was given a new life politically, but he did not take advantage of it. He registered a more liberal voting record and was considered one of Clinton’s most steadfast supporters, voting with President Clinton over 80 percent of the time in the Senate. Robb became Northern Virginia’s U.S. Senator, which made him ripe for the picking in the GOP- controlled Commonwealth.
Robb’s challenger, former Governor George F. Allen, modeled himself as a “compassionate conservative” during the campaign. He started with a wide lead over Robb in the polls, and was considered the front- runner throughout. With his base secure but the margin in the polls shrinking, Allen attempted to further moderate his stances during the last few weeks, most noticeably fl ip- fl opping his position on an assault weapons ban. Robb was slow to reply, and Allen succeeded in remaking his position a few weeks before Election Day.
In one of the country’s most expensive Senate campaigns, Allen received 1,420,460 votes (52.3 percent) to Robb’s 1,296,093 votes (47.7 percent). The 120,000- vote mar-gin was much closer than the Presidential contest; in fact, Robb’s percentage of the
CHAPTER 3 ✰ The 2000 Presidential and Congressional Contests 45
vote was greater than the Gore plus Nader total, which indicates that there were a fair number of Bush / Robb voters. Allen received six percentage points less in 2000 than his whopping 58.3 percent in his 1993 gubernatorial bid against former Democratic state Attorney General Mary Sue Terry. Robb, who received a mere 45.6 percent in his 1994 battle against the polarizing Republican Oliver North and independent Republican Marshall Coleman, improved slightly against Allen in 2000. But he was well below the 71 percent Robb received in his fi rst Senate race in 1988, when Robb was considered White House material and was barely opposed by the state GOP.
FIGURE 3.03The 2000 Presidential Election in Virginia, by Cities
SOURCE: Offi cial Election Results provided by the State Board of Elections.
FIGURE 3.04The 2000 Presidential Election in Virginia, by Counties
SOURCE: Offi cial Election Results provided by the State Board of Elections.
46 Virginia Votes ✰ 1999–2002
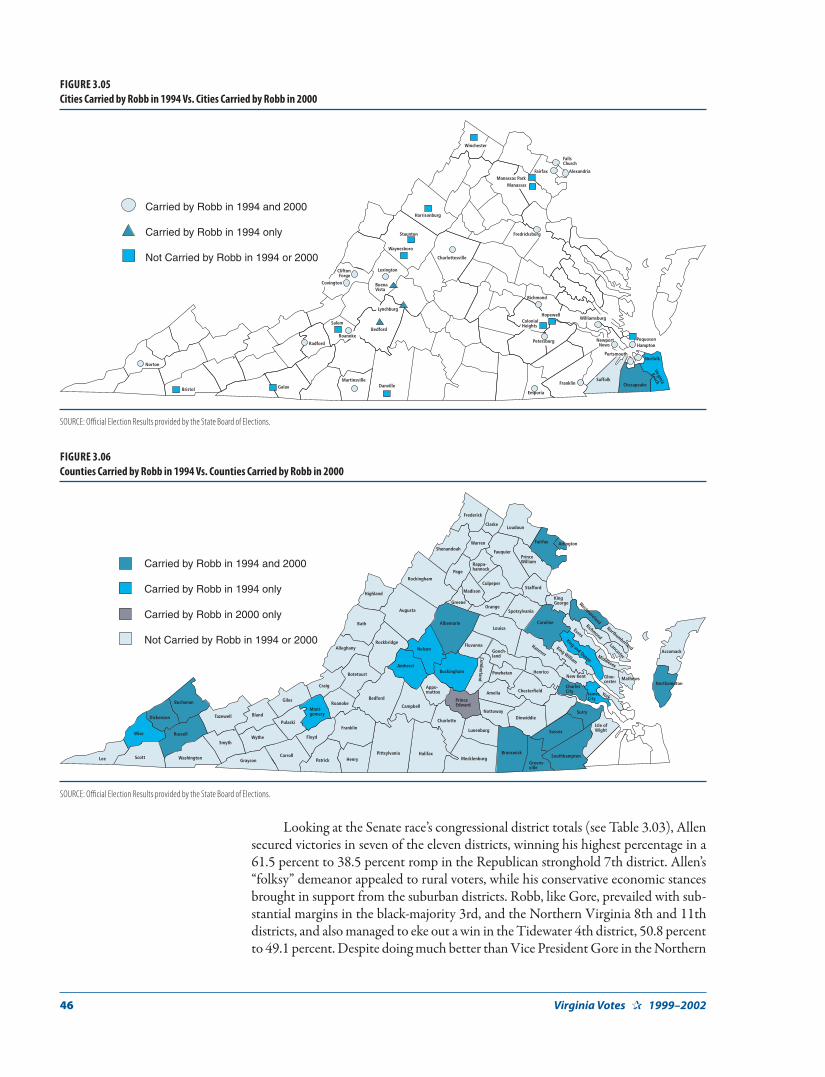
Looking at the Senate race’s congressional district totals (see Table 3.03), Allen secured victories in seven of the eleven districts, winning his highest percentage in a 61.5 percent to 38.5 percent romp in the Republican stronghold 7th district. Allen’s “folksy” demeanor appealed to rural voters, while his conservative economic stances brought in support from the suburban districts. Robb, like Gore, prevailed with sub-stantial margins in the black- majority 3rd, and the Northern Virginia 8th and 11th districts, and also managed to eke out a win in the Tidewater 4th district, 50.8 percent to 49.1 percent. Despite doing much better than Vice President Gore in the Northern
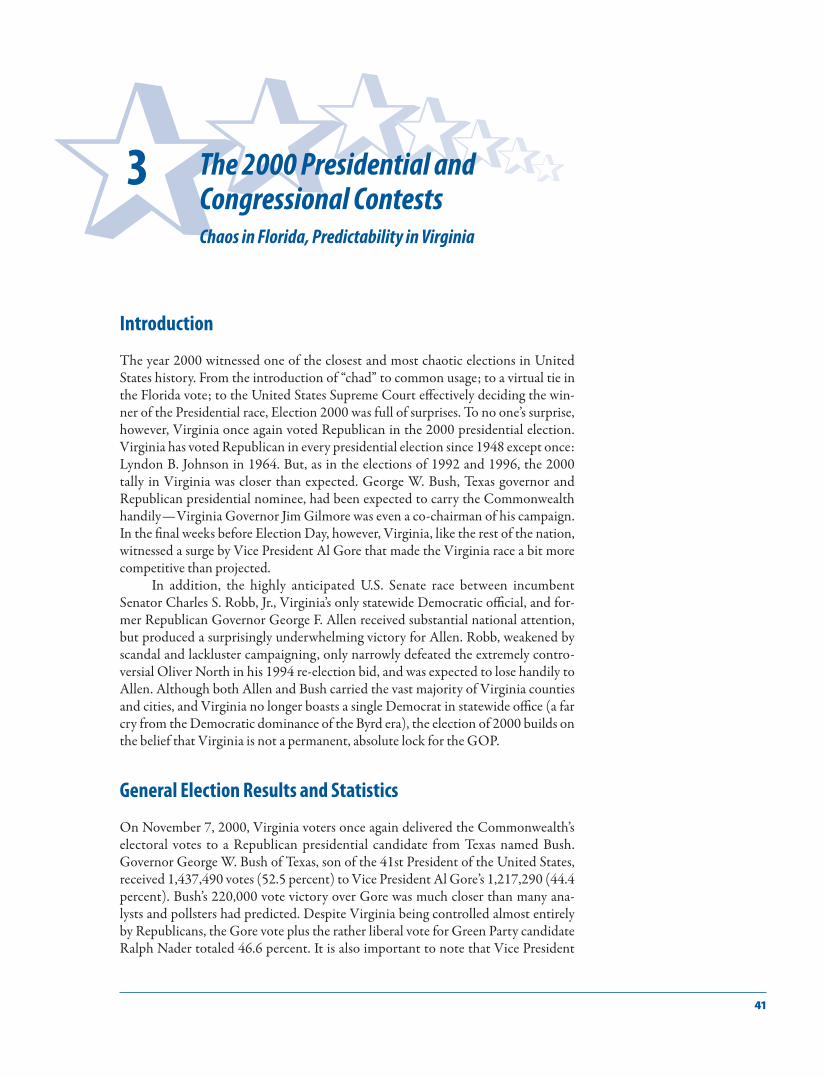
FIGURE 3.05Cities Carried by Robb in 1994 Vs. Cities Carried by Robb in 2000
SOURCE: Offi cial Election Results provided by the State Board of Elections.
FIGURE 3.06Counties Carried by Robb in 1994 Vs. Counties Carried by Robb in 2000
SOURCE: Offi cial Election Results provided by the State Board of Elections.
CHAPTER 3 ✰ The 2000 Presidential and Congressional Contests 47
Virginia districts, there was not a very broad demographic base of support for Robb. Robb did noticeably worse than 1996 Democratic Senate candidate Mark Warner (who ran against Virginia’s senior Senator John Warner) in the Southwest 9th (Mark Warner received 55.5 percent while Robb only managed 43.4 percent), refl ecting a belief on the part of many in that community that Robb only left Washington to visit Southwestern Virginia during election years. Allen also had the added benefi t of nearly three years of campaigning across the Commonwealth prior to the 2000 election; many observers believe that Robb did not begin campaign in earnest until too late in the race.
FIGURE 3.07The 2000 U.S. Senate Election in Virginia, by Cities
SOURCE: Offi cial Election Results provided by the State Board of Elections.
FIGURE 3.08The 2000 U.S. Senate Results in Virginia, by Counties
SOURCE: Offi cial Election Results provided by the State Board of Elections.
Lee Scott
Wise
Dickenson
Buchanan
Tazewell
Smyth
Russell
Washington GraysonCarroll
Wythe
Bland
Pulaski
Floyd
Patrick
Giles
Henry
Franklin
Mont-gomery
Roanoke
Craig
Bedford
Halifax
Campbell
Pittsylvania
Botetourt
Alleghany
Bath
Rockbridge
Highland
Augusta
Albemarle
Nelson
Buckingham
PrinceEdward
Appo-mattox
Amherst
Charlotte
Fluvanna
Cumberland
Powhatan
Amelia
Nottoway
Gooch-land
MecklenburgBrunswick
Greens-ville
Southhampton
SussexIsle ofWight
Surry
PrinceGeorge
Dinwiddie
Chesterfield
Henrico
CharlesCity
New Kent
York
Glou-cester
Mathews
Middlesex
King and Queen
King William
Hanover
Essex
Richmond
Westmoreland
Northumberland
Lancaster
KingGeorge
Caroline
Spotsylvania
Louisa
Orange
StaffordCulpeper
FauquierPrinceWilliamRappa-
hannock
Madison
Warren
Page
Frederick
ClarkeLoudoun
Fairfax
Rockingham
Shenandoah
Accomack
Northampton
Lunenburg
Greene
JamesCity
Arlington
George Allen (R)
Chuck Robb (D)
48 Virginia Votes ✰ 1999–2002
2000 Presidential Exit Poll Results
The “gender gap” was once again the story in the 2000 Presidential election, just as it had been in previous elections. Gore narrowly carried women (51 percent to Bush’s 47 percent), but Bush overwhelming carried the male vote in Virginia by 21 percent. Compared to voters across the country, the margin between males in Virginia voting for Gore (37 percent) and males voting Bush (58 percent) was nearly twice as large as the 11 percent diff erence nationally.
George W. Bush did better in Virginia among African Americans than he had done nationally, with 14 percent of the black vote in Virginia compared to 9 percent across the country. This refl ects the fact that African Americans in Virginia tend to be more conservative than African Americans on the national level. Not surprisingly, Bush carried the white vote 60 percent to 37 percent for Gore. The tipping point for a Democrat to win in Virginia has historically been receiving 42 to 43 percent of the white vote; Gore’s 37 percent was not nearly good enough.
Vice President Gore narrowly won the youth vote nationally, but Bush handily carried (52 percent to Gore’s 41 percent) the 18–29 year old segment in Virginia. Bush won every age category except those voters aged 60 and over, and he only lost that portion by a relatively small margin. Gore, fortifi ed by his strong emphasis on Medicare and Social Security during his campaign, was able to capture 50 percent of the elderly vote, on par with his national performance in that age group. Oddly enough, seniors were Bob Dole’s biggest supporters in Virginia during the 1996 campaign.
Green Party candidate Ralph Nader made no splash in Virginia, receiving less than 4 percent of the vote in every demographic category except 18 to 29 year- olds, self- described independents, and self- described liberals. By comparison, Ross Perot did much better in Virginia in 1996, garnering 15 percent among Independent vot-ers and receiving 6.6 percent of the overall Virginia vote. A solid majority of the Independent vote in Virginia in 2000 favored George W. Bush, 56 percent to Gore’s 36 percent. This 20- point margin is ten times the diff erence among Independents at the national level. As with African Americans, Independent Virginia voters tend to vote more conservatively than Independents nationally, hence Nader’s sub- par per-formance in Virginia.
Once again, Republicans were more united behind their candidate in the 2000
TABLE 3.03General Election Results in Virginia for President and U.S. Senate by Congressional District, 2000
President U.S. Senator
District Total Votes Case Percent of Registered Voting Gore (D) Bush (R) Robb (D) Allen (R)
SOURCE: Exit poll conducted and adjusted for CNN by Voter News Service. For Virginia, a total of 1,543 voters were interviewed outside their voting places on Election Day.
NA = Not Available. Sample Size was too small to produce reliable results in some subcategories.
50 Virginia Votes ✰ 1999–2002
election than the Democrats. This was true both statewide and nationally. While Gore received 91 percent of the Democratic support, Bush garnered 94 percent of the voters who identifi ed themselves as Republicans in Virginia. Nationally, Bush’s party support was nearly as strong, winning 91 percent of Republicans compared to Gore’s 86 percent received from Democrats.
When looking at voter income, Gore received his strongest support among those who earned less than $30,000 annually, both in Virginia as well as nationally. The Democrat received a 51 percent majority of the votes from this income bracket in Virginia, slightly less than the 54 percent won nationally. Bush received more sup-port than Gore in Virginia, 49 to 46 percent, from those making between $30,000 and $49,999. (Nationally, Gore edged out Bush by a one- point margin, 49 to 48 percent in the same group.) As income increased, Bush’s support continued to climb in Virginia and nationwide. Unlike Bob Dole in 1996 who was only able to carry a majority of those making more than $75,000, Bush was able to garner a majority with voters making over $50,000 per year. The Virginia electorate, confi rming an earlier trend, continued to be more skewed to conservative upper- income voters in 2000. In 1992 those making over $75,000 comprised just 14 percent of the electorate in 1992, and 21 percent in 1996; in 2000, 36 percent of the Virginia electorate made over $75,000 annually.
Each family’s fi nancial situation regularly determines the pattern of presiden-tial voting, and the 2000 election affi rmed this observation. Of the 54 percent of Virginians who said their situation had improved since 1996, Gore received a clear majority of 57 percent. (Nationally, 50 percent of the electorate felt they were better off and supported Gore by a margin of 61 to 36 percent.) Those who felt their situ-ation had worsened or remained the same were equally supportive of the challenger, and Bush won massive majorities of 65 and 67 percent respectively. These Virginia numbers mirrored the national results in which Bush won 63 percent of those who were worse off and 60 percent of those who felt their situation had not changed.
While voters who described themselves as either liberal or conservative were predictably skewed towards their respective candidate (75 percent of the liberal vote went to Gore and 86 percent of the conservative vote went to Bush), Gore carried the moderate vote, 51 to 46 percent. This moderate diff erence was slightly closer, how-ever, than the national moderate vote, which was 52 to 44 percent in favor of Gore.
An analysis of recent voting trends again shows a Democratic Party less unifi ed behind its candidate. Only 84 percent of those who voted for Clinton in 1996 reaf-fi rmed their support for the Democratic ticket and Gore in 2000. Another 13 percent crossed party lines and voted for Bush. By contrast, the Virginia Republicans mir-rored their 1996 vote, wholeheartedly supporting the GOP candidate. Amazingly, 96 percent of those who voted for Dole also voted for George W. Bush. These statistics refl ect similar numbers on a national level. Without a serious third- party candidate challenging for conservative votes, Bush picked up ground nationally by winning the votes of former Perot supporters. Among those who voted for Perot in 96, Bush more than doubled Gore, 64 to 27 percent.
Home to prominent religious conservative heavyweights, such as Christian Coalition founder Pat Robertson and Liberty College President Jerry Falwell, the Commonwealth contains a strong base of those who classify themselves as belonging to the white religious right. Of the 16 percent of voters who identifi ed themselves as such, an overwhelming yet predictable 82 percent voted for Bush. The white reli-gious right vote has proven itself to be as conservative as the black vote is Democratic, with the two eff ectively canceling each other out in many cases.
CHAPTER 3 ✰ The 2000 Presidential and Congressional Contests 51
2000 U.S. Senate Exit Poll Results
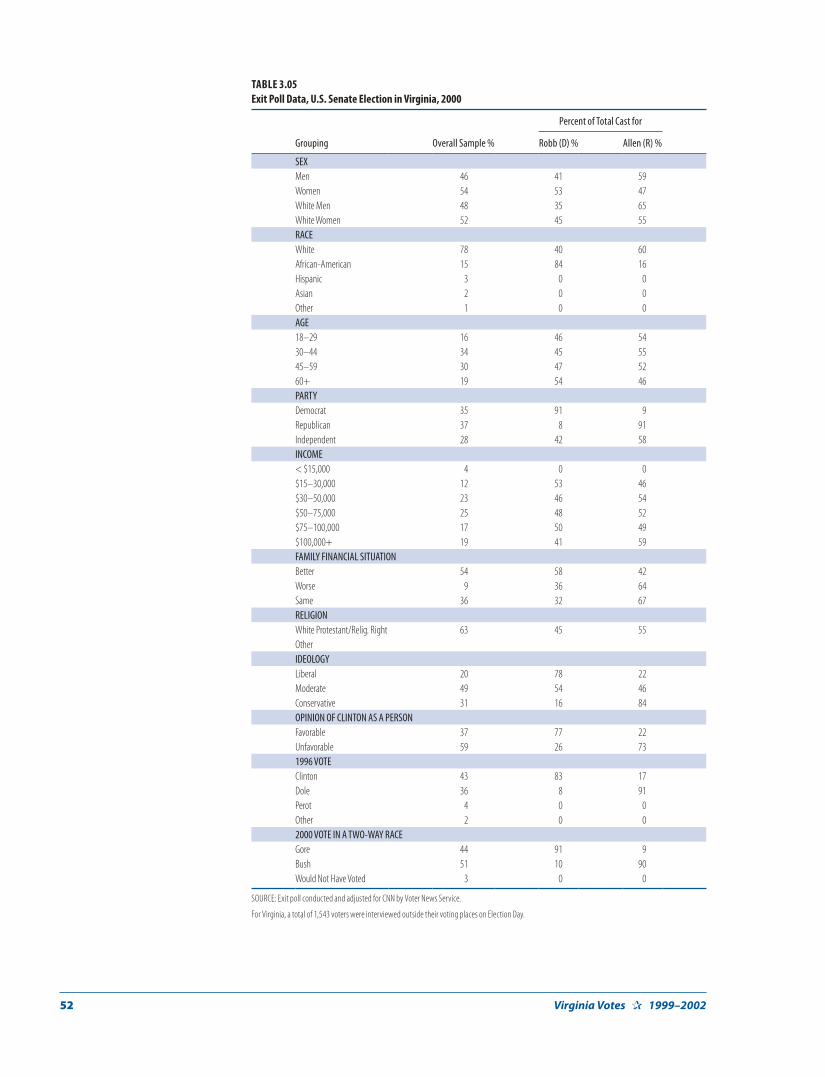
George Allen’s victory over Chuck Robb followed much of the same pattern as Bush’s over Gore. Like Bush, Allen easily won the male Virginia vote, 59 to 41 percent. Like Gore, Robb carried women voters, but not by a high enough margin. Somewhat trumping Gore’s 4 percent margin, Robb won the female vote, 53 to 47 percent. Among whites, Allen carried both men and women, 65 and 55 percent, respectively.
As expected, Robb won the black vote handily with 84 percent to Allen’s 16. The margin for white voters was somewhat closer, with Allen winning 60 to 40 per-cent. Robb possibly benefi ted from Gore’s appeal to the elderly in issues such as health care, prescription drugs and Medicare; the incumbent Senator gained the support of 54 percent of voters over the age of 60. Allen, like Bush, held a slim margin of victory among the rest of the population.
In a passionate display of partisanship, the contest was sharply divided among party lines—Robb and Allen each carried 91 percent of the Democratic and Republican vote, respectively. Mimicking the presidential election, Independents handed their support to the GOP candidate, with Allen winning 58 to 42 percent. Ideology was equally divided—Robb carried most liberal voters while Allen mainly found support among conservatives. Also, nearly 60 percent of Virginia voters rated Clinton as unfavorable, most of whom voted for Allen—a factor that did not bode well for Robb, one of Clinton’s most steadfast supporters in an anti- Clinton state.
Voter Turnout
With 2.79 million votes cast in Virginia for the 2000 elections, the Commonwealth surpassed its previous record for total absolute votes cast—a 13 percent increase from 1996 elections. More interestingly, the 52.8 percent of potential votes cast beat the national average of 51.2 percent and is Virginia’s second- highest turnout in over a half century. (The highest turnout occurred in the 1992 elections when 54.5 per-cent of potential votes were cast.) Table 3.07 shows a drop- off in the percentage of registered voters who actually cast their ballot. In 1992, 84.5 percent of registered Virginians voted. In 1996, this number dropped to 74.3 percent. By 2000, this num-ber has dwindled to 68.5 percent. This is not, however, due to a decrease in actual voters. Instead, it is undoubtedly a result of the Motor / Voter federal law of 1993. The law has simplifi ed the registration process and has increased drastically the pool of registered voters, but the number of actual voters has not increased proportionally.
The Urban and Rural Voting Patterns
A breakdown of urban and rural voting shows the Democratic Party underachiev-ing in most areas of the state. Demographically, people are moving into the suburbs at the expense of central cities and rural areas. This shift benefi ts Republicans, as the typical suburbanite tends to be upper middle class and have a more conservative ideology. In central cities, the Democrats had substantial margins of victory, but as a whole underperformed when compared to past elections. Gore’s 20 percentage point victory over Bush was less than the usual 33 percent margin that Democrats enjoy. Robb’s victory over Allen was better, at 61 to 38 percent, but still was not great by past standards. The suburbs were predictably not close, with Republicans carrying
52 Virginia Votes ✰ 1999–2002
TABLE 3.05Exit Poll Data, U.S. Senate Election in Virginia, 2000
Percent of Total Cast for
Grouping Overall Sample % Robb (D) % Allen (R) %
SEX
Men 46 41 59Women 54 53 47White Men 48 35 65White Women 52 45 55RACE
White Protestant/Relig. Right 63 45 55OtherIDEOLOGY
Liberal 20 78 22Moderate 49 54 46Conservative 31 16 84OPINION OF CLINTON AS A PERSON
Favorable 37 77 22Unfavorable 59 26 731996 VOTE
Clinton 43 83 17Dole 36 8 91Perot 4 0 0Other 2 0 02000 VOTE IN A TWO-WAY RACE
Gore 44 91 9Bush 51 10 90
Would Not Have Voted 3 0 0
SOURCE: Exit poll conducted and adjusted for CNN by Voter News Service.
For Virginia, a total of 1,543 voters were interviewed outside their voting places on Election Day.
CHAPTER 3 ✰ The 2000 Presidential and Congressional Contests 53
the sprawling areas outlying Virginia’s cities. Bush won handily, defeating Gore 54 to 42 percent. Allen’s victory was closer, with a 53 to 46 percent victory. This is due in part to Robb’s suburban appeal, which he has maintained throughout his career as governor and senator.
Rural areas once again proved to be Allen’s heartland. Known for his prac-ticed southern accent, tobacco- chewing habit, ‘aw- shucks’ demeanor, and worn cowboy boots (a striking contrast to the starched former- Marine Robb), Allen won
TABLE 3.06Voter Turnout in Presidential Elections in Virginia, 1948–2000
SOURCE: The State Board of Elections supplied fi gures for ‘total vote cast ’; either the Weldon Cooper Center for Public Service (formerly the Tayloe Murphy Institute) or the U.S. Census Bureau supplied the fi gures for the “total potential voting population.”
NOTE: The total potential voting population from 1948–68 includes all persons 21 years of age and older, while the fi gures for 1972–2000 include those ages 18 and above.
TABLE 3.07Voter Turnout in Virginia, 1976–2000
Year Chief Contest % of All Adultsa % of Registeredb
1976 President/Senator 48.6 80.81977 Governor 34.8 61.91978 Senator 32.7 60.31980 President 48.9 81.41981 Governor 37.3 64.91982 Senator 34.7 63.41984 President/Senator 51.9 81.51985 Governor 32.2 53.01988 President/Senator 50.0 77.61989 Governor 39.7 66.51990 Senator 26.4 45.81992 President 54.5 84.51993 Governor 36.9 61.11994 Senator 41.8 69.31996 President/Senator 47.6 74.31997 Governor 34.4 49.5
2000 President/Senator 52.8 68.5
SOURCES: Table 3.06 and previous volumes of Virginia Votes.a Percentage of all Virginians age 18 and over.b Percentage of those adults who had actually registered to vote and thus were qualifi ed to cast a ballot.
TABLE 3.08Percent of Registered Actually Voting for President, 1980–2000
Presidential
Year
Percent of Registered
Actually Voting
1980 81.41984 81.51988 77.61992 84.51996 74.3
2000 68.5
54 Virginia Votes ✰ 1999–2002
TABLE 3.09The Urban Virginia Vote, General Election for President and U.S. Senate, 2000
Percent of Votes Cast For Percent of Votes Cast For
Urban Measure Percent of Total Vote Gore (D) Bush (R) Robb (D) Allen (R)
SOURCE: Compiled from offi cial elections results of the State Board of Elections
NOTE: Party affi liations are abbreviated as (D) = Democrat; (R) = Republican. The votes for other third-party candidates, independents, and write-ins were not tabulated for this table.a Includes cities of Alexandria, Chesapeake, Colonial Heights, Fairfax, Falls Church, Fredericksburg, Hampton, Hopewell, Manassas, Manassas Park, Newport News, Norfolk, Petersburg, Poquoson, Portsmouth, Richmond, Virginia Beach, and Williamsburg; and the counties of Arlington, Caroline, Charles City, Chesterfi eld, Clarke, Dinwiddie, Fairfax, Fauquier, Hanover, Henrico, James City, Loudon, New Kent, Prince George, Prince William, Spotsylvania, Staff ord, and York.b The nine Metropolitan Statistical Areas (MSAs) for Virginia, as established by the U.S. Census Bureau, are Charlottesville, Danville, Lynchburg, Washington, D.C., Newport News-Hampton, Norfolk-Portsmouth, Petersburg-Colonial Heights, Richmond, and Roanoke. Central Cities and suburbs are included in the MSA fi gures. The Charlottesville and Danville MSAs were fi rst designated after the 1980 census.c All Virginia localities not included in either an MSA or the Urban Corridor.
TABLE 3.10Major Statewide Elections in Virginia by Demographic and Black Voting Patterns, 1969–2000
Percent for Winner
Election Central Cities Suburbs Black Vote
GENERAL ELECTIONS
1969 Governor, Linwood Holton (R) 50.9% 56.5% 37.2%1970 U.S. Senator, Harry Byrd, Jr. (I) 52.2 55.9 3.01971 Lt. Governor, Henry Howell (I) 50.6 39.8 91.71972 President, Richard Nixon (R) 60.3 70.1 8.81972 U.S. Senate, William Scott (R) 42.5 52.7 6.71973 Governor, Mills Godwin (R) 43.2 54.6 5.71976 President, Gerald Ford (R) 43.6 53.9 5.01976 U.S. Senate, Harry Byrd, Jr. (I) 51.4 55.9 4.41977 Governor, John Dalton (R) 47.9 59.9 5.01977 Lt. Governor, Charles Robb (D) 61.2 51.1 94.91977 Attorney General, Marshall Coleman (R) 47.7 56.6 32.71978 U.S. Senate, John Warner (R) 45.4 53.7 7.11980 President, Ronald Reagan (R) 41.3 58.4 3.41981 Governor, Charles Robb (D) 64.5 49.5 96.41981 Lt. Governor, Dick Davis (D) 67.2 52.3 95.51981 Attorney General, Gerald Baliles (D) 62.7 45.4 95.91982 U.S. Senate, Paul Trible (R) 39.6 55.1 5.71984 President, Ronald Reagan (R) 47.9 66.8 8.21984 U.S. Senate, John Warner (R) 57.6 72.9 21.21985 Governor, Gerald Baliles (D) 66.2 51.5 94.11985 Lt. Governor, Douglas Wilder 64.4 48.8 96.61985 Attorney General, Mary Sue Terry (D) 71.3 58.6 95.61988 President, George Bush (R) 45.2 63.4 8.61988 U.S. Senate, Charles Robb(D) 76.1 70.3 83.71989 Governor, Douglas Wilder (D) 68.5 47.0 96.21989 Lt. Governor, Donald Beyer (D) 64.9 53.4 87.81989 Attorney General, Mary Sue Terry (D) 72.7 61.6 94.71990 U.S. Senate, John Warner (R) 78.0 80.9 64.21992 President, George Bush (R) 33.1 47.1 7.01993 Governor, George Allen (R) 46.5 59.9 11.41993 Lt. Governor, Donald Beyer (D) 64.6 54.2 90.91993 Attorney General, James Gilmore (R) 46.1 57.7 10.6
CHAPTER 3 ✰ The 2000 Presidential and Congressional Contests 55
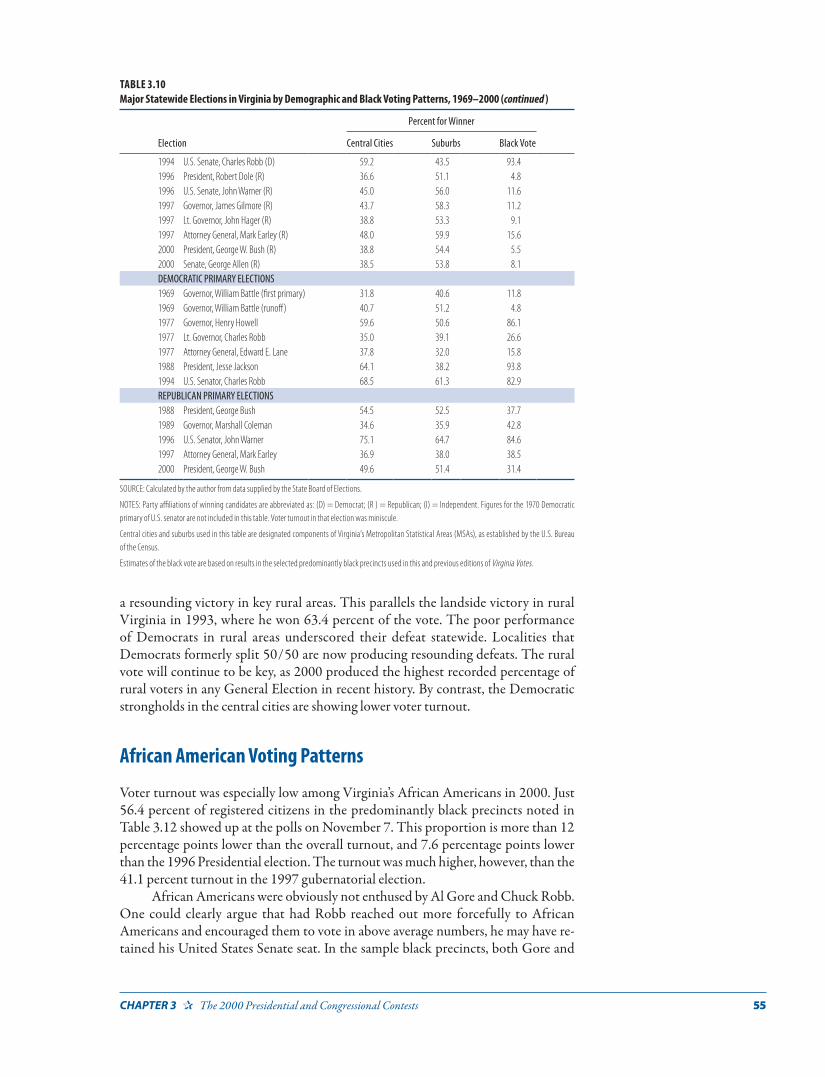
a resounding victory in key rural areas. This parallels the landside victory in rural Virginia in 1993, where he won 63.4 percent of the vote. The poor performance of Democrats in rural areas underscored their defeat statewide. Localities that Democrats formerly split 50 / 50 are now producing resounding defeats. The rural vote will continue to be key, as 2000 produced the highest recorded percentage of rural voters in any General Election in recent history. By contrast, the Democratic strongholds in the central cities are showing lower voter turnout.
African American Voting Patterns
Voter turnout was especially low among Virginia’s African Americans in 2000. Just 56.4 percent of registered citizens in the predominantly black precincts noted in Table 3.12 showed up at the polls on November 7. This proportion is more than 12 percentage points lower than the overall turnout, and 7.6 percentage points lower than the 1996 Presidential election. The turnout was much higher, however, than the 41.1 percent turnout in the 1997 gubernatorial election.
African Americans were obviously not enthused by Al Gore and Chuck Robb. One could clearly argue that had Robb reached out more forcefully to African Americans and encouraged them to vote in above average numbers, he may have re-tained his United States Senate seat. In the sample black precincts, both Gore and
TABLE 3.10Major Statewide Elections in Virginia by Demographic and Black Voting Patterns, 1969–2000 (continued )
Percent for Winner
Election Central Cities Suburbs Black Vote
1994 U.S. Senate, Charles Robb (D) 59.2 43.5 93.41996 President, Robert Dole (R) 36.6 51.1 4.81996 U.S. Senate, John Warner (R) 45.0 56.0 11.61997 Governor, James Gilmore (R) 43.7 58.3 11.21997 Lt. Governor, John Hager (R) 38.8 53.3 9.11997 Attorney General, Mark Earley (R) 48.0 59.9 15.62000 President, George W. Bush (R) 38.8 54.4 5.52000 Senate, George Allen (R) 38.5 53.8 8.1DEMOCRATIC PRIMARY ELECTIONS
1969 Governor, William Battle (fi rst primary) 31.8 40.6 11.81969 Governor, William Battle (runoff ) 40.7 51.2 4.81977 Governor, Henry Howell 59.6 50.6 86.11977 Lt. Governor, Charles Robb 35.0 39.1 26.61977 Attorney General, Edward E. Lane 37.8 32.0 15.81988 President, Jesse Jackson 64.1 38.2 93.81994 U.S. Senator, Charles Robb 68.5 61.3 82.9REPUBLICAN PRIMARY ELECTIONS
1988 President, George Bush 54.5 52.5 37.71989 Governor, Marshall Coleman 34.6 35.9 42.81996 U.S. Senator, John Warner 75.1 64.7 84.61997 Attorney General, Mark Earley 36.9 38.0 38.5
2000 President, George W. Bush 49.6 51.4 31.4
SOURCE: Calculated by the author from data supplied by the State Board of Elections.
NOTES: Party affi liations of winning candidates are abbreviated as: (D) = Democrat; (R ) = Republican; (I) = Independent. Figures for the 1970 Democratic primary of U.S. senator are not included in this table. Voter turnout in that election was miniscule.
Central cities and suburbs used in this table are designated components of Virginia’s Metropolitan Statistical Areas (MSAs), as established by the U.S. Bureau of the Census.
Estimates of the black vote are based on results in the selected predominantly black precincts used in this and previous editions of Virginia Votes.
56 Virginia Votes ✰ 1999–2002
Robb received over 90 percent of the African American vote, with Gore winning 93.2 percent and Robb netting 91.8 percent of the vote. (Note that these percent-ages were higher than those recorded on Election Day exit polls. The explanation is relatively simple: upper- middle and high income blacks are more likely to live in the suburbs and to vote for Republican candidates, and while an exit poll samples this group, a collection of inner- city precincts necessarily excludes them.)
Incidentally, George Allen did worse in the African American precincts in the Senate race than he did running for governor in 1993 when he received 11.4 percent. George W. Bush also did less well than his father’s 7.0 percent in the 1992 presiden-tial election. Although former Governor Doug Wilder helped campaign for Chuck Robb in the closing weeks, Robb garnered 91.8 percent in the majority black pre-cincts, a slight drop from his 93.4 percent in 1994.
TABLE 3.11Metropolitan Proportions of Statewide Vote in Virginia, 1969–2000
Percent of Statewide Vote
Central Cities Suburbs
GENERAL ELECTIONS
1969 Governor 21.5% 35.0%1970 U.S. Senator 22.6 35.41971 Lieutenant Governor 18.6 28.41972 President 21.7 41.21973 Governor 22.0 37.61976 President 20.1 41.51977 Governor 20.6 39.01978 U.S. Senator 19.8 39.11980 President 17.0 44.31981 Governor 17.8 46.51982 U.S. Senator 18.0 46.91984 President 16.8 49.31985 Governor 17.1 47.51987 Lottery Referendum 15.1 48.51988 President 15.0 52.61989 Governor 22.5 48.61990 U.S. Senator 13.5 61.01992 President 13.7 60.01993 Governor 18.1 58.21994 U.S. Senator 17.9 59.61996 President 17.2 60.61997 Governor 17.2 58.62000 President 15.7 62.1DEMOCRATIC PRIMARIES
1969 Governor (fi rst primary) 28.1 26.31969 Governor (runoff ) 27.3 28.81977 Governor 26.9 37.81988 President 25.4 45.51994 U.S. Senator 24.4 48.2REPUBLICAN PRIMARIES
1988 President 13.6 59.71989 Governor 15.0 55.61996 U.S. Senator 19.1 64.51997 Attorney General 17.1 64.6
2000 President 14.3 69.6
CHAPTER 3 ✰ The 2000 Presidential and Congressional Contests 57
TABLE 3.12Voting in Selected Predominantly Black Precincts in Virginia Cities, General Election for President and U.S. Senate, 2000
City
Number of
Precincts
Total Votes
Cast
Percent of
Registered Voting Gore (D) Bush (R) Robb (D) Allen (R)
Average of All Votes Cast in Selected Precincts 56.40% 93.20% 5.50% 91.80% 8.10%
SOURCE: Offi cial election results from the State Board of Elections.
NOTES: Party affi liations are abbreviated as (D) = Democrat; (R) = Republican. Presidential percentages do not always total 100% since scattered votes were cast for the other independent or minor party candidates on the ballot. a Charlottesville: Benjamin Tonsler (formerly Firehouse) precinctb Chesapeake: South Norfolk Fire Station precinctc Emporia: Precinct 2d Hampton: Pembroke and Phenix precinctse Newport News: Chestnut, Dunbar, Huntington, Jeff erson, Magruder, Marshall, Newsome Park, and Washington precinctsf Norfolk: Berkely, Bowling Park, Brambleton, Campostella, Chesterfi eld, Monroe, Park Place, Rosemont, Union Chapel, and Young Park precinctsg Petersburg: 5th Ward—1st precinct, 5th Ward—2nd precinct, 6th Ward—1st precinct, and 6th Ward—2nd precinct.h Portsmouth: Precincts 26 and 27i Richmond: Precincts 301, 303, 304, 306, 602, 604, 606, 608, 701, 702, 703, 704, 705, 707, and 802.
TABLE 3.13Voter Turnout in Selected Black Precincts vs. Statewide Turnout in Virginia, 1976–2000
Year Election
Overall Turnout
(% of Registered )
Selected Black Precincts
(% of Registered)
% Black Turnout Exceeds (+) or
Underachieves (–) Overall Turnout
1976 President 80.8 76.4 –4.41977 Governor 61.9 62.8 0.91978 U.S. Senator 60.3 56.4 –3.91980 President 81.3 75.4 –5.91981 Governor 64.9 67.5 2.61982 U.S. Senator 65.1 68.9 3.81984 President 81.5 72.6 –8.91985 Governor 53.0 53.9 0.91987 Lottery/Gen. Assembly 59.1 49.6 –9.51988 President 77.6 64.4 –13.21989 Governor 66.5 72.6 6.11990 U.S. Senator 45.8 31.7 –14.11992 President 84.5 72.0 –12.51993 Governor 61.1 50.5 –10.61994 U.S. Senator 69.3 64.0 –5.31996 President 74.3 64.0 –10.31997 Governor 49.5 41.1 –8.4
2000 President 68.5 56.4 –12.1
SOURCE: Previous editions of Virginia Votes.
NOTES: Overall turnout includes black turnout; therefore, the diff erential between black and white turnout in each year is obviously greater than the fi gures in this column can indicate.
Black turnout is measured by the use of the predominantly black precincts cited to analyze the black vote in this volume; see notes to Table 3.12 for identifi cation for these precincts.
58 Virginia Votes ✰ 1999–2002
Public Opinion Polling
For the most part, the Virginia pollsters did an admirable job of predicting close Senate and Presidential contests in 2000. As usual, Mason- Dixon Opinion Research was the most accurate, closely predicting the margin of victories for both Republican candidates. Due to the national attention shed on the Robb / Allen contest, it was an ambitious year for polling in Virginia, with most major newspapers within the Commonwealth, including The Washington Post and The Richmond Times- Dispatch, conducting independent polling. The pollsters were, for the most part, correct. The main exception to this was the joint polling conducted by Old Dominion University and The Virginian- Pilot, which predicted Bush’s victory closely but overestimated Allen’s margin of victory over Robb. The Commonwealth Poll, conducted by Virginia Commonwealth University, had a similar problem, but to a much worse extent. They did not conduct a fi nal poll for the presidential race, but their predic-tion of a 15 percent victory for Allen was substantially diff erent from the fi nal results, Allen won by a mere 4.5 percent.
2000 Elections for U.S. House of Representatives
With the 2000 retirements of Herb Bateman (R- 1st), Owen Pickett (D- 2nd), and Tom Bliley, Jr. (R- 7th), Virginia’s infl uence in the United States Congress would take a substantial hit following the election. The three legislators had a combined 52 years of service in Congress, and held important positions on key committees, including Bliley’s important service as chairman of the House Commerce Committee. Bateman died on September 11, 2000, aft er representing the 1st district for 18 years. Still, the 2000 elections, to no one’s surprise, saw all eight incumbents retain their seats, while Republicans carried all three of the open seats.
As expected, Delegate Jo Ann Davis, who had survived a tough 5- person pri-mary, easily defeated Democrat and former Fredericksburg Mayor Lawrence Davies, Independent Josh Billings, and Libertarian candidate Sharon Wood with 57.5 percent of the vote in the heavily Republican 1st district. In the military and shipyard- heavy
TABLE 3.14Public Opinion-Poll Tracking, Presidential and U.S. Senate Elections in Virginia, 2000
Mason-Dixon Polling and Research, Inc. RTD/News 12 Commonwealth Poll (VCU)
Sept. 7–8, ’99 July 12–14 Sept. 13–16 Oct. 24–25 Oct. 30–31 Sept. 22–Oct. 2 May 1–9 Oct. 18–24
PRESIDENT
Al Gore 32% 38% 39% 41% 41% 39% 41% —George W. Bush 51 49 49 48 49 46 45 —Undecided 9 10 10 7 6 3 10 —U.S. SENATE
Charles S. Robb 38 39 41 44 44 42 40 39George Allen 50 49 48 47 49 45 41 54Undecided 12 12 11 9 7 13 18 7MARGIN OF ERROR
SOURCE: All polls listed were random sample surveys conducted by telephone during the general election campaign. (D) indicates a Democratic polling company. Polls with an asterisk were based on a sample of likely voters.
CHAPTER 3 ✰ The 2000 Presidential and Congressional Contests 59
Tidewater 2nd district, Republicans picked up a formerly Democratic seat when state Senator Ed Schrock narrowly defeated Democrat Jody Wagner. Wagner, a well- funded moderate who had never held elective offi ce, did unexpectedly well by receiv-ing 48.0 percent of the vote in a district that by all accounts should have been won easily by the Republican candidate. Because it off ered a strong chance to switch col-umns in a close Congress, the 2nd district seat received attention and money from the national parties. The seat was one of only seven seats that switched from Democrat to Republican in the 2000 election.
In the 7th district, conservative Republican Eric I. Cantor, a 37- year old fi ve- term member of the Virginia House of Delegates, handily defeated Democrat War-ren A. Stewart, 66.9 percent to 33.0 percent. The real race for the opportunity to suc-ceed Tom Bliley in the strongly Republican 7th was in the primary, when the Gilmore and Bliley- endorsed Cantor edged out state Senator Stephen H. Martin by a mere 263 votes. The massive landslide by Cantor in the contested general election was not the only blowout in Virginia in 2000, as incumbents Virgil Goode (I) in the 5th (67.4 percent), Jim Moran (D) in the 8th (63.3 percent), Rick Boucher (D) in the 9th (69.8 percent), and Tom Davis (R) in the 11th (61.9 percent) easily overcame main- party opposition. Interestingly, the Republican Davis, won handily in the 11th district, which was carried by Democrats Al Gore and Chuck Robb in 2000.
Democrats Bobby Scott (3rd) and Norman Sisisky (4th), as well as Republican Bob Goodlatte (6th), ran unopposed, while Republican Frank Wolf from the 10th district received a minor challenge from two independent candidates, who between them garnered only 15.6 percent of the vote. The Virginia delegation for 2000 boasts six Republicans, four Democrats, and one Independent, although the Independent, Virgil Goode, caucuses with Congressional Republicans. The longest- serving Congressmen are Frank Wolf, Norman Sisisky, and Rick Boucher, who share over 56 years of combined experience on Capitol Hill.
As seen in Table 3.17, Republicans carried 46.7 percent of the votes cast in all the Congressional districts statewide, while Democrats garnered 43.7 percent of the overall vote. In the party- contested races, Republicans came in at 51.4 percent, while Democratic candidates in those races received a total of 46.4 percent. In the party- contested races, Republicans did less well than they did in 1998, but they now
Media General* ODU/Virginian-Pilot TNS Intersearch Garin-Hart-Yang (D) American Research Group Washington Post*
Sept. 22–Oct. 2 Oct. 27–Nov. 2 Aug 14–Sept. 10 Aug. 24–27 July 7–10 Sept. 13–19 Oct. 22–26
5 Virgil H. Goode (I) $558,606 143,312 67.4John W. Boyd (D) $38,455 65,387 30.7John S. Spence (I) * 3,936 1.9Write-Ins — 70 0.0District Totals $597,061 212,705 100.0
6 Robert W. Goodlatte (R) $379,324 153,338 99.3Write-Ins — 1,145 0.7District Totals $379,324 154,483 100.0
7 Warren A. Stewart (D) $69,817 94,935 33.0Eric I. Cantor (R) $1,295,358 192,652 66.9Write-Ins — 304 0.1District Totals $1,365,175 287,891 100.0
8 James P. Moran, Jr. (D) $1,185,606 164,178 63.3Demaris H. Miller (R) $202,920 88,262 34.1R V. Crickenberger (I) $14,042 3,483 1.3Rick L. Herron (I) * 2,805 1.1Write-Ins — 471 0.2District Totals $1,402,568 259,199 100.0
9 Frederick C. Boucher (D) $662,560 137,488 69.8Michael D. Osborne (R) $24,154 59,335 30.1Write-Ins — 32 0.0District Totals $686,714 196,855 100.0
10 Frank R. Wolf (R) $455,634 238,817 84.2B M. Brown (I) $6,826 28,107 9.9M A. Rossi (I) * 16,031 5.7Write-Ins — 682 0.2District Totals $462,460 283,637 100.0
11 Thomas M. Davis (R) $1,461,162 150,395 61.9Michael L. Corrigan (D) $71,649 83,455 34.3R K. McBride (I) $10,781 4,774 2.0C. W. Levy (I) * 4,059 1.7Write-Ins — 285 0.1District Totals $1,543,592 242,968 100.0
STATE TOTALS $9,428,628
NOTE: * information not available.
CHAPTER 3 ✰ The 2000 Presidential and Congressional Contests 61
TABLE 3.16Virginia General Election Results for U.S. Representatives, 1980–2000
District Incumbent as of 2000 (Party) Year of First Election 1980 1982 1984 1986 1988 1990 1992 1994 1996 1998 2000
1 JoAnn S. Davis (R) 2000 57.52 Edward Schrock (R) 2000 52.03a Robert “Bobby” Scott (D) 1992 78.6 79.4 82.1 76.0 97.7*4 Norman Sisisky (D) 1982 54.4 99.9* 99.8* 99.9* 78.3* 68.4 61.6 78.6 97.0* 98.9*5 Virgil Goode (I) 1996 60.8 98.9* 67.46 Robert “Bob” Goodlatte (R) 1992 60.0 99.9* 67.0 69.3 99.3*7 Eric Cantor (R) 2000 66.98 James Moran (D) 1990 51.7 56.1 59.3 66.4 66.7 63.39 Frederick “Rick” Boucher (D) 1982 50.4 52.0 99.0 63.4 97.1* 63.1 58.8 65.0 60.9 69.810 Frank R. Wolf (R) 1980 51.1 52.7 62.5 60.2 68.0 61.5 63.6 87.3 72.0 71.6 84.2*
11a Thomas M. Davis (R) 1994 52.9 64.1 81.7* 61.9
SOURCE: Compiled from offi cial election results of the State Board of Elections.
NOTES: Party affi liations are abbreviated as (D) = Democrat; (R) = Republican; (I) = Independent.
* Denotes an instance where the incumbent ran unopposed or was opposed only by an independent or minor candidate.a The third, a black-majority District, and the Eleventh district in Northern Virginia were newly created by the General Assembly after the 1990 census.
TABLE 3.17Vote by Party, Virginia General Elections for U.S. Representatives, 1966–2000
All House Elections Democrats 1,060,484 Republicans 1,131,999 Others 229,246Party-Contested Elections Only Democrats 667,783 Republicans 739,844
Others 30,629
SOURCE: Compiled from offi cial results of the State Board of Elections.
NOTES: The ‘others’ category includes write-ins, independents, and third-party candidates.
The total number of U.S. House seats for Virginia was ten until 1992. Beginning with the 1992 election, Virginia’s allocation increased to eleven.
have more seats, proving that there is not necessarily a strong correlation between the average statewide vote and the delegation Virginia sends to the U.S. House.
Democrats in the past decade have done well in party contested elections, win-ning majorities in 1992, 1994, and 1996. Since 1998, however, the Commonwealth has witnessed a trend toward Republican dominance on the Congressional level.
62 Virginia Votes ✰ 1999–2002
2000 Virginia Campaign Money: U.S. Senate and U.S. House Races
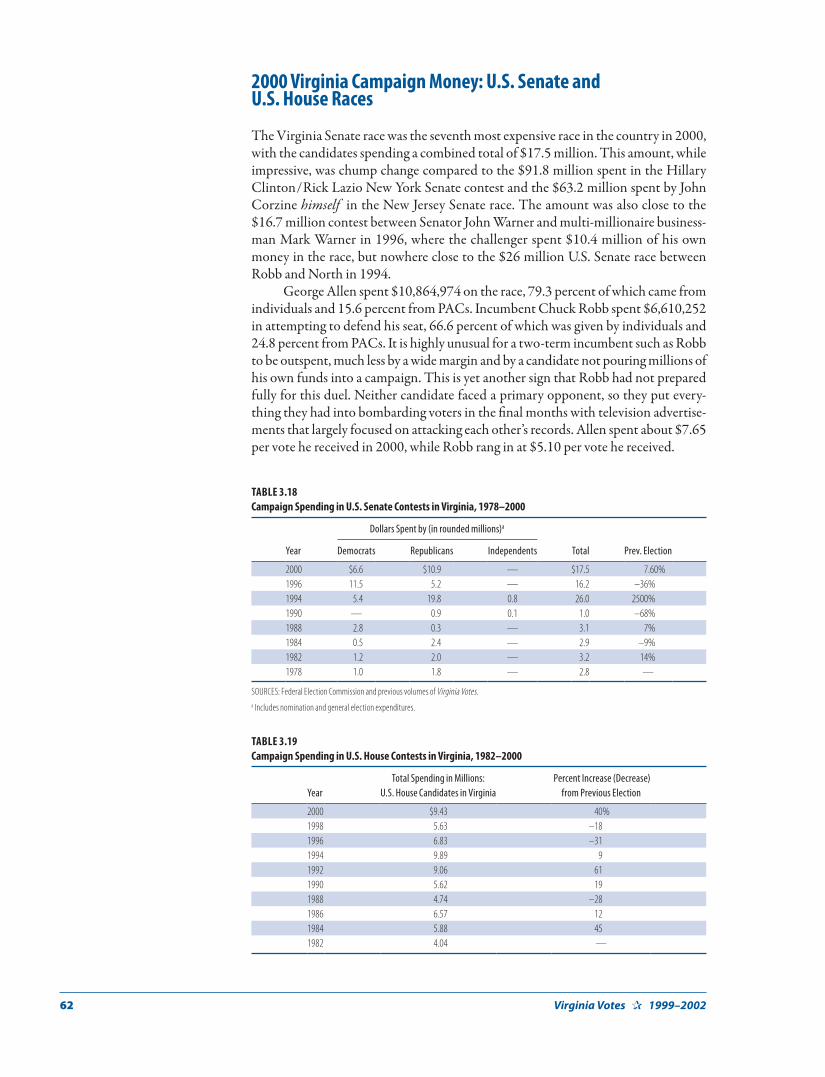
The Virginia Senate race was the seventh most expensive race in the country in 2000, with the candidates spending a combined total of $17.5 million. This amount, while impressive, was chump change compared to the $91.8 million spent in the Hillary Clinton / Rick Lazio New York Senate contest and the $63.2 million spent by John Corzine himself in the New Jersey Senate race. The amount was also close to the $16.7 million contest between Senator John Warner and multi- millionaire business-man Mark Warner in 1996, where the challenger spent $10.4 million of his own money in the race, but nowhere close to the $26 million U.S. Senate race between Robb and North in 1994.
George Allen spent $10,864,974 on the race, 79.3 percent of which came from individuals and 15.6 percent from PACs. Incumbent Chuck Robb spent $6,610,252 in attempting to defend his seat, 66.6 percent of which was given by individuals and 24.8 percent from PACs. It is highly unusual for a two- term incumbent such as Robb to be outspent, much less by a wide margin and by a candidate not pouring millions of his own funds into a campaign. This is yet another sign that Robb had not prepared fully for this duel. Neither candidate faced a primary opponent, so they put every-thing they had into bombarding voters in the fi nal months with television advertise-ments that largely focused on attacking each other’s records. Allen spent about $7.65 per vote he received in 2000, while Robb rang in at $5.10 per vote he received.
TABLE 3.18Campaign Spending in U.S. Senate Contests in Virginia, 1978–2000
Dollars Spent by (in rounded millions)a
Year Democrats Republicans Independents Total Prev. Election
CHAPTER 3 ✰ The 2000 Presidential and Congressional Contests 63
Every House incumbent substantially outspent his challenger, which may help to explain the considerable margins by which they won. Democrat Jim Moran and Republican Tom Davis were the only incumbents to spend over $1 million. Independent Virgil Goode, Democrat Rick Boucher, and Republican Frank Wolf also spent around half a million apiece defending their seats against marginal can-didates, while Democrats Bobby Scott and Norman Sisisky spent $237,345 and $56,674 respectively in their uncontested elections.
The three open- seat races were more interesting. The 1st district race be-tween Jo Ann Davis and Lawrence Davies featured modest spending (a combined $570,408). Spending in the closely contested 2nd district reached $2.1 million with both candidates receiving money from state and national committees. Wagner, the Democrat, slightly outspent her opponent Schrock, $1,110,449 to $1,016,858. Republican Eric Cantor in the strongly GOP 7th district spent nearly $1.3 million on his bid, over 18 times the amount spent by Democratic candidate Warren Stewart. Most of Cantor’s cash, though, had been spent to win the primary—the real election in this one- party district.
Due to increased competition and national focus on a couple of open seats, spending in Virginia Congressional races increased over 40 percent from $5.6 mil-lion in 1998 to over $9.4 million in 2000, comparable to the $9.89 million spent in 1994.
Constitutional Amendments
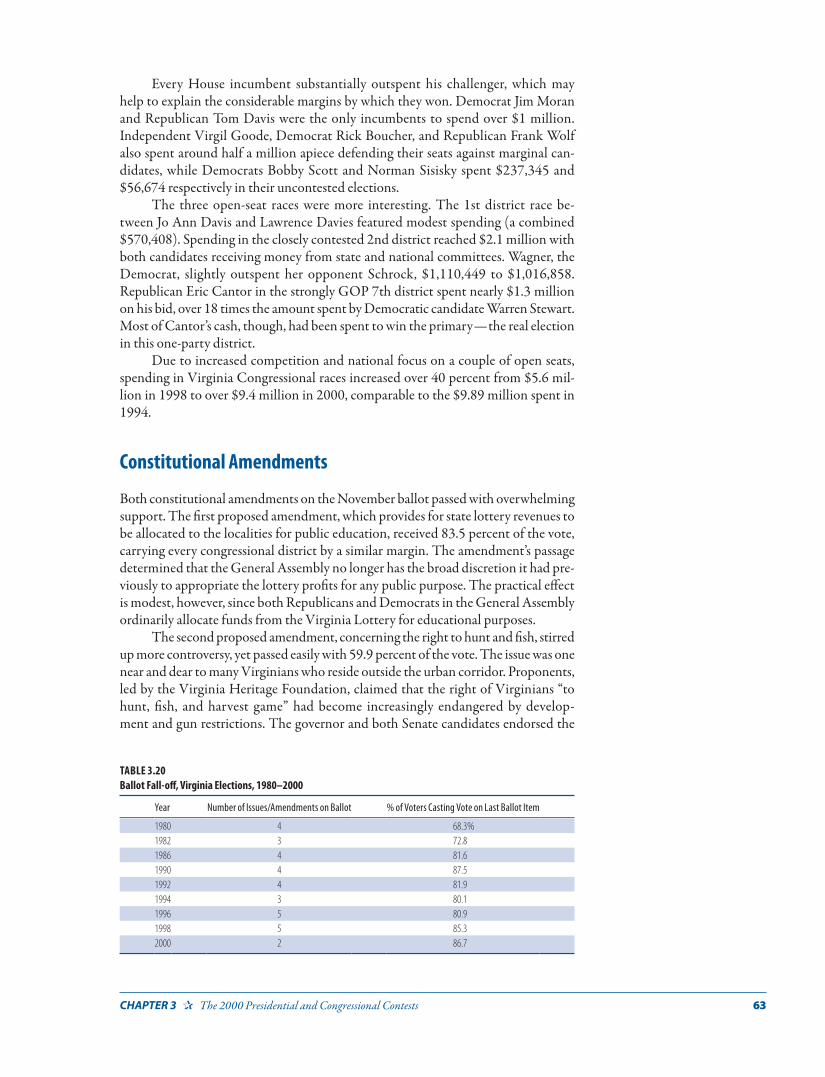
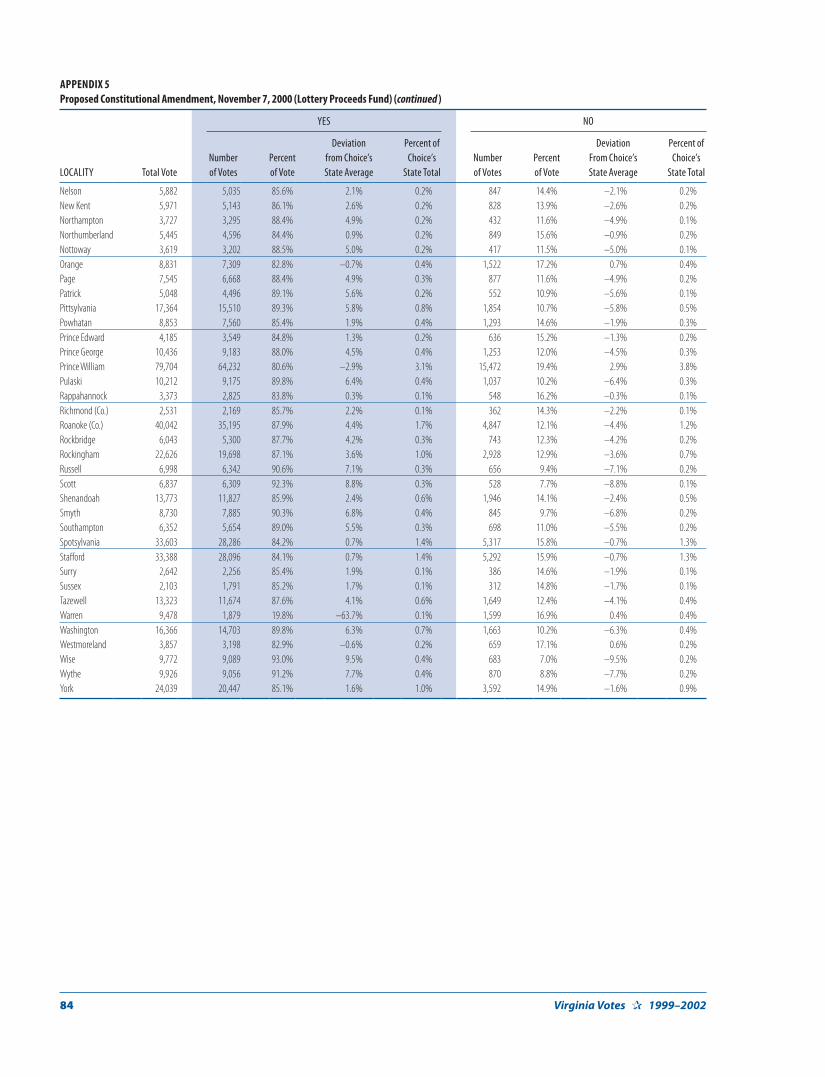
Both constitutional amendments on the November ballot passed with overwhelming support. The fi rst proposed amendment, which provides for state lottery revenues to be allocated to the localities for public education, received 83.5 percent of the vote, carrying every congressional district by a similar margin. The amendment’s passage determined that the General Assembly no longer has the broad discretion it had pre-viously to appropriate the lottery profi ts for any public purpose. The practical eff ect is modest, however, since both Republicans and Democrats in the General Assembly ordinarily allocate funds from the Virginia Lottery for educational purposes.
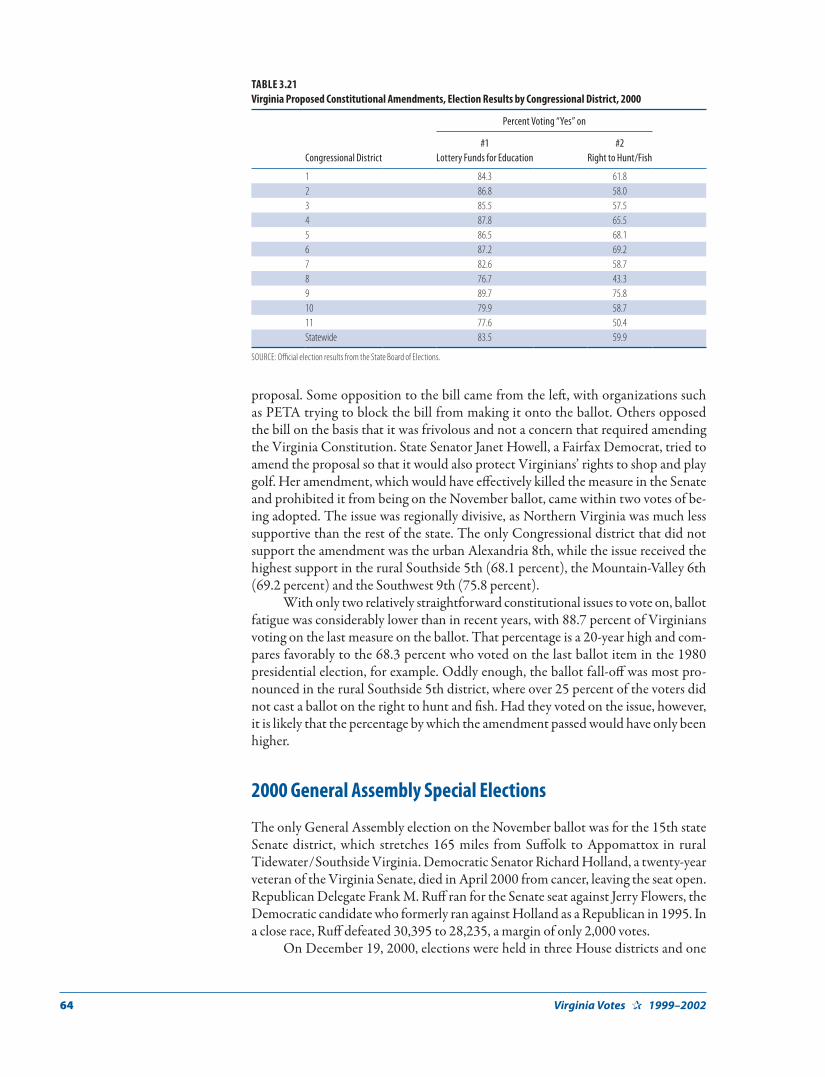
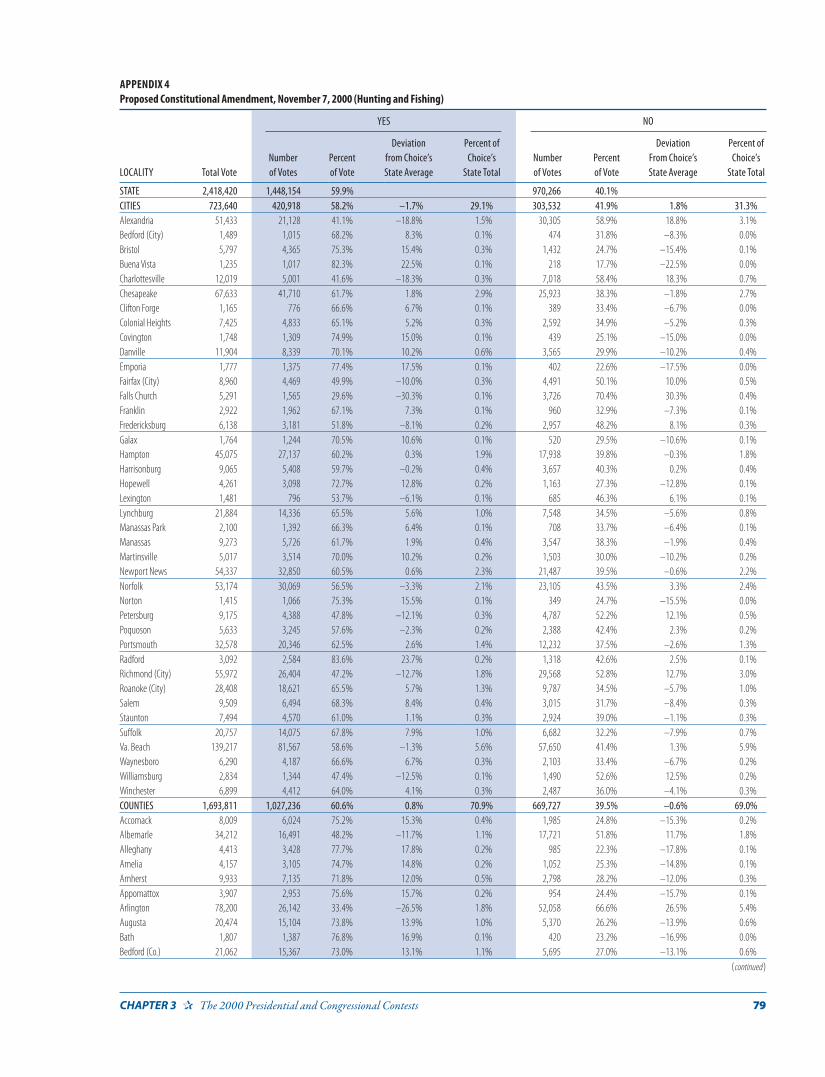
The second proposed amendment, concerning the right to hunt and fi sh, stirred up more controversy, yet passed easily with 59.9 percent of the vote. The issue was one near and dear to many Virginians who reside outside the urban corridor. Proponents, led by the Virginia Heritage Foundation, claimed that the right of Virginians “to hunt, fi sh, and harvest game” had become increasingly endangered by develop-ment and gun restrictions. The governor and both Senate candidates endorsed the
TABLE 3.20Ballot Fall-off , Virginia Elections, 1980–2000
Year Number of Issues/Amendments on Ballot % of Voters Casting Vote on Last Ballot Item
proposal. Some opposition to the bill came from the left , with organizations such as PETA trying to block the bill from making it onto the ballot. Others opposed the bill on the basis that it was frivolous and not a concern that required amending the Virginia Constitution. State Senator Janet Howell, a Fairfax Democrat, tried to amend the proposal so that it would also protect Virginians’ rights to shop and play golf. Her amendment, which would have eff ectively killed the measure in the Senate and prohibited it from being on the November ballot, came within two votes of be-ing adopted. The issue was regionally divisive, as Northern Virginia was much less supportive than the rest of the state. The only Congressional district that did not support the amendment was the urban Alexandria 8th, while the issue received the highest support in the rural Southside 5th (68.1 percent), the Mountain- Valley 6th (69.2 percent) and the Southwest 9th (75.8 percent).
With only two relatively straightforward constitutional issues to vote on, ballot fatigue was considerably lower than in recent years, with 88.7 percent of Virginians voting on the last measure on the ballot. That percentage is a 20- year high and com-pares favorably to the 68.3 percent who voted on the last ballot item in the 1980 presidential election, for example. Oddly enough, the ballot fall- off was most pro-nounced in the rural Southside 5th district, where over 25 percent of the voters did not cast a ballot on the right to hunt and fi sh. Had they voted on the issue, however, it is likely that the percentage by which the amendment passed would have only been higher.
2000 General Assembly Special Elections
The only General Assembly election on the November ballot was for the 15th state Senate district, which stretches 165 miles from Suff olk to Appomattox in rural Tidewater / Southside Virginia. Democratic Senator Richard Holland, a twenty- year veteran of the Virginia Senate, died in April 2000 from cancer, leaving the seat open. Republican Delegate Frank M. Ruff ran for the Senate seat against Jerry Flowers, the Democratic candidate who formerly ran against Holland as a Republican in 1995. In a close race, Ruff defeated 30,395 to 28,235, a margin of only 2,000 votes.
On December 19, 2000, elections were held in three House districts and one
SOURCE: Offi cial election results from the State Board of Elections.
CHAPTER 3 ✰ The 2000 Presidential and Congressional Contests 65
Senate district to replace members elected to other positions in November. In the Virginia Beach 7th state Senate district, which had been formerly held by now- Congressman Ed Schrock, Republican Frank Wagner coasted to an easy 68.8 per-cent to 31.1 percent win over Democrat Louisa Strayhorn, with 11,041 votes to Strayhorn’s 4,998. Republicans also were victorious in retaining three House seats in the special election. Tommy Wright, Jr., from Mecklenburg defeated Democrat Frank Bacon in the Southside 61st district for the seat left vacant by the election
FIGURE 3.09The 2000 Vote on Lottery Proceeds, Constitutional Amendment, by Cities
SOURCE: Offi cial Election Results provided by the State Board of Elections.
FIGURE 3.10The 2000 Vote on Lottery Proceeds, Constitutional Amendment, by Counties
SOURCE: Offi cial Election Results provided by the State Board of Elections.
66 Virginia Votes ✰ 1999–2002
of Ruff to the Virginia State Senate (Wright won by a margin of almost 900 votes, 5,097 to 4,205). In suburban Richmond, Republican John O’Bannon handily de-feated Independent Sterling Hening, 2,950 to 436, to retain control of Eric Cantor’s former seat in one of the most Republican districts in Virginia. The closest race pit-ted Republican Melanie Rapp and Democrat Patrick Pettitt for the York County 96th, left vacant by Jo Ann Davis’ election to Congress. Rapp edged out Pettitt, 51.1 percent to 48.8 percent (5,049 to Pettit’s 4,819) in a low- turnout race.
The fi nal special election was held January 9, 2001, in the 21st House district
FIGURE 3.11The 2000 Vote on the Right to Hunt, Fish, and Harvest Game, Constitutional Amendment, by Cities
SOURCE: Offi cial Election Results provided by the State Board of Elections.
FIGURE 3.12The 2000 Vote on the Right to Hunt, Fish, and Harvest Game, Constitutional Amendment, by Counties
SOURCE: Offi cial Election Results provided by the State Board of Elections.
CHAPTER 3 ✰ The 2000 Presidential and Congressional Contests 67
TABLE 3.22Ballot Fall-off , Virginia General Election, 2000
Percent of Votes Cast for Offi ce to Total Persons Voting
Congressional District President U.S. Senator U.S. Representative
SOURCE: Compiled from offi cial election results of the State Board of Elections.
* Denotes a race in which the incumbent was either unopposed or opposed by an independent or third-party candidate(s).
TABLE 3.23Special Election Results in Virginia , 2000
Race Candidate (Party) Total Number of Votes Percent
15th State Senate District—November 7, 2000 Jerry B. Flowers, III (D) 28,235 47.5%Frank M. Ruff (R) 30,395 51.1Amos D. Neill (I) 826 1.4Write-ins 16 0.0Total 59,477 100.0
7th State Senate District—December 19, 2000 Frank W. Wagner (R) 11,041 68.8Louisa M. Strayhorn (D) 4,998 31.1Write-ins 19 0.1Total 16,058 100.0
61st State House District—December 19, 2000 Thomas C. Wright, Jr. (R) 5,097 54.8Frank W. Bacon (D) 4,205 45.2Write-ins 5 0.1Total 9,307 100.0
73rd State House District—December 19, 2000 John M. O’Bannon (R) 2,950 87.0Sterling W. Hening (I) 436 12.9Write-ins 6 0.2Total 3,392 100.0
96th State House District—December 19, 2000 Melanie L. Rapp (R) 5,049 51.1Patrick R. Pettitt (D) 4,819 48.8Write-ins 9 0.1Total 9,877 100.0
21st State House District—January 19, 2001 John J. Welch, III 2,533 61.4Alan P. Holmes 1,572 38.1Write-ins 18 0.4
Total 4,123 100.0
68 Virginia Votes ✰ 1999–2002
in Virginia Beach to replace state Senator- elect Frank Wagner. In a brief but bitter campaign full of negative attacks, Republican John Welch defeated rival Democrat Alan Holmes in a landslide, although only 11 percent of registered voters in the district cast a ballot. Welch defeated Holmes with 2,533 to 1,572 votes. This win capped a fi ve to zero special election run for the Republicans. With the Virginia GOP maintaining all fi ve seats in the General Assembly, the Senate remained di-vided at 22 Republicans and 18 Democrats, while the House of Delegates has 47 Democrats and 52 Republicans and one Republican- Independent, Delegate Lacey Putney of Bedford.
A Retrospective Summing Up: Conservative, but Competitive
Aft er the 2000 elections, the Commonwealth of Virginia was controlled entirely by Republicans. Both houses of the state legislature, the governor, lieutenant gov-ernor, attorney general, both United States Senators, and seven of the eleven Congressmen (eight if you count conservative Independent Virgil Goode) are Republican. Republican presidential candidates have carried the Old Dominion in all but one election since 1948. Governor Jim Gilmore was even selected Chairman of the Republican National Committee by President- elect George W. Bush. The Republican Party in Virginia is at its apex. Yet the Commonwealth of Virginia is still, without a doubt, two- party competitive as we enter into the 21st century. Why and how?
Democrats, although they do not have a majority in either branch of the leg-islature, could regain control with only a few net seat gains. With the growth of Northern Virginia, Democrats have an increased long- term chance at winning state-wide offi ce, either in the governor’s mansion or in the United States Senate. It seems unlikely that Democrats will make huge strides in having more representation in the Congressional delegation or General Assembly, especially given the Republican controlled 2001 redistricting, but that is strongly underscored by the increasingly stark regional diff erences in Virginia. Democrats can win, however, with well- funded moderate candidates who run in years where circumstances allow them to win, such as economy, scandal, or a national trend against Republican candidates. ★
70 Virginia Votes ✰ 1999–2002
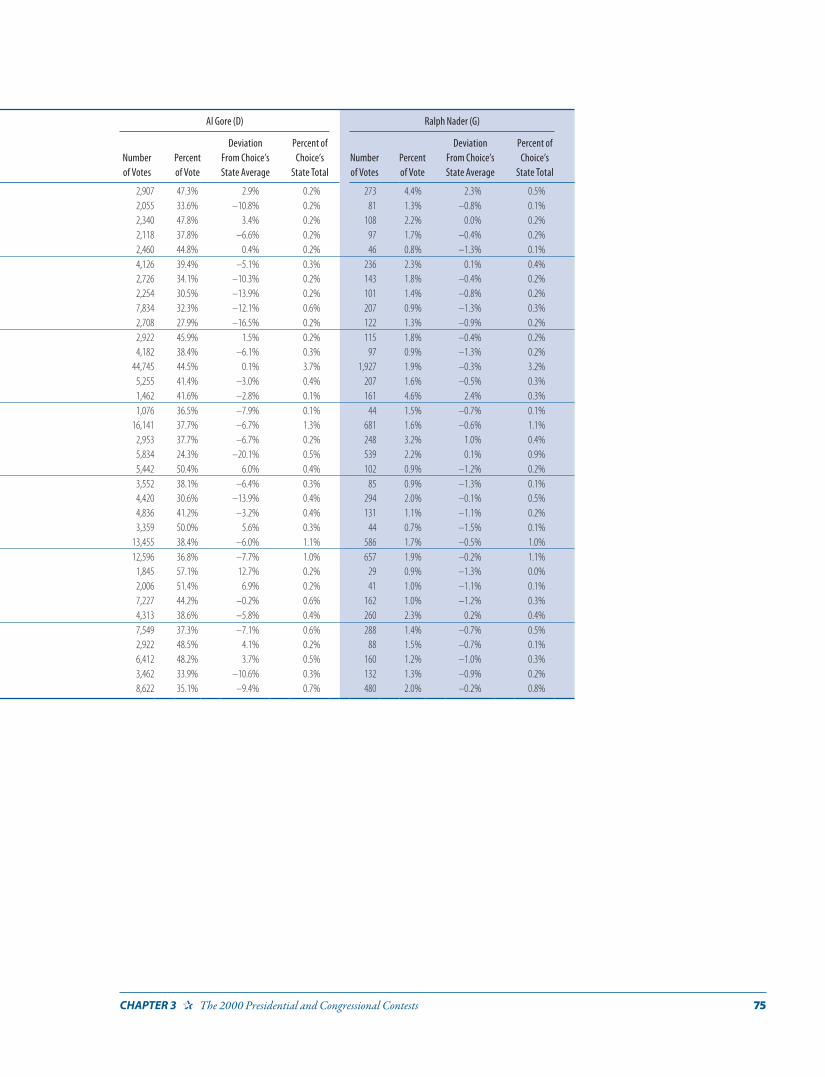
APPENDIX 2General Election for President and Vice President, November 7, 2000