59
Subliminal Communication in Human-Computer Interaction Guest Editors: Andreas Riener, Guido Kempter, Timo Saari, and Kenneth Revett Advances in Human-Computer Interaction
Subliminal Communication in Human-Computer InteractionGuest Editors: Andreas Riener, Guido Kempter, Timo Saari, and Kenneth Revett
Advances in Human-Computer Interaction

Subliminal Communication inHuman-Computer Interaction
Advances in Human-Computer Interaction
Subliminal Communication inHuman-Computer Interaction
Guest Editors: Andreas Riener, Guido Kempter, Timo Saari,and Kenneth Revett

Copyright © 2011 Hindawi Publishing Corporation. All rights reserved.
This is a special issue published in volume 2011 of “Advances in Human-Computer Interaction.” All articles are open access articlesdistributed under the Creative Commons Attribution License, which permits unrestricted use, distribution, and reproduction in anymedium, provided the original work is properly cited.

Advances in Human-Computer Interaction
Editorial Board
Ray Adams, UKSunil K. Agrawal, USADaniel Ashbrook, USAArmando Bennet Barreto, USAMarina Bers, USAMark Billinghurst, New ZealandFrank Biocca, USACathy Bodine, USA
Michael Boronowsky, GermanyCaroline G. L. Cao, USAAdrian David Cheok, SingaporeMark Dunlop, UKKerstin S. Eklundh, SwedenHolger Kenn, GermanyKiyoshi Kiyokawa, JapanRichard Kline, USA
Antonio Kruger, GermanyPaul Lukowicz, GermanyIan Oakley, PortugalFrancis Quek, USAAnthony Savidis, GreeceHideaki Takanobu, JapanArun Kumar Tripathi, GermanyManfred Tscheligi, Austria

Contents
Subliminal Communication in Human-Computer Interaction, Andreas Riener, Guido Kempter,Timo Saari, and Kenneth RevettVolume 2011, Article ID 156028, 3 pages
Benefits of Subliminal Feedback Loops in Human-Computer Interaction, Walter RitterVolume 2011, Article ID 346492, 11 pages
Subliminal Cues While Teaching: HCI Technique for Enhanced Learning, Pierre Chalfoun andClaude FrassonVolume 2011, Article ID 968753, 15 pages
How the Interpretation of Drivers’ Behavior in Virtual Environment Can Become a Road Design Tool: ACase Study, Marco Pasetto and Stefano Damiano BarbatiVolume 2011, Article ID 673585, 10 pages
The Sensorium: A Multimodal Neurofeedback Environment, Thilo HinterbergerVolume 2011, Article ID 724204, 10 pages
A Functional Driver Analyzing Concept, Tobias Islinger, Thorsten Kohler, and Christian WolffVolume 2011, Article ID 413964, 4 pages

Hindawi Publishing CorporationAdvances in Human-Computer InteractionVolume 2011, Article ID 156028, 3 pagesdoi:10.1155/2011/156028
Editorial
Subliminal Communication in Human-Computer Interaction
Andreas Riener,1 Guido Kempter,2 Timo Saari,3 and Kenneth Revett4
1 Institute for Pervasive Computing, Johannes Kepler University, Altenberger Strasse 69, 4040 Linz, Austria2 UCT Research & Design Department, University of Applied Sciences Vorarlberg, Hochschulstraße 1, 6850 Dornbirn, Austria3 Department of Broadcasting Telecommunications and Mass Media, Temple University, Room 203B Annenberg Hall, Main Campus,1801 N. Broad Street, Philadelphia, PA 19122, USA
4 Department for Artificial Intelligence and Interactive Multimedia, Harrow School of Computer Science, University of Westminster,London W1B 2UW, UK
Correspondence should be addressed to Andreas Riener, [email protected]
Received 8 March 2011; Accepted 8 March 2011
Copyright © 2011 Andreas Riener et al. This is an open access article distributed under the Creative Commons AttributionLicense, which permits unrestricted use, distribution, and reproduction in any medium, provided the original work is properlycited.
1. Introduction
The research presented in this special issue focuses on sub-liminal techniques to improve human-computer interaction.Human- and computer-based interactions are ubiquitousin our everyday lives—everything from our mobiles, iPods,to a variety of computer systems creates serious cognitivedemands when switching from one to the next. When usedsimultaneously, extra cognitive demands are placed on usand the likelihood of success is dependent upon our abilityto apportion attention to multiple tasks simultaneously. Toalleviate the cognitive load associated with interacting withvaried computing-based devices, common UI’s and modesof operation should be implemented, significantly reducingthe amount of information we must store and recall. Inaddition, subtle cues which could be emitted from the deviceto assist us during our interactions, prompting us towardthe appropriate action required to effectively complete a task.These cues could be delivered in a variety of (communicationchannels), for instance, visual or auditory cues could be pro-vided according to the specific nature of the current activity.
In order to implement these features, UIs must beprovided with the means to detect the nature of the currentinteraction set, provide the subliminal cues across appro-priate channels, and evaluate their success. This approachwould benefit from a significant collaborative effort froma range of disciplines: engineering, neuroscience, computerscience, psychophysiology, and related fields. The resultof this approach provides exciting challenges which will
significantly impact society at large, making significantcontributions toward a more natural, convenient, and evenrelaxing future human-computer interface.
The main idea is to “inject” information into thehuman mind below active awareness, thus transferringsupplementary information in a subliminal style withoutadding load on the cognitive channel. The main benefit ofthis approach would be the reception of additional, essentialinformation even in the case where (almost) no capacityis left for information transmission in a traditional way. Itis anticipated that, for example, events of sudden dangerwill benefit from using this technology. Nevertheless, thequestion if subliminal persuasion actually works is still open;however, it has, in case of proven functionality, a potentialto reduce cognitive load, stress, or incorrect decisions.This assumption is based on the result of cognitive andsocial psychologists, who have learnt that stimuli presentedsubliminally can have a considerable influence over a varietyof cognitive processes, possibly even behavior.
Recently, there have been some attempts to extend cur-rent user interfaces by means of subliminal communication,with examples being multimedia-driven learning environ-ments, or operating and servicing assistants. However, mostuser interfaces are still mainly based on symbolic com-munication. Symbolic communication utilizes a selectionof graphical symbols (like icons), symbolic gestures (e.g.,pointing movements), or verbal commands. The meaning ofsuch interaction elements might be depending on everydayexperience, is defined in style guides, or is given by the
2 Advances in Human-Computer Interaction
developer arbitrarily. This results in a distinct code a user hasto learn in order to successfully operate the system. In casethe symbols used in the interface are not widely spread andunderstood, a steep learning curve is the consequence.
In contrast to this, subliminal communication requiresthe integration of spontaneous interaction mechanisms.These mechanisms are characterized by occasionally unex-pected actions and results. Therefore, usage of predefinedinteraction elements is no longer possible in the realm ofsubliminal communication, because it does not operate ondistinguishable semantic units, but rather on continuoustransitions among multimodal communication channels.Typical examples of this are natural body movements andnuances in speech of a user as an indicator for specificpsychophysiological states, as well as color and shape ofgraphical user interface elements besides vibro-tactile andacoustic feedback of a system. However, the absence ofpredefined elements imposes a big challenge on developerswho want to implement subliminal communication forhuman computer interfaces. Efficient human computerinteraction has to be ensured, without knowing in advancethe relationship of user input and required system actions.
2. Summary of Submitted Manuscripts
The special issue at hand received 12 high-quality man-uscripts, which have undergone a rigorous peer-reviewprocess where the manuscripts were reviewed by two to fourreviewers each. In the end, 5 manuscripts were selected forpublication in this issue of the AHCI Journal.
In the first paper of this special issue entitled “Benefits ofsubliminal feedback-loops in human-computer interaction”W. Ritter presents a new approach for adaptive user inter-faces whereby analogue signals obtained from the user aredeployed to subliminally alter and adapt the interface withthe aim of improving some aspect of the user performanceand/or experience. Instead of predefined mappings, the usedapproach is based on an evolutionary feedback-loop. Twopresented studies provide support for the proposed solutionby confirming significant positive effects regarding perfor-mance of users in concentration-intensive games, where theinterface or the environment has been adapted in subliminalsteps based on physiological signals. In the first study, evolu-tionary feedback loops adjusted the user interface of a mem-ory game, whereas in the second study the lighting of thetest-room was adjusted dynamically. The results show that insettings with an evolutionary feedback-loop test participantswere able to reach significantly higher scores compared to thestatic counterparts. By now, the studies covered short-termeffects only (six- and ten-minute game-duration), and long-term effects of such evolutionary feedback-loops were left outand will be investigated in future.
In the paper “Subliminal cues while teaching: HCI tech-nique for enhanced learning” P. Chalfoun and C. Frassondiscusses results from an empirical study conducted with asubliminal teaching technique aimed at enhancing learner’sperformance in intelligent systems through the use ofphysiological sensors. The applied technique uses carefully
designed positive and negative subliminal cues and projectsthem under the learner’s perceptual visual threshold. Apositive cue “answer cue” is a hint aiming to enhance thelearner’s inductive reasoning abilities and projected in a wayto help him/her figure out the solution faster but moreimportantly better. A negative cue “miscue” is also used andaims obviously at the opposite (distract the learner or leadhim to the wrong conclusion). The results obtained impres-sively show that only subliminal cues, not miscues, couldsignificantly increase learner’s performance and intuition in alogic-based problem solving task. Nonintrusive physiologicalsensors (EEG for recording brainwaves, heart rate and skinresponse to record skin conductivity) were used to recordaffective and cerebral responses throughout the experiment.The descriptive analysis, combined with the physiologicaldata, provides compelling evidence for the positive impactof answer cues on learning and intuitive decision making ina logic-based problem solving paradigm.
In the third paper of this special issue M. Pasetto and S.O. Barbati have identified that driving is mainly the resultof a psychological process that translates data, signals anddirect/indirect messages into behavior, which is continuouslyadapted to the exchange of varying stimuli between man,environment, and vehicle. These stimuli are, however, attimes not perceived and at others perceived but not under-stood by the driver, leading to unsafe behavior of vehicledrivers. In the paper “How the interpretation of drivers’behavior in virtual environment can become a road designtool. A Case Study” they analyzed driver behavior and thedynamic parameters of vehicle motion (i.e., vehicle operatingspeeds, accelerations and decelerations) after variations inroad layout and environmental conditions (e.g., daytime andnight driving) for both real driving and virtual environments(i.e., driving simulator). They have demonstrated that thedriving simulator is not only a laboratory tool useful forreproducing the trajectory of vehicles in a road environmentin a dynamic way, but also an instrument that can forecastdrivers’ behavior in different situations. During several testsin different scenarios, a statistical comparability has beenverified between speeds measured in both the virtual and realenvironment. In practice, the study puts in evidence whenand how the road environment can really be changed in orderto become more persuasive for the road users. The virtualenvironment has the potential to ascertain to what degreethis can be done.
In the paper entitled “The sensorium: A multimodalneurofeedback environment”, Th. Hinterberger presents aneurofeedback interface that allows people to experiencesignals from their subliminal psycho-physiological processesvisually and auditorily using a thought translation device. Incontrast to conventional neurofeedback devices the proposed“Sensorium” focuses on the conscious experiencing of thecomplex body signals rather than on the self-regulation of aspecific component. In the presented pilot study, test subjectshave been exposed to their ongoing brain and heart signals.Almost all of them reported an increase in well-being andfurthermore, of a widening in their body consciousness.
C. Wolff describe in their paper “A functional driver ana-lyzing concept” an overall system architecture for analyzing

Advances in Human-Computer Interaction 3
drowsiness or inattentiveness of the car driver by detectingthe driving style of a person. For driving style analysis, theyused vehicle data from the CAN-bus only.
3. Conclusion
The authors of this special issue show very diverseapproaches to an implementation of subliminal communica-tion in human-computer interaction. We believe that it notonly illustrates the potential of the application of subliminaltechniques for improving human-computer interaction, butalso highlights that there are still technical difficulties andunresolved problems limiting a broader deployment in thenear future. In the end, we would like to thank all the authors,reviewers as well as the editorial staff of Hindawi for theirexcellent work during the whole review process.
Andreas RienerGuido Kempter
Timo SaariKenneth Revett

Hindawi Publishing CorporationAdvances in Human-Computer InteractionVolume 2011, Article ID 346492, 11 pagesdoi:10.1155/2011/346492
Research Article
Benefits of Subliminal Feedback Loops inHuman-Computer Interaction
Walter Ritter
User Centered Technologies Research, University of Applied Sciences Vorarlberg, Hochschulstraße 1, 6850 Dornbirn, Austria
Correspondence should be addressed to Walter Ritter, [email protected]
Received 30 April 2010; Revised 18 August 2010; Accepted 24 August 2010
Academic Editor: Kenneth Revett
Copyright © 2011 Walter Ritter. This is an open access article distributed under the Creative Commons Attribution License, whichpermits unrestricted use, distribution, and reproduction in any medium, provided the original work is properly cited.
A lot of efforts have been directed to enriching human-computer interaction to make the user experience more pleasing or efficient.In this paper, we briefly present work in the fields of subliminal perception and affective computing, before we outline a newapproach to add analog communication channels to the human-computer interaction experience. In this approach, in additionto symbolic predefined mappings of input to output, a subliminal feedback loop is used that provides feedback in evolutionarysubliminal steps. In two studies involving concentration-intensive games, we investigated the impact of this approach. In a firststudy evolutionary feedback loops adjusted the user interface of a memory game whereas in the second study the lighting of thetest room was adjusted dynamically. The results show that in settings with an evolutionary feedback loop test participants wereable to reach significantly higher scores compared to the static counterparts. Finally, we discuss the impact that such subliminallyworking applications might have on the user’s acceptance.
1. Introduction
Would it not be great if working with our computers wouldsomehow magically make us feel better about ourselves andincrease our performance, computers that feel a little bitmore emotional than these cold static subjects we are usedto? Could computer systems make us more productive bysubliminally influencing us?
The idea of influencing human beings by means ofsubliminal stimuli has been prevalent since a long time. Thefamous experiment by Vicary in 1957, where he claimedto have subliminally persuaded visitors of a cinema to buymore Coke and Popcorn, drew big attention to the topicof subliminal persuasion. Even governments were concernedabout the impact that such subliminal persuasion might haveon the public and therefore prohibited its use. However,this experiment has been identified as fake a few years later[1]. Still, many seem to take the fake Vicary experimentas real and as a successful demonstration of the power ofsubliminal persuasion—even the laws remained, althoughmany scientists doubt that subliminal persuasion actuallyworks [2].
In this regard, it is important to make a differentiationbetween the terms subliminal persuasion and subliminalperception [3]. Scientific evidence for subliminal perceptionis well established [4–6] whereas scientific support forsubliminal persuasion is seen critically [3].
Kunst-Wilson and Zajonc [4] found out in their experi-ments that the effect of subliminal perception highly dependson the query directed to the subjects afterwards. People werepresented with subliminal presentations of geometricalfigures. Afterwards, when they had to identify the figuresthat were presented to them, they could not remember—their answers seemed to be by chance. However, when askedabout which figures they liked more, they more often thanby chance selected figures that were subliminally presentedbefore. This seems to clearly indicate that subliminallypresented information can have an effect on the feelingsof persons. The familiarity aspect might be the cause forthis [5].
Closely related to subliminal perception is the matterof unconscious information processing. If we can perceiveinformation without being aware of it, can this informationalso be processed unconsciously? Furthermore, could it be
2 Advances in Human-Computer Interaction
that information already stored somewhere in our brainmight be processed further and help us for example in theprocess of making decisions while we sleep? Perrig et al. [5]mention the example of Poincare, a French mathematician,who came to great insights during overnight. Also theexperiments performed by Dijksterhuis support this theory.He suggests that the unconscious is a much more powerfulprocessor than the conscious [7]. Gigerenzer also stresses thepower of the unconscious in decision making [8].
Bargh et al. [6] found out in their study that behaviorof persons can be influenced by subliminal or unconsciouslyprocessed information. They found out that by activatingan elderly stereotype in persons by presenting them wordsclosely related to the elderly, they walked more slowlyafter the experiment than persons that were shown otherwords. Kay et al. [9] showed that also the presence ofphysical objects can influence person’s behavior even thoughit was not consciously registered. Dijksterhuis [10] foundevidence that self-esteem of persons can be enhanced bysubliminal conditioning. Custers and Aarts conclude intheir review and analysis of research regarding pursuitof goals outside conscious awareness that basic processesrequired for goal pursuit can take place without consciousawareness [11].
All these findings show that information outside thecontext of conscious awareness can influence the feelingand behavior of a person. While this is still different frombeing able to actually persuade a person to do somethingsubliminally, these insights might be of benefit in the realmof human-computer interaction (HCI). Having a computersystem that actively uses these findings might help to enrichHCI and thus positively influence the performance of a user.
Before using this in a practical application, however, it isimportant to clarify the notion of subliminal stimuli. Merikleand Joordens [12] investigated whether or not perceptionwithout awareness (unconscious perception) and perceptionwithout attention (i.e., stimuli outside the focus of attentionare perceived) share the same underlying concept. Theyconcluded that these concepts might indeed be closelyrelated. In the realm of HCI, this could mean that it mightnot be necessary to have stimuli below the absolute thresholdlevel of a person, which would be different for each individualperson. It might actually be sufficient if users concentratedon a task do not notice given stimuli, that is, stimuli can notbe identified verbally. In our work, whenever we use the wordsubliminal, we therefore refer to the threshold of consciousawareness, also referred to as subjective threshold [13].
Another important aspect in HCI is that of communi-cation itself. Communication regarding computer systemscurrently is mostly limited to symbolic communication.Everything we enter into a computer is mapped to aspecific meaning, LIKE every keypress, every menu selection,every mouse movement. HCI is mostly reduced to thecontent aspect of communication. However, as research onhuman communication has shown, there are more levels incommunication. von Thun [14] describes a four-earmodelwhere each ear is directed to another aspect in com-munication (content, appeal, relationship, self-disclosure).Watzlawick et al. [15] propose that every communication
besides the content aspect also features a relation aspect.Norman [16] describes three levels of information process-ing: the visceral level (mostly unconscious, automated), thebehavioral level (learned skills—mostly subconscious), andthe reflective level (conscious processing, self-awareness),also suggesting that communication involves more thanthe content-aspect. Picard [17] points out that humansengage in interactions with computers in very much thesame way as in face-to-face interactions between persons,attributing emotional awareness to machines. However,on the computer side human-computer interaction isstill mostly limited to explicit symbolic communication.Kempter et al. [18] propose that human-computer interac-tion should be enriched by a nonsymbolic form of analogcommunication.
Symbolic communication in HCI mostly consists ofusing a combination of icons, gestures, and textual or evenverbal commands [19]. Metaphors are introduced helping totranslate between the computer and human worlds [20]. Still,the meaning of these components might depend on everydayexperiences, culture, and prior knowledge. Often meaning isdefined in style guides or even assigned arbitrarily by devel-opers, requiring the user to learn new paradigms. However,there have already been efforts to enrich symbolic user inter-faces with aspects of analog communication, like in oper-ating and servicing assistants [21] or multimedia enhancedlearning environments [18, 21]. Kempter et al. [18] pointout that analog communication in the HCI context is aboutintegration of spontaneous interaction mechanisms. Themain challenge therefore is the question of how to integrateanalog communication channels into applications withoutdefining explicit mappings between user input and systemresponses.
In interpersonal communication, visceral recognitionand impulsive reactions are explained by subliminalstimulus- and reaction patterns that arose from evolutionand are independent of conscious cognition [22]. It is seen asevolutionary adjustment of the expression to the impression[18], meaning that a communicative impulse can evolvebecause of the effects it was able to invoke in the recipientsand where these effects have been proven to be of advantagein the course of evolution. Kempter and Ritter [23] thereforepropose that in HCI, for example, graphical user interfacescould be adjusted by similar evolutionary processes. As abasis for these evolutionary processes, continuous infor-mation about physiological reactions of the human bodycould be evaluated to determine whether or not a certainreaction had the desired effect. These evolved cause-effectrelationships, however, should not be communicated to theuser to avoid symbolic interpretation of them.
In this paper, we are going to extend on the ideas pre-sented in [23] and evaluate how we can enrich the human-computer interaction by analog communication channels.In the next section, we will briefly look at related work,before we show two different examples where we used analogcommunication channels in an evolutionary way to enhancethe performance of users.

Advances in Human-Computer Interaction 3
2. Related Work
The idea or desire for computer systems that are emotionalis probably as old as computers themselves. Even HAL,the protagonist from Arthur C. Clarke’s Space Odyssey wasable to recognize and express emotions [24]. In 1997, thetopic gained new interest with Picard’s proposal for AffectiveComputing, encompassing computing that relates to, arisesfrom, or deliberately influences emotion or other affectivephenomena [17, page 3]. The idea is to make computers morehumanlike in making them aware of the emotional state ofa user. This will help them in decision making and shouldtherefore enhance the overall experience of the interactionwith computers. This might also enable completely new fieldsof use as outlined by Picard. Norman [25] even goes so far asto say that in future intelligent systems need to be able to haveemotions to be successful.
One major aspect of making computers aware of theuser’s emotion is in analyzing the channels over which suchemotions are transported. There are different approacheson how to access these. Psychophysiological signals playa major role in looking inside a user [26], a prominentexample might be that of lie detectors. But also from otherchannels, emotional state can be deduced. Batliner et al.[27], for example, propose a system for automatic processingand classification of emotional features from speech analysis.Neviarouskaya et al. [28] showed that deducing affectfrom text messages delivers valuable information about theemotional state and can be used to give users a more explicitfeedback about the emotions of the other part in computer-mediated communication between persons like, for example,in virtual world games like Second Life.
The benefit of emotional awareness of machines isnot only seen in enhancing decision making processes asdescribed by Picard. Also media-based applications could beenhanced by taking emotional state information into accountas pointed out in [29]. Hui et al. [30] present a model toestimate the level of disruption as a basis to adjust the userinterface to the user’s current needs. The idea to adapt userinterfaces to the emotional state of a user, however, also bearssome risks. Paymans [31] discusses the usability tradeoffsregarding learnability in adaptive environments.
Work is also done in the area of standardizing the formatof exchanging emotional state information to share suchinformation among different applications and platforms,making it easier to create new emotion-aware applications[32].
So is making computers emotion aware the key to makingthem easier to use? The works listed above seem to supportthis thesis. However, R. S. Lazarus and B. N. Lazarus [33]point out that emotions are something intrinsically personal.To understand our own or another’s emotions is to understandthe ways people interpret the significance of daily events in theirlives, and how these events affect their personal well-being [33,page 5]. Norman [25] describes this problem as the lack ofcommon ground between human and machines. How couldcomputer systems ever become aware—even only in a verysmall way—of all the things that contribute to our emotions?An interesting question therefore arises: do computers have
Symboliccommunication
Gestures
Physiology· · ·
Behavior
Speech
Analogcommunication
Facial expressions
Figure 1: Typical human-computer interaction by symbolic encod-ing. Analog channels are not seen by the computer.
to be aware of our emotions, or would awareness of someof the underlying processes (or indications thereof) besufficient?
The work presented in this paper differs in a majoraspect from the works described above. Instead of findingmappings of certain features to specific meanings (i.e.,emotional states), we propose a model based on real analogcommunication. By this, we mean strictly nonsymboliccommunication. In this approach, no explicit mappingsbetween features and meanings are defined in advance by thedeveloper and no discrete emotions are interpreted by thesystem.
3. An Approach to EvolutionaryFeedback Loops
As pointed out above, typical human-computer interactionis forced into symbolic communication. Only predefinedvocabulary can be used to communicate (see Figure 1).Everything users want to communicate to the computer hasto be encoded in a tunnel of symbolic communication topass the virtual wall between human and computers. Analogsignals emitted by the person are not seen by the computer.
One way to enrich the communication between usersand their computers could be to actually look into thesymbolic communication stream for hints about emotionalcontent (like done, e.g., in [28]). Another way to enrichcommunication would be to simply tear another hole intothe wall between humans and computers, for allowing morechannels, many of them being analog and unconsciousby nature, to pass through (one example would be [27]).Here the question arises, how this newly gained analoginformation should be processed. Typically, this informationis classified and mapped to an explicit meaning. We proposeto introduce an evolutionary feedback loop between usersand computers, without explicit mappings of inputs to
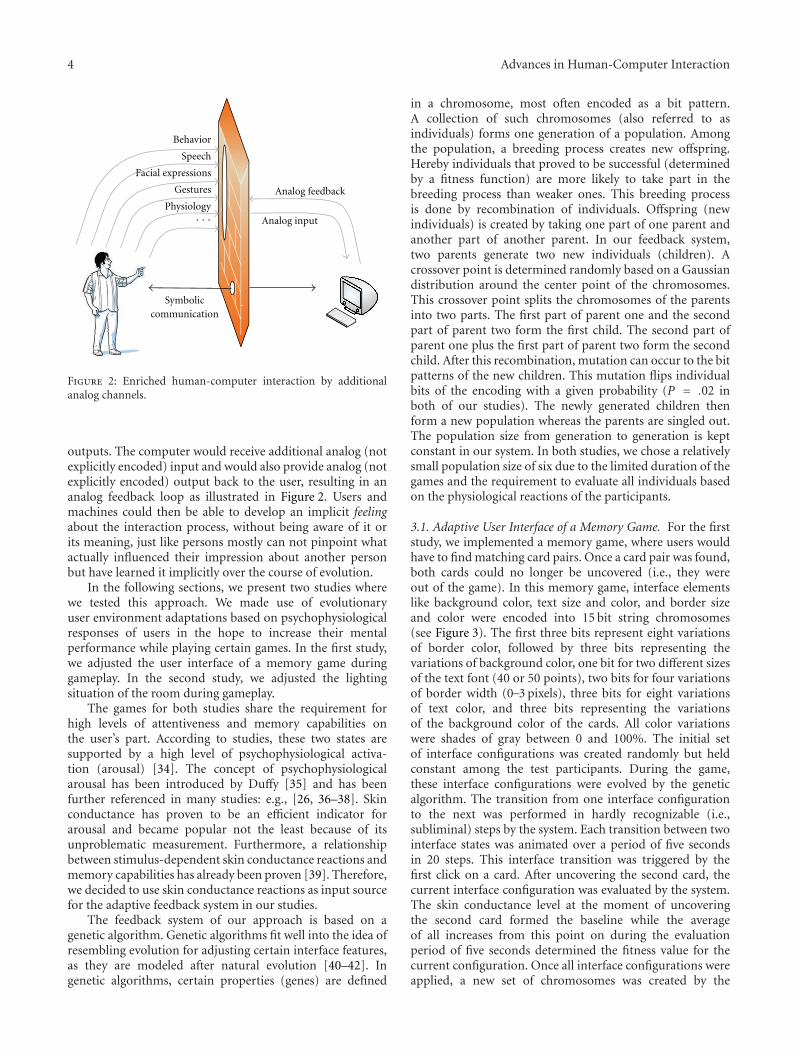
4 Advances in Human-Computer Interaction
Analog feedback
Analog input
Symboliccommunication
Gestures
Physiology· · ·
Behavior
Speech
Facial expressions
Figure 2: Enriched human-computer interaction by additionalanalog channels.
outputs. The computer would receive additional analog (notexplicitly encoded) input and would also provide analog (notexplicitly encoded) output back to the user, resulting in ananalog feedback loop as illustrated in Figure 2. Users andmachines could then be able to develop an implicit feelingabout the interaction process, without being aware of it orits meaning, just like persons mostly can not pinpoint whatactually influenced their impression about another personbut have learned it implicitly over the course of evolution.
In the following sections, we present two studies wherewe tested this approach. We made use of evolutionaryuser environment adaptations based on psychophysiologicalresponses of users in the hope to increase their mentalperformance while playing certain games. In the first study,we adjusted the user interface of a memory game duringgameplay. In the second study, we adjusted the lightingsituation of the room during gameplay.
The games for both studies share the requirement forhigh levels of attentiveness and memory capabilities onthe user’s part. According to studies, these two states aresupported by a high level of psychophysiological activa-tion (arousal) [34]. The concept of psychophysiologicalarousal has been introduced by Duffy [35] and has beenfurther referenced in many studies: e.g., [26, 36–38]. Skinconductance has proven to be an efficient indicator forarousal and became popular not the least because of itsunproblematic measurement. Furthermore, a relationshipbetween stimulus-dependent skin conductance reactions andmemory capabilities has already been proven [39]. Therefore,we decided to use skin conductance reactions as input sourcefor the adaptive feedback system in our studies.
The feedback system of our approach is based on agenetic algorithm. Genetic algorithms fit well into the idea ofresembling evolution for adjusting certain interface features,as they are modeled after natural evolution [40–42]. Ingenetic algorithms, certain properties (genes) are defined
in a chromosome, most often encoded as a bit pattern.A collection of such chromosomes (also referred to asindividuals) forms one generation of a population. Amongthe population, a breeding process creates new offspring.Hereby individuals that proved to be successful (determinedby a fitness function) are more likely to take part in thebreeding process than weaker ones. This breeding processis done by recombination of individuals. Offspring (newindividuals) is created by taking one part of one parent andanother part of another parent. In our feedback system,two parents generate two new individuals (children). Acrossover point is determined randomly based on a Gaussiandistribution around the center point of the chromosomes.This crossover point splits the chromosomes of the parentsinto two parts. The first part of parent one and the secondpart of parent two form the first child. The second part ofparent one plus the first part of parent two form the secondchild. After this recombination, mutation can occur to the bitpatterns of the new children. This mutation flips individualbits of the encoding with a given probability (P = .02 inboth of our studies). The newly generated children thenform a new population whereas the parents are singled out.The population size from generation to generation is keptconstant in our system. In both studies, we chose a relativelysmall population size of six due to the limited duration of thegames and the requirement to evaluate all individuals basedon the physiological reactions of the participants.
3.1. Adaptive User Interface of a Memory Game. For the firststudy, we implemented a memory game, where users wouldhave to find matching card pairs. Once a card pair was found,both cards could no longer be uncovered (i.e., they wereout of the game). In this memory game, interface elementslike background color, text size and color, and border sizeand color were encoded into 15 bit string chromosomes(see Figure 3). The first three bits represent eight variationsof border color, followed by three bits representing thevariations of background color, one bit for two different sizesof the text font (40 or 50 points), two bits for four variationsof border width (0−3 pixels), three bits for eight variationsof text color, and three bits representing the variationsof the background color of the cards. All color variationswere shades of gray between 0 and 100%. The initial setof interface configurations was created randomly but heldconstant among the test participants. During the game,these interface configurations were evolved by the geneticalgorithm. The transition from one interface configurationto the next was performed in hardly recognizable (i.e.,subliminal) steps by the system. Each transition between twointerface states was animated over a period of five secondsin 20 steps. This interface transition was triggered by thefirst click on a card. After uncovering the second card, thecurrent interface configuration was evaluated by the system.The skin conductance level at the moment of uncoveringthe second card formed the baseline while the averageof all increases from this point on during the evaluationperiod of five seconds determined the fitness value for thecurrent configuration. Once all interface configurations wereapplied, a new set of chromosomes was created by the
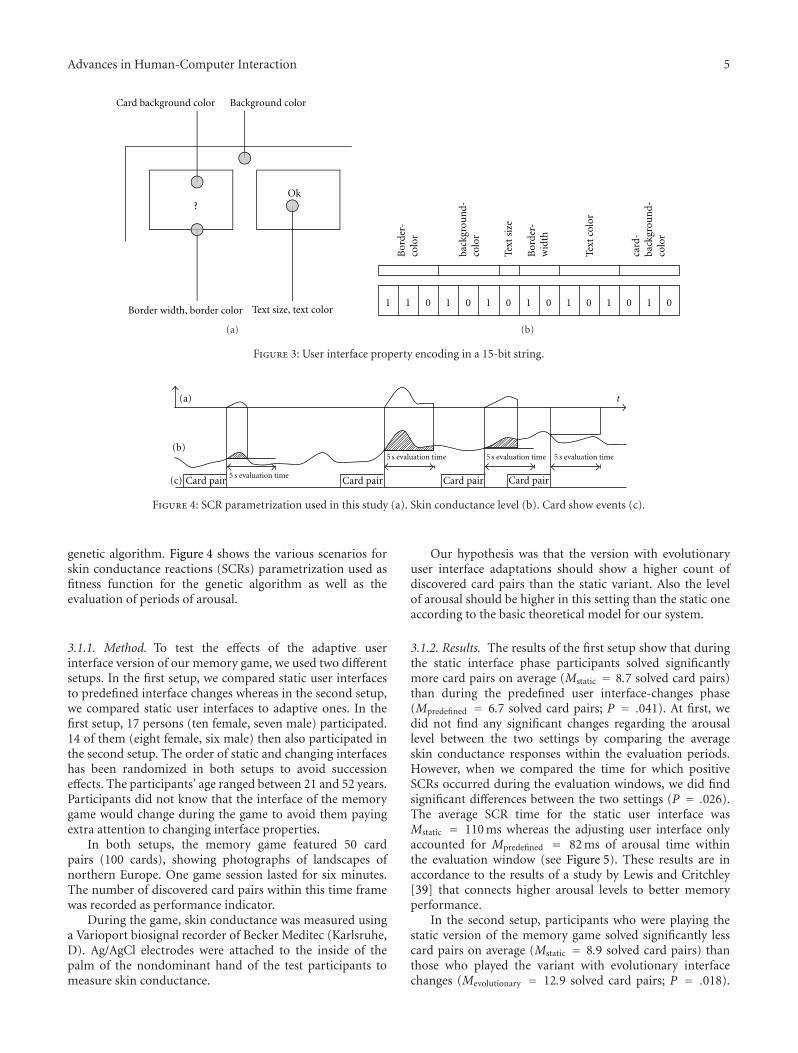
Advances in Human-Computer Interaction 5
?Ok
Background colorCard background color
Text size, text colorBorder width, border color
(a)
1 1 0 1 0 1 0 1 0 1 0 1 0 1 0
Bor
der-
colo
r
back
grou
nd-
colo
r
Text
size
Bor
der-
wid
th
Text
colo
r
card
-ba
ckgr
oun
d-co
lor
(b)
Figure 3: User interface property encoding in a 15-bit string.
Card pair Card pair Card pair Card pair5 s evaluation time
5 s evaluation time 5 s evaluation time 5 s evaluation time
(a) t
(b)
(c)
Figure 4: SCR parametrization used in this study (a). Skin conductance level (b). Card show events (c).
genetic algorithm. Figure 4 shows the various scenarios forskin conductance reactions (SCRs) parametrization used asfitness function for the genetic algorithm as well as theevaluation of periods of arousal.
3.1.1. Method. To test the effects of the adaptive userinterface version of our memory game, we used two differentsetups. In the first setup, we compared static user interfacesto predefined interface changes whereas in the second setup,we compared static user interfaces to adaptive ones. In thefirst setup, 17 persons (ten female, seven male) participated.14 of them (eight female, six male) then also participated inthe second setup. The order of static and changing interfaceshas been randomized in both setups to avoid successioneffects. The participants’ age ranged between 21 and 52 years.Participants did not know that the interface of the memorygame would change during the game to avoid them payingextra attention to changing interface properties.
In both setups, the memory game featured 50 cardpairs (100 cards), showing photographs of landscapes ofnorthern Europe. One game session lasted for six minutes.The number of discovered card pairs within this time framewas recorded as performance indicator.
During the game, skin conductance was measured usinga Varioport biosignal recorder of Becker Meditec (Karlsruhe,D). Ag/AgCl electrodes were attached to the inside of thepalm of the nondominant hand of the test participants tomeasure skin conductance.
Our hypothesis was that the version with evolutionaryuser interface adaptations should show a higher count ofdiscovered card pairs than the static variant. Also the levelof arousal should be higher in this setting than the static oneaccording to the basic theoretical model for our system.
3.1.2. Results. The results of the first setup show that duringthe static interface phase participants solved significantlymore card pairs on average (Mstatic = 8.7 solved card pairs)than during the predefined user interface-changes phase(Mpredefined = 6.7 solved card pairs; P = .041). At first, wedid not find any significant changes regarding the arousallevel between the two settings by comparing the averageskin conductance responses within the evaluation periods.However, when we compared the time for which positiveSCRs occurred during the evaluation windows, we did findsignificant differences between the two settings (P = .026).The average SCR time for the static user interface wasMstatic = 110 ms whereas the adjusting user interface onlyaccounted for Mpredefined = 82 ms of arousal time withinthe evaluation window (see Figure 5). These results are inaccordance to the results of a study by Lewis and Critchley[39] that connects higher arousal levels to better memoryperformance.
In the second setup, participants who were playing thestatic version of the memory game solved significantly lesscard pairs on average (Mstatic = 8.9 solved card pairs) thanthose who played the variant with evolutionary interfacechanges (Mevolutionary = 12.9 solved card pairs; P = .018).

6 Advances in Human-Computer Interaction
Genetic
Unvarying guiChanging gui
Preset
240
200
160
120
80
40
1 2
Electrodermal activity
Mill
isec
onds
(a)
GeneticMatching cards
Nu
mbe
rof
pair
s
Unvarying guiChanging gui
Preset
14
12
10
8
6
41 2
(b)
Figure 5: Arousal levels and numbers of card pairs solved for the first (1) and second (2) setting.
This equals a 44.9% increase of solved card pairs fromthe static to the adaptive version of the game. Also theparameters of average SCR time during the evaluationperiods showed significant differences. Players of the staticinterface variant showed Mstatic = 154 ms of arousal timewhereas the group playing the variant with evolutionaryinterface changes showed Mevolutionary = 211 ms (P = .033).
In both settings, a training effect between the two setupscan be seen. However, the increase of performance betweenthe setting with predefined user interface changes of the firstsetup versus the setting with evolved user interface changes ofthe second setup is much more pronounced than in the staticvariant between the two setups. This clearly seems to supportour hypothesis that evolutionary interfaces indeed can havepositive effects on a user’s memory performance.
During the final debriefing test, persons were asked ifthey recognized any changes to the memory interface duringthe gameplay. None of them were aware of any interfacechanges, even though the final appearance of the game wasvastly different (see Figure 6).
3.2. Adaptive Lighting Supported Concentration Games. Inthis study, we wanted to test if we could enhance theperformance of users in concentration games by adjustingthe light setting in the room where they were playing.
Besides the memory game from our previous study weintroduced four more concentration games for selection: Ina simple calculation game, users had to decide if a presentedresult of additions and subtractions was wrong or right.In another game, a collection of black and white dots waspresented and users had to determine without countingwhether there were more black or white dots. Another game,showed a list of letters where users had to determine if agiven word could be constructed out of the presented letters.Finally, a text-based memory game showed a list of wordsfor two minutes. After this time, the users were asked ifcertain words had been included in the list shown before. The
duration of all games was set to 10 minutes (see Figure 7 foran illustration).
Besides the gaming computer, the test system featuredeight light-control circuits based on the Digital AddressableLighting Interface (DALI; (see http://www.dali-ag.org/ formore information)) protocol, each attached to indirect 80 Wfluorescent lighting devices. One half of the circuits featuredyellow/red light (2700 K), the other half white/blue light(8000 K) (see Figure 8). By varying the light intensity ofeach circuit, the system could produce light situations in analmost continuous gradient between the two color extremes,and also vary the light distribution in the room. To controlthis light system, we developed a lighting control systemthat featured the same genetic algorithm as in the previousexperiment, but instead of encoding user interface propertiesin the bit string, we encoded different lighting setups. Forthis, we used a representation with 32 bits. Each controlcircuit was represented by four bits giving 16 variations ofbrightness levels between 3 and 100%.
The starting set of light parameters (the initial popula-tion) was generated randomly but held constant among thetest participants. These light parameters were then evolvedduring the gameplay. The transition from one light setupto the next was kept at a level where persons would notrecognize the change while playing the game. For this, atransition from one lighting setup to the next was animatedin dynamically calculated increments of one to five stepsper update (depending on the distance between the currentand target state), with updates for all lighting devices beingissued each second. Light levels in DALI are represented withinteger values from 0 to 254 (0 to 100%). Once a transitionfrom one setup to the other completed, the evaluationperiod (20 seconds) was invoked. The evaluation used thesame time-of-activation-based parametrization as describedin the memory experiment. After evaluation of the currentlight setup, the next transition was invoked. Once all ofthe individuals of a population had been evaluated, a newgeneration was evolved.
Advances in Human-Computer Interaction 7
(a) (b)
(c) (d)
Figure 6: Final appearances of evolved user interfaces.
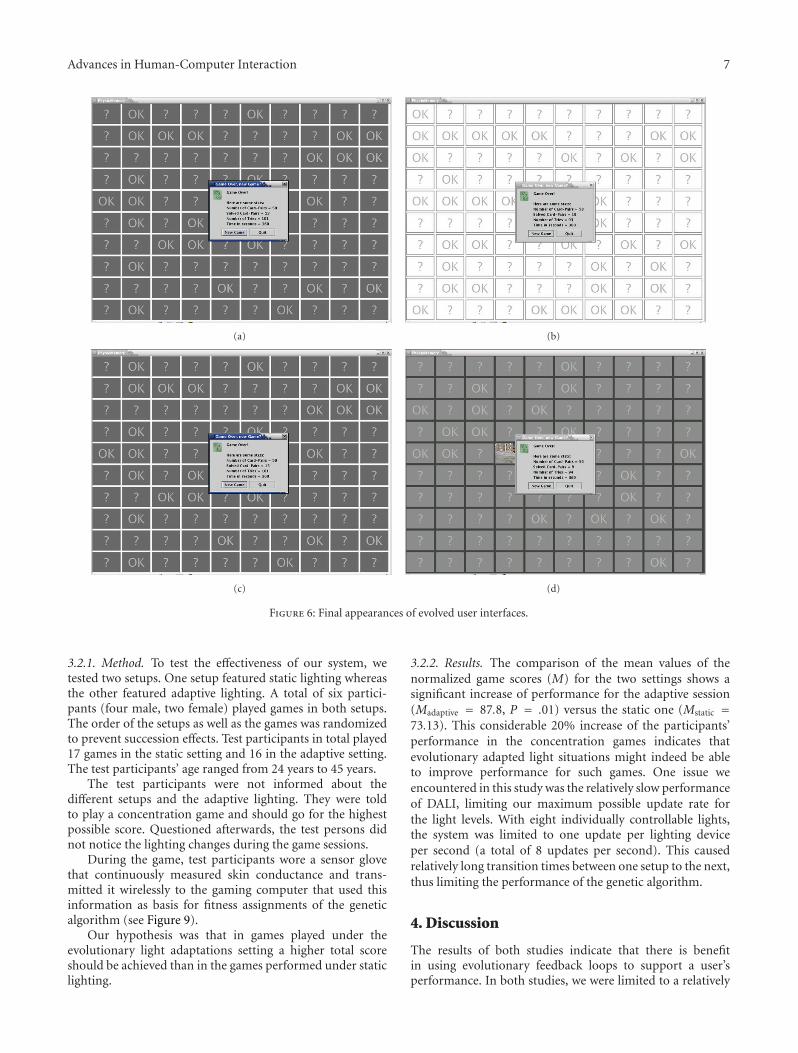
3.2.1. Method. To test the effectiveness of our system, wetested two setups. One setup featured static lighting whereasthe other featured adaptive lighting. A total of six partici-pants (four male, two female) played games in both setups.The order of the setups as well as the games was randomizedto prevent succession effects. Test participants in total played17 games in the static setting and 16 in the adaptive setting.The test participants’ age ranged from 24 years to 45 years.
The test participants were not informed about thedifferent setups and the adaptive lighting. They were toldto play a concentration game and should go for the highestpossible score. Questioned afterwards, the test persons didnot notice the lighting changes during the game sessions.
During the game, test participants wore a sensor glovethat continuously measured skin conductance and trans-mitted it wirelessly to the gaming computer that used thisinformation as basis for fitness assignments of the geneticalgorithm (see Figure 9).
Our hypothesis was that in games played under theevolutionary light adaptations setting a higher total scoreshould be achieved than in the games performed under staticlighting.
3.2.2. Results. The comparison of the mean values of thenormalized game scores (M) for the two settings shows asignificant increase of performance for the adaptive session(Madaptive = 87.8, P = .01) versus the static one (Mstatic =73.13). This considerable 20% increase of the participants’performance in the concentration games indicates thatevolutionary adapted light situations might indeed be ableto improve performance for such games. One issue weencountered in this study was the relatively slow performanceof DALI, limiting our maximum possible update rate forthe light levels. With eight individually controllable lights,the system was limited to one update per lighting deviceper second (a total of 8 updates per second). This causedrelatively long transition times between one setup to the next,thus limiting the performance of the genetic algorithm.
4. Discussion
The results of both studies indicate that there is benefitin using evolutionary feedback loops to support a user’sperformance. In both studies, we were limited to a relatively

8 Advances in Human-Computer Interaction
(a) (b)
(c) (d)
Figure 7: Four concentration games.
Indirect illumination
(a)
Skin conductance
Light-variations DALI-commands
(b)
Figure 8: Lighting setup and feedback loop for the evolutionary light adaptations.
small number of participants. Therefore, the gained statisti-cal significance levels have to be considered with a level ofuncertainty. A future study with more participants will haveto consolidate these results. Still, as both of these studiesshow the same trend of the participants’ performances,
the approach of evolutionary feedback loops in human-computer interaction seems promising.
On the technical side, at first we were reluctant touse genetic algorithms in our applications, as evolutionaryalgorithms usually are applied in a highly parallel manner,

Advances in Human-Computer Interaction 9
EDA electrodesVarioport unit
BVP sensor
Figure 9: Sensor glove for measuring skin conductance wirelessly.
with parallel evaluation of individuals. In our experimentshowever, we had to serialize the evaluation of individuals. Toenable the evolution of several generations, we were thereforeforced to keep the population size low.
We only evaluated short-term effects of evolutionaryfeedback loops in these studies. It would therefore beimportant to see if a beneficiary effect can also be achievedin a long-term setting or if users would finally get distractedor even tired of the constant pursue for activation, even ifnot noticed consciously. Also it would be interesting to see ifsuch feedback loops could also improve a user’s perceptionof a system. Do they feel comfortable in working with suchsystems or in such adaptive environments? Do they regardthe system as more pleasing?
Even more questions arise. While our participants didnot claim to have recognized any adjustment effects duringthe games, how would they react once they knew somethingwas going on in the background. Would they spend moreattention in trying to detect any changes, and thus beingdeviated from their primary task which would cause anegative effect? This risk could be reduced by furthersmoothing transitions between two scenarios. In the lightingsetting, this would require an alternative lighting controlcircuit with higher bandwidth than DALI. Also great carehas to be taken as to what is being manipulated by thefeedback loop. To not confuse users, we propose to onlyadjust elements that are not directly involved in the explicitinteraction process. Constantly changing menus or positionsof vital elements would definitely irritate users and make thesystem as a whole unpredictable.
One example often mentioned in affective computing isthat of a virtual agent adjusting its facial expressions to theemotional state of a user. However, if the classification ofthe user’s emotion went wrong, that is, the system does notbehave like the user expected, the user will loose faith in thesystem. One major point of our approach is that there is nosuch defined linkage between cause and action, therefore,such a situation should not happen with these feedbackloops.
However, the approach of having something unknownand therefore uncontrollable evolve in a system that influ-ences the user’s performance might be frightening, especiallywhen remembering how emotional computers like HALfrom the 2001: A Space Odyssey finally wreaked havoc.
This raises the question of how emotional machines ingeneral and such evolutionary feedback loops as used in ourapproach in particular have to be designed to be accepted byusers. We propose that it is essential to limit such evolvingfeedback loops to nonessential parts of a system. Users mustalways be in control—if they do not like what is happeningthey have to be able to deactivate the behavior, with theoverall system still remaining intact. In our case, they mightjust turn of the switch of the sensor glove or stop wearing itin first place to stop the evolutionary feedback loop.
So, would it not be great if computers could automati-cally improve our self-esteem or our behavior by subliminallypresenting stimuli like the ones used in the studies byDijksterhuis [10] or Bargh et al. [6]? Actually productsalready exist that claim to do just that. The market for audiotapes or magical software programs that state to subliminallyaffect people in a positive way seems to be huge, despite thelack of scientific proof [2].
However, this raises another concern: if machines canimpact humans without them noticing it, who is in controlof what the machines actually do? Given the huge effortstaken against subliminal messages in advertising, how wouldpeople react to machines that try to do something to them,without knowing exactly what they do? As the reportedsuccess of the products mentioned above seems to indicate,many people appear to be less worried about this. Still,researchers must not forget their responsibility for the ethicalimpact of such work.
5. Conclusion
In this paper, we briefly covered current work on thetopics of subliminal perception and affective computing.We then presented an approach for enriching human-computer interaction with analog communication channels.Instead of predefined mappings, this approach is basedon an evolutionary feedback loop. In two studies, wewere able to confirm significant positive effects of thisapproach regarding performance of users in concentrationintensive games, where the interface or the environmenthas been adapted in subliminal steps based on physiologicalsignals.
The studies only covered short-term effects (six andten minutes game duration) so future work in this fieldshould investigate the long-term effects of such evolutionaryfeedback loops. Also different algorithms for the feedbackloop should be investigated. An interesting option for furtherresearch would be to add more communication channels tothe system, like auditive feedback (for example, computer-generated music).
References
[1] A. R. Pratkanis, “The cargo-cult science of subliminal persua-sion,” Skeptical Inquirer, vol. 16, pp. 260–272, 1992.
[2] T. E. Moore, “Subliminal perception: facts and fallacies,”Skeptical Inquirer, vol. 16, pp. 273–281,1992.

10 Advances in Human-Computer Interaction
[3] N. Epley, K. Savitsky, and R. A. Kachelski, “What every skepticshould know about subliminal persuasion,” Skeptical Inquirer,vol. 5, pp. 40–58, 1999.
[4] W. R. Kunst-Wilson and R. B. Zajonc, “Affective discrimina-tion of stimuli that cannot be recognized,” Science, vol. 207,no. 4430, pp. 557–558, 1980.
[5] W. J. Perrig, W. Wippich, and P. Perrig-Chiello, UnbewussteInformationsverarbeitung, Verlag Hans Huber, Bern, Switzer-land, 1993.
[6] J. A. Bargh, M. Chen, and L. Burrows, “Automaticity of socialbehavior: direct effects of trait construct and stereotype acti-vation on action,” Journal of Personality and Social Psychology,vol. 71, no. 2, pp. 230–244, 1996.
[7] A. Dijksterhuis, “Think different: the merits of unconsciousthought in preference development and decision making,”Journal of Personality and Social Psychology, vol. 87, no. 5, pp.586–598, 2004.
[8] G. Gigerenzer, Bauchentscheidungen: Die Intelligenz des Unbe-wussten und die Macht der Intuition, Goldmann, Munchen,Germany, 2008.
[9] A. C. Kay, S. C. Wheeler, J. A. Bargh, and L. Ross, “Mate-rial priming: the influence of mundane physical objectson situational construal and competitive behavioral choice,”Organizational Behavior and Human Decision Processes, vol.95, no. 1, pp. 83–96, 2004.
[10] A. Dijksterhuis, “I like myself but i don’t know why: Enhancingimplicit self-esteem by subliminal evaluative conditioning,”Journal of Personality and Social Psychology, vol. 86, no. 2, pp.345–355, 2004.
[11] R. Custers and H. Aarts, “The unconscious will: how thepursuit of goals operates outside of conscious awareness,”Science, vol. 329, no. 5987, pp. 47–50, 2010.
[12] P. M. Merikle and S. Joordens, “Parallels between Perceptionwithout Attention and Perception without Awareness,” Con-sciousness and Cognition, vol. 6, no. 2-3, pp. 219–236, 1997.
[13] J. Cheesman and P. M. Merikle, “Distinguishing consciousfrom unconscious perceptual processes,” Canadian Journal ofPsychology, vol. 40, no. 4, pp. 343–367, 1986.
[14] F. S. von Thun, Miteinander reden 1—Storungen und Klarun-gen. Allgemeine Psychologie der Kommunikation, Rowohlt,Hamburg, Germany, 1981.
[15] P. Watzlawick, J. Beavin, and D. Jackson, Menschliche Kommu-nikation, Huber, Bern, Switzerland, 6th edition, 1982.
[16] D. A. Norman, Emotional Design: Why We Love (or Hate)Everyday Things, Basic Books, New York, NY, USA, 1st edition,2005.
[17] R. W. Picard, Affective Computing, MIT Press, Cambridge, UK,1997.
[18] G. Kempter, K.-H. Weidmann, and P. Roux, “What are thebene ts of anal-ogous communication in human computerinteraction?” in Universal Access in HCI: Inclusive Design inthe Information Society, C. Stephanidis, Ed., pp. 1427–1431,Lawrence Erlbaum Associates, Mahwah, NJ, USA, 2003.
[19] S. Kopp and I. Wachsmuth, “Synthesizing multimodal utter-ances for conversational agents,” Computer Animation andVirtual Worlds, vol. 15, no. 1, pp. 39–52, 2004.
[20] A. Norman, Things That Make us Smart: Defending HumanAttributes in the Age of the Machine, Perseus Books, Cam-bridge, Mass, USA, 1993.
[21] T. Kirtse, H. Diener, L. M. Encarnacao, O. Hein, A. Stork,and O. Fraunhofer-Bimber, “The future of interactive systems:challenges to the usability research,” Informationstechnik undTechnische Informatik, vol. 44, pp. 40–48, 2002.
[22] G. Kempter and C. Moeller, “Static and dynamic behavioralfeatures: what cues are more salient in face-to-face traitattribution?” International Journal of Psychology, vol. 35, no.3-4, pp. 228–229, 2000.
[23] G. Kempter and W. Ritter, “Einsatz von Psychophysiologie inder Mensch-Computer Interaktion,” in Mensch und Computerim Strukturwandel, A. M. Heinecke and H. Paul, Eds., pp. 165–174, Oldenbourg, Munchen, Germany, 2006.
[24] A. C. Clarke, 2001: A Space Odyssey, New American Library,New York, NY, USA, 1968.
[25] D. A. Norman, The Design of Future Things, Basic Books, NewYork, NY, USA, 2007.
[26] G. Kempter and G. Bente, “Psychophysiologische Wirkungs-forschung: Grundlagen und Anwendungen,” in Lehrbuch derMedienpsychologie, R. Mangold, P. Vorderer, and G. Bente,Eds., pp. 271–295, Hogrefe, Gottingen, Germany, 2004.
[27] A. Batliner, D. Seppi, S. Steidl, and B. Schuller, “Segmentinginto adequate units for automatic recognition of emotion-related episodes: a speechbased approach,” Advances inHuman-Computer Interaction, vol. 2010, Article ID 782802, 15pages, 2010.
[28] A. Neviarouskaya, H. Prendinger, and M. Ishizuka, “Emo-heart: conveying emotions in second life based on a ect sensingfrom text,” Advances in Human-Computer Interaction, vol.2010, Article ID 209801, 13 pages, 2010.
[29] R. Nakatsu, M. Rauterberg, and B. Salem, “Forms and theoriesof communication: from multimedia to Kansei Mediation,”Multimedia Systems, vol. 11, no. 3, pp. 304–312, 2006.
[30] B. Hui, G. Partridge, and C. Boutilier, “A probabilistic mentalmodel for estimating disruption,” in Proceedings of the 13thInternational Conference on Intelligent User Interfaces (IUI ’09),pp. 287–296, 2009.
[31] T. F. Paymans, J. Lindenberg, and M. Neerincx, “Usabilitytrade-offs for adaptive user interfaces: Ease of use andlearnability,” in Proceedings of the International Conference onIntelligent User Interfaces (IUI ’04), pp. 301–303, ACM, 2004.
[32] M. Schroder, “The SEMAINE API: towards a standards-basedframework for building emotion-oriented systems,” Advancesin Human-Computer Interaction, vol. 2010, Article ID 319406,21 pages, 2010.
[33] R. S. Lazarus and B. N. Lazarus, Passion and Reason: MakingSense of Our Emotions, Oxford University Press, Oxford, UK,1994.
[34] M. W. Eysenck, “Memory and arousal,” in PhysiologicalCorrelates of Human Behavior, A. Gale and J. A. Edwards, Eds.,vol. 2 of Attention and Performance, pp. 187–202, AcademicPress, London, UK, 1983.
[35] E. Duffy, “Activation,” in Hand-book of Psychophysiology, N.Greenfield and R. Sternbach, Eds., pp. 577–622, Holt, Reinhartand Winston, New York, NY, USA, 1972.
[36] R. M. Stern and C. E. E. Sison, “Response patterning,”in Principles of Psychophysiology, J. T. Cacioppo and L. G.Tassinary, Eds., pp. 193–215, Cambridge University Press,Cambridge, UK, 1990.
[37] J. T. Cacioppo and L. G. Tassinary, “Psychophysiology and psy-chophysiological inference,” in Principles of Psychophysiology,J. T. Cacioppo and L. G. Tassinary, Eds., pp. 3–33, CambridgeUniversity Press, Cambridge, UK, 1990.
[38] G. Vossel and H. Zimmer, Psychophysiologie, Verlag W.Kohlhammer, Stuttgart,Germany, 1998.
[39] P. A. Lewis and H. D. Critchley, “Mood-dependent memory,”Trends in Cognitive Sciences, vol. 7, no. 10, pp. 431–433, 2003.

Advances in Human-Computer Interaction 11
[40] M. Mitchell, An Introduction to Genetic Algorithms, The MITPress, Cambridge, Mass, USA, 1996.
[41] Z. Michalewicz, Genetic Algorithms + Data Structures =Evolution Programs, Springer, Berlin, Germany, 3rd edition,1996.
[42] D. Goldberg, Genetic Algorithms in Search, Optimization andMachine Learning, Addison-Wesley, Reading, Mass, USA,1989.
Hindawi Publishing CorporationAdvances in Human-Computer InteractionVolume 2011, Article ID 968753, 15 pagesdoi:10.1155/2011/968753
Research Article
Subliminal Cues While Teaching: HCI Technique forEnhanced Learning
Pierre Chalfoun and Claude Frasson
Departement d’Informatique et de Recherche Operationnelle, Universite de Montreal, Office 2194,Montreal, Quebec, Canada H3T 1J4
Correspondence should be addressed to Pierre Chalfoun, [email protected]
Received 2 June 2010; Accepted 25 September 2010
Academic Editor: Kenneth Revett
Copyright © 2011 P. Chalfoun and C. Frasson. This is an open access article distributed under the Creative Commons AttributionLicense, which permits unrestricted use, distribution, and reproduction in any medium, provided the original work is properlycited.
This paper presents results from an empirical study conducted with a subliminal teaching technique aimed at enhancing learner’sperformance in Intelligent Systems through the use of physiological sensors. This technique uses carefully designed subliminalcues (positive) and miscues (negative) and projects them under the learner’s perceptual visual threshold. A positive cue, calledanswer cue, is a hint aiming to enhance the learner’s inductive reasoning abilities and projected in a way to help them figureout the solution faster but more importantly better. A negative cue, called miscue, is also used and aims at obviously at theopposite (distract the learner or lead them to the wrong conclusion). The latest obtained results showed that only subliminal cues,not miscues, could significantly increase learner performance and intuition in a logic-based problem-solving task. Nonintrusivephysiological sensors (EEG for recording brainwaves, blood volume pressure to compute heart rate and skin response to record skinconductivity) were used to record affective and cerebral responses throughout the experiment. The descriptive analysis, combinedwith the physiological data, provides compelling evidence for the positive impact of answer cues on reasoning and intuitive decisionmaking in a logic-based problem-solving paradigm.
1. Introduction
The use of technology to build Intelligent User Interfaces(IUI) has revolutionized the way computers interact withhuman beings. Examples of these IUIs can be found invirtually every aspect of our lives, such as mobile mediasharing [1, 2], intelligent vehicular assistance [3], and mentalspelling machines [4]. One growing area of research withinthe HCI community recently has been focusing towardsthe design of smart interfaces for learning. Indeed, a smartinterface should be able, in a learning context, to detectthe user’s emotional and cognitive states in order to adjustand adapt the teaching material accordingly. Such adaptivesystems relying on efficient IUIs are known as intelligenttutoring systems and are comprised of multiple goal-specificmodules to aid the learner. One of these modules, calledthe tutor, makes use of cognitive pedagogical strategies andaffective states to properly model human cognition according
to the learner’s constant needs and evolution. The tutortakes advantage of recent development in IUI to efficientlycommunicate with the learner. This multidisciplinary fieldof research tries to accomplish this daunting goal of user-modeling and adaptation by implementing the most recentevolutions and advances in various research areas such asartificial intelligence, neuroscience, and cognitive science.One of those recent advances this past decade has beenthe shift in emphasis for cognitive science from learner’sperformance to learner’s experience during learning. Indeed,affective states, motivation, and knowledge constructionhave been extensively measured and explored [5–8] andhave shown that emotions are an important component inskill acquisition and play a pivotal role in learning. Indeed,researches in neurosciences and cognitive psychology haveshown that emotions are widely related to diverse cognitiveprocesses, such as attention, problem solving, and decision-making [9, 10]. Emotions influence our behavior and play an
2 Advances in Human-Computer Interaction
important role in our every-day decision-making processes[11]. Cognitive activity is also fundamentally related to emo-tions [12]. Cognitive process such as problem solving anddecision making not only depend but are greatly intertwinedwith the individual’s emotional state [13]. Moreover, emo-tions are essential actors for creative thinking, inspiration,as well as concentration and motivation [10, 14]. It thenbecomes vital for an HCI system to detect and recognize theseemotional and cognitive states, via physiological sensors orotherwise, and relay them to the pertinent ITS modules.Hence, learning systems would be able to intelligently adapttheir communication and interaction with learners throughadaptive HCI systems.
Nevertheless, a major component of learning and de-cision making when solving problems has been mostlyneglected in this research field: human unconscious cogni-tion. Indeed, the cognitive unconscious as a major player isthe integration and interpretation of complex material withregards to decision making and possibly learning. To thatend, a large body of work in neuroscience and other fieldshas put forth compelling evidence that learning simple-to-complex information can be done without perception orcomplete awareness to the task at hand [15–18]. The ideathat any information projected too fast to be consciouslyperceived by a learner (called subliminal projection) has beenthe focus of much research in neuroscience and cognitivepsychology. A variety of IUIs have been designed for sucha purpose, ranging from simple two-dimensional interfaces(2D) to complex 3D immersive ones [19–23]. Furthermore,the recording of the neural electrical activity, called EEGactivity, present in the brain during the occurrence of thesemental processes is also an active research area in HCI.Indeed, an IUI that detects brain activity can recognize andquantify the user’s engagement level in specific activities [24].However, in the HCI community, EEG activity is mainlyused to construct brain computer interfaces mainly aimed atcharacter spelling or item recognition [4, 18, 25–27].
Unfortunately, very scarce research in the HCI commu-nity has employed affect, subliminal priming and EEG foreducational purposes. Indeed, the existence of perceptuallearning without perception has not only been proven, butalso replicated in one study we did two years ago [19]. In thisstudy, we presented a novel subliminal priming techniquebuilt into an adaptive IUI aimed at boosting performanceby enhancing the learner’s deductive reasoning capabilities.Our findings concur with the literature: subliminal stimuli,which is stimuli projected below the threshold of consciousperception, can enhance learning and increase the deductivereasoning of learners only if carefully and intelligentlyconstructed before being integrated into an IUI. However,this initial study suffered from a major limitation: theexclusive use of positive subliminal priming (cues designed tohelp learning, not hinder or interfere with it). Thus, we didnot know what effect might negative cues, or miscues, haveon learning and performance when integrated into our IUIsystem.
In the present paper, we intend to follow up on ourrecent study by designing an evolved version of our adaptiveIUI with our novel subliminal learning technique aimed at
enhancing the learner’s inductive learning capabilities. Thisnew IUI implemented in our tutoring system will marrypositive and negative primes as well as affective sensors in thestringent 2D environment resembling online tests. Affectivesensors will serve as important indicator of the learner’semotional and cerebral state when faced with the decisionof correctly answering a question. When facing a question,learners can either (a) guess the answer or (b) correctlyinfer the solution (since this is an exam and the solutionis not presented to them). We believe that IUIs would beable to detect both outcomes ((a) and (b)) by recordingand analyzing emotional and cerebral data. We also believe,based on the extensive literature to that effect, that subliminalpriming should influence both outcomes. We thus intendto investigate the relevance of augmenting our IUI withcerebral sensors and using our subliminal teaching techniqueby stating two HCI-research questions. First, does integratingdifferent subliminal cuing types (positive, control, andmiscue) into this newly designed IUI enhance or hamper thelearner’s inductive reasoning capabilities and performance?Second, what significant physiological impacts can this newlydesigned interface with our subliminal teaching techniquehave on learner’s performance during question answering aswell as on the entire learning process?
The organization of this paper is as follows: in the firstsection, we present previous work related to various aspectsof our research. The second section will discuss priming inHCI, more specifically from an educational standpoint. Thethird section will lay the bases of physiological recordingsand importance to education and learning in general. Thefourth section describes the experiment setup and depicts thevarious aspects related to subliminal cues and miscues. Thefifth section presents the obtained results which are discussedin section six leading to the last section where we concludeand present future work.
2. Related Work
The present work employs subliminal priming, affect, andEEG to investigate the possible contribution of priming toenhance learning and more specifically inductive reasoning.To the best of our knowledge, there are only two similarpapers in the ITS/AIED (Artificial intelligence in educa-tion)/HCI community that employ subliminal priming andEEG in an educational context [28, 29]. The first is ourown work where we presented cerebral evidence, namely,a P300 component (see background on EEG and affectivedata below), to confirm that both cues and miscues wereinterpreted in the brain, but with slightly different levelsand amplitudes. The second, however, greatly differs fromours in two ways: (1) the priming used is of a personaland not of a cognitive nature (self-words were projected onthe screen instead of cognitive cues and miscues) and (2)the authors’ main objective was to use priming to enhancelearner’s self-esteem first and foremost. Thus, any observedperformance increase could be considered as a probableside effect of the higher level of self-esteem reported. In thepresent work, cues and miscues were constructed precisely toenhance performance by augmenting the learner’s inductive
Advances in Human-Computer Interaction 3
reasoning abilities. However, we will briefly describe in thissection the work done in other related fields that have beenthe driving force behind the inspirations and motivations forthis work.
An existing dissociation between performance and con-sciousness has been known to neurologists for over 100years with a disorder called blindsight. Patients in thiscondition are unable to indentify anything presented inone side of their visual field even though their eyes(retinas) are perfectly healthy. Nevertheless, Poppel showedthat patients with blindsight can unconsciously identifyand process simple visual information presented to their“blind” side [30]. Furthermore, DeGerder demonstrated thatblindsight patients can recognize and identify complex visualstimuli (emotional faces) when such stimuli is presentedsubliminally [31]. These results, and many others, havebeen reproduced successfully on healthy patients and havecontributed to clarify, and more importantly, to justifythe anatomical separation that exists between consciousand unconscious cognition [32]. Unfortunately, no work inthe HCI community, besides ours [19, 33], has attemptedto use affective and cerebral data in order to assess theimpact of subliminal cues and miscues on the learner’sperformance, deductive and inductive reasoning, as well asdecision making in a problem-solving context. However, ahandful of papers in various fields have claimed the use ofsubliminal priming as a support for memory in the HCIcommunity.
One of the early works regarding the implementationof subliminal cues for task-supported operation within asoftware was the text editor program of Wallace [23]. Inthis experiment, Wallace et al. investigated the response ofsubjects when requiring help from a text editor. They foundthat the frequency at which subjects demanded help wasmuch lower when the required information was presentedin subliminal matter. Another very important finding is thefact that all previous studies did not have the intendedresults because the projected stimulus did not take intoaccount the specifications of the computer such as screenresolution and refresh rate. The memory glasses by DeVaulet al. [20] used wearable glasses that projects subliminalcues as a strategy for just-in-time memory support. Theobjective was to investigate the effect of various subliminalcues (correct and misleading) on retention in a word-facelearning paradigm and compare recall performance. Anotheruse of priming for memory support can be found in thethesis of Shutte [34], where the author assessed the effectsof brief subliminal primes on memory retention during aninterference task. The thesis examined in detail multipleparameters of subliminal projections such as duration, rel-evance, and contract. Although the results of these primingseemed very encouraging, the author cautions HCI designersthat misusing subliminal priming that can lead to criticaldisruptions of ongoing tasks. Further work from Mitchell etal. [35] has hypothesized that recognition performance ina standard item-based forgetting paradigm may be alteredby subliminal cues. These authors believe that these cuescan automatically activate different mnemonic strategies,thus enhancing memory retention and recall. The results
have shown that item-based words primed with the word“remember” seem to be better retained than “forgot” by avery slim difference, however. Besides seeming to impactmemory, subliminal priming can also have an emotionalconsequence on learners. Very recent work from [21] putforward an interesting effect that subliminal priming canhave on the self-attribution of authorship of events. Subjectswere asked to compete against a computer in removingnonwords such as “gewxs” from a computer screen in thefastest time possible. After a determined amount of time, thecomputer would remove the word. Subliminal primes of self-associated words like “I” and “me” before an action increasedthe personal feeling that it was the participant that eliminatedthe non-word and not the computer, thus increasing thefeeling of self-authorship of events.
Furthermore, monitoring the emotional reactions of thelearner using physiological sensors in a learning environmentusing IUI is quite explored as well. Indeed, the empathiccompanion is a good example where multiple physiologicalsensors, namely, galvanic skin response, heart rate, andrespiration were taken in real time to analyze and adaptthe tutor to the emotional reactions of the learner in avirtual 3D ITS [36]. Bosma and Andre [37] have mergedtwo techniques in order to resolve ambiguities in dialogueacts. They used a Bayesian network approach to determinean emotional state and a finite state machine method tostudy the meaning of dialogue acts according to physiologicaldata. Further research has analyzed a more detailed andrelevant emotional significance of physiological signals,either in complex learning or gaming [38–41]. There isunfortunately very scarce work to our knowledge in the HCIfield where EEG and emotional data are used to enhanceor adapt learning according to user’s demands besides twonotable exceptions: (1) Stevens et al. employed a light-weightEEG monitoring system to evaluate changes in cognitiveworkload, engagement and distraction as students acquireproblem solving skills [42], and (2) Chaouachi et al. havestarted to investigate the important link that may existbetween affect and mental workload as measured by a well-known EEG mental engagement index [24].
The current paper is presented through a newly designedIUI aimed at enhancing the learner’s inductive reasoning.The new IUI is interplay between subliminal priming, EEG,and affective data. Thus, a primer on subliminal primingin HCI will first be presented, followed by a backgroundsurvey of EEG and affective data, since these sensors play animportant, and active, part in our study.
3. Subliminal Priming in HCI
As mentioned before, this research focuses on subliminalstimuli to enhance learning in a tutoring system. Before goingfurther, we need to clearly establish the terminology that willbe used in this paper. Indeed, the simple mention of the wordsubliminal can lead to confusion. We first state that a learneris consciously perceiving a stimulus if they are fully awareand able to identify the given stimulus. In the example of acomputer screen saver where one would see a flying whitebox over a black computer screen, the fact of identifying the
4 Advances in Human-Computer Interaction
white box is sufficient to state that the learner consciouslyperceives it. However, if we project very quickly, 10 ms forexample, the letter “A” in Times New Roman 10 points inlight gray in the bottom left corner of the screen, then we canstate that they have consciously perceived the box but not theletter. This is due to the neurological properties of consciousperception: the existence of a threshold for conscious access[15]. It is precisely this threshold that we accept as being theline between conscious and subconscious perception (thatsome can call unconscious as well). The technique used toproject a given stimulus below this threshold of awareness iscalled subliminal priming as opposed to a liminal primingwhere the stimulus can be consciously perceived above thethreshold.
Moreover, a subliminal stimulus must, therefore, bepresented for a very short time and can vary in inten-sity, duration, frequency, and shape. It has, however beenestablished that subliminal stimuli can bias behavior andeven yield better results than no subliminal stimuli underspecific experimental conditions [21, 43]. Indeed, simplysending subliminal messages without caring for context nordesired goals and emotions can prove to be inefficient orsimply useless [17, 34]. The cognitive process that takes placewhen the stimulus (vocal or visual) is either unattendedor subliminally projected is a stage that we call subliminalprocessing. Contrary to popular belief, high-level semanticprocessing has been observed during this stage [44]. Oneinteresting example is an early study by [45], where subjectswere given unattended stimulus in the form of words andwere capable of discriminating between their alternativemeanings. Another fascinating experiment placed forwardthe long-term effect of subliminal priming on the visualsystem [43]. In this experiment, subjects learned a taskwithout actually realizing it. Participants were asked tofocus their attention on random letters appearing on acomputer screen while at the same time imperceptiblemoving dots in different directions were appearing justoutside of their visual field. After a month’s training, theparticipants subconsciously learned to recognize and betteridentify the dots movements even if their attention wasconcentrated on the letters appearing in their visual field onthe screen.
Furthermore, the impact of subliminal stimuli on behav-ior has been proven to be reliable only if the stimulus isgoal relevant and people are motivated (either intrinsicallyor otherwise) to pursue the goal [17, 46]. Indeed, a fewstunning examples of such impact on behavior is presentedby Karremans et al. [47] where they argue that for suchsubliminal primes to be processed (say verbal), the primeshave to consist of one or two short words and not of wholesentences. The notion of goal-relevance as well as propercue construction is thus crucial for the success of the hopedeffect.
The most relevant work, however, regarding our researchhas been done by Lowery et al. who demonstrated thatsubliminal primes can increase performance on midtermexams compared to neutral primes and that subliminalpriming may have long-term effects on real-world behavior[48]. Thus, we believe possible, with carefully designed
subliminal stimuli, to enhance learning without consciousperception by the learner. We also believe that this new formof learning can trigger a set of positive emotional conditionsin the learner, such as motivation and engagement. In turn,these positive emotions can enhance learning, inductiveproblem solving, and possibly decision making. To that end,we designed our cues to be projected at strategic spatialpositions on the screen by following the directions givenin a theoretical taxonomy that differentiates between con-scious, preconscious, and subliminal processing proposed byDehane et al. [32]. This taxonomy is based on the globalneural workspace hypothesis [49] that distinguishes primeaccessibility in the brain based on stimulus strength and top-down attention. Furthermore, this taxonomy has been quiterecently empirically validated by Van den Bussche [50].
4. Background on EEG and Affective Data
This section will present background information on theimportance of measuring physiological data both in termsof EEG in the brain as affective data in terms of valence andarousal, two important emotional dimensions used in thisresearch.
4.1. Background on EEG. It has been known, as early as1929, that the on-going electrical firing activity of groupsof neurons can be monitored with probes, referred to aselectrodes, placed on the scalp, outside the brain [51]. Therecording of such small activity (in microvolts, 10–6 volts)is called electroencephalography or EEG and is typicallydone with a polygraph displaying the continuous changesin voltage over time. There are roughly two main paradigmswhen working with EEG raw data (see Figure 1).
The first paradigm, time/frequency analysis (typicallyusing a fast Fourrier transformation or FFT), is an overalllook at specific frequencies over a period of time. Thistechnique is mainly used to clinically help diagnose multipledisorders such as epilepsy, sleep disturbances, and attentiondisorders by employing neurofeedback protocols [52]. Thistype of analysis gives relatively fair information about theoverall mental state of an individual based on brain locationsbeing surveyed. For example, Alpha waves, or bands, are 8 to12 Hz relatively large amplitude EEG waves that are usuallyassociated with a relaxed but awake state [52]. However,Alpha asymmetry patterns between left hemisphere (LH)and right hemisphere (RH) recordings while adult subjectsare closing their eyes (called eyes closed) are commonpatterns in depression (C3 LH Alpha > C4 RH Alpha). Thus,specific mental changes can be assessed by comparing record-ings from multiple scalp sites using a 3D spectrogram suchas the one depicted in Figure 1. Although no consensus ispresently available regarding band distribution, the followingranges are the most commonly agreed upon by therapists:Delta (1–4 Hz), Theta (4–8 Hz), Alpha (8–12 Hz), Beta (12–32 Hz), and Gamma (38–42 Hz) [52].
Indeed, in an educational setting, attention and semanticmemory performance can both be ascertained fromvariation of Alpha and Theta bands [52, 53]. Changes in theAlpha band has also been known to correlate to arithmetic
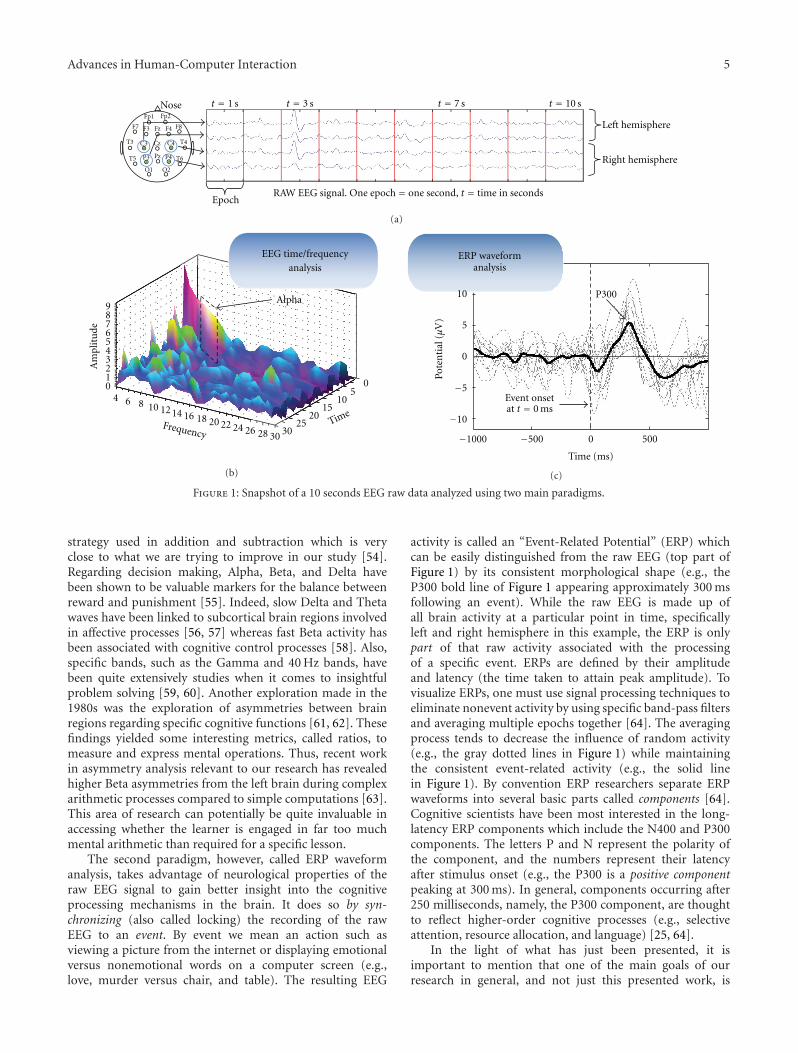
Advances in Human-Computer Interaction 5
Left hemisphere
Right hemisphere
Epoch
t = 1 s t = 3 s t = 7 s t = 10 s
Fz
C3 Cz C4 T4
T5 P3 P4
F4 F8
T3
Pz T6
Fp2
O1 O2
F7 F3
Fp1
Nose
RAW EEG signal. One epoch = one second, t = time in seconds
(a)
9876543210
4 6 8 10 1214 16 18 20 22 24 26 28 30Frequency
Am
plit
ude
05
1015
2025
30Time
EEG time/frequencyanalysis
Alpha
(b)
−1000 −500 0 500
−10
−5
0
5
10
Pote
nti
al(μ
V)
ERP waveformanalysis
Time (ms)
P300
Event onsetat t = 0 ms
(c)
Figure 1: Snapshot of a 10 seconds EEG raw data analyzed using two main paradigms.
strategy used in addition and subtraction which is veryclose to what we are trying to improve in our study [54].Regarding decision making, Alpha, Beta, and Delta havebeen shown to be valuable markers for the balance betweenreward and punishment [55]. Indeed, slow Delta and Thetawaves have been linked to subcortical brain regions involvedin affective processes [56, 57] whereas fast Beta activity hasbeen associated with cognitive control processes [58]. Also,specific bands, such as the Gamma and 40 Hz bands, havebeen quite extensively studies when it comes to insightfulproblem solving [59, 60]. Another exploration made in the1980s was the exploration of asymmetries between brainregions regarding specific cognitive functions [61, 62]. Thesefindings yielded some interesting metrics, called ratios, tomeasure and express mental operations. Thus, recent workin asymmetry analysis relevant to our research has revealedhigher Beta asymmetries from the left brain during complexarithmetic processes compared to simple computations [63].This area of research can potentially be quite invaluable inaccessing whether the learner is engaged in far too muchmental arithmetic than required for a specific lesson.
The second paradigm, however, called ERP waveformanalysis, takes advantage of neurological properties of theraw EEG signal to gain better insight into the cognitiveprocessing mechanisms in the brain. It does so by syn-chronizing (also called locking) the recording of the rawEEG to an event. By event we mean an action such asviewing a picture from the internet or displaying emotionalversus nonemotional words on a computer screen (e.g.,love, murder versus chair, and table). The resulting EEG
activity is called an “Event-Related Potential” (ERP) whichcan be easily distinguished from the raw EEG (top part ofFigure 1) by its consistent morphological shape (e.g., theP300 bold line of Figure 1 appearing approximately 300 msfollowing an event). While the raw EEG is made up ofall brain activity at a particular point in time, specificallyleft and right hemisphere in this example, the ERP is onlypart of that raw activity associated with the processingof a specific event. ERPs are defined by their amplitudeand latency (the time taken to attain peak amplitude). Tovisualize ERPs, one must use signal processing techniques toeliminate nonevent activity by using specific band-pass filtersand averaging multiple epochs together [64]. The averagingprocess tends to decrease the influence of random activity(e.g., the gray dotted lines in Figure 1) while maintainingthe consistent event-related activity (e.g., the solid linein Figure 1). By convention ERP researchers separate ERPwaveforms into several basic parts called components [64].Cognitive scientists have been most interested in the long-latency ERP components which include the N400 and P300components. The letters P and N represent the polarity ofthe component, and the numbers represent their latencyafter stimulus onset (e.g., the P300 is a positive componentpeaking at 300 ms). In general, components occurring after250 milliseconds, namely, the P300 component, are thoughtto reflect higher-order cognitive processes (e.g., selectiveattention, resource allocation, and language) [25, 64].
In the light of what has just been presented, it isimportant to mention that one of the main goals of ourresearch in general, and not just this presented work, is
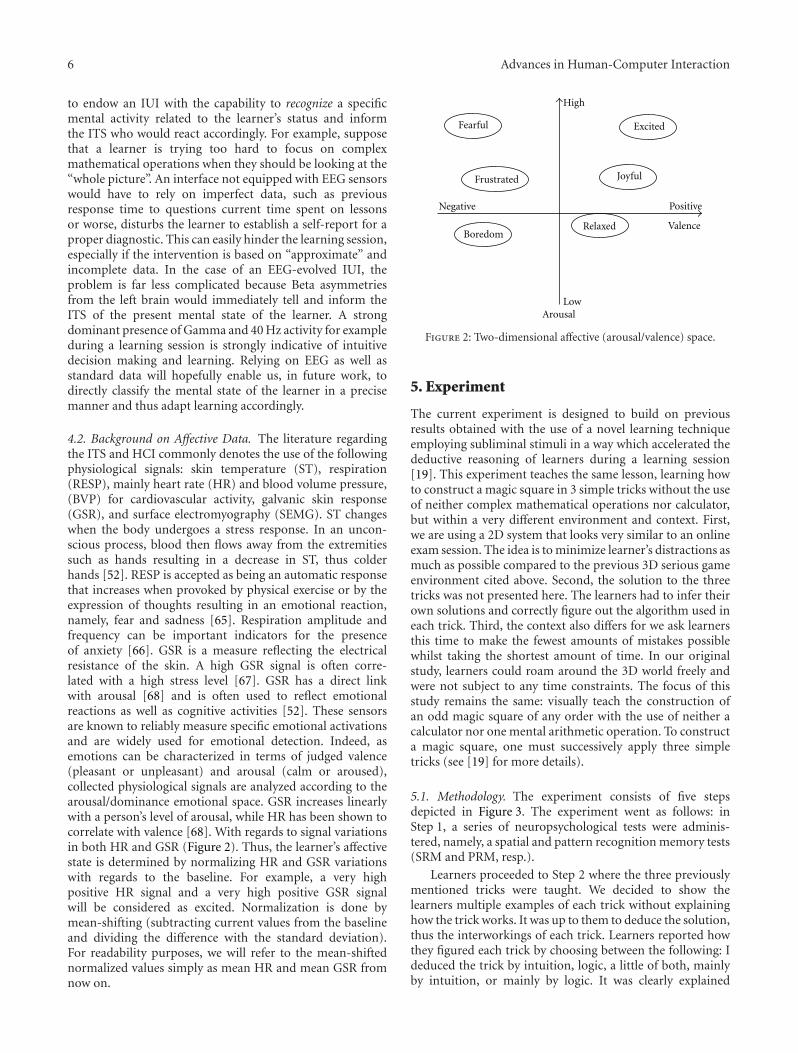
6 Advances in Human-Computer Interaction
to endow an IUI with the capability to recognize a specificmental activity related to the learner’s status and informthe ITS who would react accordingly. For example, supposethat a learner is trying too hard to focus on complexmathematical operations when they should be looking at the“whole picture”. An interface not equipped with EEG sensorswould have to rely on imperfect data, such as previousresponse time to questions current time spent on lessonsor worse, disturbs the learner to establish a self-report for aproper diagnostic. This can easily hinder the learning session,especially if the intervention is based on “approximate” andincomplete data. In the case of an EEG-evolved IUI, theproblem is far less complicated because Beta asymmetriesfrom the left brain would immediately tell and inform theITS of the present mental state of the learner. A strongdominant presence of Gamma and 40 Hz activity for exampleduring a learning session is strongly indicative of intuitivedecision making and learning. Relying on EEG as well asstandard data will hopefully enable us, in future work, todirectly classify the mental state of the learner in a precisemanner and thus adapt learning accordingly.
4.2. Background on Affective Data. The literature regardingthe ITS and HCI commonly denotes the use of the followingphysiological signals: skin temperature (ST), respiration(RESP), mainly heart rate (HR) and blood volume pressure,(BVP) for cardiovascular activity, galvanic skin response(GSR), and surface electromyography (SEMG). ST changeswhen the body undergoes a stress response. In an uncon-scious process, blood then flows away from the extremitiessuch as hands resulting in a decrease in ST, thus colderhands [52]. RESP is accepted as being an automatic responsethat increases when provoked by physical exercise or by theexpression of thoughts resulting in an emotional reaction,namely, fear and sadness [65]. Respiration amplitude andfrequency can be important indicators for the presenceof anxiety [66]. GSR is a measure reflecting the electricalresistance of the skin. A high GSR signal is often corre-lated with a high stress level [67]. GSR has a direct linkwith arousal [68] and is often used to reflect emotionalreactions as well as cognitive activities [52]. These sensorsare known to reliably measure specific emotional activationsand are widely used for emotional detection. Indeed, asemotions can be characterized in terms of judged valence(pleasant or unpleasant) and arousal (calm or aroused),collected physiological signals are analyzed according to thearousal/dominance emotional space. GSR increases linearlywith a person’s level of arousal, while HR has been shown tocorrelate with valence [68]. With regards to signal variationsin both HR and GSR (Figure 2). Thus, the learner’s affectivestate is determined by normalizing HR and GSR variationswith regards to the baseline. For example, a very highpositive HR signal and a very high positive GSR signalwill be considered as excited. Normalization is done bymean-shifting (subtracting current values from the baselineand dividing the difference with the standard deviation).For readability purposes, we will refer to the mean-shiftednormalized values simply as mean HR and mean GSR fromnow on.
Fearful
Frustrated
Negative Positive
Excited
Relaxed
Low
High
Joyful
Valence
Arousal
Boredom
Figure 2: Two-dimensional affective (arousal/valence) space.
5. Experiment
The current experiment is designed to build on previousresults obtained with the use of a novel learning techniqueemploying subliminal stimuli in a way which accelerated thedeductive reasoning of learners during a learning session[19]. This experiment teaches the same lesson, learning howto construct a magic square in 3 simple tricks without the useof neither complex mathematical operations nor calculator,but within a very different environment and context. First,we are using a 2D system that looks very similar to an onlineexam session. The idea is to minimize learner’s distractions asmuch as possible compared to the previous 3D serious gameenvironment cited above. Second, the solution to the threetricks was not presented here. The learners had to infer theirown solutions and correctly figure out the algorithm used ineach trick. Third, the context also differs for we ask learnersthis time to make the fewest amounts of mistakes possiblewhilst taking the shortest amount of time. In our originalstudy, learners could roam around the 3D world freely andwere not subject to any time constraints. The focus of thisstudy remains the same: visually teach the construction ofan odd magic square of any order with the use of neither acalculator nor one mental arithmetic operation. To constructa magic square, one must successively apply three simpletricks (see [19] for more details).
5.1. Methodology. The experiment consists of five stepsdepicted in Figure 3. The experiment went as follows: inStep 1, a series of neuropsychological tests were adminis-tered, namely, a spatial and pattern recognition memory tests(SRM and PRM, resp.).
Learners proceeded to Step 2 where the three previouslymentioned tricks were taught. We decided to show thelearners multiple examples of each trick without explaininghow the trick works. It was up to them to deduce the solution,thus the interworkings of each trick. Learners reported howthey figured each trick by choosing between the following: Ideduced the trick by intuition, logic, a little of both, mainlyby intuition, or mainly by logic. It was clearly explained
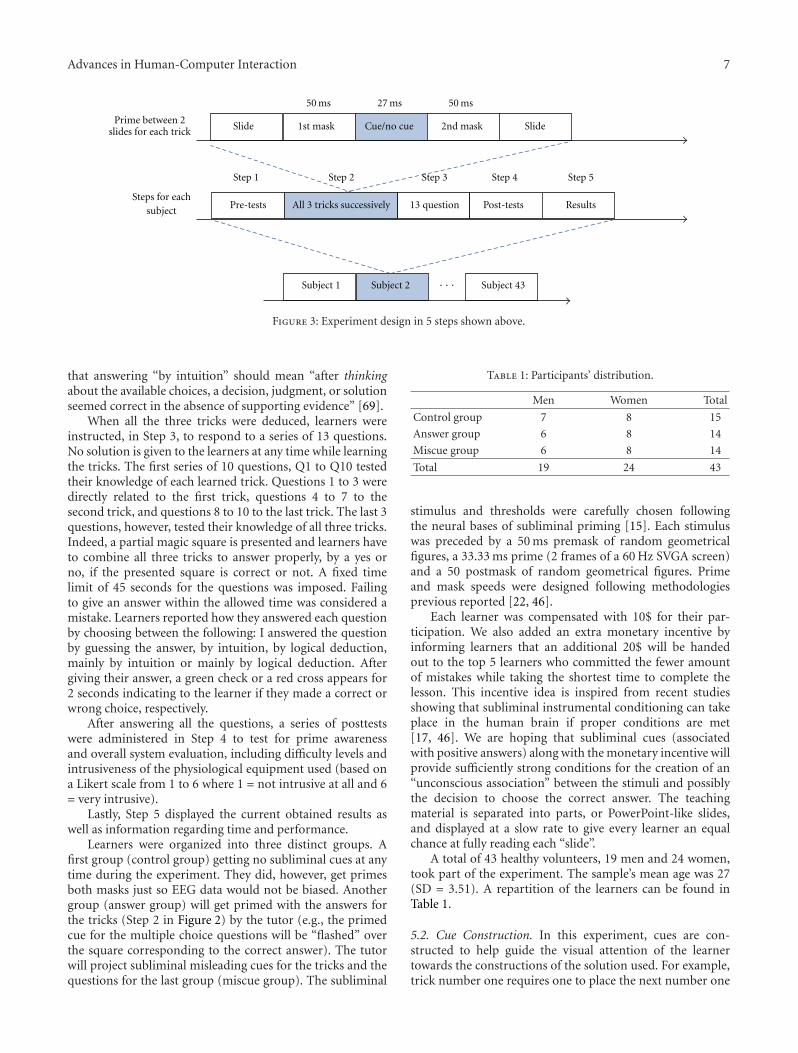
Advances in Human-Computer Interaction 7
Prime between 2slides for each trick
Steps for eachsubject
Step 1 Step 2 Step 3 Step 4 Step 5
1st mask Cue/no cue 2nd maskSlide Slide
Subject 1 Subject 2 Subject 43· · ·
Pre-tests All 3 tricks successively 13 question Post-tests Results
50 ms 27 ms 50 ms
Figure 3: Experiment design in 5 steps shown above.
that answering “by intuition” should mean “after thinkingabout the available choices, a decision, judgment, or solutionseemed correct in the absence of supporting evidence” [69].
When all the three tricks were deduced, learners wereinstructed, in Step 3, to respond to a series of 13 questions.No solution is given to the learners at any time while learningthe tricks. The first series of 10 questions, Q1 to Q10 testedtheir knowledge of each learned trick. Questions 1 to 3 weredirectly related to the first trick, questions 4 to 7 to thesecond trick, and questions 8 to 10 to the last trick. The last 3questions, however, tested their knowledge of all three tricks.Indeed, a partial magic square is presented and learners haveto combine all three tricks to answer properly, by a yes orno, if the presented square is correct or not. A fixed timelimit of 45 seconds for the questions was imposed. Failingto give an answer within the allowed time was considered amistake. Learners reported how they answered each questionby choosing between the following: I answered the questionby guessing the answer, by intuition, by logical deduction,mainly by intuition or mainly by logical deduction. Aftergiving their answer, a green check or a red cross appears for2 seconds indicating to the learner if they made a correct orwrong choice, respectively.
After answering all the questions, a series of posttestswere administered in Step 4 to test for prime awarenessand overall system evaluation, including difficulty levels andintrusiveness of the physiological equipment used (based ona Likert scale from 1 to 6 where 1 = not intrusive at all and 6= very intrusive).
Lastly, Step 5 displayed the current obtained results aswell as information regarding time and performance.
Learners were organized into three distinct groups. Afirst group (control group) getting no subliminal cues at anytime during the experiment. They did, however, get primesboth masks just so EEG data would not be biased. Anothergroup (answer group) will get primed with the answers forthe tricks (Step 2 in Figure 2) by the tutor (e.g., the primedcue for the multiple choice questions will be “flashed” overthe square corresponding to the correct answer). The tutorwill project subliminal misleading cues for the tricks and thequestions for the last group (miscue group). The subliminal
Table 1: Participants’ distribution.
Men Women Total
Control group 7 8 15
Answer group 6 8 14
Miscue group 6 8 14
Total 19 24 43
stimulus and thresholds were carefully chosen followingthe neural bases of subliminal priming [15]. Each stimuluswas preceded by a 50 ms premask of random geometricalfigures, a 33.33 ms prime (2 frames of a 60 Hz SVGA screen)and a 50 postmask of random geometrical figures. Primeand mask speeds were designed following methodologiesprevious reported [22, 46].
Each learner was compensated with 10$ for their par-ticipation. We also added an extra monetary incentive byinforming learners that an additional 20$ will be handedout to the top 5 learners who committed the fewer amountof mistakes while taking the shortest time to complete thelesson. This incentive idea is inspired from recent studiesshowing that subliminal instrumental conditioning can takeplace in the human brain if proper conditions are met[17, 46]. We are hoping that subliminal cues (associatedwith positive answers) along with the monetary incentive willprovide sufficiently strong conditions for the creation of an“unconscious association” between the stimuli and possiblythe decision to choose the correct answer. The teachingmaterial is separated into parts, or PowerPoint-like slides,and displayed at a slow rate to give every learner an equalchance at fully reading each “slide”.
A total of 43 healthy volunteers, 19 men and 24 women,took part of the experiment. The sample’s mean age was 27(SD = 3.51). A repartition of the learners can be found inTable 1.
5.2. Cue Construction. In this experiment, cues are con-structed to help guide the visual attention of the learnertowards the constructions of the solution used. For example,trick number one requires one to place the next number one
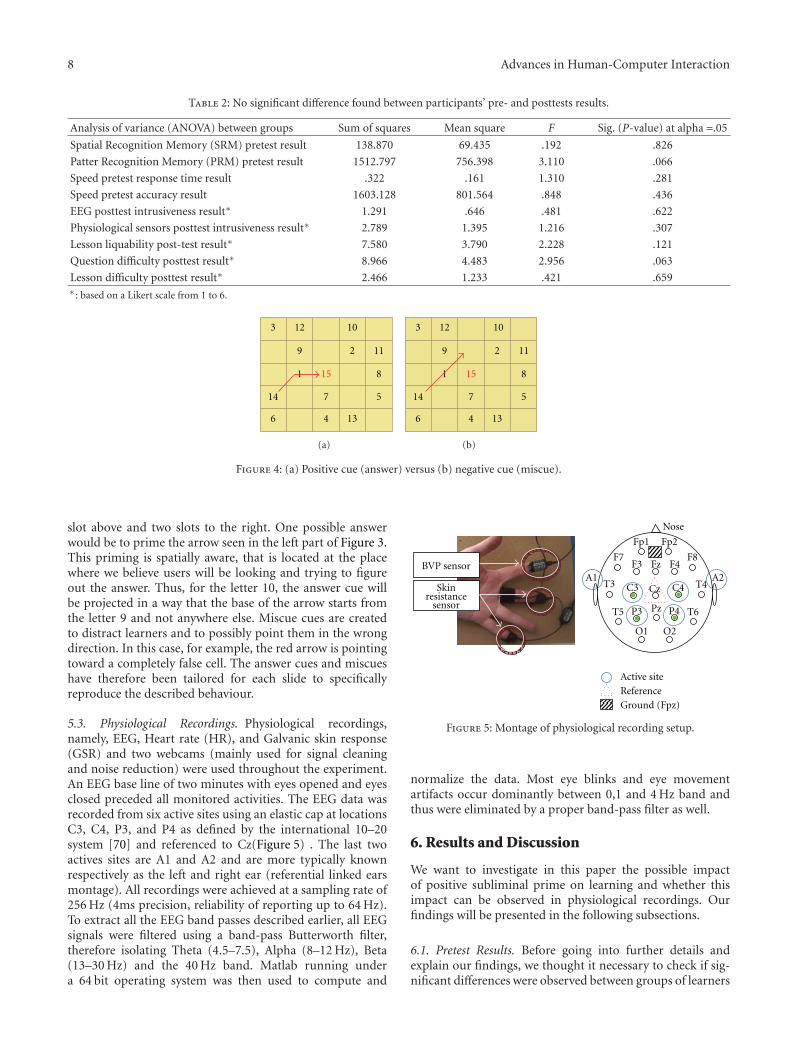
8 Advances in Human-Computer Interaction
Table 2: No significant difference found between participants’ pre- and posttests results.
Analysis of variance (ANOVA) between groups Sum of squares Mean square F Sig. (P-value) at alpha =.05
Spatial Recognition Memory (SRM) pretest result 138.870 69.435 .192 .826
Patter Recognition Memory (PRM) pretest result 1512.797 756.398 3.110 .066
Speed pretest response time result .322 .161 1.310 .281
Speed pretest accuracy result 1603.128 801.564 .848 .436
EEG posttest intrusiveness result∗ 1.291 .646 .481 .622
Physiological sensors posttest intrusiveness result∗ 2.789 1.395 1.216 .307
Lesson liquability post-test result∗ 7.580 3.790 2.228 .121
Question difficulty posttest result∗ 8.966 4.483 2.956 .063
Lesson difficulty posttest result∗ 2.466 1.233 .421 .659∗: based on a Likert scale from 1 to 6.
3 12 10
1129
1 15 8
5714
6 4 13
(a)
3 12 10
1129
1 15 8
5714
6 4 13
(b)
Figure 4: (a) Positive cue (answer) versus (b) negative cue (miscue).
slot above and two slots to the right. One possible answerwould be to prime the arrow seen in the left part of Figure 3.This priming is spatially aware, that is located at the placewhere we believe users will be looking and trying to figureout the answer. Thus, for the letter 10, the answer cue willbe projected in a way that the base of the arrow starts fromthe letter 9 and not anywhere else. Miscue cues are createdto distract learners and to possibly point them in the wrongdirection. In this case, for example, the red arrow is pointingtoward a completely false cell. The answer cues and miscueshave therefore been tailored for each slide to specificallyreproduce the described behaviour.
5.3. Physiological Recordings. Physiological recordings,namely, EEG, Heart rate (HR), and Galvanic skin response(GSR) and two webcams (mainly used for signal cleaningand noise reduction) were used throughout the experiment.An EEG base line of two minutes with eyes opened and eyesclosed preceded all monitored activities. The EEG data wasrecorded from six active sites using an elastic cap at locationsC3, C4, P3, and P4 as defined by the international 10–20system [70] and referenced to Cz(Figure 5) . The last twoactives sites are A1 and A2 and are more typically knownrespectively as the left and right ear (referential linked earsmontage). All recordings were achieved at a sampling rate of256 Hz (4ms precision, reliability of reporting up to 64 Hz).To extract all the EEG band passes described earlier, all EEGsignals were filtered using a band-pass Butterworth filter,therefore isolating Theta (4.5–7.5), Alpha (8–12 Hz), Beta(13–30 Hz) and the 40 Hz band. Matlab running undera 64 bit operating system was then used to compute and
Fp1
F7F3 Fz F4
F8
T3 C3 Cz C4 T4
T5 P3 Pz P4
O1 O2
A1 A2
T6
Fp2
Ground (Fpz)
Active site
Reference
BVP sensor
Skinresistance
sensor
Nose
Figure 5: Montage of physiological recording setup.
normalize the data. Most eye blinks and eye movementartifacts occur dominantly between 0,1 and 4 Hz band andthus were eliminated by a proper band-pass filter as well.
6. Results and Discussion
We want to investigate in this paper the possible impactof positive subliminal prime on learning and whether thisimpact can be observed in physiological recordings. Ourfindings will be presented in the following subsections.
6.1. Pretest Results. Before going into further details andexplain our findings, we thought it necessary to check if sig-nificant differences were observed between groups of learners
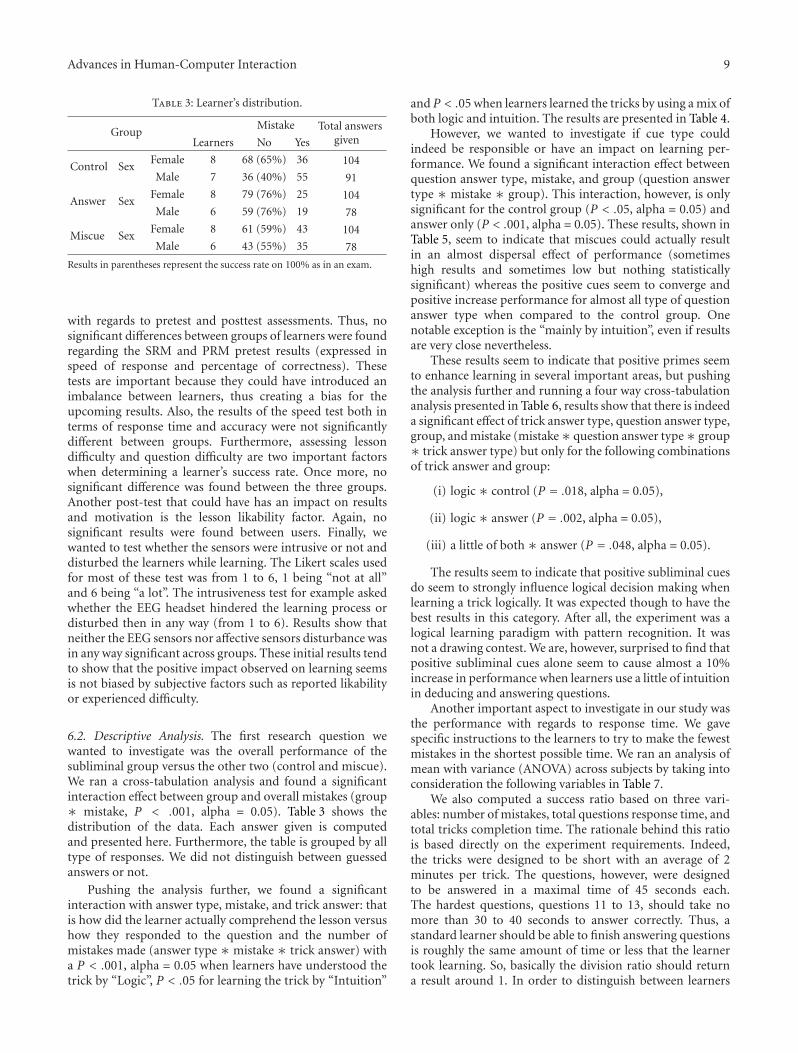
Advances in Human-Computer Interaction 9
Table 3: Learner’s distribution.
GroupMistake Total answers
givenLearners No Yes
Control SexFemale 8 68 (65%) 36 104
Male 7 36 (40%) 55 91
Answer SexFemale 8 79 (76%) 25 104
Male 6 59 (76%) 19 78
Miscue SexFemale 8 61 (59%) 43 104
Male 6 43 (55%) 35 78
Results in parentheses represent the success rate on 100% as in an exam.
with regards to pretest and posttest assessments. Thus, nosignificant differences between groups of learners were foundregarding the SRM and PRM pretest results (expressed inspeed of response and percentage of correctness). Thesetests are important because they could have introduced animbalance between learners, thus creating a bias for theupcoming results. Also, the results of the speed test both interms of response time and accuracy were not significantlydifferent between groups. Furthermore, assessing lessondifficulty and question difficulty are two important factorswhen determining a learner’s success rate. Once more, nosignificant difference was found between the three groups.Another post-test that could have has an impact on resultsand motivation is the lesson likability factor. Again, nosignificant results were found between users. Finally, wewanted to test whether the sensors were intrusive or not anddisturbed the learners while learning. The Likert scales usedfor most of these test was from 1 to 6, 1 being “not at all”and 6 being “a lot”. The intrusiveness test for example askedwhether the EEG headset hindered the learning process ordisturbed then in any way (from 1 to 6). Results show thatneither the EEG sensors nor affective sensors disturbance wasin any way significant across groups. These initial results tendto show that the positive impact observed on learning seemsis not biased by subjective factors such as reported likabilityor experienced difficulty.
6.2. Descriptive Analysis. The first research question wewanted to investigate was the overall performance of thesubliminal group versus the other two (control and miscue).We ran a cross-tabulation analysis and found a significantinteraction effect between group and overall mistakes (group∗ mistake, P < .001, alpha = 0.05). Table 3 shows thedistribution of the data. Each answer given is computedand presented here. Furthermore, the table is grouped by alltype of responses. We did not distinguish between guessedanswers or not.
Pushing the analysis further, we found a significantinteraction with answer type, mistake, and trick answer: thatis how did the learner actually comprehend the lesson versushow they responded to the question and the number ofmistakes made (answer type ∗ mistake ∗ trick answer) witha P < .001, alpha = 0.05 when learners have understood thetrick by “Logic”, P < .05 for learning the trick by “Intuition”
and P < .05 when learners learned the tricks by using a mix ofboth logic and intuition. The results are presented in Table 4.
However, we wanted to investigate if cue type couldindeed be responsible or have an impact on learning per-formance. We found a significant interaction effect betweenquestion answer type, mistake, and group (question answertype ∗ mistake ∗ group). This interaction, however, is onlysignificant for the control group (P < .05, alpha = 0.05) andanswer only (P < .001, alpha = 0.05). These results, shown inTable 5, seem to indicate that miscues could actually resultin an almost dispersal effect of performance (sometimeshigh results and sometimes low but nothing statisticallysignificant) whereas the positive cues seem to converge andpositive increase performance for almost all type of questionanswer type when compared to the control group. Onenotable exception is the “mainly by intuition”, even if resultsare very close nevertheless.
These results seem to indicate that positive primes seemto enhance learning in several important areas, but pushingthe analysis further and running a four way cross-tabulationanalysis presented in Table 6, results show that there is indeeda significant effect of trick answer type, question answer type,group, and mistake (mistake∗ question answer type∗ group∗ trick answer type) but only for the following combinationsof trick answer and group:
(i) logic ∗ control (P = .018, alpha = 0.05),
(ii) logic ∗ answer (P = .002, alpha = 0.05),
(iii) a little of both ∗ answer (P = .048, alpha = 0.05).
The results seem to indicate that positive subliminal cuesdo seem to strongly influence logical decision making whenlearning a trick logically. It was expected though to have thebest results in this category. After all, the experiment was alogical learning paradigm with pattern recognition. It wasnot a drawing contest. We are, however, surprised to find thatpositive subliminal cues alone seem to cause almost a 10%increase in performance when learners use a little of intuitionin deducing and answering questions.
Another important aspect to investigate in our study wasthe performance with regards to response time. We gavespecific instructions to the learners to try to make the fewestmistakes in the shortest possible time. We ran an analysis ofmean with variance (ANOVA) across subjects by taking intoconsideration the following variables in Table 7.
We also computed a success ratio based on three vari-ables: number of mistakes, total questions response time, andtotal tricks completion time. The rationale behind this ratiois based directly on the experiment requirements. Indeed,the tricks were designed to be short with an average of 2minutes per trick. The questions, however, were designedto be answered in a maximal time of 45 seconds each.The hardest questions, questions 11 to 13, should take nomore than 30 to 40 seconds to answer correctly. Thus, astandard learner should be able to finish answering questionsis roughly the same amount of time or less that the learnertook learning. So, basically the division ratio should returna result around 1. In order to distinguish between learners
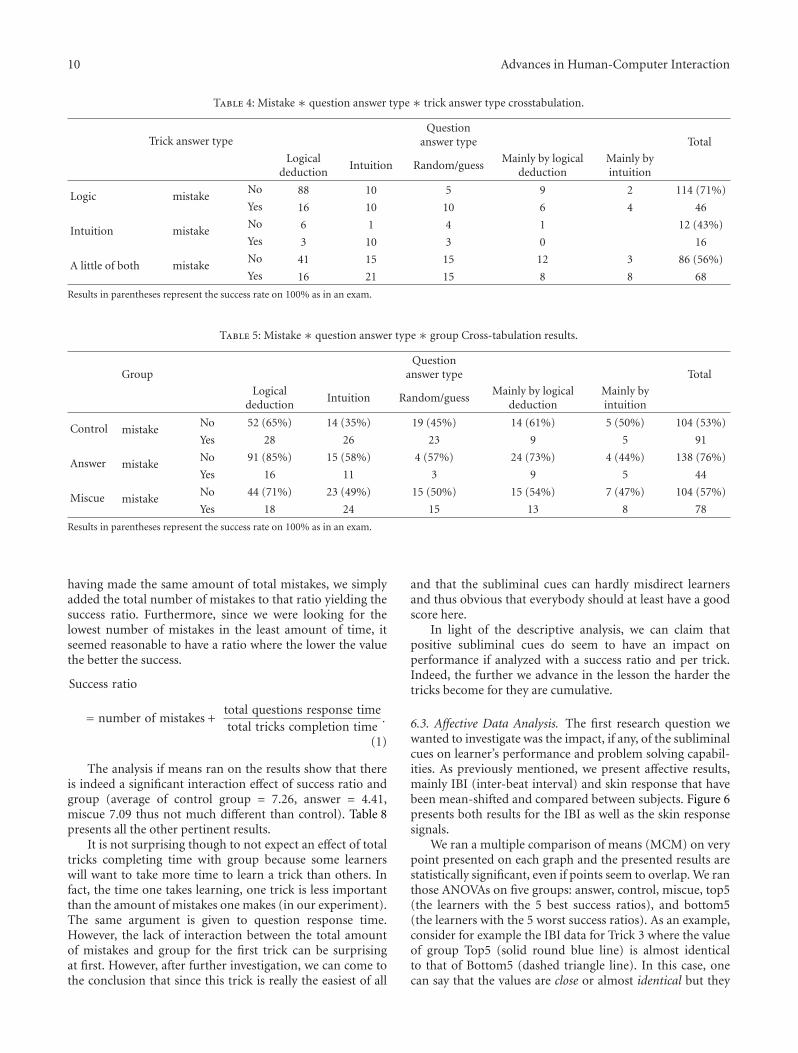
10 Advances in Human-Computer Interaction
Table 4: Mistake ∗ question answer type ∗ trick answer type crosstabulation.
Trick answer typeQuestion
answer type Total
Logicaldeduction
Intuition Random/guessMainly by logical
deductionMainly byintuition
Logic mistakeNo 88 10 5 9 2 114 (71%)
Yes 16 10 10 6 4 46
Intuition mistakeNo 6 1 4 1 12 (43%)
Yes 3 10 3 0 16
A little of both mistakeNo 41 15 15 12 3 86 (56%)
Yes 16 21 15 8 8 68
Results in parentheses represent the success rate on 100% as in an exam.
Table 5: Mistake ∗ question answer type ∗ group Cross-tabulation results.
GroupQuestion
answer type Total
Logicaldeduction
Intuition Random/guessMainly by logical
deductionMainly byintuition
Control mistakeNo 52 (65%) 14 (35%) 19 (45%) 14 (61%) 5 (50%) 104 (53%)
Yes 28 26 23 9 5 91
Answer mistakeNo 91 (85%) 15 (58%) 4 (57%) 24 (73%) 4 (44%) 138 (76%)
Yes 16 11 3 9 5 44
Miscue mistakeNo 44 (71%) 23 (49%) 15 (50%) 15 (54%) 7 (47%) 104 (57%)
Yes 18 24 15 13 8 78
Results in parentheses represent the success rate on 100% as in an exam.
having made the same amount of total mistakes, we simplyadded the total number of mistakes to that ratio yielding thesuccess ratio. Furthermore, since we were looking for thelowest number of mistakes in the least amount of time, itseemed reasonable to have a ratio where the lower the valuethe better the success.
Success ratio
= number of mistakes +total questions response timetotal tricks completion time
.
(1)
The analysis if means ran on the results show that thereis indeed a significant interaction effect of success ratio andgroup (average of control group = 7.26, answer = 4.41,miscue 7.09 thus not much different than control). Table 8presents all the other pertinent results.
It is not surprising though to not expect an effect of totaltricks completing time with group because some learnerswill want to take more time to learn a trick than others. Infact, the time one takes learning, one trick is less importantthan the amount of mistakes one makes (in our experiment).The same argument is given to question response time.However, the lack of interaction between the total amountof mistakes and group for the first trick can be surprisingat first. However, after further investigation, we can come tothe conclusion that since this trick is really the easiest of all
and that the subliminal cues can hardly misdirect learnersand thus obvious that everybody should at least have a goodscore here.
In light of the descriptive analysis, we can claim thatpositive subliminal cues do seem to have an impact onperformance if analyzed with a success ratio and per trick.Indeed, the further we advance in the lesson the harder thetricks become for they are cumulative.
6.3. Affective Data Analysis. The first research question wewanted to investigate was the impact, if any, of the subliminalcues on learner’s performance and problem solving capabil-ities. As previously mentioned, we present affective results,mainly IBI (inter-beat interval) and skin response that havebeen mean-shifted and compared between subjects. Figure 6presents both results for the IBI as well as the skin responsesignals.
We ran a multiple comparison of means (MCM) on verypoint presented on each graph and the presented results arestatistically significant, even if points seem to overlap. We ranthose ANOVAs on five groups: answer, control, miscue, top5(the learners with the 5 best success ratios), and bottom5(the learners with the 5 worst success ratios). As an example,consider for example the IBI data for Trick 3 where the valueof group Top5 (solid round blue line) is almost identicalto that of Bottom5 (dashed triangle line). In this case, onecan say that the values are close or almost identical but they
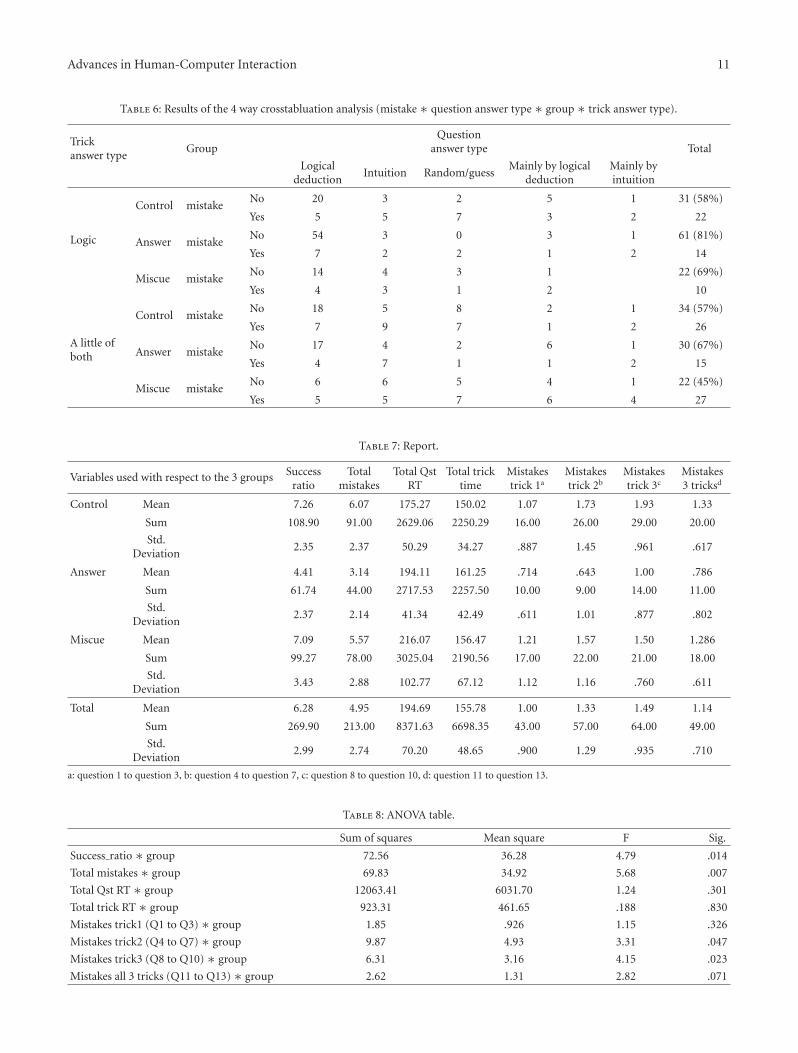
Advances in Human-Computer Interaction 11
Table 6: Results of the 4 way crosstabluation analysis (mistake ∗ question answer type ∗ group ∗ trick answer type).
Trickanswer type
GroupQuestion
answer type Total
Logicaldeduction
Intuition Random/guessMainly by logical
deductionMainly byintuition
Logic
Control mistakeNo 20 3 2 5 1 31 (58%)
Yes 5 5 7 3 2 22
Answer mistakeNo 54 3 0 3 1 61 (81%)
Yes 7 2 2 1 2 14
Miscue mistakeNo 14 4 3 1 22 (69%)
Yes 4 3 1 2 10
A little ofboth
Control mistakeNo 18 5 8 2 1 34 (57%)
Yes 7 9 7 1 2 26
Answer mistakeNo 17 4 2 6 1 30 (67%)
Yes 4 7 1 1 2 15
Miscue mistakeNo 6 6 5 4 1 22 (45%)
Yes 5 5 7 6 4 27
Table 7: Report.
Variables used with respect to the 3 groups Successratio
Totalmistakes
Total QstRT
Total tricktime
Mistakestrick 1a
Mistakestrick 2b
Mistakestrick 3c
Mistakes3 tricksd
Control Mean 7.26 6.07 175.27 150.02 1.07 1.73 1.93 1.33
Sum 108.90 91.00 2629.06 2250.29 16.00 26.00 29.00 20.00
Std.Deviation
2.35 2.37 50.29 34.27 .887 1.45 .961 .617
Answer Mean 4.41 3.14 194.11 161.25 .714 .643 1.00 .786
Sum 61.74 44.00 2717.53 2257.50 10.00 9.00 14.00 11.00
Std.Deviation
2.37 2.14 41.34 42.49 .611 1.01 .877 .802
Miscue Mean 7.09 5.57 216.07 156.47 1.21 1.57 1.50 1.286
Sum 99.27 78.00 3025.04 2190.56 17.00 22.00 21.00 18.00
Std.Deviation
3.43 2.88 102.77 67.12 1.12 1.16 .760 .611
Total Mean 6.28 4.95 194.69 155.78 1.00 1.33 1.49 1.14
Sum 269.90 213.00 8371.63 6698.35 43.00 57.00 64.00 49.00
Std.Deviation
2.99 2.74 70.20 48.65 .900 1.29 .935 .710
a: question 1 to question 3, b: question 4 to question 7, c: question 8 to question 10, d: question 11 to question 13.
Table 8: ANOVA table.
Sum of squares Mean square F Sig.
Success ratio ∗ group 72.56 36.28 4.79 .014
Total mistakes ∗ group 69.83 34.92 5.68 .007
Total Qst RT ∗ group 12063.41 6031.70 1.24 .301
Total trick RT ∗ group 923.31 461.65 .188 .830
Mistakes trick1 (Q1 to Q3) ∗ group 1.85 .926 1.15 .326
Mistakes trick2 (Q4 to Q7) ∗ group 9.87 4.93 3.31 .047
Mistakes trick3 (Q8 to Q10) ∗ group 6.31 3.16 4.15 .023
Mistakes all 3 tricks (Q11 to Q13) ∗ group 2.62 1.31 2.82 .071
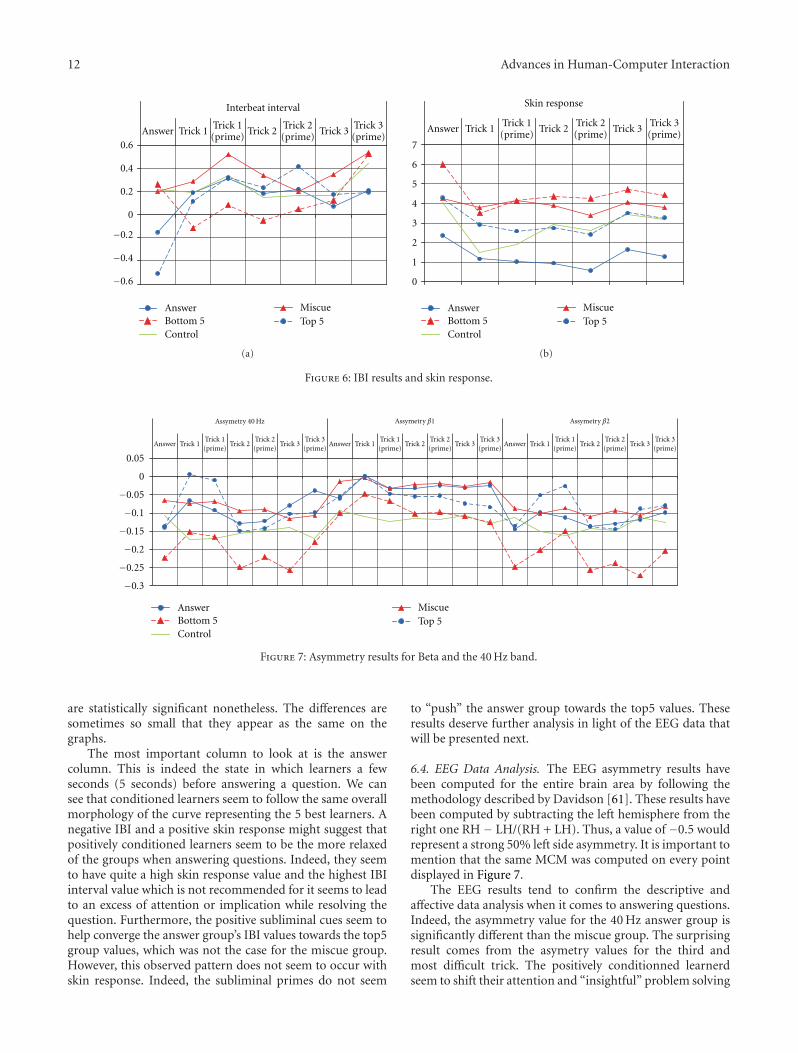
12 Advances in Human-Computer Interaction
Bottom 5Control
MiscueTop 5
Answer
Answer Trick 1Trick 2(prime)
Trick 2Trick 3(prime)
Trick 1(prime)
Trick 30.6
0.4
0.2
0
−0.2
−0.4
−0.6
Interbeat interval
(a)
0
1
2
3
4
5
6
7
Answer Trick 1Trick 2(prime)
Trick 2Trick 3(prime)
Trick 1(prime)
Trick 3
Skin response
Bottom 5Control
MiscueTop 5
Answer
(b)
Figure 6: IBI results and skin response.
−0.3
−0.25
−0.2
−0.15
−0.1
−0.05
0
0.05
Answer Trick 1Trick 2(prime)
Trick 2Trick 1(prime)
Answer Trick 1Trick 1(prime)
Answer Trick 1Trick 1(prime)
Trick 3Trick 3(prime)
Trick 2(prime)
Trick 2 Trick 3Trick 3(prime)
Trick 2(prime)
Trick 2 Trick 3Trick 3(prime)
Assymetry 40 Hz Assymetry β1 Assymetry β2
Bottom 5Control
MiscueTop 5
Answer
Figure 7: Asymmetry results for Beta and the 40 Hz band.
are statistically significant nonetheless. The differences aresometimes so small that they appear as the same on thegraphs.
The most important column to look at is the answercolumn. This is indeed the state in which learners a fewseconds (5 seconds) before answering a question. We cansee that conditioned learners seem to follow the same overallmorphology of the curve representing the 5 best learners. Anegative IBI and a positive skin response might suggest thatpositively conditioned learners seem to be the more relaxedof the groups when answering questions. Indeed, they seemto have quite a high skin response value and the highest IBIinterval value which is not recommended for it seems to leadto an excess of attention or implication while resolving thequestion. Furthermore, the positive subliminal cues seem tohelp converge the answer group’s IBI values towards the top5group values, which was not the case for the miscue group.However, this observed pattern does not seem to occur withskin response. Indeed, the subliminal primes do not seem
to “push” the answer group towards the top5 values. Theseresults deserve further analysis in light of the EEG data thatwill be presented next.
6.4. EEG Data Analysis. The EEG asymmetry results havebeen computed for the entire brain area by following themethodology described by Davidson [61]. These results havebeen computed by subtracting the left hemisphere from theright one RH − LH/(RH + LH). Thus, a value of −0.5 wouldrepresent a strong 50% left side asymmetry. It is important tomention that the same MCM was computed on every pointdisplayed in Figure 7.
The EEG results tend to confirm the descriptive andaffective data analysis when it comes to answering questions.Indeed, the asymmetry value for the 40 Hz answer group issignificantly different than the miscue group. The surprisingresult comes from the asymetry values for the third andmost difficult trick. The positively conditionned learnerdseem to shift their attention and “insightful” problem solving
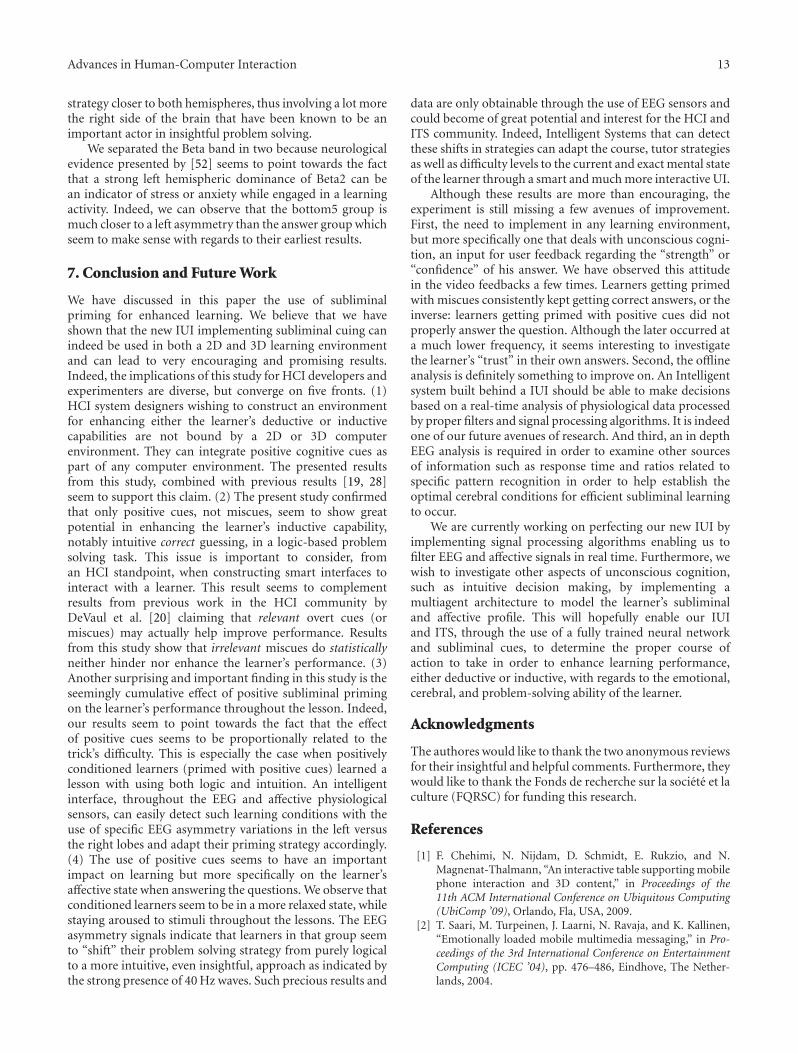
Advances in Human-Computer Interaction 13
strategy closer to both hemispheres, thus involving a lot morethe right side of the brain that have been known to be animportant actor in insightful problem solving.
We separated the Beta band in two because neurologicalevidence presented by [52] seems to point towards the factthat a strong left hemispheric dominance of Beta2 can bean indicator of stress or anxiety while engaged in a learningactivity. Indeed, we can observe that the bottom5 group ismuch closer to a left asymmetry than the answer group whichseem to make sense with regards to their earliest results.
7. Conclusion and Future Work
We have discussed in this paper the use of subliminalpriming for enhanced learning. We believe that we haveshown that the new IUI implementing subliminal cuing canindeed be used in both a 2D and 3D learning environmentand can lead to very encouraging and promising results.Indeed, the implications of this study for HCI developers andexperimenters are diverse, but converge on five fronts. (1)HCI system designers wishing to construct an environmentfor enhancing either the learner’s deductive or inductivecapabilities are not bound by a 2D or 3D computerenvironment. They can integrate positive cognitive cues aspart of any computer environment. The presented resultsfrom this study, combined with previous results [19, 28]seem to support this claim. (2) The present study confirmedthat only positive cues, not miscues, seem to show greatpotential in enhancing the learner’s inductive capability,notably intuitive correct guessing, in a logic-based problemsolving task. This issue is important to consider, froman HCI standpoint, when constructing smart interfaces tointeract with a learner. This result seems to complementresults from previous work in the HCI community byDeVaul et al. [20] claiming that relevant overt cues (ormiscues) may actually help improve performance. Resultsfrom this study show that irrelevant miscues do statisticallyneither hinder nor enhance the learner’s performance. (3)Another surprising and important finding in this study is theseemingly cumulative effect of positive subliminal primingon the learner’s performance throughout the lesson. Indeed,our results seem to point towards the fact that the effectof positive cues seems to be proportionally related to thetrick’s difficulty. This is especially the case when positivelyconditioned learners (primed with positive cues) learned alesson with using both logic and intuition. An intelligentinterface, throughout the EEG and affective physiologicalsensors, can easily detect such learning conditions with theuse of specific EEG asymmetry variations in the left versusthe right lobes and adapt their priming strategy accordingly.(4) The use of positive cues seems to have an importantimpact on learning but more specifically on the learner’saffective state when answering the questions. We observe thatconditioned learners seem to be in a more relaxed state, whilestaying aroused to stimuli throughout the lessons. The EEGasymmetry signals indicate that learners in that group seemto “shift” their problem solving strategy from purely logicalto a more intuitive, even insightful, approach as indicated bythe strong presence of 40 Hz waves. Such precious results and
data are only obtainable through the use of EEG sensors andcould become of great potential and interest for the HCI andITS community. Indeed, Intelligent Systems that can detectthese shifts in strategies can adapt the course, tutor strategiesas well as difficulty levels to the current and exact mental stateof the learner through a smart and much more interactive UI.
Although these results are more than encouraging, theexperiment is still missing a few avenues of improvement.First, the need to implement in any learning environment,but more specifically one that deals with unconscious cogni-tion, an input for user feedback regarding the “strength” or“confidence” of his answer. We have observed this attitudein the video feedbacks a few times. Learners getting primedwith miscues consistently kept getting correct answers, or theinverse: learners getting primed with positive cues did notproperly answer the question. Although the later occurred ata much lower frequency, it seems interesting to investigatethe learner’s “trust” in their own answers. Second, the offlineanalysis is definitely something to improve on. An Intelligentsystem built behind a IUI should be able to make decisionsbased on a real-time analysis of physiological data processedby proper filters and signal processing algorithms. It is indeedone of our future avenues of research. And third, an in depthEEG analysis is required in order to examine other sourcesof information such as response time and ratios related tospecific pattern recognition in order to help establish theoptimal cerebral conditions for efficient subliminal learningto occur.
We are currently working on perfecting our new IUI byimplementing signal processing algorithms enabling us tofilter EEG and affective signals in real time. Furthermore, wewish to investigate other aspects of unconscious cognition,such as intuitive decision making, by implementing amultiagent architecture to model the learner’s subliminaland affective profile. This will hopefully enable our IUIand ITS, through the use of a fully trained neural networkand subliminal cues, to determine the proper course ofaction to take in order to enhance learning performance,either deductive or inductive, with regards to the emotional,cerebral, and problem-solving ability of the learner.
Acknowledgments
The authores would like to thank the two anonymous reviewsfor their insightful and helpful comments. Furthermore, theywould like to thank the Fonds de recherche sur la societe et laculture (FQRSC) for funding this research.
References
[1] F. Chehimi, N. Nijdam, D. Schmidt, E. Rukzio, and N.Magnenat-Thalmann, “An interactive table supporting mobilephone interaction and 3D content,” in Proceedings of the11th ACM International Conference on Ubiquitous Computing(UbiComp ’09), Orlando, Fla, USA, 2009.
[2] T. Saari, M. Turpeinen, J. Laarni, N. Ravaja, and K. Kallinen,“Emotionally loaded mobile multimedia messaging,” in Pro-ceedings of the 3rd International Conference on EntertainmentComputing (ICEC ’04), pp. 476–486, Eindhove, The Nether-lands, 2004.

14 Advances in Human-Computer Interaction
[3] A. Schmidt, A. K. Dey, A. L. Kun, and W. Spiessl, “Automotiveuser interfaces: human computer interaction in the car,”in Proceedings of the 28th International Conference ExtendedAbstracts on Human Factors in Computing Systems, pp. 3177–3180, ACM, Atlanta, Ga, USA, 2010.
[4] A. Finke, A. Lenhardt, and H. Ritter, “The MindGame: a P300-based brain-computer interface game,” Neural Networks, vol.22, no. 9, pp. 1329–1333, 2009.
[5] E. Blanchard, P. Chalfoun, and C. Frasson, “Towards advancedlearner modeling: discussions on quasi real-time adaptationwith physiological data,” in Proceedings of the 7th IEEEInternational Conference on Advanced Learning Technologies(ICALT ’07), pp. 809–813, Niigata, Japan, July 2007.
[6] C. Conati, “Probabilistic assessment of user’s emotions ineducational games,” Applied Artificial Intelligence, vol. 16, no.7-8, pp. 555–575, 2002.
[7] A. C. Graesser, P. Chipman, B. C. Haynes, and A. Olney, “Autotutor: an intelligent tutoring system with mixed-initiativedialogue,” IEEE Transactions on Education, vol. 48, no. 4, pp.612–618, 2005.
[8] C. L. Lisetti and F. Nasoz, “Using noninvasive wearablecomputers to recognize human emotions from physiologicalsignals,” EURASIP Journal on Applied Signal Processing, vol.2004, no. 11, pp. 1672–1687, 2004.
[9] A. Damasio, Descarte’s Error—Emotion, Reason and theHuman Brain, Putman Press, New York, NY, USA, 1994.
[10] A. M. Isen, Positive Affect and Decision Making. Handbook ofEmotions, Guilford, New York, NY, USA, 2000.
[11] S. R. Quartz, “Reason, emotion and decision-making: risk andreward computation with feeling,” Trends in Cognitive Sciences,vol. 13, no. 5, pp. 209–215, 2009.
[12] R. E. Snow, L. Corno, and D. Jackson, “Individual differencesin affective and cognitive functions,” in Handbook of Educa-tional Psychology, D. C. Berliner and R. C. Calfee, Eds., pp.243–310, Prentice Hall, New York, NY, USA, 1996.
[13] A. Damasio, Descartes Error—Emotion, Reason and theHumain Brain, Puttman Press, New-York, NY, USA, 1994.
[14] J. P. Guillford and R. Hopgner, The Analysis of Intelligence,McGraw-Hill Book, New York, NY, USA, 1971.
[15] A. Del Cul, S. Baillet, and S. Dehaene, “Brain dynamics under-lying the nonlinear threshold for access to consciousness,”PLoS Biology, vol. 5, no. 10, article e260, 2007.
[16] S. Kouider and S. Dehaene, “Levels of processing during non-conscious perception: a critical review of visual masking,”Philosophical Transactions of the Royal Society B, vol. 362, no.1481, pp. 857–875, 2007.
[17] E. J. Strahan, S. J. Spencer, and M. P. Zanna, “Subliminalpriming and persuasion: striking while the iron is hot,” Journalof Experimental Social Psychology, vol. 38, no. 6, pp. 556–568,2002.
[18] Y. Wu and X. Zhou, “The P300 and reward valence, magni-tude, and expectancy in outcome evaluation,” Brain Research,vol. 1286, pp. 114–122, 2009.
[19] P. Chalfoun and C. Frasson, “Subliminal priming enhanceslearning in a distant virtual 3D intelligent tutoring system,”IEEE Multidisciplinary Engineering Education Magazine, vol. 3,pp. 125–130, 2008.
[20] R. W. DeVaul, A. Pentland, and V. R. Corey, “The memoryglasses: subliminal vs. overt memory support with imperfectinformation,” in Proceedings of the IEEE International Sympo-sium on Wearable Computers, pp. 146–153, IEEE ComputerSociety, New York, NY, USA, 2003.
[21] A. Dijksterhuis, J. Preston, D. M. Wegner, and H. Aarts,“Effects of subliminal priming of self and God on self-attribution of authorship for events,” Journal of ExperimentalSocial Psychology, vol. 44, no. 1, pp. 2–9, 2008.
[22] D. Hermans, A. Spruyt, J. De Houwer, and P. Eelen, “Affectivepriming with subliminally presented pictures,” CanadianJournal of Experimental Psychology, vol. 57, no. 2, pp. 97–114,2003.
[23] F. L. Wallace, “The effect of subliminal help presentations onlearning a text editor,” Information Processing and Manage-ment, vol. 27, no. 2-3, pp. 211–218, 1991.
[24] M. Chaouachi, P. Chalfoun, I. Jraidi, and C. Frasson, “Affectand mental engagement: towards adaptability for intelligentsystems,” in Proceedings of the 23rd International FLAIRSConference, AAAI Press, Daytona Beach, Fla, USA, May 2010.
[25] E. Donchin and M. G. H. Choles, “Is the P300 componenta manifestation of cognitive updating?” The Behavioral andBrain Sciences, vol. 11, pp. 357–427, 1988.
[26] H. M. Gray, N. Ambady, W. T. Lowenthal, and P. Deldin, “P300as an index of attention to self-relevant stimuli,” Journal ofExperimental Social Psychology, vol. 40, no. 2, pp. 216–224,2004.
[27] L. J. Prinzel III, F. G. Freeman, M. W. Scerbo, P. J. Mikulka,and A. T. Pope, “Effects of a psychophysiological systemfor adaptive automation on performance, workload, and theevent-related potential P300 component,” Human Factors, vol.45, no. 4, pp. 601–613, 2003.
[28] P. Chalfoun and C. Frasson, “Showing the positive influenceof subliminal cues on learner’s performance and intuition:an ERP study,” in Proceedings of the the 10th InternationalConference on Intelligent Tutoring Systems (ITS ’10), V. Aleven,J. Kay, and J. Mostow, Eds., pp. 288–290, Springer, Pittsburgh,Pa, USA, 2010.
[29] I. Jraidi and C. Frasson, “Subliminally enhancing self-esteem:impact on learner performance and affective state,” in Proceed-ings of the 10th International Conference on Intelligent TutoringSystems, Pittsburgh, Pa, USA, 2010.
[30] E. Poppel, R. Held, and D. Frost, “Residual visual functionafter brain wounds involving the central visual pathways inman,” Nature, vol. 243, no. 5405, pp. 295–296, 1973.
[31] B. De Gelder, J. Vroomen, G. Pourtois, and L. Weiskrantz,“Non-conscious recognition of affect in the absence of striatecortex,” NeuroReport, vol. 10, no. 18, pp. 3759–3763, 1999.
[32] S. Dehaene, J.-P. Changeux, L. Naccache, J. Sackur, and C.Sergent, “Conscious, preconscious, and subliminal processing:a testable taxonomy,” Trends in Cognitive Sciences, vol. 10, no.5, pp. 204–211, 2006.
[33] P. Chalfoun and C. Frasson, “Optimal affective conditions forsubconscious learning in a 3D intelligent tutoring system,”in Proceedings of the International Conference on HumanComputer Interactions International (HCII ’09), San Diego,Calif, USA, 2009.
[34] P. C. Schutte, Assessing the effects of momentary priming onmemory retention during an interference task, M.S. thesis,Virginia Commonwealth University, Richmond, Va, USA,2005.
[35] J. P. Mitchell, C. N. Macrae, J. W. Schooler, A. C. Rowe, andA. B. Milne, “Directed remembering: subliminal cues alternonconscious memory strategies,” Memory, vol. 10, no. 5-6,pp. 381–388, 2002.
[36] H. Prendinger and M. Ishizuka, “The empathic companion: acharacter-based interface that addresses users’ affective states,”Applied Artificial Intelligence, vol. 19, no. 3-4, pp. 267–285,2005.
Advances in Human-Computer Interaction 15
[37] W. Bosma and E. Andre, “Exploiting emotions to disam-biguate dialogue acts,” in Proceedings of the InternationalConference on Intelligent User Interfaces (IUI ’04), pp. 85–92,January 2004.
[38] C. Conati and H. MacLaren, “Empirically building andevaluating a probabilistic model of user affect,” User Modellingand User-Adapted Interaction, vol. 19, no. 3, pp. 267–303, 2009.
[39] S. K. D’Mello, S. D. Craig, B. Gholson, S. Franklin, R. W.Picard, and A. Graesser, “Integrating affect sensors in anintelligent tutoring system. Affective interactions: the com-puter in the affective loop,” in Proceedings of the InternationalConference on Intelligent User Interfaces, pp. 7–13, AMC Press,New York, NY, USA, 2005.
[40] S. W. McQuiggan and J. C. Lester, “Modeling and evaluatingempathy in embodied companion agents,” International Jour-nal of Human Computer Studies, vol. 65, no. 4, pp. 348–360,2007.
[41] R. W. Picard, E. Vyzas, and J. Healey, “Toward machine emo-tional intelligence: analysis of affective physiological state,”IEEE Transactions on Pattern Analysis and Machine Intelligence,vol. 23, no. 10, pp. 1175–1191, 2001.
[42] R. H. Stevens, T. Galloway, and C. Berka, “Exploring neuraltrajectories of scientific problem solving skill acquisition,” inProceedings of the 3rd International Conference on AugmentedCognition, pp. 400–408, Springer, Heidelberg, Germany, 2007.
[43] T. Watanabe, J. E. Nanez, and Y. Sasaki, “Perceptual learningwithout perception,” Nature, vol. 413, no. 6858, pp. 844–848,2001.
[44] J. A. Deutsch, D. Deutsch, P. H. Lindsay, and A. M. Treisman,“Comments and reply on “Selective attention: perception orresponse?”,” The Quarterly Journal of Experimental Psychology,vol. 19, no. 4, pp. 362–367, 1967.
[45] E. Govier and M. Pitts, “The contextual disambiguation of apolysemous word in an unattended message,” British Journalof Psychology, vol. 73, p. 8, 1982.
[46] M. Pessiglione, P. Petrovic, J. Daunizeau, S. Palminteri, R. J.Dolan, and C. D. Frith, “Subliminal instrumental conditioningdemonstrated in the human brain,” Neuron, vol. 59, no. 4, pp.561–567, 2008.
[47] J. C. Karremansa, W. Stroebeb, and J. Clausb, “Beyond Vicary’sfantasies: the impact of subliminal priming and brand choice,”Journal of Experimental Social Psychology, vol. 42, p. 6, 2005.
[48] B. S. Lowery, N. I. Eisenberger, C. D. Hardin, and S. Sinclair,“Long-term effects of subliminal priming on academic perfor-mance,” Basic and Applied Social Psychology, vol. 29, no. 2, pp.151–157, 2007.
[49] B. Baars, In the Theater of Consciousness, Oxford UniversityPress, New York, NY, USA, 1997.
[50] E. Van den Bussche, G. Hughes, N. Van Humbeeck, and B.Reynvoet, “The relation between consciousness and attention:an empirical study using the priming paradigm,” Conscious-ness and Cognition, vol. 19, no. 1, pp. 86–97, 2010.
[51] H. Berger, “Uberdas Elektrenkephalogramm des Menschen,”Nova Acta Leopoldina, vol. 6, pp. 171–309, 1929.
[52] J. Demos, Getting Started with Neuro-Feedback, W.W. Norton& Co, 2005.
[53] W. Klimesch, “EEG alpha and theta oscillations reflect cogni-tive and memory performance: a review and analysis,” BrainResearch Reviews, vol. 29, no. 2-3, pp. 169–195, 1999.
[54] B. De Smedt, R. H. Grabner, and B. Studer, “OscillatoryEEG correlates of arithmetic strategy use in addition andsubtraction,” Experimental Brain Research, vol. 195, no. 4, pp.635–642, 2009.
[55] D. J. L. G. Schutter and J. Van Honk, “Electrophysiologicalratio markers for the balance between reward and punish-ment,” Cognitive Brain Research, vol. 24, no. 3, pp. 685–690,2005.
[56] J. A. Gray, The Neuropsychology of Anxiety: An Enquiry into theSepto-Hippocampal System, Oxford University Press, Oxford,UK, 1982.
[57] G. G. Knyazev and H. R. Slobodskaya, “Personality trait ofbehavioral inhibition is associated with oscillatory systemsreciprocal relationships,” International Journal of Psychophys-iology, vol. 48, no. 3, pp. 247–261, 2003.
[58] G. Pfurtscheller and F. H. Lopes da Silva, “Event-relatedEEG/MEG synchronization and desynchronization: basicprinciples,” Clinical Neurophysiology, vol. 110, no. 11, pp.1842–1857, 1999.
[59] M. Jung-Beeman, E. M. Bowden, J. Haberman et al., “Neuralactivity when people solve verbal problems with insight,” PLoSBiology, vol. 2, no. 4, article e97, 2004.
[60] S. Sandkuhler and J. Bhattacharya, “Deconstructing insight:EEG correlates of insightful problem solving,” PLoS ONE, vol.3, no. 1, article e1459, 2008.
[61] R. J. Davidson, “EEG measures of cerebral asymmetry:conceptual and methodological issues,” International Journalof Neuroscience, vol. 39, no. 1-2, pp. 71–89, 1988.
[62] H. Ehrlichman and M. S. Wiener, “EEG asymmetry duringcovert mental activity,” Psychophysiology, vol. 17, no. 3, pp.228–235, 1980.
[63] H. Kwon, J. Cho, and E. Lee, “EEG asymmetry analysis of theleft and right brain activities during simple versus complexarithmetic learning,” Journal of Neurotherapy, vol. 13, no. 2,pp. 109–116, 2009.
[64] S. J. Luck, An Introduction to Event-Related Potential Tech-nique, The MIT Press, Cambridge, UK, 2005.
[65] R. Ley, “An introduction to the psychophysiology of breath-ing,” Biofeedback and Self-Regulation, vol. 19, no. 2, pp. 95–96,1994.
[66] R. L. Mandryk, K. M. Inkpen, and T. W. Calvert, “Usingpsychophysiological techniques to measure user experiencewith entertainment technologies,” Behaviour and InformationTechnology, vol. 25, no. 2, pp. 141–158, 2006.
[67] E. Criswell, Biofeedback and Somatics, Freeperson Press,Novato, Calif, USA, 1995.
[68] P. J. Lang, “The emotion probe: studies of motivation andattention,” American Psychologist, vol. 50, no. 5, pp. 372–385,1995.
[69] K. S. Bowers, “Intuition,” in Encyclopedia of Intelligence, R. J.Sternberg, Ed., pp. 613–629, Macmillan, New York, NY, USA,1994.
[70] H. H. Jasper, “The 10-20 electrode system of the internationalfederation,” Electroencephalography Clinical Neurophysiology,vol. 10, p. 5, 1958.
Hindawi Publishing CorporationAdvances in Human-Computer InteractionVolume 2011, Article ID 673585, 10 pagesdoi:10.1155/2011/673585
Research Article
How the Interpretation of Drivers’ Behavior in VirtualEnvironment Can Become a Road Design Tool: A Case Study
Marco Pasetto and Stefano Damiano Barbati
DCT, University of Padua, Via Marzolo 9, 35131 Padova, Italy
Correspondence should be addressed to Marco Pasetto, [email protected]
Received 28 October 2010; Revised 26 December 2010; Accepted 13 February 2011
Academic Editor: Andreas Riener
Copyright © 2011 M. Pasetto and S. D. Barbati. This is an open access article distributed under the Creative Commons AttributionLicense, which permits unrestricted use, distribution, and reproduction in any medium, provided the original work is properlycited.
Driving is the result of a psychological process that translates data, signals and direct/indirect messages into behavior, whichis continuously adapted to the exchange of varying stimuli between man, environment and vehicle. These stimuli are at timesnot perceived and at others perceived but not understood by the driver, even if they derive from tools (vertical signs, horizontalmarking) specifically conceived for his safety. The result is unsafe behavior of vehicle drivers. For this reason, the road environmentneeds to be radically redesigned. The paper describes a research, based on real and virtual environment surveys, aimed to betterunderstand drivers’ action-reaction mechanisms inside different scenarios, in order to gain informations useful for a correctorganization (design) of the road space. The driving simulator can help in developing, from road to laboratory, the study ofnew road design tools (geometrical, compositional, constructive ones, street furniture, etc.), because it can be used to evaluatesolutions before their usefulness is proved on the road.
1. Introduction
Road safety is due to several factors that depend on the rela-tionship between drivers, vehicle, road, and the surroundingenvironment. With regards to “drivers”, safety is related totheir behavior and risk perception at the moment in whichthe single action takes place [1, 2]. The psychological ele-ments that have repercussions on drivers’ decision processesare connected to the emotional and sensory sphere; they maydiffer each time in relation to the subject and their personalmotivations. In the same way, it can be observed that thebehavior of the driver is influenced by the stimuli producedby the road, by the message arisen from the single stimulus,and by the willingness, capacity, and aptitude of the road userto process the message while driving [3, 4].
It is clear that humans are the main protagonist of driv-ing, as they see, understand, recognize, interpret, evaluate,and make responsible (or irresponsible) choices. However,the surrounding environment, road platform inclusive, is nota passive scenery, because it continuously transmits to drivermessages and signals that sometimes, for willful purposes,induce actions finalized to specific behaviors (e.g., respect of
trajectory, limit speed, and defence of a right). For this rea-son, the road environment should be planned and designedin order to guide the user towards the most adequate and safechoices.
Two main ways (amid several intermediate options) existfor planning and designing the road environment: a theo-retical way that prevalently considers the dynamics of thevehicle and its interaction with the external space and anempirical way, based on the analysis of experimental data andinformation collected in the real environment, concerningdrivers’ behaviors related to the road scenery driven through.Some attempts have been done with the purpose to merge thetwo approaches, in special way anticipating the experimentalanalysis to the step of theoretical design. This is made possi-ble when the road layout is studied in a virtual environment,where not only the route can be reconstructed with all itscomponents (platform, markings, signs, buildings, etc.), butalso the behaviors can be simulated and a huge amount ofdata and information can be registered.
Several authors confirm that human behavior in a virtualenvironment can be considered sufficiently representative ofreality [5, 6], particularly when its reconstruction is accurate
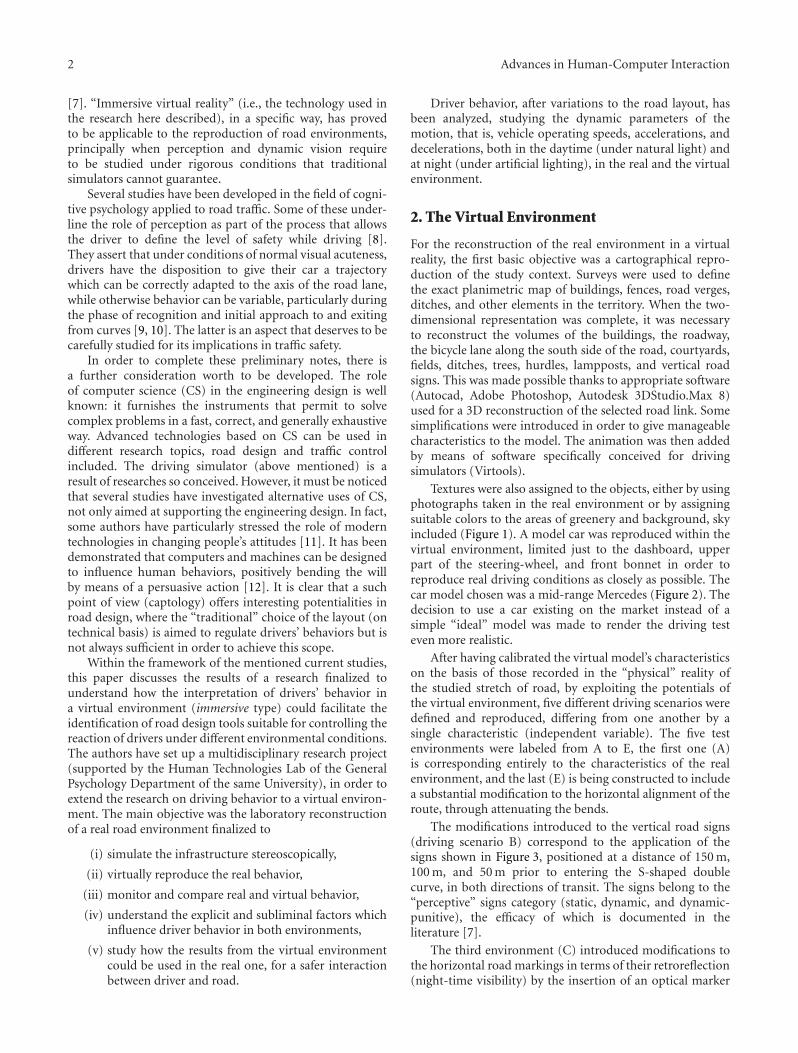
2 Advances in Human-Computer Interaction
[7]. “Immersive virtual reality” (i.e., the technology used inthe research here described), in a specific way, has provedto be applicable to the reproduction of road environments,principally when perception and dynamic vision requireto be studied under rigorous conditions that traditionalsimulators cannot guarantee.
Several studies have been developed in the field of cogni-tive psychology applied to road traffic. Some of these under-line the role of perception as part of the process that allowsthe driver to define the level of safety while driving [8].They assert that under conditions of normal visual acuteness,drivers have the disposition to give their car a trajectorywhich can be correctly adapted to the axis of the road lane,while otherwise behavior can be variable, particularly duringthe phase of recognition and initial approach to and exitingfrom curves [9, 10]. The latter is an aspect that deserves to becarefully studied for its implications in traffic safety.
In order to complete these preliminary notes, there isa further consideration worth to be developed. The roleof computer science (CS) in the engineering design is wellknown: it furnishes the instruments that permit to solvecomplex problems in a fast, correct, and generally exhaustiveway. Advanced technologies based on CS can be used indifferent research topics, road design and traffic controlincluded. The driving simulator (above mentioned) is aresult of researches so conceived. However, it must be noticedthat several studies have investigated alternative uses of CS,not only aimed at supporting the engineering design. In fact,some authors have particularly stressed the role of moderntechnologies in changing people’s attitudes [11]. It has beendemonstrated that computers and machines can be designedto influence human behaviors, positively bending the willby means of a persuasive action [12]. It is clear that a suchpoint of view (captology) offers interesting potentialities inroad design, where the “traditional” choice of the layout (ontechnical basis) is aimed to regulate drivers’ behaviors but isnot always sufficient in order to achieve this scope.
Within the framework of the mentioned current studies,this paper discusses the results of a research finalized tounderstand how the interpretation of drivers’ behavior ina virtual environment (immersive type) could facilitate theidentification of road design tools suitable for controlling thereaction of drivers under different environmental conditions.The authors have set up a multidisciplinary research project(supported by the Human Technologies Lab of the GeneralPsychology Department of the same University), in order toextend the research on driving behavior to a virtual environ-ment. The main objective was the laboratory reconstructionof a real road environment finalized to
(i) simulate the infrastructure stereoscopically,
(ii) virtually reproduce the real behavior,
(iii) monitor and compare real and virtual behavior,
(iv) understand the explicit and subliminal factors whichinfluence driver behavior in both environments,
(v) study how the results from the virtual environmentcould be used in the real one, for a safer interactionbetween driver and road.
Driver behavior, after variations to the road layout, hasbeen analyzed, studying the dynamic parameters of themotion, that is, vehicle operating speeds, accelerations, anddecelerations, both in the daytime (under natural light) andat night (under artificial lighting), in the real and the virtualenvironment.
2. The Virtual Environment
For the reconstruction of the real environment in a virtualreality, the first basic objective was a cartographical repro-duction of the study context. Surveys were used to definethe exact planimetric map of buildings, fences, road verges,ditches, and other elements in the territory. When the two-dimensional representation was complete, it was necessaryto reconstruct the volumes of the buildings, the roadway,the bicycle lane along the south side of the road, courtyards,fields, ditches, trees, hurdles, lampposts, and vertical roadsigns. This was made possible thanks to appropriate software(Autocad, Adobe Photoshop, Autodesk 3DStudio.Max 8)used for a 3D reconstruction of the selected road link. Somesimplifications were introduced in order to give manageablecharacteristics to the model. The animation was then addedby means of software specifically conceived for drivingsimulators (Virtools).
Textures were also assigned to the objects, either by usingphotographs taken in the real environment or by assigningsuitable colors to the areas of greenery and background, skyincluded (Figure 1). A model car was reproduced within thevirtual environment, limited just to the dashboard, upperpart of the steering-wheel, and front bonnet in order toreproduce real driving conditions as closely as possible. Thecar model chosen was a mid-range Mercedes (Figure 2). Thedecision to use a car existing on the market instead of asimple “ideal” model was made to render the driving testeven more realistic.
After having calibrated the virtual model’s characteristicson the basis of those recorded in the “physical” reality ofthe studied stretch of road, by exploiting the potentials ofthe virtual environment, five different driving scenarios weredefined and reproduced, differing from one another by asingle characteristic (independent variable). The five testenvironments were labeled from A to E, the first one (A)is corresponding entirely to the characteristics of the realenvironment, and the last (E) is being constructed to includea substantial modification to the horizontal alignment of theroute, through attenuating the bends.
The modifications introduced to the vertical road signs(driving scenario B) correspond to the application of thesigns shown in Figure 3, positioned at a distance of 150 m,100 m, and 50 m prior to entering the S-shaped doublecurve, in both directions of transit. The signs belong to the“perceptive” signs category (static, dynamic, and dynamic-punitive), the efficacy of which is documented in theliterature [7].
The third environment (C) introduced modifications tothe horizontal road markings in terms of their retroreflection(night-time visibility) by the insertion of an optical marker

Advances in Human-Computer Interaction 3
(a) (b)
Figure 1: Details of the virtual environment.
(a) (b)
Figure 2: Details of the driving simulator.
Figure 3: Types of vertical signs inserted in driving environment B.
Table 1: Synopsis of different scenarios analysed during the test.
Scenario Description
A Real environment
B A + vertical signs
C A + horizontal marking
D A + vertical signs + horizontal marking
E Modified road layout
every 10 m along the lines delimiting the roadway and lanes[13]. Previous studies have demonstrated that the introduc-tion of these markers can have an effect on drivers’ attitudeto speed on curvilinear stretches, as well as improving theperception of the planimetric geometry of the road axis[14, 15]. The fourth scenario (D) was a combination of thesituations B and C (Table 1).
The study was planned without considering interactionamong vehicles, because of the variability of parameters, thiscan be introduced in the behavior of drivers.
3. The Road Layout
The road layout was selected keeping in mind the differentfactors that, accordingly to different authors, can influencedriver behavior (number of lanes, road axis tortuousness,radius of circular curves, design parameters of clothoids,succession of straight stretches and curves, succession ofcurves’ radii, road longitudinal and transverse gradient,composition and dimension of the road section, pavementtexture and colour, presence of road barriers and streetfurniture, visibility, road signing and marking, lighting, etc.)[10, 16]. The site was chosen in order to guarantee andinclude the highest number of critical factors.
The studied stretch of road is composed of two longstraight sections to the east and west (Figure 4, Table 2),between which an S-shaped planimetric variant was recentlyintroduced, with geometric-functional characteristics assim-ilable to those of type E “urban district” roads according tothe Italian regulations in force.
The carriageway is composed of 2 lanes, and each one is2.75 m wide on the straight stretch and 3.50 m on the S-shaped curve. The curvature radii of the design variant
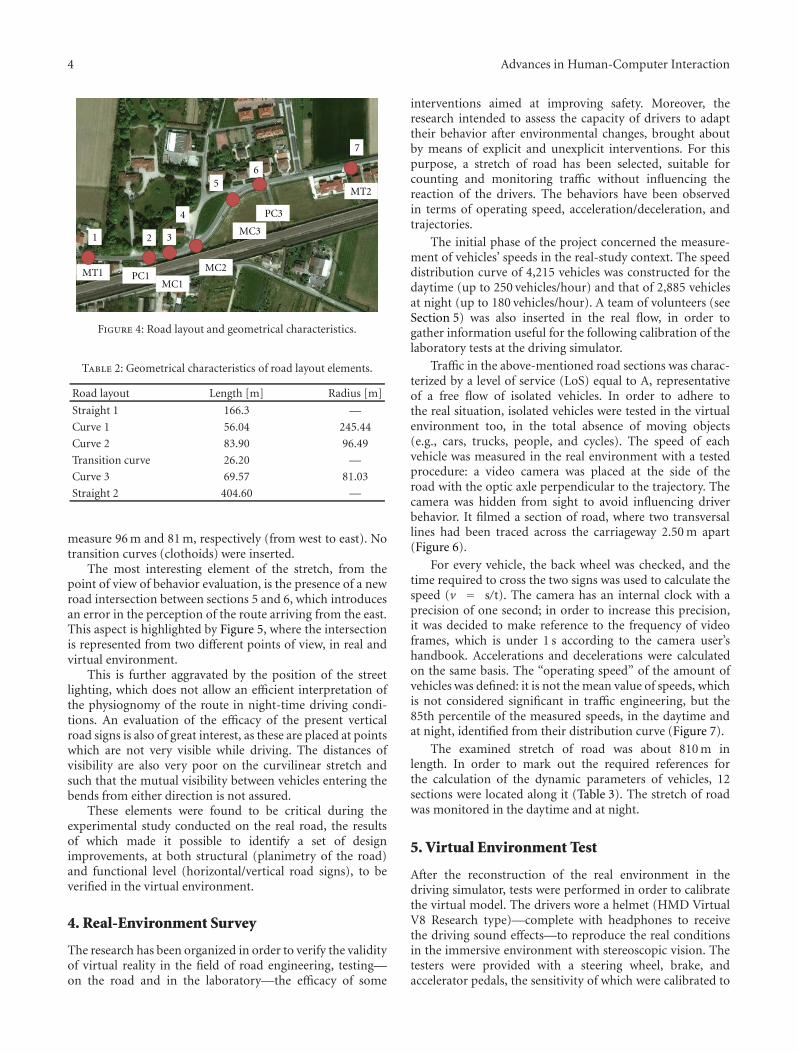
4 Advances in Human-Computer Interaction
1 2 3
4
56
7
MT1 PC1MC1
MC2
MC3
PC3
MT2
Figure 4: Road layout and geometrical characteristics.
Table 2: Geometrical characteristics of road layout elements.
Road layout Length [m] Radius [m]
Straight 1 166.3 —
Curve 1 56.04 245.44
Curve 2 83.90 96.49
Transition curve 26.20 —
Curve 3 69.57 81.03
Straight 2 404.60 —
measure 96 m and 81 m, respectively (from west to east). Notransition curves (clothoids) were inserted.
The most interesting element of the stretch, from thepoint of view of behavior evaluation, is the presence of a newroad intersection between sections 5 and 6, which introducesan error in the perception of the route arriving from the east.This aspect is highlighted by Figure 5, where the intersectionis represented from two different points of view, in real andvirtual environment.
This is further aggravated by the position of the streetlighting, which does not allow an efficient interpretation ofthe physiognomy of the route in night-time driving condi-tions. An evaluation of the efficacy of the present verticalroad signs is also of great interest, as these are placed at pointswhich are not very visible while driving. The distances ofvisibility are also very poor on the curvilinear stretch andsuch that the mutual visibility between vehicles entering thebends from either direction is not assured.
These elements were found to be critical during theexperimental study conducted on the real road, the resultsof which made it possible to identify a set of designimprovements, at both structural (planimetry of the road)and functional level (horizontal/vertical road signs), to beverified in the virtual environment.
4. Real-Environment Survey
The research has been organized in order to verify the validityof virtual reality in the field of road engineering, testing—on the road and in the laboratory—the efficacy of some
interventions aimed at improving safety. Moreover, theresearch intended to assess the capacity of drivers to adapttheir behavior after environmental changes, brought aboutby means of explicit and unexplicit interventions. For thispurpose, a stretch of road has been selected, suitable forcounting and monitoring traffic without influencing thereaction of the drivers. The behaviors have been observedin terms of operating speed, acceleration/deceleration, andtrajectories.
The initial phase of the project concerned the measure-ment of vehicles’ speeds in the real-study context. The speeddistribution curve of 4,215 vehicles was constructed for thedaytime (up to 250 vehicles/hour) and that of 2,885 vehiclesat night (up to 180 vehicles/hour). A team of volunteers (seeSection 5) was also inserted in the real flow, in order togather information useful for the following calibration of thelaboratory tests at the driving simulator.
Traffic in the above-mentioned road sections was charac-terized by a level of service (LoS) equal to A, representativeof a free flow of isolated vehicles. In order to adhere tothe real situation, isolated vehicles were tested in the virtualenvironment too, in the total absence of moving objects(e.g., cars, trucks, people, and cycles). The speed of eachvehicle was measured in the real environment with a testedprocedure: a video camera was placed at the side of theroad with the optic axle perpendicular to the trajectory. Thecamera was hidden from sight to avoid influencing driverbehavior. It filmed a section of road, where two transversallines had been traced across the carriageway 2.50 m apart(Figure 6).
For every vehicle, the back wheel was checked, and thetime required to cross the two signs was used to calculate thespeed (v = s/t). The camera has an internal clock with aprecision of one second; in order to increase this precision,it was decided to make reference to the frequency of videoframes, which is under 1 s according to the camera user’shandbook. Accelerations and decelerations were calculatedon the same basis. The “operating speed” of the amount ofvehicles was defined: it is not the mean value of speeds, whichis not considered significant in traffic engineering, but the85th percentile of the measured speeds, in the daytime andat night, identified from their distribution curve (Figure 7).
The examined stretch of road was about 810 m inlength. In order to mark out the required references forthe calculation of the dynamic parameters of vehicles, 12sections were located along it (Table 3). The stretch of roadwas monitored in the daytime and at night.
5. Virtual Environment Test
After the reconstruction of the real environment in thedriving simulator, tests were performed in order to calibratethe virtual model. The drivers wore a helmet (HMD VirtualV8 Research type)—complete with headphones to receivethe driving sound effects—to reproduce the real conditionsin the immersive environment with stereoscopic vision. Thetesters were provided with a steering wheel, brake, andaccelerator pedals, the sensitivity of which were calibrated to
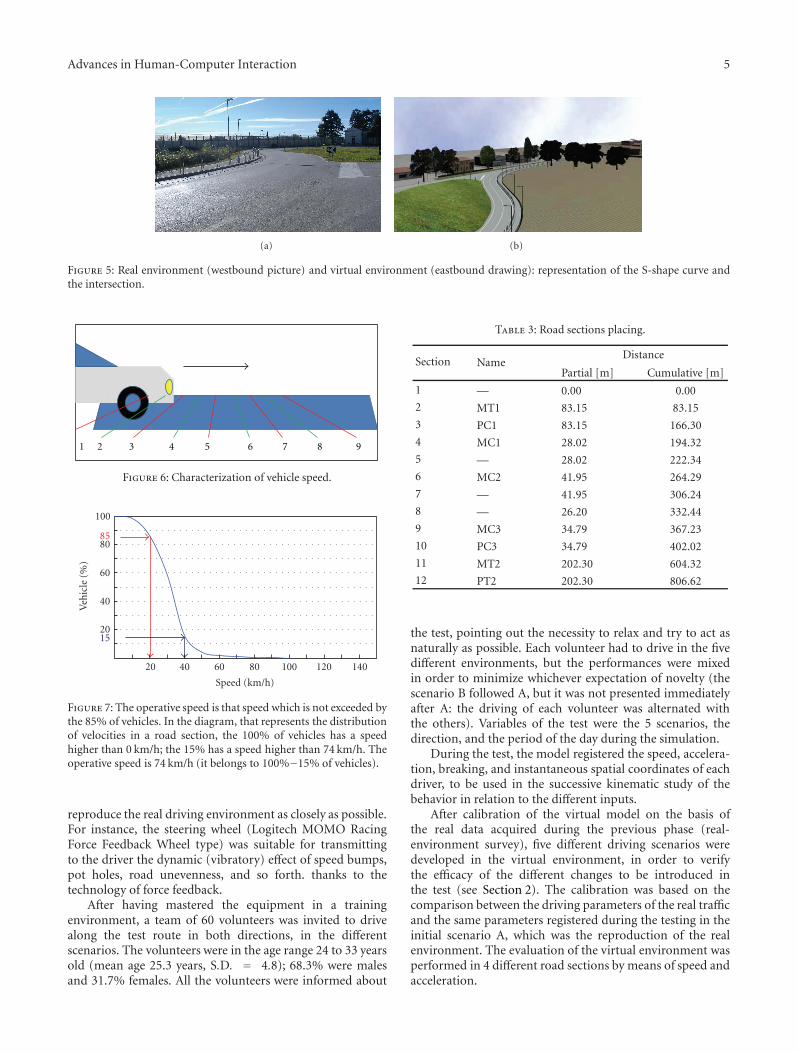
Advances in Human-Computer Interaction 5
(a) (b)
Figure 5: Real environment (westbound picture) and virtual environment (eastbound drawing): representation of the S-shape curve andthe intersection.
1 2 3 4 5 6 7 8 9
Figure 6: Characterization of vehicle speed.
14012010080604020
Speed (km/h)
20
40
60
80
100
15
85
Veh
icle
(%)
Figure 7: The operative speed is that speed which is not exceeded bythe 85% of vehicles. In the diagram, that represents the distributionof velocities in a road section, the 100% of vehicles has a speedhigher than 0 km/h; the 15% has a speed higher than 74 km/h. Theoperative speed is 74 km/h (it belongs to 100%−15% of vehicles).
reproduce the real driving environment as closely as possible.For instance, the steering wheel (Logitech MOMO RacingForce Feedback Wheel type) was suitable for transmittingto the driver the dynamic (vibratory) effect of speed bumps,pot holes, road unevenness, and so forth. thanks to thetechnology of force feedback.
After having mastered the equipment in a trainingenvironment, a team of 60 volunteers was invited to drivealong the test route in both directions, in the differentscenarios. The volunteers were in the age range 24 to 33 yearsold (mean age 25.3 years, S.D. = 4.8); 68.3% were malesand 31.7% females. All the volunteers were informed about
Table 3: Road sections placing.
Section NameDistance
Partial [m] Cumulative [m]
1 — 0.00 0.00
2 MT1 83.15 83.15
3 PC1 83.15 166.30
4 MC1 28.02 194.32
5 — 28.02 222.34
6 MC2 41.95 264.29
7 — 41.95 306.24
8 — 26.20 332.44
9 MC3 34.79 367.23
10 PC3 34.79 402.02
11 MT2 202.30 604.32
12 PT2 202.30 806.62
the test, pointing out the necessity to relax and try to act asnaturally as possible. Each volunteer had to drive in the fivedifferent environments, but the performances were mixedin order to minimize whichever expectation of novelty (thescenario B followed A, but it was not presented immediatelyafter A: the driving of each volunteer was alternated withthe others). Variables of the test were the 5 scenarios, thedirection, and the period of the day during the simulation.
During the test, the model registered the speed, accelera-tion, breaking, and instantaneous spatial coordinates of eachdriver, to be used in the successive kinematic study of thebehavior in relation to the different inputs.
After calibration of the virtual model on the basis ofthe real data acquired during the previous phase (real-environment survey), five different driving scenarios weredeveloped in the virtual environment, in order to verifythe efficacy of the different changes to be introduced inthe test (see Section 2). The calibration was based on thecomparison between the driving parameters of the real trafficand the same parameters registered during the testing in theinitial scenario A, which was the reproduction of the realenvironment. The evaluation of the virtual environment wasperformed in 4 different road sections by means of speed andacceleration.
6 Advances in Human-Computer Interaction
Table 4: Operating speed (S85, km/h) measured in daytime andat night, in the real and virtual environments, eastwards (a) andwestwards (b).
(a)
Description
Operating Speed [km/h]
Real Virtual
Day Night Day Night
MT1 76.50 78.30 73.65 75.00
PC1 73.50 77.50 72.50 72.35
MC1 61.88 58.70 62.35 53.00
MC2 60.06 44.53 62.95 47.35
MC3 56.25 47.26 59.25 48.00
PC3 58.50 49.30 59.60 52.35
MT2 60.13 49.60 60.45 54.00
PT2 75.00 77.50 75.30 74.00
(b)
Description
Operating Speed [km/h]
Real Virtual reality
Day Night Day Night
MT1 69.79 70.30 66.90 68.35
PC1 60.00 62.40 61.30 57.70
MC1 59.70 52.70 59.85 51.35
MC2 58.50 51.50 58.25 51.00
MC3 59.20 53.20 58.55 50.35
PC3 60.20 55.20 61.50 56.35
MT2 70.31 69.40 69.15 72.30
PT2 72.00 71.30 72.55 75.40
6. Results
A statistical analysis has been performed in order to identifythe factors which can influence drivers’ behavior. The evalu-ation has been limited to the reference sections but extendedto the different scenarios and driving conditions. For eachsituation, the statistical profile has been defined (mean, stan-dard deviation, quartiles, and percentiles), but the attentionwas put on the parameter commonly used in literature, thatis, the 85th percentile. In any case, for the analyzed cases,Student’s t-test (alpha 0.05, bilateral) has been carried out inorder to discriminate the secondary factors from those reallyconditioning drivers’ behaviors.
The first scenario (A) reproduces the real environment. Itwas also used for the calibration of the virtual model. Figures8 and 9 compare speeds in both directions of travel, duringthe daytime and at night, in the real and virtual environment.As previously mentioned, the test results are reported interms of the value of the operating speed. The results are alsosummarized in Table 4.
The first objective of the research was the constructionof a virtual model as similar as possible to the real one.The reference parameter was the “speed profile”, given by theoperating speed (i.e., the 85th percentile of speed, S85). Theoperating speed registered during virtual tests was not only
usually higher than the legal speed limit (50 km/h, except for2 sections, MC2 and MC3, in the westbound direction) butalso higher than the real speed. During the day, eastboundspeeds of between 58.25 and 72.55 km/h were recorded; inthe opposite direction, speeds were within the range 59.25 to77.30 km/h. During the night, the eastbound speed increasedto between 50.35 and 75.40 km/h, while the westbound speedvaried between 47.35 and 75.00 km/h.
As concerns the speeds measured on site, during the realobservations, 15% of the eastbound vehicles exceeded thespeed limits both in the daytime (58.50 km/h to 72.00 km/h)and at night (51.50 km/h to 71.30 km/h). In the oppositedirection (westbound), the operating speed in the daytimewas still above 50 km/h (56.25 km/h to 76.50 km/h), while atnight, near the S-shaped alignment, a noticeable reductionwas observed (44.53 km/h to 49.60 km/h), with a few excep-tions.
In terms of acceleration, it was noted at the simulatorthat in the daytime, the maximum eastbound decelerationwas −0.21 m/s2 (PC1 section); maximum acceleration was0.59 m/s2 (MT2 section). At night, the maximum values ofdeceleration and acceleration were−0.40 m/s2 and 1.24 m/s2,respectively. In the opposite direction (westbound), in thedaytime, the results were very similar in the real andvirtual environments: maximum deceleration (in the PC3section) was −0.93 m/s2, while maximum acceleration (MT1section) was 0.59 m/s2. At night, the maximum values ofdeceleration/acceleration were observed in the sections PC3(−1.55 m/s2) and MT1 (0.79 m/s2).
In the real environment, in the daytime, the maximumeastbound deceleration observed was −0.37 m/s2 (secondsection and between sections MT1 and PC1); maximumacceleration was 0.78 m/s2 (near PC3-MT2). During thenight, the maximum values of deceleration and accelerationoccurred on the same sections listed above and were−0.30 m/s2 and 1.10 m/s2, respectively. In the opposite direc-tion, maximum deceleration (section PC3) in the daytimewas −0.93 m/s2, while maximum acceleration was 0.59 m/s2
(final section MT1). At night, the maximum values ofacceleration were −2.66 m/s2 (PC3 section) and 1.10 m/s2
(MT1).In the second phase of the research, some variations were
made to the road environment. An exact comparison waspossible between virtual and real environment when changescould be made on the road (e.g., with vertical signs);in other situations that could not be reproduced (newhorizontal alignment), the driving simulator was used topredict the effect of possible changes. In either case, theoperating speeds, accelerations, and decelerations were usedas reference parameter (Figure 10).
The test performed eastbound in the daytime showshomogeneous behavior in all the scenarios, the operatingspeed varying within a range of 5% of the mean value. Theonly difference worth mentioning is related to scenario E, theonly one with geometric variations. In this case, behaviorsare marked by a more stable and less jerky approach tothe curvilinear element, despite the higher mean speedand lower acceleration/deceleration than in the other testenvironments. In daytime conditions, changes to vertical

Advances in Human-Computer Interaction 7
70.3
62.4
52.7 51.5 53.2 55.2
69.4 71.3
69.79
60 59.7 58.5 59.2 60.2
70.31 72
MT1 PC1 MC1 MC2 MC3 PC3 MT2 PT2
Section
0
10
20
30
40
50
60
70
80
90O
pera
tin
gsp
eed
(km
/h)
NightDay
(a)
78.3 77.5
58.7
44.53 47.2649.6
77.5
76.573.5 61.88
60.0656.25
58.5 60.1375
49.3
PT2 MT2 PC3 MC3 MC2 MC1 PC1 MT1
Section
0
10
20
30
40
50
60
70
80
90
Ope
rati
ng
spee
d(k
m/h
)
NightDay
(b)
Figure 8: Night/day operating speed (S85, km/h), eastwards (a) and westwards (b), in real environment.
68.35
57.7
51.35 51 50.3556.35
72.3 75.466.9
61.3 59.85 58.25 58.5561.5
69.1572.55
MT1 PC1 MC1 MC2 MC3 PC3 MT2 PT2
Section
0
10
20
30
40
50
60
70
80
90
Ope
rati
ng
spee
d(k
m/h
)
NightDay
(a)
7572.35
53
47.35 4852.35 54
74
73.65 72.5
62.35 62.9559.25 59.6 60.45
75.3
PT2 MT2 PC3 MC3 MC2 MC1 PC1 MT1
Section
0
10
20
30
40
50
60
70
80
90
Ope
rati
ng
spee
d(k
m/h
)
NightDay
(b)
Figure 9: Night/day operating speed (S85, km/h), eastwards (a) and westwards (b), in virtual environment.
87654321
Section
1020304050607080
Ope
rati
vesp
eed
(km
/h)
ABC
DE
Figure 10: Speed profile in 5 different driving environments in theeastbound direction. Scenarios A (present layout), B (A + verticalsigns), C (A + horizontal marking), D (A + signs + marking), andE (layout modified).
road signs and horizontal road markings also appear to haveno substantial effect.
In the opposite direction (westbound), a marked dissimi-larity in the approach to the S-shaped curve can be observed:the introduction of vertical warning signs and the placing ofoptical markers translates into a greater adjustment of thespeed selected approaching the curve, followed by a morestable driving behavior along the entire length of the S-bend.
The geometric modification of the layout (scenario E)provides an improvement in terms of legibility of the road,as demonstrated by the graph in Figure 11, which reportsthe partial accelerations/decelerations between successivecontrol sections, referred to the 85th percentile of thedistribution of recorded accelerations. Even if higher speedsare usually noticed because of more homogeneous propertiesof the geometric elements which form the road layout,lower variations in the dynamic parameters (acceleration,deceleration) are registered.
8 Advances in Human-Computer Interaction
1-22-33-44-55-66-77-8
Segment of road alignment
−1.4−1.2−1
−0.8−0.6−0.4−0.2
00.20.40.60.8
11.21.4
Acc
eler
atio
n(A
c,85
)(m
/s2)
Real accelerationScenario BScenario D
Scenario AScenario CScenario E
Figure 11: Profile of the accelerations in the different drivingenvironments, westbound direction.
For a better comparison among the scenarios, a statisticalanalysis was carried out by means of matrices of probability ofmutual influence. Table 5 reports, as an example, the matrixrelated to MT1 section, where each value represents theprobability that the difference in speed values could not bedue to the variation of factors but to the statistic case. Inthe matrices, the number of variables to be considered canbe elevated, but in such a case, a high number of samples isnecessary.
For instance, in the daytime, from MT1 to PT2 section(eastwards), with and without vertical signs, a probability of42% (P = .42) that a difference between speeds could bereferred either to other concomitant causes or to casualnessis expected. At night, there is a high probability that adifference in speeds could be due to several factors differentfrom the lack of signs. In the opposite direction (westwards),the probability of a dependence between the difference onmeasured speeds and the variation of considered factorsdiminishes (P > .05).
The analysis of the matrix of influences gives the con-clusion that in the virtual environment the conditioningeffect related to the different visibility conditions (day, night)prevails on the presence of vertical signing.
Table 6 shows some extreme situations, where a proba-bility of connection among the different factors was close to100%, demonstrating that a difference of measured speeds isnot depending on the variation of the considered factors. Ithappens westwards, in the MC2 section, inside the S-shapecurve. In the daytime, there is no dependence between speedvariations and signing presence (P = .925), as well as in thecase of contemporary variation of signing and visibility in thedaytime and at night (P = .818).
Finally, as regards the role of the type of vertical signing,it can be mentioned that in the real environment as wellas in the virtual one, static signs are not always perceived,because they are confused with the background and often
considered as simple “furnishings”; they do not produceany effective coercion, as stated by the profiles of speedand acceleration. Dynamic (intermittent) lighting combinedwith the vertical signs is more efficacious and determinesmore uniform driving behavior, attracting the attention ofthe road users to the geometrical characteristics of the roadlayout. The best result is guaranteed by the dynamic message,which recalls the speed limit together the real speed andthe subsequent penalization to the driving licence because ofillegal behaviors.
7. Discussion and Conclusions
The study of drivers behavior in a virtual environment forroad design purposes is a research field which is sometimesnot accepted due to factors of visual technology and environ-mental reconstruction. However, it can be demonstrated thatthe driving simulator is not only a laboratory tool useful forreproducing the trajectory of vehicles in a road environmentin a dynamic way, but also an instrument that can forecastdrivers’ behavior in different situations. During several testsin different scenarios, a statistical comparability has beenverified between speeds measured in both the virtual and realenvironment.
Along a road stretch, where the traffic was monitored inboth directions by means of operating speed and dynamicparameters, it was observed that the succession of geometricelements in the road layout determines various behaviors anddrivers’ different choices both in the daytime and at night.The most important aspect is the quite good correspondencebetween real and laboratory behavior, vehicle speed, acceler-ation, and deceleration being very similar in both cases. Thesimulator proves to be useful in the representation of realbehavior, but also it can become a design instrument becauseit can forecast the effects of road modifications beforethey are carried out (this aspect was accurately checkedin real and virtual environment). With the reproductionof real environments in the laboratory, all design choicescan be simulated, corrected, modified, and refined in a fastcyclic process that does not require expensive works andadjustments; thus, a preliminary study can avoid in situexperimentation.
The simulator allows detailed information to be acquiredon the behavior of road users (accelerations, breaking,instantaneous speed, and trajectories) that cannot always bemeasured in reality, so it becomes a valid instrument for theevaluation of interventions aimed at improving road safety,such as modifications to road signs, geometry, or the drivingenvironment in a more general sense.
A limitation to applications in the road sector regardsthe oversimplification of the dynamic characteristics of thevehicle model, in terms of inertia and destabilizing forceswhile driving (especially on a curve), which unavoidablyalter the information on driving behavior with respect to thecorresponding real environment. On the other hand, a goodresult is that the simplification of the environment near theroad does not appear to be relevant to driver behavior so thatmore precise representations are not necessary.
Advances in Human-Computer Interaction 9
Table 5: MT1 section. Matrix of probability of mutual influence among environmental factors.
Day, eastw.yes sign
Night, eastw.yes sign
Day, eastw.no sign
Night, eastw.no sign
Day, westw.yes sign
Night, westw.yes sign
Day, westw.no sign
Night, westw.no sign
Day, eastw. yes sign 0.001 0.420 0.007 0.007 0.000 0.005 0.000
Night, eastw. yes sign 0.001 0.699 0.716 0.253 0.264 0.490
Day, eastw. no sign 0.007 0.002 0.001 0.003 0.001
Night, eastw. no sign 0.549 0.442 0.336 0.765
Day, westw. yes sign 0.171 0.436 0.341
Night, westw. yes sign 0.066 0.225
Day, westw. no sign 0.036
Night, westw. no sign
Table 6: MC2 section. Matrix of probability of mutual influence among environmental factors.
Day, eastw.yes sign
Night, eastw.yes sign
Day, eastw.no sign
Night, eastw.no sign
Day, westw.yes sign
Night, westw.yes sign
Day, westw.no sign
Night, westw.no sign
Day, eastw. yes sign 0.062 0.130 0.033 0.854 0.031 0.811 0.053
Night, eastw. yes sign 0.002 0.170 0.001 0.565 0.095 0.499
Day, eastw. no sign 0.002 0.015 0.004 0.013 0.000
Night, eastw. no sign 0.001 0.736 0.046 1.000
Day, westw. yes sign 0.002 0.925 0.002
Night, westw. yes sign 0.818 0.093
Day, westw. no sign 0.042
Night, westw. no sign
Some minor differences have been noticed in the speedand acceleration/deceleration profiles between real and vir-tual environment, mainly due to a relaxation in the latterbecause of the implicit certainty of safety in the test (no“surprises” were expected). Moreover, the volunteers, beingaware of participating in a trial, paid more attention tothe road environment. For this reason, the model is beingdeveloped and completed by the insertion of external agentsthat could provide variety to enliven the virtual trip.
In regard to the trajectories at the simulator, they ap-peared to be closely related to each scenario. Little dif-ference was possible for “badly designed” roads (scenarioA), and minimum differences were recorded in the scenariosimproved by road signs and markings. This demonstratesthat the virtual model is not only reliable for reproducingthe road layout, but also that it can be used in theexperimentation of new solutions to improve the safety ofvehicles.
The test conducted on the legibility of the road envi-ronment by means of the insertion of signs and markings(on the road and at the simulator) has demonstrated theirrole on safety but also that their persuasiveness is highlyvariable. Particularly, a statistical analysis and the definitionof matrices of probability of mutual influence has givenevidence to the fact that usually, vertical signing do notinfluence in significant manner the speed along the mostcritical sections (inside the S-shape curve), unless the signspoint out the risk of being fined by the police, as a con-sequence of breaking the law.
In practice, the study puts in evidence when and how theroad environment can really be changed in order to becomemore persuasive for the road users. The virtual environmenthas the potential to ascertain to what degree this can be done.
References
[1] G. Kaintheidis, A. Zervas, and V. Karagioules, “Drivers riskperception of road design elements,” Transportation HumanFactors, vol. 2, no. 1, pp. 39–48, 2000.
[2] F. P. McKenna, “Drivers’ perception of risk,” Accident Analysisand Prevention, vol. 23, pp. 45–62, 1991.
[3] H. Shinoda, M. M. Hayhoe, and A. Shrivastava, “Whatcontrols attention in natural environments?” Vision Research,vol. 41, no. 25-26, pp. 3535–3545, 2001.
[4] M. Mohan, Seeing, Doing, and Knowing: A PhilosophicalTheory of Sense Perception, Clarendon Press, Oxford, UK,2005.
[5] S. Nikiel, “Realism vs. reality: creating virtual reconstructionsof architectural artifacts,” in Proceedings of the 10th AnnualInternational Workshop on Presence, pp. 359–388, Barcelona,Spain, 2007, (Poster Session 2).
[6] K. Patel, J. Bailenson, S. H. Jung, R. Diankov, and R. Bajcsy,“The effects of fully immersed virtual reality on the learning ofphysical tasks,” in Proceedings of the 8th Annual InternationalWorkshop on Presence, pp. 129–138, Cleveland, Ohio, USA,2006.
[7] Y. A. W. Slangen-de Kort, W. A. Ijsselsteijn, J. Kooijman, andY. Schuurmans, “Virtual environments as research tools forenvironmental psychology: a study of the comparability of real

10 Advances in Human-Computer Interaction
and virtual environments,” in Proceedings of the 4th AnnualInternational Workshop on Presence, Philadelphia, Pa, USA,2001.
[8] C. Castro, Human Factors of Visual and Cognitive Performancein Driving, CRC Press, Taylor & Francis, Boca Raton, Fla, USA,2009.
[9] J. O. Brooks, R. A. Tyrrell, and T. A. Frank, “The effects ofsevere visual challenges on steering performance in visuallyhealthy young drivers,” Optometry and Vision Science, vol. 82,no. 8, pp. 689–697, 2005.
[10] M. Pasetto, L. Gamberini, and A. Manganaro, “Potentialof immersive virtual reality models in studies of drivers’behaviour and interventions to improve road safety,” inPresence Conference Workshop, Padova, Italy, October, 2008.
[11] B. J. Fogg, Persuasive Technology: Using Computers to ChangeWhat We Think and Do, Morgan Kaufmann, 2002.
[12] B. J. Fogg, “Captology: the study of computers as persuasivetechnologies,” in Proceedings CHI ’97, Human Factors inComputing Systems: Looking to the Future, ACM, New York,NY, USA, 1997.
[13] European Commission, Directorate General Transport, COST331 Requirements for Horizontal Road Markings, Office forOfficial Publications of the European Communities, Luxem-bourg, UK, 1999.
[14] S. G. Charlton, “Perceptual and attentional effects on drivers’speed selection at curves,” Accident Analysis and Prevention,vol. 36, no. 5, pp. 877–884, 2004.
[15] S. G. Charlton, “The role of attention in horizontal curves:a comparison of advance warning, delineation, and roadmarking treatments,” Accident Analysis and Prevention, vol. 39,no. 5, pp. 873–885, 2007.
[16] E. D. Dickmanns, Dynamic Vision for Perception and Controlof Motion, Springer, London, UK, 2007.

Hindawi Publishing CorporationAdvances in Human-Computer InteractionVolume 2011, Article ID 724204, 10 pagesdoi:10.1155/2011/724204
Research Article
The Sensorium: A Multimodal Neurofeedback Environment
Thilo Hinterberger
Department of Environmental Health Sciences, University Clinic Freiburg, Breisacher Strass 115 b, 79106 Freiburg, Germany
Correspondence should be addressed to Thilo Hinterberger, [email protected]
Received 29 June 2010; Accepted 30 September 2010
Academic Editor: Guido Kempter
Copyright © 2011 Thilo Hinterberger. This is an open access article distributed under the Creative Commons Attribution License,which permits unrestricted use, distribution, and reproduction in any medium, provided the original work is properly cited.
The Sensorium is a neurofeedback environment that allows people to experience signals from their nonperceptible body processesvisually and auditorily. Various (neuro-)physiological rhythms and frequencies are projected simultaneously as soundscapes and“lightscapes” into the environment. A wireless physiological amplifier device sends signals such as EEG and ECG to a computerfor real-time processing using the modified brain-computer interface software “Thought Translation Device” (TTD). The TTDperforms signal filtering, parametric orchestral sonification, and light control. In a pilot study, 20 participants have been exposedto their ongoing brain and heart signals while sitting inside the Sensorium, a small room equipped with a speaker and lightingsystem. Almost all of them reported an increase in contentment, relaxation, happiness, and inner harmony. They also reported awidening in their body consciousness. In future, therapeutic paradigms will be developed and the treatment effects on people withpsychosomatic diseases will be evaluated.
1. Introduction
Neurofeedback (NFB) is a method for training of self-regulation of physiological, especially neurophysiologicalbody signals. It became popular in the 1970s already whenthe first devices for relaxation training were offered. Theself-regulation training was mediated by visual or acousticalreal-time display of, for example, the muscular tensionmeasured in the electromyogram (EMG) or the amplitudeof the alpha rhythm activity of the electroencephalogram(EEG). The measurement implies electrode sensors to beattached to the brain or other body parts picking upthe signals ranged from μV up to mV with frequenciesbetween 0 and about 100 Hz. The EEG feedback era firststarted to become popular after Kamiya published his studieson operant conditioning of the EEG alpha rhythm. Hefound the alpha amplitude to be connected to the stateof relaxation [1]. Since then, many biofeedback devicesappeared on the market and often, these devices havebeen applied in nonscientific settings. Unfortunately, thehypothesis of a clear connection between EEG alpha powerand relaxation could not maintain its position after furtherscientific explorations. The scientific investigations of brainphysiological self regulation conducted by Sterman et al. in
1974 described the application of EEG NFB for the therapyof patients with epilepsy [2]. Birbaumer and his groupdemonstrated the human ability for self regulation of theslow cortical potentials (SCPs); that is, EEG potential shiftsbelow 1 Hz [3, 4]. They also successfully applied the SCPfeedback training to patients with intractable epilepsy forreduction of their seizure frequency [5, 6].
A major application of NFB currently is the treatmentof attention deficit and hyperactivity disorders (ADHD)in children [7]. Kaiser and Othmer [8] did an extensivestudy including 1,089 patients with moderate pretrainingdeficits. In a NFB training of sensorimotor and beta wavesa significant improvement in attentiveness and impulsecontrol was found and positive changes as measured on thetest of variables of attention (TOVA) could be demonstrated.Also Monastra [9] who compared the effect of treatmentwith Ritalin and NFB in a sample of 100 children foundsimilar improvements on the TOVA and ADD evaluationscale in both groups. Leins, Strehl et al. reported behavioraland cognitive improvements in children with ADHD afterNFB-treatment. They compared the feedback training ofbeta/theta power with feedback of slow cortical potentials(SCPs) in two groups of 19 children (aged 8–13 years) each.Both groups learned to regulate their EEG parameters and
2 Advances in Human-Computer Interaction
showed significant behavioural, attentional, and cognitiveimprovements which remained stable in a follow-up mea-surement six months after treatment [10, 11].
Other studies using NFB of Theta band activity success-fully showed increases in intelligence scores and academicperformance [12]. Egner and Gruzelier found an improve-ment in musical performance by alpha/theta NFB trainingin which the participants should try to raise the theta powerover alpha [13]. Further applications of NFB can be foundin the treatment of learning disabilities, conduct disorder,cognitive impairment, migraines, chronic pain, sleep dys-regulation, autism-spectrum-disorders, posttraumatic stressdisorder and mild traumatic brain injury, and so forth.
NFB also was used in Brain-Computer Interfaces (BCIs)for the training of direct brain-computer communicationand peripheral control via self-regulation of brain signals. Incontrast to a normal NFB device, a BCI is able to classifya brain response to classes with intentional meaning. Thisis often accomplished with certain kinds of discriminantanalysis. For example, users learned to regulate their slowpotentials so the computer could distinguish between apositivity or negativity response [14, 15]. Others learnedto regulate their mu-rhythm activity by imagination of ahand movement which could be detected by a classificationalgorithm [16]. Further, a BCI is able to convert theintentional brain responses into action, for example, letterselection for verbal communication, controlling switches orprostheses. The Thought Translation Device (TTD) usedfor realizing the here described Sensorium is both, anNFB device for feedback training of slow cortical potentialsbut also oscillatory components and a BCI that allowedcompletely paralyzed patients to communicate verbally usingthe self regulation skills of their brain signals [17].
The advances in the field of BCI research demonstratethat it truly is possible to self-regulate certain brain parame-ters voluntarily with a high reliability. However, this researchalso demonstrates that not every signal component is suitablefor self regulation and for some components such as theslow waves it is highly individual whether a person can learnvoluntary regulation. The amount of alpha and sensorimotorrhythms also has been shown to be highly individual. Andwhile for the NFB treatment mostly the theta, alpha or betawaves of unspecific areas were trained, for BCI control thesecomponents were not of interest at all. Here, it is consensusthat motor-related rhythms such as the mu-rhythm overmotor areas are the best controllable components while thealpha rhythm can hardly be used as it is closely connectedto visual processing, and theta rhythms are connected todrowsiness or very special states of consciousness such ashypnagogic states or some specific styles of meditation.
Looking at the outcome of various NFB studies onecan realize that there is often a rather poor learning effectin the neurophysiological self regulation training howeverthe treatment effect often shows quite impressive resultswith effect sizes around 0.4–0.6 [18, 19]. This might bethe reason why some researchers even do not report theneurobehavioral data but only the psychological behaviouraltreatment outcome. Beside the research considering NFBas an effective therapy for various different diseases, other
researchers like Loo and Barkley doubt that changing theEEG is the actual mechanism for the decrease of symptoms[20]. Therefore, it could be caused by a placebo effect andrather be an unspecific treatment effect.
This would suggest that the effectiveness could be farmore assigned to the feedback itself and the setting as suchthan to the self regulation skill of the patient. As a conse-quence, NFB as such or as an intervention method can beregarded to be suitable for positively changing psychologicalvariables; however, the true mechanisms still remain unclear.This asks for a plausible explanation. Here is one attemptor hypothesis. The specificity of NFB therapy in contrastto other forms of medical or behavioural treatments is thatNFB very closely connects the patients’ consciousness withtheir physiology. This might improve their body awarenessas well as the connection between self and body. As aconsequence, the patient may become more aware of therelation between body and consciousness and thus createa stronger link between both which facilitates behaviouralchanges as necessary for improving ADHD symptoms forexample.
This consideration may serve as a basic mechanism forthe success of the Sensorium as a form of a NFB interventionthat optimizes the feedback experience as such without therequirement of performing self-regulation training. The Sen-sorium can be regarded as a whole NFB environment placingan emphasis on an enhanced sensation and extraordinaryself-experience of the patient during a session.
2. Technical Development
2.1. A Historic Overview. The Sensorium as a multimodalneurobiofeedback environment resulted from the devel-opment of a multimodal brain-computer interface, theTTD [21]. The TTD initially was designed for trainingpeople to self-regulate their slow cortical potentials andthereby achieve the capability to select letters through brainresponses. Using this technology, the TTD was the firstbrain-computer interface that enabled completely paralyzedpatients suffering from the neurodegenerative disease amy-otrophic lateral sclerosis (ALS) to communicate with theirbrain signals only [17]. In the final stage of ALS, patients canlose all means of communication while remaining conscious.This state is called “locked-in syndrome”. Most patients wetrained had slight muscular reactions left such as small eyemovements. However, we also encountered patients withoutany sign of ocular movement abilities. These patients werehardly able to stare at a computer screen and focus itscontent which would have been necessary for a successfulEEG feedback training as all instructions and responseinformation were given visually. Unfortunately, especiallythis group of patients could have profited most from the useof a BCI. Therefore, we developed an auditory driven brain-computer communication device that provided all feedbackinformation to the patient auditorily. The computers voiceasked a question or told the options for selection. The pitchof a tone sequence then directly informed about the currentbrain response. After this sound-mediated selection interval
Advances in Human-Computer Interaction 3
the computers voice informed about the selection response,that is, a “yes” or “no” or the selected letters [21].
2.2. Parametric Orchestral Sonification. Similarly to otherNFB devices, this auditory BCI presented one defined brainparameter such as the slow waves, the mu rhythm amplitude,or a classifier result signal as a sound sequence to the user.However, the human ear is capable of listening to anddistinguish a high number of voices, tones, or instrumentssimultaneously and also find connections, correlations, andhigher complex order in acoustic sounds as we all know,for example, from listening to music or identifying singlepersons voices within a group of talking people. Similarly,the EEG consists of a mixture of various signal components,frequencies, and, depending on the number of electrodes,signal channels. Therefore, it can be hypothesized that anauditory representation of the complex EEG time seriescould lead to an interesting perception and possibly provideinformative insights. For such investigations a module wasdeveloped that could present various EEG features andrhythms simultaneously through different (computer) musi-cal instruments. The module and its algorithm were termedParametric Orchestral Sonification of EEG in Real-time(POSER [22, 23]). There is an essential difference betweenthe method of sonification typically used in NFB devices andthe POSER approach. Usually, a brain rhythm or componentis filtered, mostly Fourier transformed and its amplitude isbeing used as a measure for the pitch of a sound. The user isprompted to follow and try to control the sound sequence.In contrast, the parametric sonification approach used in thePOSER module aims on presenting the nature of the signalas natural as possible. In other words, a theta rhythm consistsof oscillatory patterns with frequencies between 4 and 8 Hz.Such signal changes are below the hearing threshold of 20 Hzand cannot be perceived as sound directly. However, it canbe perceived as vibration and rhythm when modulated withthe spectrum of musical instruments. Therefore, a thetaresponse can be parameterized by transforming each wavecycles amplitude into loudness and the time between twocycles into pitch and playing an instrument at each wave cyclemaximum with those parameters. This sonification approachmaintains the rhythmic and the harmonic information of thetheta rhythm which both would get lost when transformingthe smoothed Fourier amplitudes into sound as typicallydone in auditory NFB.
In recent years, other research groups independentlyaimed on developing improved sonification algorithms andprograms in order to provide more or more specific infor-mation from the brain, too. Baier et al. were working onEEG sonification specifically to sonify epileptic seizure events[24, 25]. The SonEnvir project of de Campo and Wallschis another example [26]. However, they have used differentapproaches.
Applying the POSER sonification method to the variousfrequency band oscillations and playing all of them simul-taneously using a specifically chosen instrument for eachband we achieved an orchestral sonification of the EEG.As the TTD, including the POSER module, was a real-timeprocessing system, users were able to listen to their actual
multiple brain rhythms online like in a brain-symphoniclive concert. Simultaneously recorded ECG signals fromthe heart could be sonified accordingly and mixed to theconcert. This brain music device was used as a link betweenscience and art, first. A portable EEG amplifier device withwireless transmission of the physiological data stream to thecomputer in combination with shielded electrodes allowedfor movement interaction with the sonified body signals.A project called Braindance arose from this possibility inwhich a dancer showed an improvisation dance performanceto music generated live from the own actual brain signals.This closed loop feedback experience in which cause andeffect melt and sometimes become indistinguishable is bothimpressive for the dancer and the audience. The projectincluding a discussion on possible movement artifacts wasreported in [27].
2.3. The SymPOSER Sonification and Illumination Algorithm.For the development of the Sensorium, the POSER soni-fication software module was completely reprogrammed.The new system and algorithm was called SymPOSER. Itincludes a modified sonification algorithm plus a systemfor parameterized light control. Parts of the software wereprogrammed in portable C++ classes so they can be usedeither directly in the TTD or in external hardware devices forsonification and light control which we also have available.Additionally, for the TTD a comfortable setup and soundconfiguration tool was programmed. In the following, ashort description of the functional elements of the softwareis given.
SymPOSER consists of three basic processing classes, afilter class, a Midi control class, that is, the sonificationclass and a light control class. A central parameter containerclass holds all filter, Midi, and light control parameters.The filter class contains two selectable types of signal filters,an FIR (Finite Impulse Response) band pass filter, and anIIR (Infinite Impulse Response) filter that can either beconfigured as band pass, high or low pass filter. Such filterscan be used for separation of the typical EEG frequencybands but also for the isolation or extraction of meaningfulcomponents within an ECG or other physiological signals.The filtered data stream can either be directly used asoutput signal, or be subject to further processing such asthe calculation of the band power, the identification of waveextremes which later can be used for triggering the touch ofa note, and the conversion of the time between two maximainto a frequency output. This provides four different outputsignals of a filter class. For each frequency band or signalcomponent a separate instance of the filter class is createdas shown in Figure 1. The second base class, the Midi class isthe sonification unit which transforms the signals providedby the filter class into Midi commands and sends them to theMidi device. Four different parameters of a Midi note canbe modulated by any of the filter output signals. These arenote, touch velocity, pitch, and amplitude. With pitch andamplitude modulation, a continuously played tone can alterits frequency or loudness resulting in a vibrato or frequencymodulation in accordance to a brain signal. A commonsonification setting uses the wave trigger output to initiate a

4 Advances in Human-Computer Interaction
TTD framework EEG interfacing, preprocessing, storage, visualization
SymPOSER
FIRband pass
BP mode
IIR low/ high/band pass
Band powercalculation
Extrematrigger
Output signals
Extrema tofrequency
Instance 2· · · · · ·
Filter classinstance 1
Filterparameters
Midi classinstance 1
Sonifi-cationpara-
meters
Pitchmodulation
Amplittudemodulation
Velocitymodulation
Notemodulation
Play MIDI (note, velocity, sustain, pitch, volume)
Lightmodulationcalculation
Illuminationparameters
Light classInstance 1
2 · · · · · · 2 · · · · · ·Light input
Figure 1: Block diagram and structure of the SymPOSER module. The SymPOSER framework contains instances of the three classes, a filterclass, a Midi class for sonification, and a light control class. Each instance of the filter class provides the filtered signals for sonification orlight control. Each Midi instance can sonify one EEG component that is played by a specific instrument.
Respiration sensor
Pulse finger clip
Skin conductance
EEG electrodes
EEGamplifier
deviceincl. filtering
and A/Dconversion W
irel
ess
Blu
etoo
th
Data storage
Setup
Visualization
Thought translation device
DMXcontroller
Stereoamplifier
FilteringFFT,othersignal
processingSymPOSER
Sonification and light control
Figure 2: General overview of the multisensory and multimedial feedback system. The TTD software is installed on a PC and is used for dataacquisition and preprocessing of the EEG and peripheral signals such as the Electrocardiogram (ECG), skin conductance, or respiration. It isalso capable of on-line brain state classification. The SymPOSER module transforms the signals into sound and light. For driving an externalfeedback environment the sound should be presented over a stereo speaker system and the light control signal is sent to a DMX control unitfor driving any studio lighting system.

Advances in Human-Computer Interaction 5
sound that is played with the pitch (note modulation) of thefrequency output and the velocity according to the amplitudeof the wave cycle. The note modulation can be tuned to 12tone music, major, minor, or pentatonic harmony. Each Midiinstance is able to play one instrument which can be selectedout of 127 instruments according to the Midi wavetable towhich the system is linked. Similarly to the Midi class, anumber of light control instances transform the signal intolight values sent to a DMX interface that controll a lightsystem. The DMX standard is a serial interface standardused in professional studio and theatre lighting systems.Any output signal from the filter instances can be used tomodulate multicoloured lighting devices.
For setting up the parameters a visual interface wasprogrammed that allows to overview and change the param-eters of all instances. Another program tool was createdthat provides the option for managing preset parametersand a further tool contains a sequencer for running varioussonification settings in a sequence. This was used in theSensorium study to present a fixed sequence of varyingsonifications during a session in a standardized mannerfor each participant. Figure 1 gives an overview of theSymPOSER components as a module of the TTD.
2.4. The Feedback Environment. The complete signal dia-gram is illustrated in Figure 2. Basically, a PC or NotebookPC is required for running the TTD software. The TTDis capable of interfacing about ten different types of EEGand physiological amplifier systems. When connecting theNexus 10 amplifier device or the Brainquiry PET device,one can measure and present EEG and pulse, respirationand skin conductance simultaneously. Those two devices areportable and transmit the signals wireless via Bluetooth tothe computer. The TTD performs the signal processing andconversion into sound and light using the above describedSymPOSER algorithms. Additional sampler software canbe used to convert the MIDI commands generated by theSymPOSER into high-quality sound for being presented witha good sounding stereo amplifier and loudspeaker system.The light stimuli are sent via USB to a DMX interface thatallows for driving any studio light system. We have built twotypes of lighting devices for the Sensorium. The first are 4colored spot lights (red, green, blue, and yellow) with 50 Weach which is suitable for indirect illumination of blank wallsor curtains in a small environment. The second device isa white semitransparent ball that is enlightened by coloredsuper bright LEDs from inside. This ball can be used as avisual focus connecting the user’s consciousness with thelight ball. Through the use of a small portable amplifier theuser has a high degree of freedom to either sit or lie down oreven move the body in the environmental room.
According to Figure 3, we have tested the Sensoriumversion with indirect diffuse illumination meaning that thecolor and light filled the whole visual field. Signals fromwithin the body were thus projected by sound and light intothe surrounding space creating an individual and temporallychanging atmosphere. Here, as an effect on consciousnesswe expected a more widening than introspective experience.The room itself should be as neutral as possible so that the
stimulation alone is in charge of determining the consciousexperience. Before exposed to the stimulation the usersshould be informed about the fact that every instrumentor sound they hear and every change in light or color willbe initiated by their own body signals. The technology wasintended to be as invisible or remote as possible in order tokeep the experience as pure as possible. This should createa unite consciousness between the outer experience and theown body or self.
3. Pilot Study
3.1. Study Design. 20 healthy people (mean age 38 years,11 f/9 m) have participated in a Sensorium session separately.Ten of them had meditation experience with an average totalpractice time of 644 hours, the other ten were nonmeditators.Eight from 10 meditators had more than 500 hours of expe-rience. The sessions took place either in a small meditationroom, or in the EEG measurement cabin of the Instituteof Environmental Health Sciences at the University ClinicFreiburg, Germany in which the feedback environment wasinstalled. After signing their informed consent, participantsfilled in a short introductionary questionnaire. They wereseated on a meditation cushion. Five Ag/AgCl electrodes wereattached to their body; one was a grounding electrode on theshoulder. ECG was measured with two electrodes betweensternum and the left costal arch. One channel of EEG wasmeasured with two electrodes between one mastoid and theposition CPz of the 10/20 electrode system. After testingthe signal quality the participants were instructed that thesession will last for about 15 minutes in which they shouldsit relaxed with open eyes and just experience the lights andsoundscape being aware that all changes of light and soundand all touches of an instrument will be initiated by a signalthat was currently produced by their own body, that is, bytheir brain or heart. Then, the session was started while theexperimenter remained in the background or outside thechamber. After the session, the participant could share theexperience with the experimenter. Each session consisting ofthe introduction, setting up of electrodes, the actual sessionof about 15 minutes duration, a short discussion afterwards,and filling in a questionnaire lasted about 30 to 40 minutes.The final questionnaire asked for the personal experiencesand allowed for performance ratings of the device.
3.2. Stimulus Design. The selection of sound and lightstimuli in such kind of experiments is both an aestheticaland a scientific question. For obtaining high quality soundsthe internal sound card was not appropriate. Therefore, theMIDI commands generated by the SymPOSER module weresent to an additional software sampler program offering animproved sound quality.
The beginning and final phase of the session wasoccupied with the basic sound of the heartbeat. The ECGwas sonified with two instruments, a smooth deep bass,played at each R-peak and the ECG Padmix, that is, a dronesound with water drop like tingles played with the R, P,and T peaks of the ECG. After the initial first minute of
6 Advances in Human-Computer Interaction
Sensorium
EEG devicePeriphery
Stereosoundsystem
DMXinterface
Amplifier
Figure 3: Participants sitting inside the Sensorium watching and listening to their own physiological signals. The technology and theexperimenter were placed to the remote periphery.
Thetavibraphone
SCPharp
Delta strings
USP flute USP flute
ECG padmix
ECG BassECG Bass
0 5
Alpha (8-10 Hz) green
USP (0.01-0.1 Hz) blue-red
10 15(min)
Ligh
tde
sign
Sou
nd
desi
gn
ECGpadmix
Figure 4: The sound and light design is depicted in a time flow graph. Inside the bars, the EEG component and the associatedinstrumentation are named. While the sound patterns changed during the time, the light parameters were kept constant.
ECG, a smooth flute sound started playing the amplitudechanges of the ultraslow potential changes (USP) between0.01 and 0.2 Hz. In addition, the delta frequencies between 1and 4 Hz were added with strings. During the time between5:15 minutes and 8:00 minutes the 4–8 Hz theta waves wereplayed with a vibraphone. In the middle of the session, theslow cortical potentials between 0.01 and 1 Hz were playedby harp sounds. In this setting, we preferably intended touse preferably slow EEG components which were supposedto calm down the organism and more easily allow tuninginto the signal variations and rhythms. Also, it seemed tobe more supportive when avoiding fast changes in the lightsand flashes. Therefore, the USP were coded into a blue-redcontrast. Positive slow potential shifts as generated on thecortex in relaxing moments should lead to a blue colouredenvironment while negative shifts normally reflect attentive
moments in which the brain produces a readiness state (i.e.,the “Bereitschaftspotenzial”) which turned the environmentinto red. This archetypical association between colour andstate could result in an intensification of a certain state(which was not proven here). The smoothed band power ofthe alpha rhythm was used to modulate the brightness of agreen spotlight that superpositioned the other lights. In thefirst sessions, a yellow peripheral spotlight was modulatedwith the heartbeat. As this appeared to be distractive for somepeople, this yellow spotlight was no longer used in the latersessions. Figure 4 illustrates the sound and light sequencing.
3.3. Results
3.3.1. Quantitative Results. After the session the participantshad to fill in a final questionnaire assessing the subjective
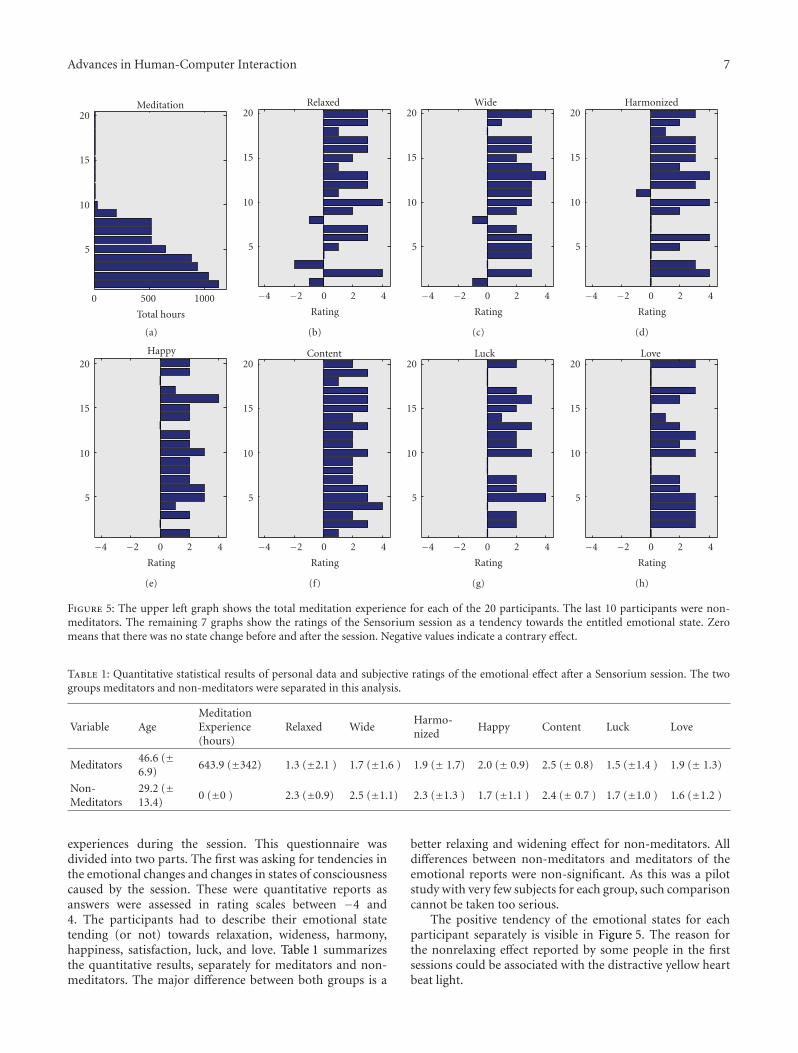
Advances in Human-Computer Interaction 7
0 500
Total hours
Meditation
1000
5
10
15
20
(a)
−4 −2 0
Rating
Relaxed
2 4
5
10
15
20
(b)
−4 −2 0
Rating
Wide
2 4
5
10
15
20
(c)
−4 −2 0
Rating
Harmonized
2 4
5
10
15
20
(d)
−4 −2 0
Rating
Happy
2 4
5
10
15
20
(e)
−4 −2 0
Rating
Content
2 4
5
10
15
20
(f)
−4 −2 0
Rating
Luck
2 4
5
10
15
20
(g)
−4 −2 0
Rating
Love
2 4
5
10
15
20
(h)
Figure 5: The upper left graph shows the total meditation experience for each of the 20 participants. The last 10 participants were non-meditators. The remaining 7 graphs show the ratings of the Sensorium session as a tendency towards the entitled emotional state. Zeromeans that there was no state change before and after the session. Negative values indicate a contrary effect.
Table 1: Quantitative statistical results of personal data and subjective ratings of the emotional effect after a Sensorium session. The twogroups meditators and non-meditators were separated in this analysis.
Variable AgeMeditationExperience(hours)
Relaxed WideHarmo-nized
Happy Content Luck Love
Meditators46.6 (±6.9)
643.9 (±342) 1.3 (±2.1 ) 1.7 (±1.6 ) 1.9 (± 1.7) 2.0 (± 0.9) 2.5 (± 0.8) 1.5 (±1.4 ) 1.9 (± 1.3)
Non-Meditators
29.2 (±13.4)
0 (±0 ) 2.3 (±0.9) 2.5 (±1.1) 2.3 (±1.3 ) 1.7 (±1.1 ) 2.4 (± 0.7 ) 1.7 (±1.0 ) 1.6 (±1.2 )
experiences during the session. This questionnaire wasdivided into two parts. The first was asking for tendencies inthe emotional changes and changes in states of consciousnesscaused by the session. These were quantitative reports asanswers were assessed in rating scales between −4 and4. The participants had to describe their emotional statetending (or not) towards relaxation, wideness, harmony,happiness, satisfaction, luck, and love. Table 1 summarizesthe quantitative results, separately for meditators and non-meditators. The major difference between both groups is a
better relaxing and widening effect for non-meditators. Alldifferences between non-meditators and meditators of theemotional reports were non-significant. As this was a pilotstudy with very few subjects for each group, such comparisoncannot be taken too serious.
The positive tendency of the emotional states for eachparticipant separately is visible in Figure 5. The reason forthe nonrelaxing effect reported by some people in the firstsessions could be associated with the distractive yellow heartbeat light.
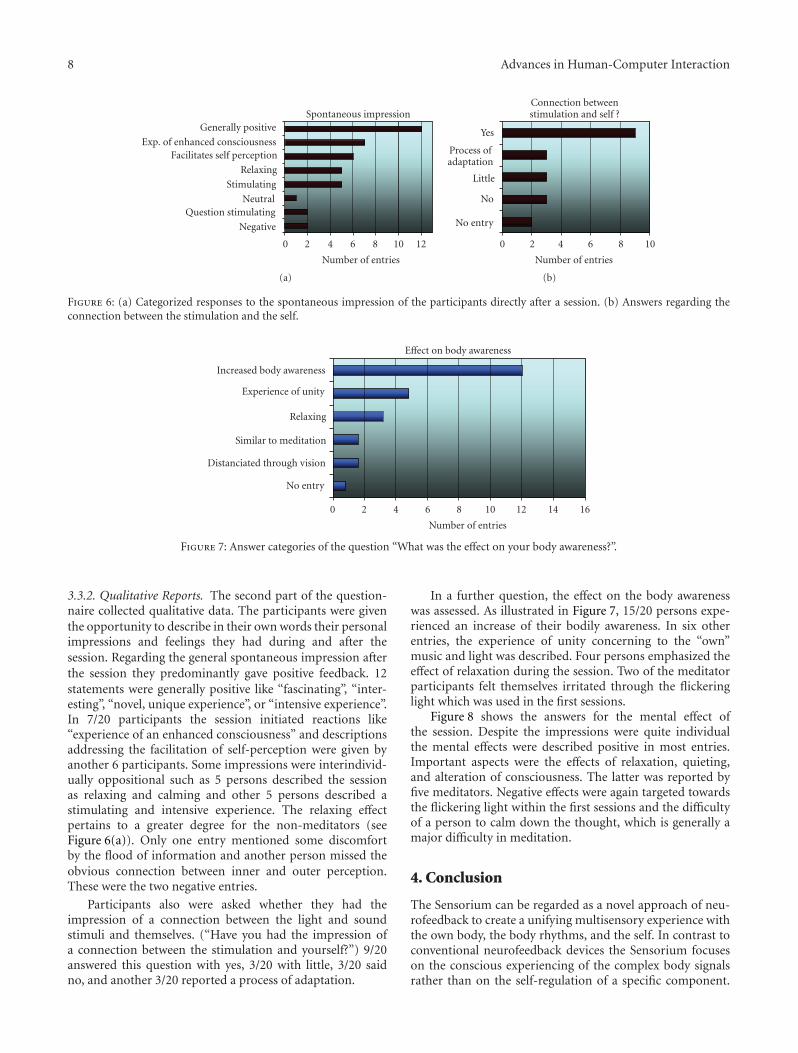
8 Advances in Human-Computer Interaction
Negative
Question stimulatingNeutral
Stimulating
Relaxing
Facilitates self perceptionExp. of enhanced consciousness
Generally positiveSpontaneous impression
0 2 4 6 8 12
Number of entries
10
(a)
No entry
No
Little
Process ofadaptation
Yes
Connection betweenstimulation and self ?
0 2
Number of entries
4 6 8 10
(b)
Figure 6: (a) Categorized responses to the spontaneous impression of the participants directly after a session. (b) Answers regarding theconnection between the stimulation and the self.
No entry
Distanciated through vision
Similar to meditation
Relaxing
Experience of unity
Effect on body awareness
Increased body awareness
0 2 4 6
Number of entries
8 10 12 14 16
Figure 7: Answer categories of the question “What was the effect on your body awareness?”.
3.3.2. Qualitative Reports. The second part of the question-naire collected qualitative data. The participants were giventhe opportunity to describe in their own words their personalimpressions and feelings they had during and after thesession. Regarding the general spontaneous impression afterthe session they predominantly gave positive feedback. 12statements were generally positive like “fascinating”, “inter-esting”, “novel, unique experience”, or “intensive experience”.In 7/20 participants the session initiated reactions like“experience of an enhanced consciousness” and descriptionsaddressing the facilitation of self-perception were given byanother 6 participants. Some impressions were interindivid-ually oppositional such as 5 persons described the sessionas relaxing and calming and other 5 persons described astimulating and intensive experience. The relaxing effectpertains to a greater degree for the non-meditators (seeFigure 6(a)). Only one entry mentioned some discomfortby the flood of information and another person missed theobvious connection between inner and outer perception.These were the two negative entries.
Participants also were asked whether they had theimpression of a connection between the light and soundstimuli and themselves. (“Have you had the impression ofa connection between the stimulation and yourself?”) 9/20answered this question with yes, 3/20 with little, 3/20 saidno, and another 3/20 reported a process of adaptation.
In a further question, the effect on the body awarenesswas assessed. As illustrated in Figure 7, 15/20 persons expe-rienced an increase of their bodily awareness. In six otherentries, the experience of unity concerning to the “own”music and light was described. Four persons emphasized theeffect of relaxation during the session. Two of the meditatorparticipants felt themselves irritated through the flickeringlight which was used in the first sessions.
Figure 8 shows the answers for the mental effect ofthe session. Despite the impressions were quite individualthe mental effects were described positive in most entries.Important aspects were the effects of relaxation, quieting,and alteration of consciousness. The latter was reported byfive meditators. Negative effects were again targeted towardsthe flickering light within the first sessions and the difficultyof a person to calm down the thought, which is generally amajor difficulty in meditation.
4. Conclusion
The Sensorium can be regarded as a novel approach of neu-rofeedback to create a unifying multisensory experience withthe own body, the body rhythms, and the self. In contrast toconventional neurofeedback devices the Sensorium focuseson the conscious experiencing of the complex body signalsrather than on the self-regulation of a specific component.
Advances in Human-Computer Interaction 9
No entry
Negative
Distracting
Stimulating
Increased ambient awareness
Increased mental awareness
Mental effect
Altering consciousness
Quieting/relaxing
0 1 2 3
Number of entries
4 5 6 7
Figure 8: Answer categories in response to the question “What was the mental effect of the session?”.
It has been demonstrated in a pilot study that this soundand light environment is a powerful tool to guide peopleinto various experiences and alter their consciousness, bodyand mental awareness in a positive and conscious way. Theinitial results encourage us to implement a self-stabilizingand health supporting intervention for patients with psycho-somatic disorders and psychological disturbances and alsofor people without pathological diagnosis in the near future.
Acknowledgments
The author thanks the BIAL foundation (Portugal) for thefinancial support that helped realizing this developmentwithin the project 148/08. He also thanks Thomas Decker forhis expertise and contribution to the technical developmentof the devices and the software.
References
[1] J. Kamiya, “Operant control of the EEG alpha rhythm andsome of its reported effects on consciousness,” in Altered Statesof Consciousness, C. T. Tart, Ed., pp. 519–529, John Wiley &Sons, New York, NY, USA, 1969.
[2] M. B. Sterman, L. R. Macdonald, and R. K. Stone, “Biofeed-back training of the sensorimotor electroencephalogramrhythm in man: effects on epilepsy,” Epilepsia, vol. 15, no. 3,pp. 395–416, 1974.
[3] N. Birbaumer, T. Elbert, B. Rockstroh et al., “Biofeedbackof event-related slow potentials of the brain,” InternationalJournal of Psychology, vol. 16, pp. 389–415, 1981.
[4] W. Lutzenberger, T. Elbert, B. Rockstroh, and N. Birbaumer,“Biofeedback of slow cortical potentials. II. Analysis ofsingle event-related slow potentials by time series analysis,”Electroencephalography and Clinical Neurophysiology, vol. 48,no. 3, pp. 302–311, 1980.
[5] N. Birbaumer, T. Elbert, B. Rockstroh, I. Daum, P. Wolf,and A. Canavan, “Clinicalpsychological treatment of epilepticseizures: a controlled study,” in Perspectives and Promises ofClinical Psychology, A. Ehlers, Ed., p. 81, Plenum, New York,NY, USA, 1991.
[6] B. Kotchoubey, U. Strehl, S. Holzapfel, V. Blankenhorn, W.Froscher, and N. Birbaumer, “Negative potential shifts and
the prediction of the outcome of neurofeedback therapy inepilepsy,” Clinical Neurophysiology, vol. 110, no. 4, pp. 683–686, 1999.
[7] J. O. Lubar and J. F. Lubar, “Electroencephalographic biofeed-back of SMR and beta for treatment of attention deficitdisorders in a clinical setting,” Biofeedback and Self-Regulation,vol. 9, no. 1, pp. 1–23, 1984.
[8] D. A. Kaiser and S. Othmer, “Effects of neurofeedback onvariables of attention in a large multi-center trial,” Journal ofNeurotherapy, vol. 4, pp. 5–15, 2000.
[9] V. J. Monastra, “Electroencephalographic biofeedback (neu-rotherapy) as a treatment for attention deficit hyperactivitydisorder: rationale and empirical foundation,” Child andAdolescent Psychiatric Clinics of North America, vol. 14, no. 1,pp. 55–82, 2005.
[10] U. Leins, G. Goth, T. Hinterberger, C. Klinger, N. Rumpf,and U. Strehl, “Neurofeedback for children with ADHD:a comparison of SCP and Theta/Beta protocols,” AppliedPsychophysiology Biofeedback, vol. 32, no. 2, pp. 73–88, 2007.
[11] U. Strehl, U. Leins, G. Goth, C. Klinger, T. Hinterberger, and N.Birbaumer, “Self-regulation of slow cortical potentials: a newtreatment for children with attention-deficit/hyperactivitydisorder,” Pediatrics, vol. 118, no. 5, pp. e1530–e1540, 2006.
[12] J. F. Lubar, M. O. Swartwood, J. N. Swartwood, and P. H.O’Donnell, “Evaluation of the effectiveness of EEG neurofeed-back training for ADHD in a clinical setting as measured bychanges in T.O.V.A. scores, behavioral ratings, and WISC-Rperformance,” Biofeedback and Self-Regulation, vol. 20, no. 1,pp. 83–99, 1995.
[13] T. Egner and J. H. Gruzelier, “Ecological validity of neuro-feedback: modulation of slow wave EEG enhances musicalperformance,” NeuroReport, vol. 14, no. 9, pp. 1221–1224,2003.
[14] T. Hinterberger, S. Schmidt, N. Neumann et al., “Brain-computer communication and slow cortical potentials,” IEEETransactions on Biomedical Engineering, vol. 51, no. 6, pp.1011–1018, 2004.
[15] T. Hinterberger, A. Kubler, J. Kaiser, N. Neumann, and N.Birbaumer, “A brain-computer interface (BCI) for the locked-in: comparison of different EEG classifications for the thoughttranslation device,” Clinical Neurophysiology, vol. 114, no. 3,pp. 416–425, 2003.
[16] G. Pfurtscheller, C. Neuper, and N. Birbaumer, “Humanbrain-computer interface (BCI),” in Motor Cortex in Voluntary

10 Advances in Human-Computer Interaction
Movements. A Distributed System for Distributed Functions, A.Riehle and E. Vaadia, Eds., pp. 367–401, CRC Press, BocaRaton, Fla, USA, 2005.
[17] N. Birbaumer, H. Flor, N. Ghanayim et al., “A brain-controlledspelling device for the completely paralyzed,” Nature, vol. 398,pp. 297–298, 1999.
[18] J. Levesque, M. Beauregard, and B. Mensour, “Effect ofneurofeedback training on the neural substrates of selec-tive attention in children with attention-deficit/hyperactivitydisorder: a functional magnetic resonance imaging study,”Neuroscience Letters, vol. 394, no. 3, pp. 216–221, 2006.
[19] H. Gevensleben, B. Holl, B. Albrecht et al., “Is neurofeedbackan efficacious treatment for ADHD? A randomised controlledclinical trial,” Journal of Child Psychology and Psychiatry, andAllied Disciplines, vol. 50, no. 7, pp. 780–789, 2009.
[20] S. K. Loo and R. A. Barkley, “Clinical utility of EEG in atten-tion deficit hyperactivity disorder,” Applied Neuropsychology,vol. 12, no. 2, pp. 64–76, 2005.
[21] T. Hinterberger, N. Neumann, M. Pham et al., “A multimodalbrain-based feedback and communication system,” Experi-mental Brain Research, vol. 154, no. 4, pp. 521–526, 2004.
[22] T. Hinterberger and G. Baier, “POSER: parametric orchestralsonification of EEG in real-time for the self-regulation of Brainstates,” IEEE Transactions on Multimedia, vol. 12, pp. 70–79,2005.
[23] T. Hinterberger, G. Baier, J. Mellinger, and N. Birbaumer,“Auditory feedback of the human EEG for direct brain-computer communication,” in Proceedings of the InternationalConference on Auditory Displays (ICAD ’04), Sydney, Australia,2004.
[24] G. Baier, T. Hermann, and U. Stephani, “Multi-channelsonification of human EEG,” in Proceedings of the 13thInternational Conference on Auditory Display (ICAD ’07), B.Martens, Ed., International Community for Auditory Display,pp. 491–496, Montreal, Canada, 2007.
[25] G. Baier, T. Hermann, and U. Stephani, “Event-based sonifi-cation of EEG rhythms in real time,” Clinical Neurophysiology,vol. 118, no. 6, pp. 1377–1386, 2007.
[26] A. de Campo and A. Wallisch, “New tools for EEG data screen-ing and monitoring,” in Proceedings of the 13th InternationalConference on Auditory Display (ICAD ’07), Montreal, Canada,2007.
[27] T. Hinterberger, “Orchestral sonification of Brain signals andits application to Brain-computer interfaces and performingarts,” in Proceedings of the 2nd International Workshop onInteractive Sonification (ISon ’07), York, UK, February 2007.
Hindawi Publishing CorporationAdvances in Human-Computer InteractionVolume 2011, Article ID 413964, 4 pagesdoi:10.1155/2011/413964
Research Article
A Functional Driver Analyzing Concept
Tobias Islinger,1 Thorsten Kohler,2 and Christian Wolff3
1 Regensburg University, Continental Automotive GmbH, Siemensstraße 12, 93055 Regensburg, Germany2 Continental Automotive GmbH, Siemensstraße 12, 93055 Regensburg, Germany3 Regensburg University, Media Informatics, Universitaetsstraße 31, 93053 Regensburg, Germany
Correspondence should be addressed to Tobias Islinger, [email protected]
Received 7 October 2010; Accepted 19 February 2011
Academic Editor: Guido Kempter
Copyright © 2011 Tobias Islinger et al. This is an open access article distributed under the Creative Commons Attribution License,which permits unrestricted use, distribution, and reproduction in any medium, provided the original work is properly cited.
It is evident that a lot of accidents occur because of drowsiness or inattentiveness of the driver. The logical consequence is thatwe have to find methods to better analyze the driver. A lot of research has been spent on camera-based systems which focus onthe driver’s eye gaze or his head movement. But there are few systems that provide camera-free driver analyzing. This is the maingoal of the work presented here which is structured in three phases, with the operational goal of having a working driver analyzerimplemented in a car. The main question is: is it possible to make statements concerning the driver and his state by using vehicledata from the CAN Bus only? This paper describes the current state of driver analyzing, our overall system architecture, as well asfuture work. At the moment, we focus on detecting the driving style of a person.
1. Introduction
Driver analysis (DA) has been an active field of research foryears. For example, [1] published an article about drivermonitoring already in 2005.
Among others, DA can be divided in the followingsubtopics: driver monitoring, driving style analysis, andmerging vehicle data to derive conclusions concerning thedriver (The word driver means both, female as well as maledrivers. This is also relevant for words like “his” or “him”which reflect also both, female as well as male persons.) andhis environment. For our research work, we focus on thefollowing aspects.
(i) How can the state of the driver be detected withoutusing a camera or realtime biosensor data like aelectrocardiogram (ecd)?
(ii) How can we support the driver, depending on hisactual driving situation, based on the results of thedriver state detection?
Driver monitoring is usually performed by cameras installedin the car for detecting the driver’s behavior or state, mostlyby using infrared cameras ([2, 3], or [1]).
There are also first results for noncamera based researchon driver analysis: By analyzing analog speed graphs, Rygula
[4] makes conclusions about the driving style, speed profileand, depending on driving time and course, aggressiveness ofthe driver. Therefore, he evaluated ten analog speed graphsfor two drivers by comparing their speed profile, their profilereferring to the distance, or referring to route and direction.Rygula states that “Even a brake of 45 minutes reduceaggressivity of driving style” ([4, page 79]).
A different approach is the research on context recog-nition in vehicles and the development of a driver model.Ferscha and Riener [5] describe this process of in-car contextrecognition and building a driver comodel.
2. Basic Architectural Considerations
There is no real “driver analyzing concept car” yet whichoffers a real-time system that works without camera orbiosensors. We plan to build up a driver analyzing systemduring the next two years which is able to draw conclusionson the driver’s condition. We have divided this task intosubtopics of increasing complexity:
(i) driver preferences,
(ii) driving style analysis,
(iii) driver state.

2 Advances in Human-Computer Interaction
00 :
0100
: 08
00 :
1500
: 22
00 :
2900
: 36
00 :
4300
: 50
00 :
5701
: 04
01 :
1101
: 18
01 :
2501
: 32
01 :
3901
: 46
01 :
5302
: 00
02 :
0702
: 14
02 :
2102
: 28
02 :
3502
: 42
02 :
4902
: 56
03 :
0303
: 10
03 :
1703
: 24
03 :
3103
: 38
03 :
4503
: 52
03 :
5904
: 06
04 :
1304
: 20
04 :
2704
: 34
04 :
4104
: 48
04 :
55
Time (mm : ss)
0
20
40
60
80
100
120
140
160
180
200Sp
eed
(km
/h)
Speed SportSpeed Eco
Figure 1: Recorded speed data of sporty and ecological driving over a time of 5 minutes.
This structure helps us to get a better understanding of theenvironment and the tasks of a driver. First, we have to learnthe favourite settings of the driver. Without any knowledgeof the driver, it would not be possible to make a statementabout his state. With the driving style analyses, we can againimprove our knowledge of the driver. Knowing the drivingstyle, for example, sporty, is also a needed input value for thenext module, the driver state. The driver state is the maintopic in our research on driver analyzing. While the first top-ics were needed to learn the driver preferences and to learnthe driving style, we want to learn within this section thedriver’s condition, focusing on drowsiness, attentiveness, andstress. This means that we use the information gathered fromthe first two modules and merge it with additional inputsignals, for example, time between using the infotainmentsystem, time to lane crossing, or environmental informationlike weather or outdoor temperature. Each module can beseen as a precondition for the next module.
Because of the fact that we use a fully equipped conceptcar, we do not need any external equipment (e.g. a GPSmouse for getting speed and position) and use only dataavailable on the CAN bus-mainly on the comfort CANbus. This decision is also advantageous for future projects,because the CAN bus is a standardized system and everyvehicle platform has almost the same information on theCAN buses.
For the driver preferences, we focus on climate controlsettings. The climate data on the CAN bus include clearand structured data, for example, temperature, fan pace, orair distribution. We concentrate on climate settings, becausechanging the temperature and the air distribution can beseen as an indicator for, example given, fatigue [6]. Next, weplan to analyze the driving style. This can be done by analyz-ing data like, for example, speed, engine load, or brake pres-sure. Possible driving styles could be driving in a sporty wayor environmentally friendly (see [7]). Analyzing the speedprofile is necessary due to the fact that, for example, tireddrivers tend to drive from very sporty through to aggressive.
Combined with the preferences from part one, we can saythat driver X sets the temperature in the vehicle to 23 degreesand drives, for example, in a sportive fashion.
3. System Architecture
The architecture of our system is divided in several parts. Atthe beginning, we have to identify the CAN messages neededand establish a stable connection between our system and theCAN bus system of the car. Therefore, not every message isuseful. What we need are data which depend somehow onthe driver’s interaction with the car. For example, the enginetemperature is not a good indicator for drowsiness. Examplesfor appropriate parameters are speed, rounds per minute,acceleration and yaw rate, pedal movement, steering wheelangle, travel time, or using the multimedia or navigationsystem, because they reflect the driver’s behavior or allowinferences on the driver’s state. For a better understanding,Figure 1 shows the graph of recorded, useful speed data.Afterwards, we have to perform data fusion. This means thatwe must merge and evaluate the information included in thedifferent messages. Depending on the respective module, theanalysis method can change. There are several aspects whichinfluence the selection process for the right method. Choos-ing the right method for each module will surely be one ofthe most important parts. On the one hand, we have to definelearning algorithms to get an intelligent system; on the otherhand, we must define rules for certain driving situations. Weplan to measure the state on long-term trips with a drivingduration of at least 45 minutes. Moreover, we restrict thesystem to only measure on highways or state roads.
Although we restrict the system to long-term trips andstreet type, there are some situations where the system mightnot be able to work correct. One factor is of course the driverhimself. If he ignores the proposals, we cannot force thedriver to adherence the instruction of the system. Also, envi-ronmental factors like snow, clear ice, as well as traffic jams oraccidents might lead to a wrong state detection. Last but not
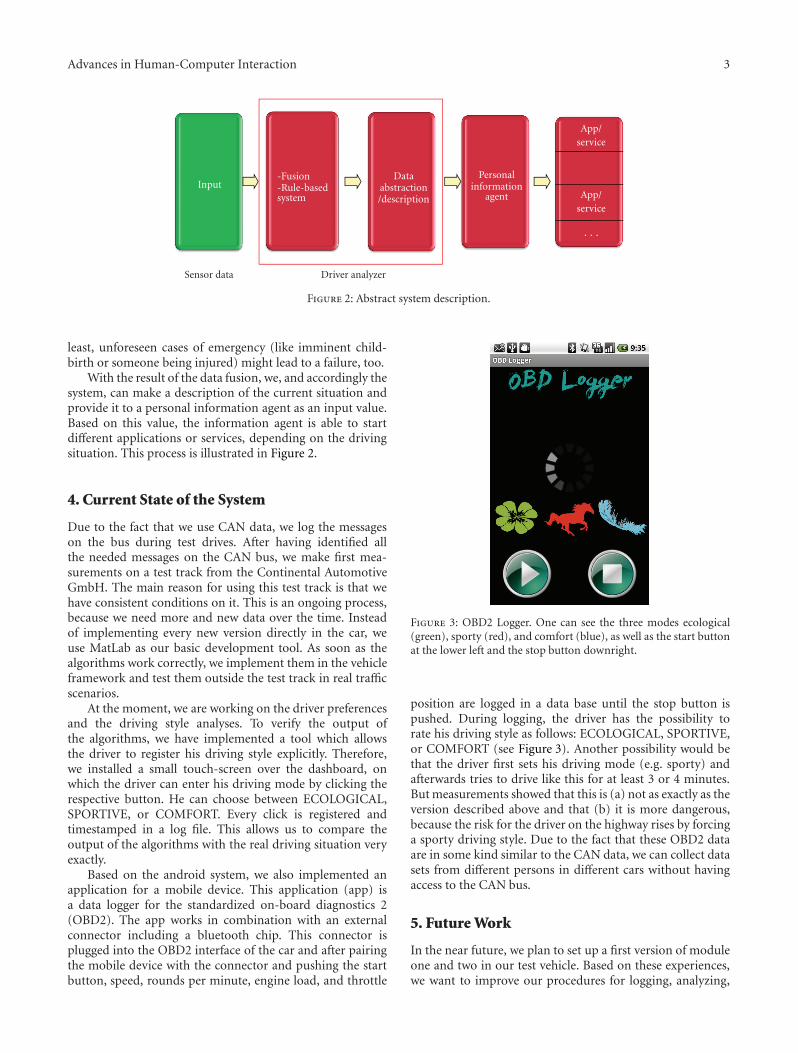
Advances in Human-Computer Interaction 3
Input-Fusion-Rule-basedsystem
Dataabstraction/description
Personalinformation
agent
App/service
App/service
· · ·
Sensor data Driver analyzer
Figure 2: Abstract system description.
least, unforeseen cases of emergency (like imminent child-birth or someone being injured) might lead to a failure, too.
With the result of the data fusion, we, and accordingly thesystem, can make a description of the current situation andprovide it to a personal information agent as an input value.Based on this value, the information agent is able to startdifferent applications or services, depending on the drivingsituation. This process is illustrated in Figure 2.
4. Current State of the System
Due to the fact that we use CAN data, we log the messageson the bus during test drives. After having identified allthe needed messages on the CAN bus, we make first mea-surements on a test track from the Continental AutomotiveGmbH. The main reason for using this test track is that wehave consistent conditions on it. This is an ongoing process,because we need more and new data over the time. Insteadof implementing every new version directly in the car, weuse MatLab as our basic development tool. As soon as thealgorithms work correctly, we implement them in the vehicleframework and test them outside the test track in real trafficscenarios.
At the moment, we are working on the driver preferencesand the driving style analyses. To verify the output ofthe algorithms, we have implemented a tool which allowsthe driver to register his driving style explicitly. Therefore,we installed a small touch-screen over the dashboard, onwhich the driver can enter his driving mode by clicking therespective button. He can choose between ECOLOGICAL,SPORTIVE, or COMFORT. Every click is registered andtimestamped in a log file. This allows us to compare theoutput of the algorithms with the real driving situation veryexactly.
Based on the android system, we also implemented anapplication for a mobile device. This application (app) isa data logger for the standardized on-board diagnostics 2(OBD2). The app works in combination with an externalconnector including a bluetooth chip. This connector isplugged into the OBD2 interface of the car and after pairingthe mobile device with the connector and pushing the startbutton, speed, rounds per minute, engine load, and throttle
Figure 3: OBD2 Logger. One can see the three modes ecological(green), sporty (red), and comfort (blue), as well as the start buttonat the lower left and the stop button downright.
position are logged in a data base until the stop button ispushed. During logging, the driver has the possibility torate his driving style as follows: ECOLOGICAL, SPORTIVE,or COMFORT (see Figure 3). Another possibility would bethat the driver first sets his driving mode (e.g. sporty) andafterwards tries to drive like this for at least 3 or 4 minutes.But measurements showed that this is (a) not as exactly as theversion described above and that (b) it is more dangerous,because the risk for the driver on the highway rises by forcinga sporty driving style. Due to the fact that these OBD2 dataare in some kind similar to the CAN data, we can collect datasets from different persons in different cars without havingaccess to the CAN bus.
5. Future Work
In the near future, we plan to set up a first version of moduleone and two in our test vehicle. Based on these experiences,we want to improve our procedures for logging, analyzing,

4 Advances in Human-Computer Interaction
and implementing. Moreover, we need the results of the firstimplementations for choosing the right analyzing methods.In the long run, we have to develop new methods forcombining the modules and new algorithms for interpretingthe vehicle data correctly. Driver state modeling will also be amajor challenge.
References
[1] M. Itoh, Y. Mizuno, S. Yamamoto, and S. Mori, “Driver’s statusmonitor,” in Proceedings of the 21st International Workshop onBiomedical Data Engineering (BMDE ’05), Tokyo, Japan, 2005.
[2] M. S. Devi and P. R. Bajaj, “Driver fatigue detection based oneye tracking,” in Proceedings of the 1st International Conferenceon Emerging Trends in Engineering and Technology (ICETET’08), pp. 649–652, 2008.
[3] D. Lee, S. Oh, S. Heo, and M. Hahn, “Drowsy driving detectionbased on the driver’s head movement using infrared sensors,”in Proceedings of the 2nd International Symposium on UniversalCommunication (ISUC ’08), pp. 231–236, December 2008.
[4] A. Ryguła, “Driving style identification method based on speedgraph analysis,” in Proceedings of the International Conferenceon Biometrics and Kansei Engineering (ICBAKE ’09), pp. 76–79,June 2009.
[5] A. Ferscha and A. Riener, “Pervasive adaption in car crowds,”in Proceedings of the 1st International Workshop on User-CentricPervasive Adaptation at MOBILWARE (UCPA ’09), Berlin,Germany, 2009.
[6] J. van den Berg, “An overview of sleepiness aspects reflected inbalance scale model,” The Open Sleep Journal, vol. 2, pp. 33–42,2009.
[7] N. Tricot, D. Sonnerat, and J. C. Popieul, “Driving styles andtraffic density diagnosis in simulated driving conditions,” inProceedings of the IEEE Intelligent Vehicle Symposium (IV ’02),Paris, France, 2002.