67
05. Data from Bloomberg Add-in
| Date post: | 02-Jan-2016 |
| Category: |
Documents |
| Upload: | caesar-stanton |
| View: | 44 times |
| Download: | 0 times |

05. Data fromBloomberg Add-in

Launch Bloomberg and Press GO

Enter your login details

Choose Settings Wheel, then set window size to Normal
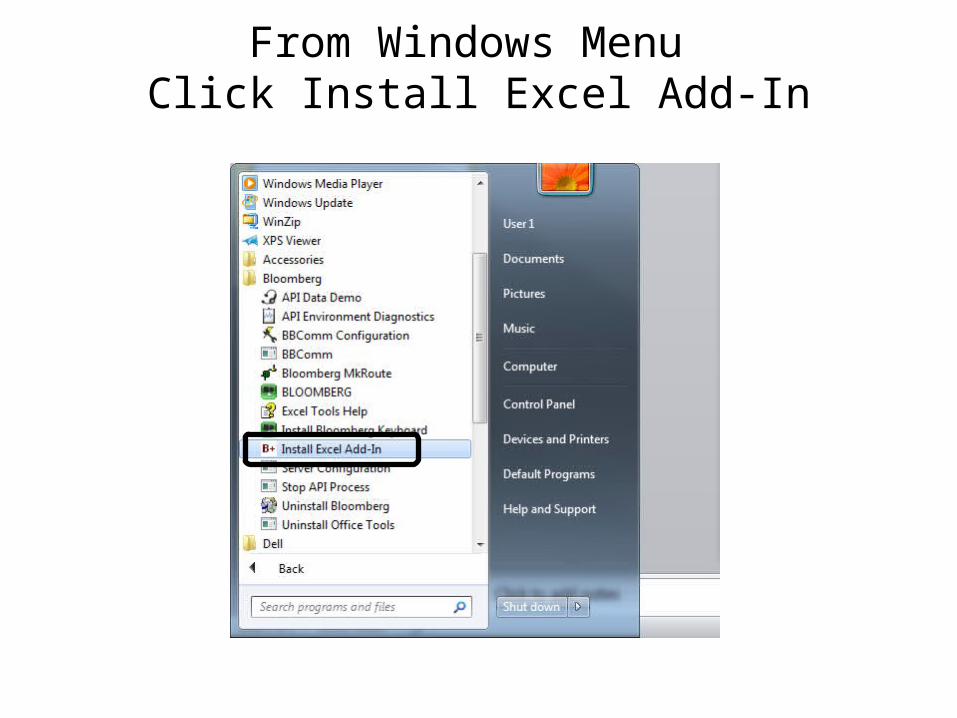
From Windows Menu Click Install Excel Add-In

Press Install

Click OK

Click Microsoft Excel 2010

Click on Cell A1

Click Bloomberg

Click Real-Time/Historical
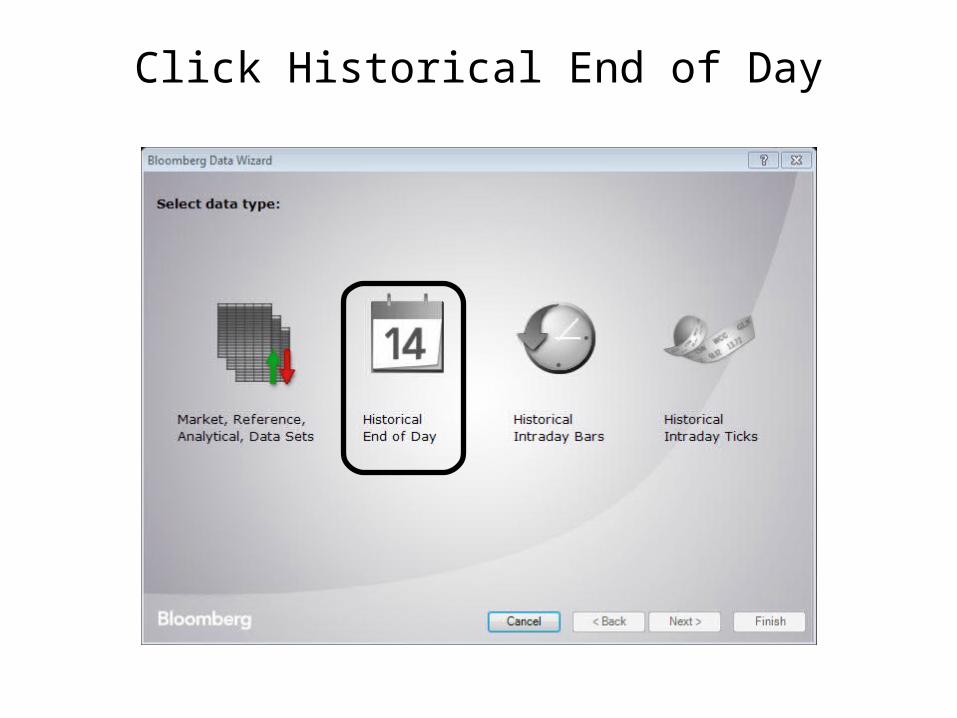
Click Historical End of Day

Type Apple
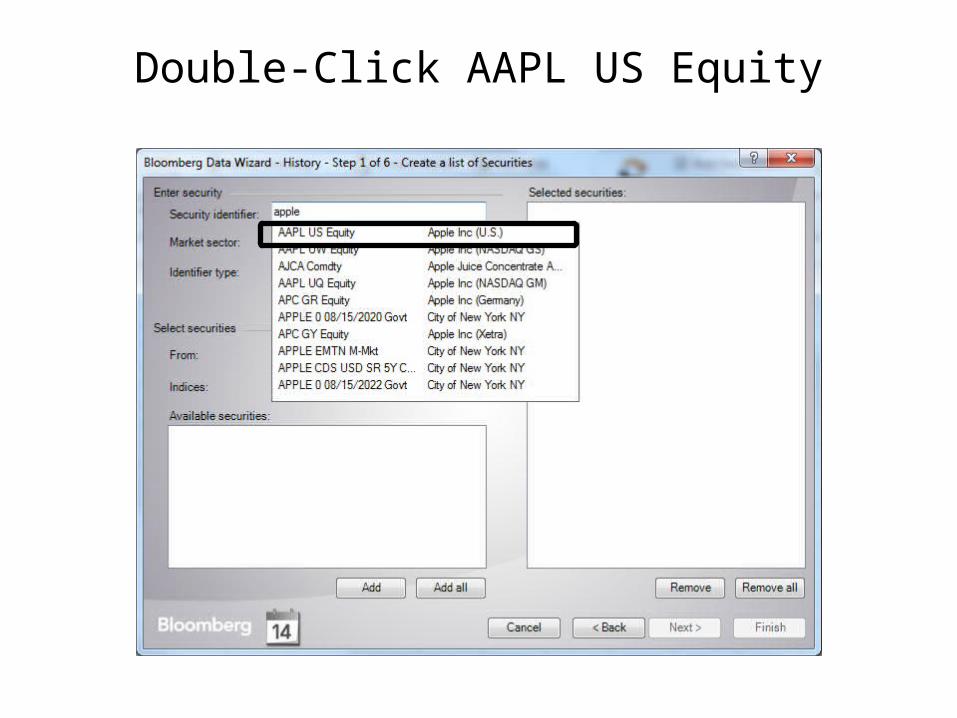
Double-Click AAPL US Equity

Type SP

Double Click SPX Index (S&P 500 Index)

Click Next

Select Market Activity

Select Last
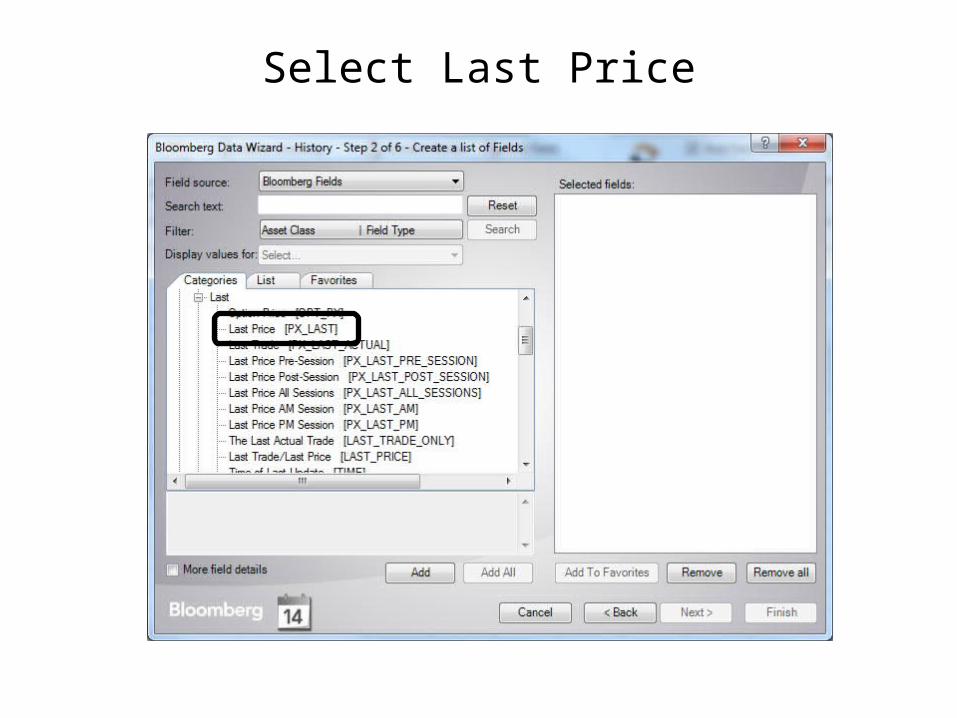
Select Last Price

Click Add
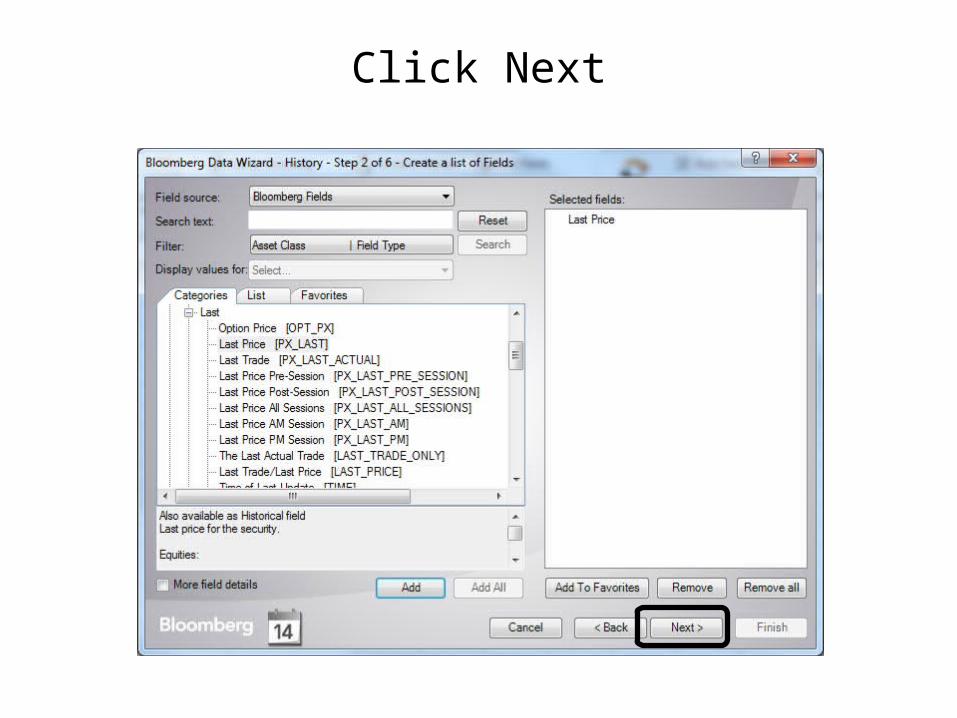
Click Next

Select Date From 01/01/2003 to 12/09/2012

Click Next

Click Include all calendar days

Click Finish

Increase Column Width of A and D

Shows Historical Prices for APPLE and S&P500

Select Columns A to E

Press Home
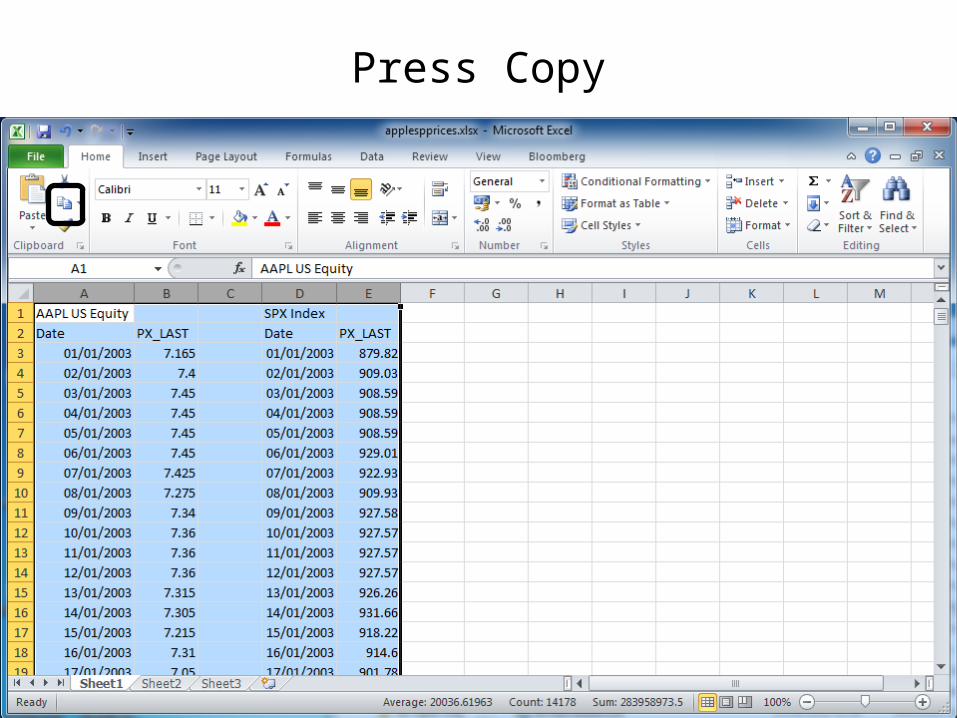
Press Copy

Press Paste -> Paste Values -> 123

This removes any formulas

Type ApplePrice in B2, and SP500Price in E2

Click on Cell A1

Click Delete -> Delete Sheet Rows

Select Columns C and D
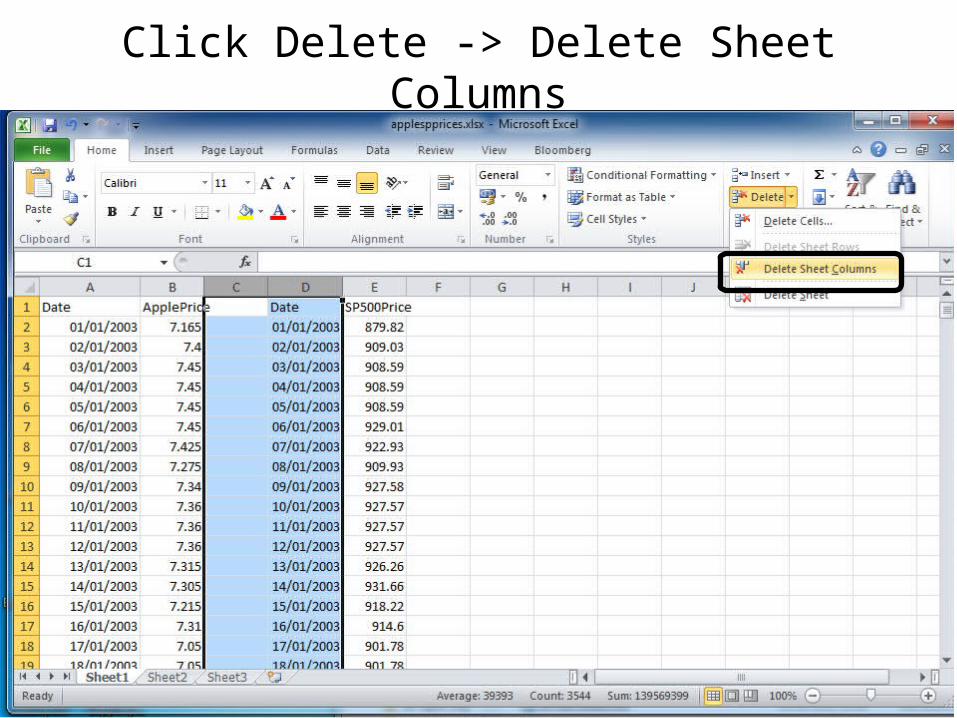
Click Delete -> Delete Sheet Columns

Now have neatly formatted data

Challenge
• Select Sheet2 and download share price data on another company of your choice
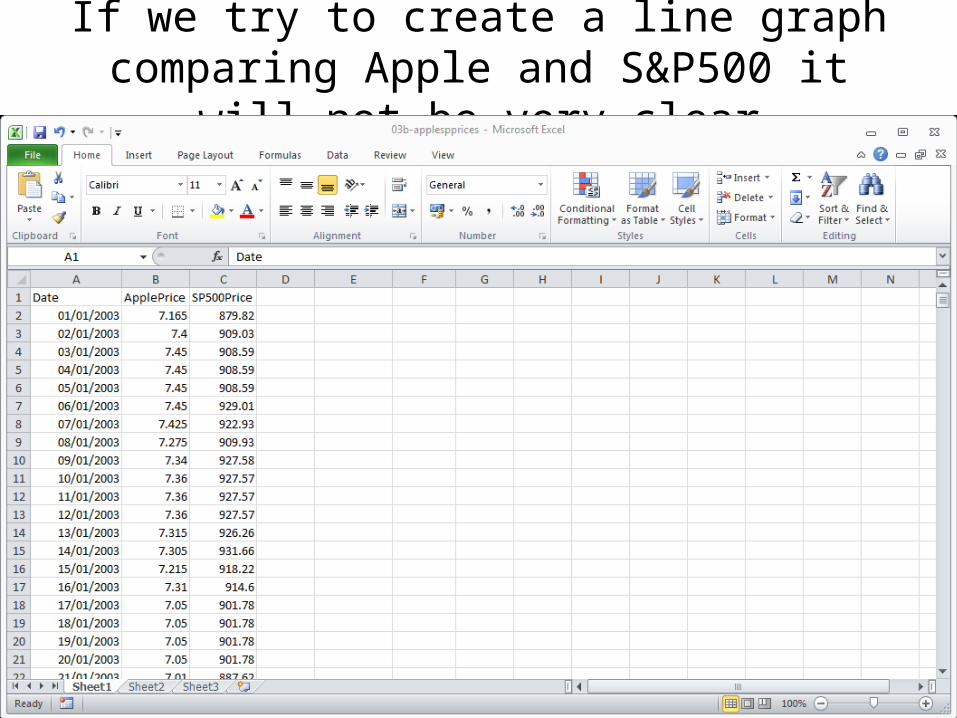
If we try to create a line graph comparing Apple and S&P500 it will not be very clear

Click on Cell A1

Press Ctrl + Shift + * on your keyboard to select whole dataset
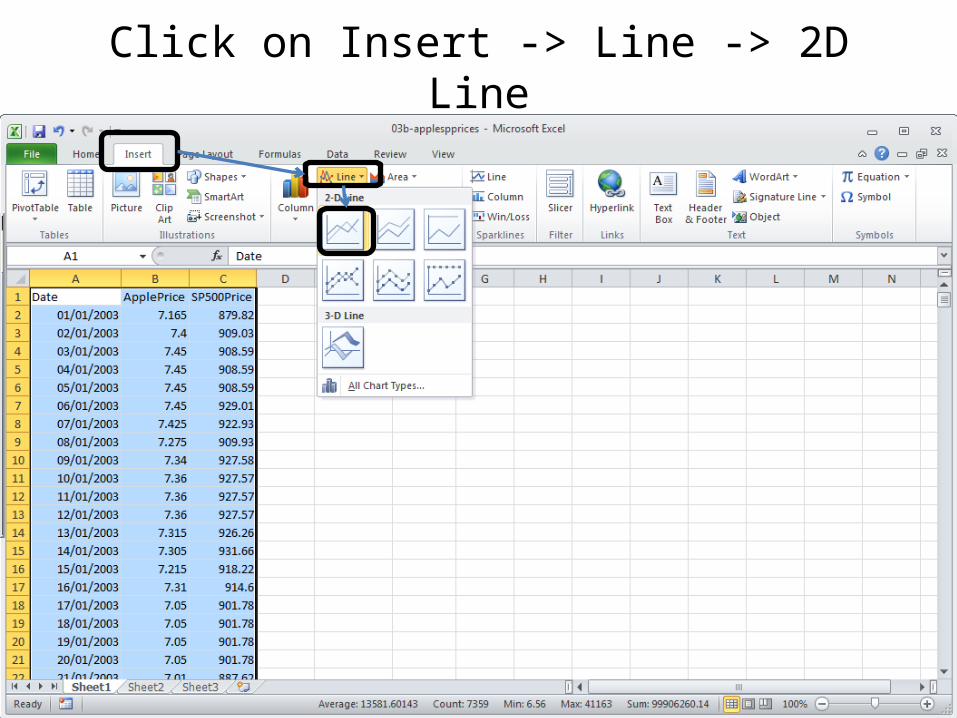
Click on Insert -> Line -> 2D Line
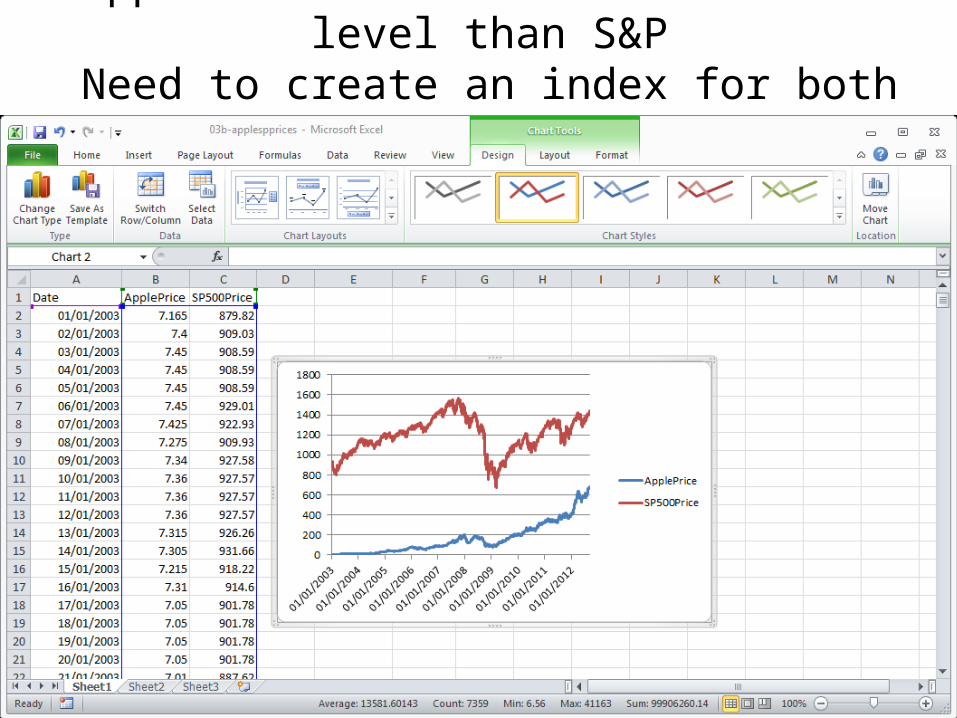
Apple starts off at a much lower level than S&PNeed to create an index for both starting at 1,000
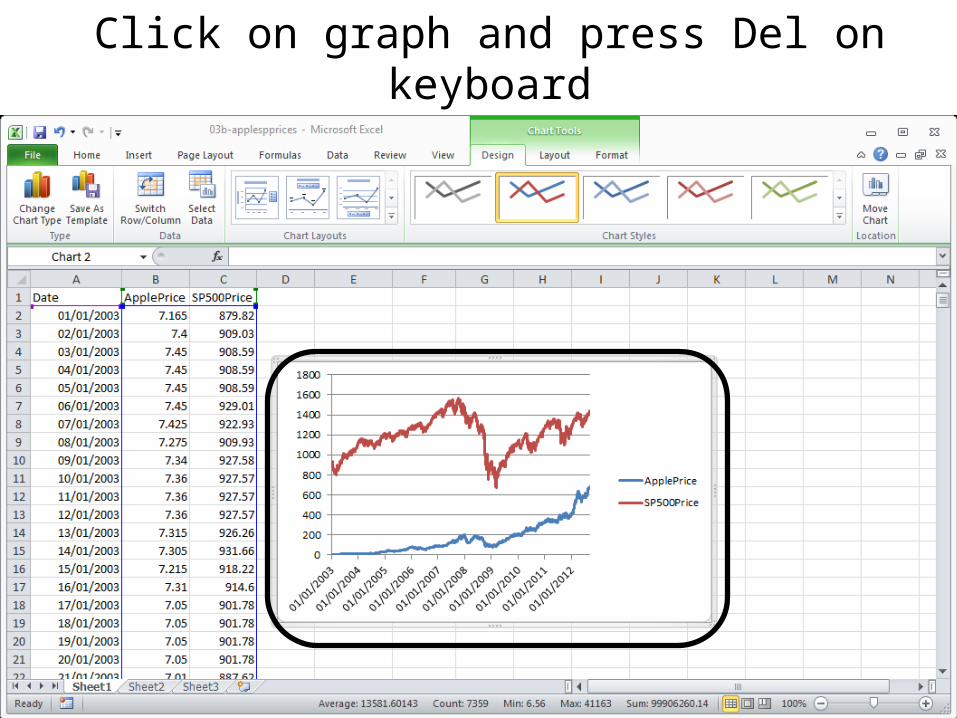
Click on graph and press Del on keyboard

Type AppleIndex in E1

Type SPIndex in F1

We want to compare all prices to the first price so in cell E2 type =B2/$B$2*1000
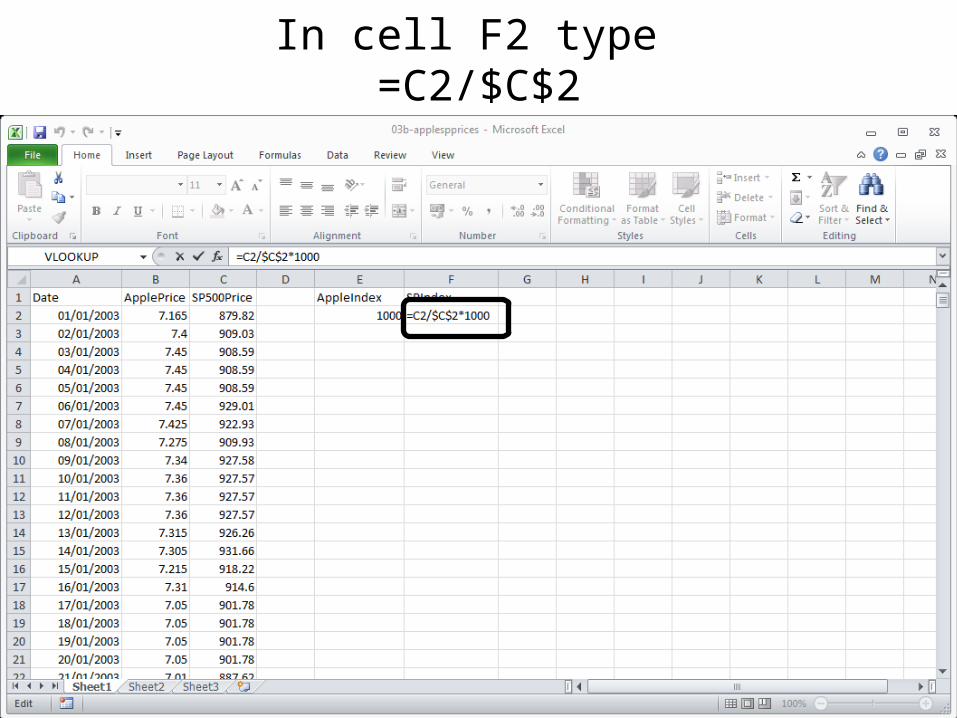
In cell F2 type =C2/$C$2
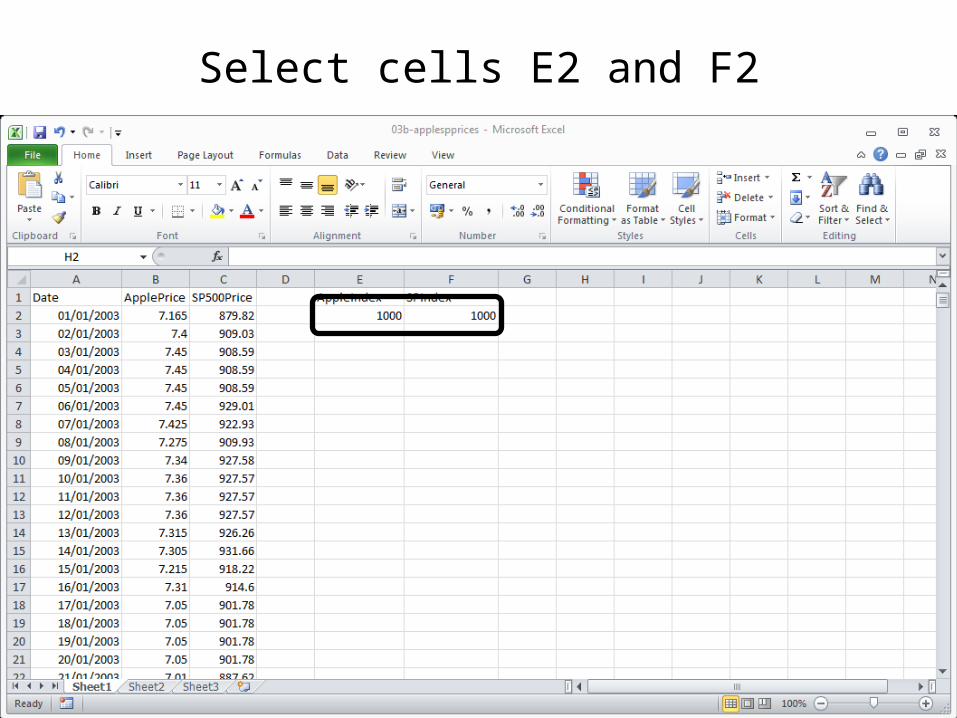
Select cells E2 and F2
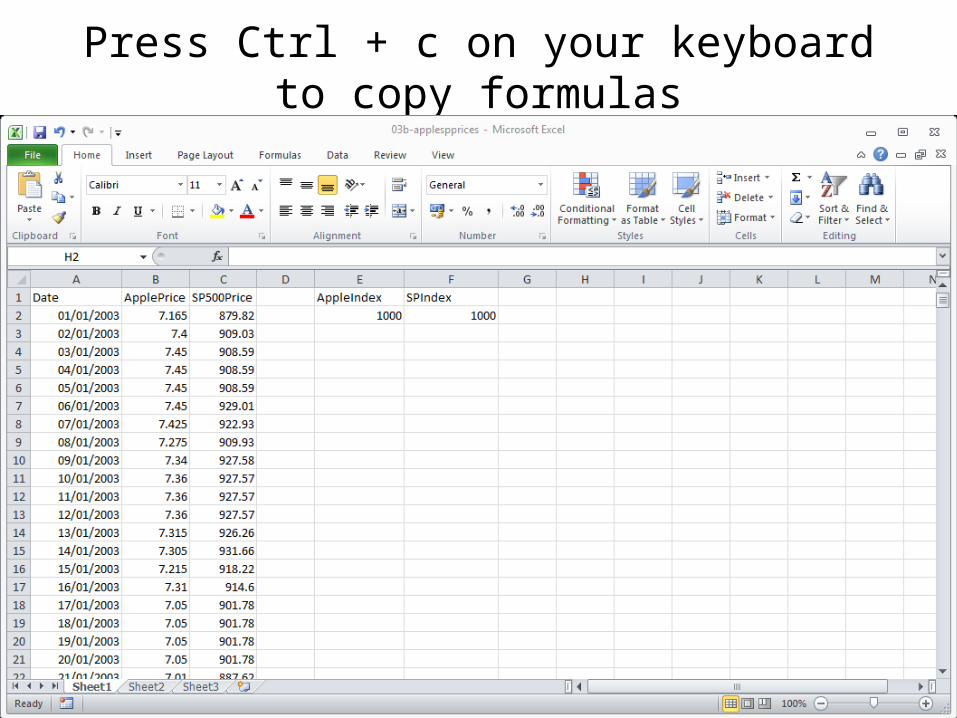
Press Ctrl + c on your keyboard to copy formulas

Select from cell E3 to the bottom of dataset and press Ctrl + v to paste formulas

Select column headings of E and F to select all cells in those columns

Right-click with your mouse and click Format Cells …

Select Number -> 2 Decimal Places

Click OK

Numbers now displayed with 2 decimal places

Numbers now displayed with 2 decimal places
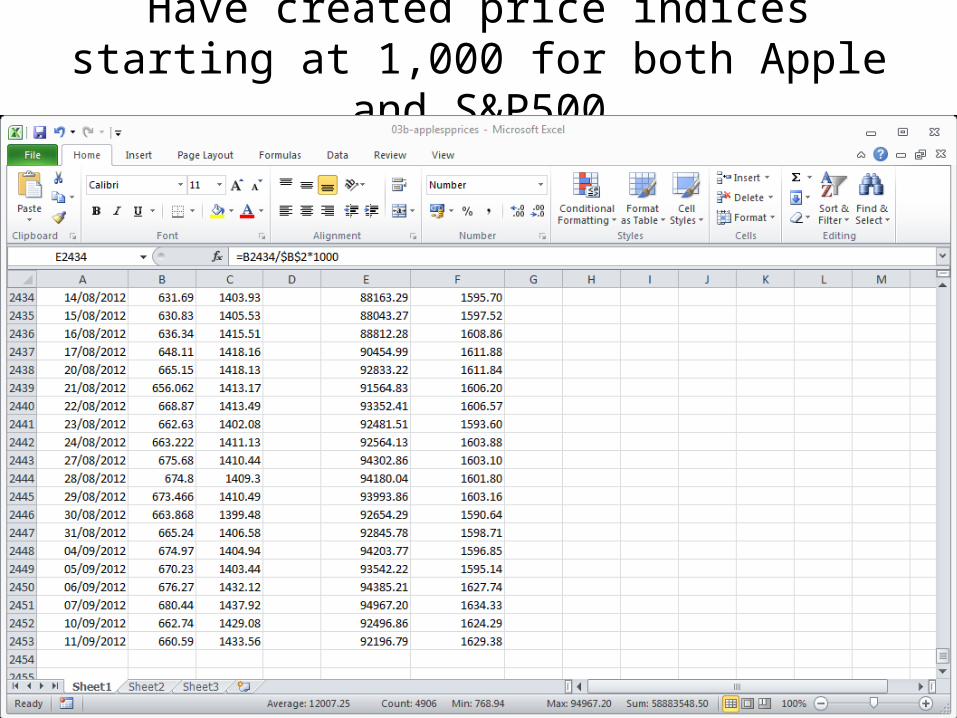
Have created price indices starting at 1,000 for both Apple and S&P500
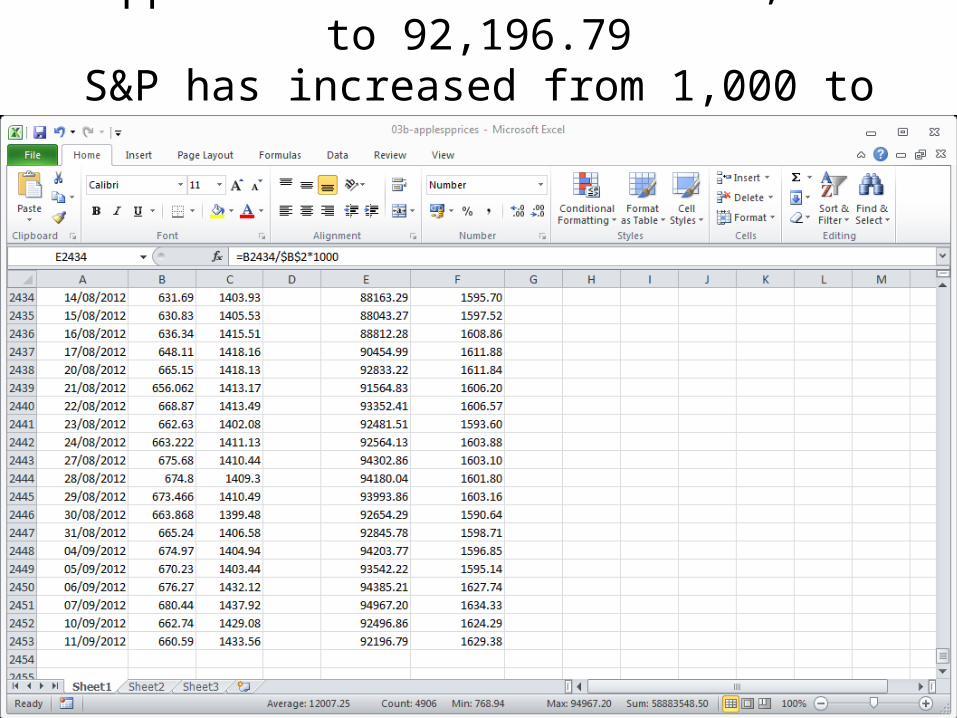
Apple has increased from 1,000 to 92,196.79S&P has increased from 1,000 to 1,629.38

Click on column header A to select the Date column
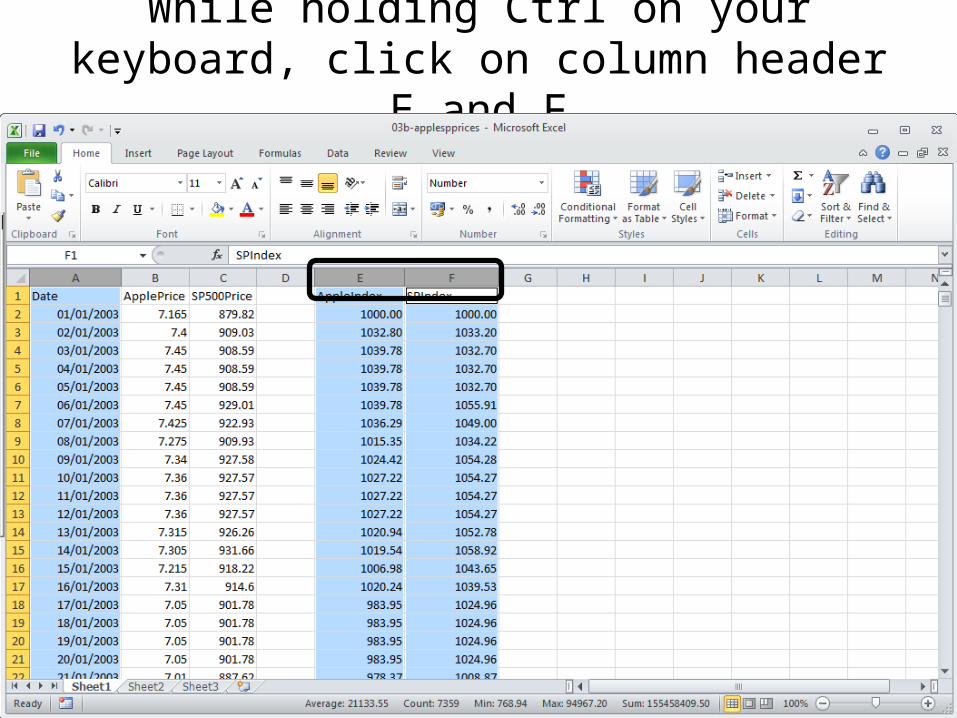
While holding Ctrl on your keyboard, click on column header E and F

Click on Insert -> Line -> 2-D Line

Displays a line graph of the indices both starting at 1,000
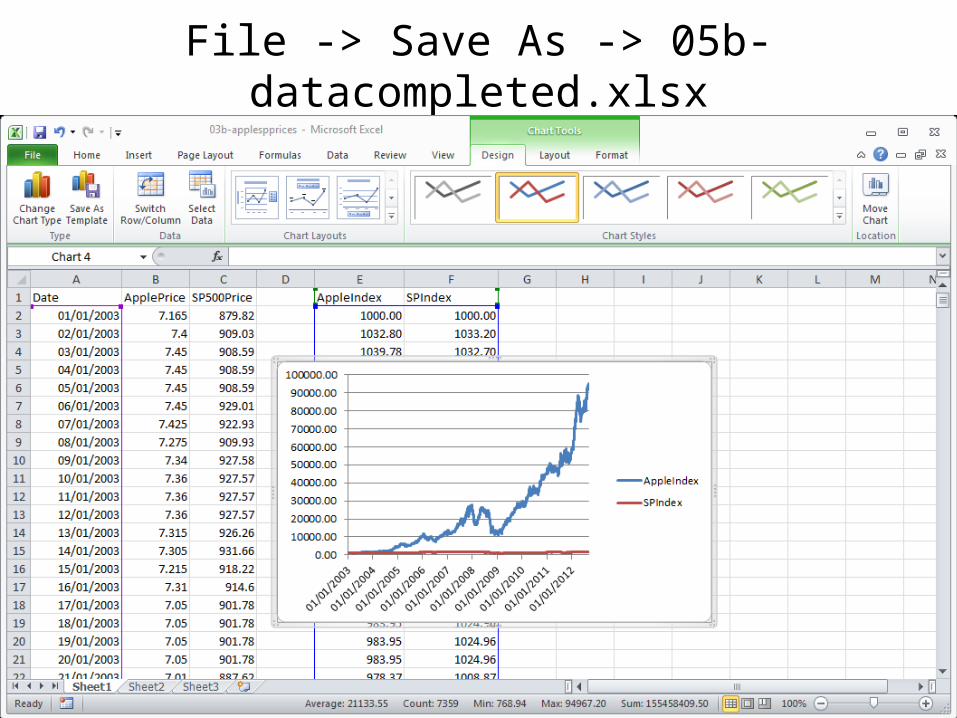
File -> Save As -> 05b-datacompleted.xlsx

Challenge
• Calculate an index of the share price data you downloaded for another company
• Begin the index at 1,000• Produce a basic line graph


