Page 1
WOLFGANG AiGNER networks & hierarchies 1
networks & hierarchies
Wolfgang Aigner
[email protected]
http://ieg.ifs.tuwien.ac.at/~aigner/
Version 2.0
25.11.2010
http://www.caida.org/tools/visualization/walrus/ WOLFGANG AiGNER networks & hierarchies 2
OverviewA) Hierarchical visualization techniques
B) Visualizing networks & hierarchies
[Keim, 2001]
WOLFGANG AiGNER networks & hierarchies 3
Part Ahierarchical visualizationtechniques
WOLFGANG AiGNER networks & hierarchies 4
Problem
Data
multivariate data (e.g., Movie DB, Car dataset)
Presentation space
display dimensionality constrained to 2D or 3D
Task
meaningful representation of all variables within asingle plot
How?
Page 2
WOLFGANG AiGNER networks & hierarchies 5
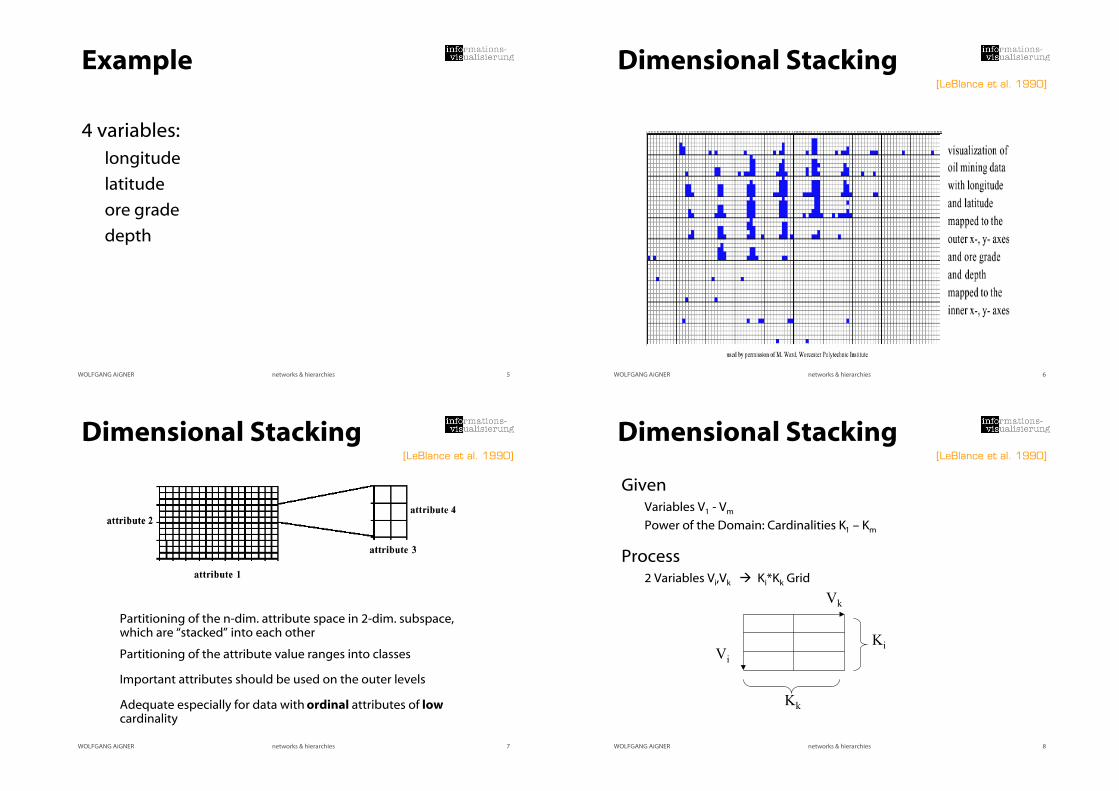
Example
4 variables:
longitude
latitude
ore grade
depth
WOLFGANG AiGNER networks & hierarchies 6
Dimensional Stacking[LeBlance et al. 1990]
WOLFGANG AiGNER networks & hierarchies 7
Dimensional Stacking
Partitioning of the n-dim. attribute space in 2-dim. subspace,which are “stacked” into each other
Partitioning of the attribute value ranges into classes
Important attributes should be used on the outer levels
Adequate especially for data with ordinal attributes of lowcardinality
[LeBlance et al. 1990]
WOLFGANG AiGNER networks & hierarchies 8
Dimensional Stacking
GivenVariables V1 - Vm
Power of the Domain: Cardinalities K1 – Km
Process2 Variables Vi,Vk ! Ki*Kk Grid
Vi
Vk
Ki
Kk
[LeBlance et al. 1990]
Page 3
WOLFGANG AiGNER networks & hierarchies 9
ExampleVariables: V1-V6
Cardinalities : K1=4,K2=2,K3=2,K4=3,K5=3,K6=2
Pairs P1(V1,V3),P2(V4,V5),P3(V2,V6)
Example - Combination: 4,2,3,2,2,2
[LeBlance et al. 1990]
WOLFGANG AiGNER networks & hierarchies 10
Worlds-within-Worlds
Partitioning of the n-dim. Space into 3-dim. Subspace
Nested 3-dim coordinates
3-dim coordinate = one property
Selected points --> new coordinates‘ system
[Feiner & Besherss 1990]
WOLFGANG AiGNER networks & hierarchies 11
Worlds-within-Worlds[Feiner & Besherss 1990]
WOLFGANG AiGNER networks & hierarchies 12
Part Bvisualizingnetworks & hierarchies
Page 4
WOLFGANG AiGNER networks & hierarchies 13
Illustrating example
Data: file system
Problem/task: disk is full --> free some space
How?
Tool?
Visualization?
Tjark Derlien, Disk Inventory X, 2005. http://www.derlien.com/
WOLFGANG AiGNER networks & hierarchies 14
Visualization Design
data
task
representation &
interaction
user
expressiveness effectiveness
appropriateness
WOLFGANG AiGNER networks & hierarchies 15
Basic Data Characteristicsnetwork / graph
items (nodes) that have relationships (edges)
G := {N, E}
no inherent hierarchical structure
hierarchy / treeparent - child relationships
every node has at most one parent
exactly one root node
mostly non-leaf nodes are containers only
hierarchical network
WOLFGANG AiGNER networks & hierarchies 16
Network examples
Airline map:=(Cities, Flights) Team:=(People, Relationships) Molecule:=(Atoms, Bonds)
Page 5
WOLFGANG AiGNER networks & hierarchies 17
Edges
undirected / directed / mixed
weighted / signed / labeled
simple / multiplex
certainty / probabilistic
multi-modal
?
Graph theory
18
Multi-modal example ::Blogosphere
Bloggers know each other + Blogs link each other + Bloggers write blogs
(simple, undirected) (multiplex, directed) (bipartite)
= Blogosphere structure
(multiplex, mixed, multi-modal)
WOLFGANG AiGNER networks & hierarchies 19
Basic Data Characteristics
Topology
Nodes
Edges
Node attributes
Edge attributes
Node measures (derived)
Edge measures (derived)
Network measures (derived)
Size / number of elements (complexity)
Tree: connected,
unweighted, acyclic graph
WOLFGANG AiGNER networks & hierarchies 20
Hierarchies
Hierarchical data are very common
Hierarchies are one of the most prevalent
organizing principles for coping with
information
application examples
organizations, org-charts, taxonomies, table ofcontents, sitemaps, file system, genealogies, ...
Page 6
WOLFGANG AiGNER networks & hierarchies 21
TasksWhat are the tasks the users want to perform? What are users‘ goals?
reducing complexity
categorization - hierarchies (expand/collapse)
overview of topology
distribution
examine relationships
examine paths
examine elements
identify
locate
distinguish
relate
compare
general
specific
WOLFGANG AiGNER networks & hierarchies 22
Part B.1visualizing networks
WOLFGANG AiGNER networks & hierarchies 23
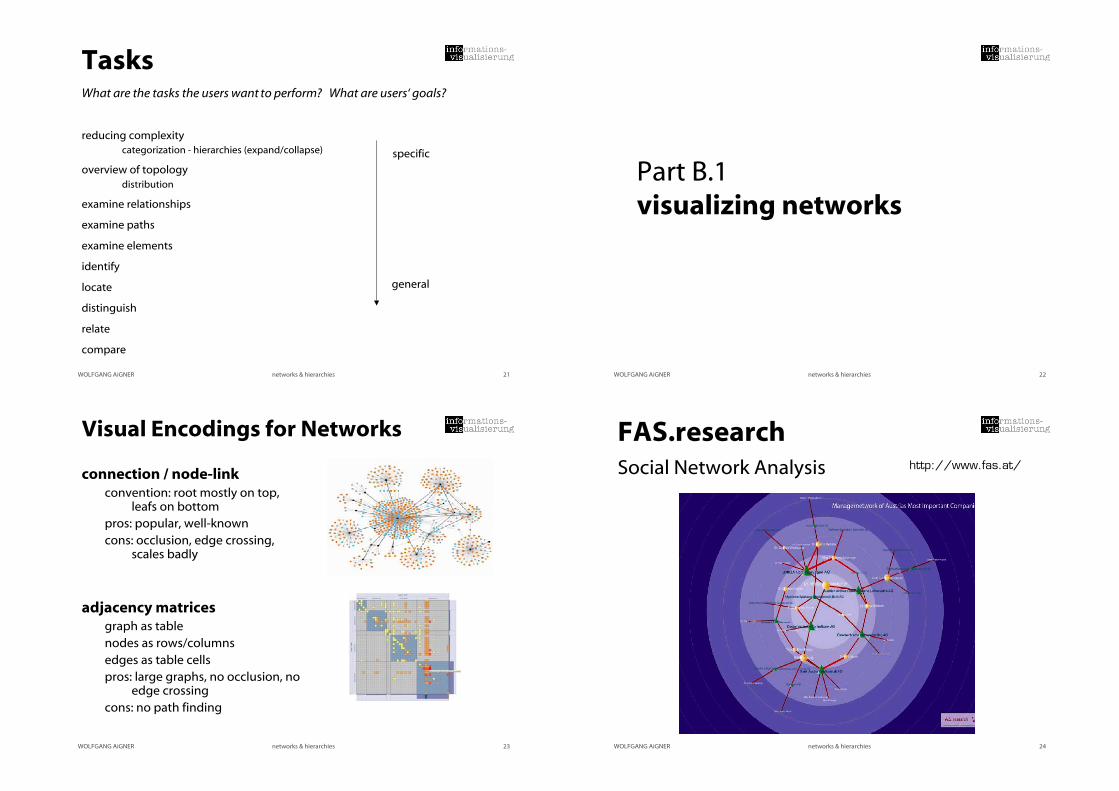
Visual Encodings for Networks
connection / node-linkconvention: root mostly on top,
leafs on bottom
pros: popular, well-known
cons: occlusion, edge crossing,scales badly
adjacency matricesgraph as table
nodes as rows/columns
edges as table cells
pros: large graphs, no occlusion, noedge crossing
cons: no path finding
WOLFGANG AiGNER networks & hierarchies 24
FAS.researchSocial Network Analysis http://www.fas.at/
Page 7
WOLFGANG AiGNER networks & hierarchies 25
Issues for representation
Positioning of nodes
layout
Representation of edgese.g., weights
Size / complexity
High number of nodes & edges
Labeling
Interaction with graphsWOLFGANG AiGNER networks & hierarchies 26
Layout: Guiding criteriadrawing conventions
edges only straight lines, rectilinear lines, or polygonal lines
placing nodes on a fixed grid
having all sibling nodes share the same vertical position
constraints
particular node in the center
group of nodes close to each other
links from top to bottom or left to right
aesthetics
minimize node overlap
uniform edge length
minimize line crossings
maintain pleasing aspect ratio
minimize total area of drawing
minimize total length of edges
minimize number of bends in edges
minimize the number of distinct angles or curvatures
symmetry
WOLFGANG AiGNER networks & hierarchies 27
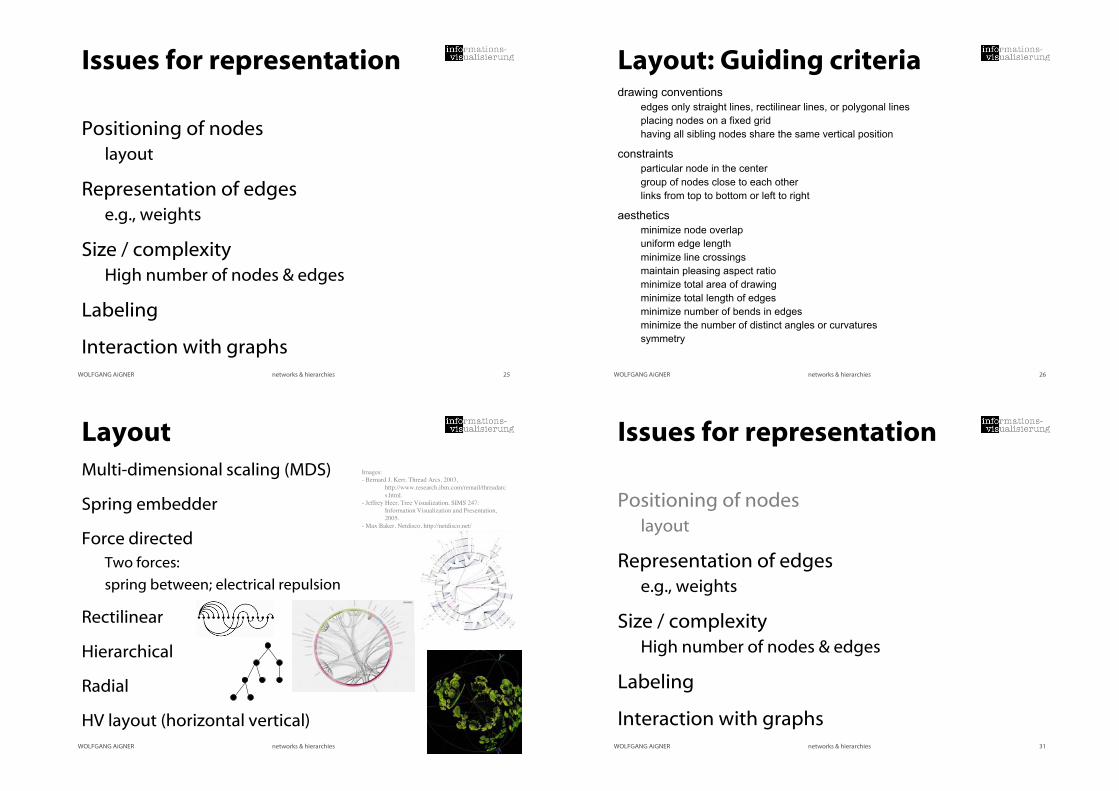
Multi-dimensional scaling (MDS)
Spring embedder
Force directed
Two forces:
spring between; electrical repulsion
Rectilinear
Hierarchical
Radial
HV layout (horizontal vertical)
LayoutImages:
- Bernard J. Kerr, Thread Arcs, 2003,
http://www.research.ibm.com/remail/threadarc
s.html.
- Jeffrey Heer, Tree Visualization, SIMS 247:
Information Visualization and Presentation,
2005.
- Max Baker, Netdisco, http://netdisco.net/
WOLFGANG AiGNER networks & hierarchies 31
Issues for representation
Positioning of nodes
layout
Representation of edgese.g., weights
Size / complexity
High number of nodes & edges
Labeling
Interaction with graphs
Page 8
WOLFGANG AiGNER networks & hierarchies 32
Large graph
Image by C. Ware from [Görg et al., 2007]
3200 nodes
force-directed layout
WOLFGANG AiGNER networks & hierarchies 33
Size / complexity
high number of nodes & edges
reducing complexity
edges - link reduction
e.g., visualizing only the edges that have weights above a certain
value
eliminate redundant edges and maintain the most signifikant links
minimum spanning trees (MST)
pathfinder network scaling (PFNET)
nodes - node reduction
clustering
preservation of global structure
WOLFGANG AiGNER networks & hierarchies 34
Node-only
WOLFGANG AiGNER networks & hierarchies 35
Link-only
Page 9
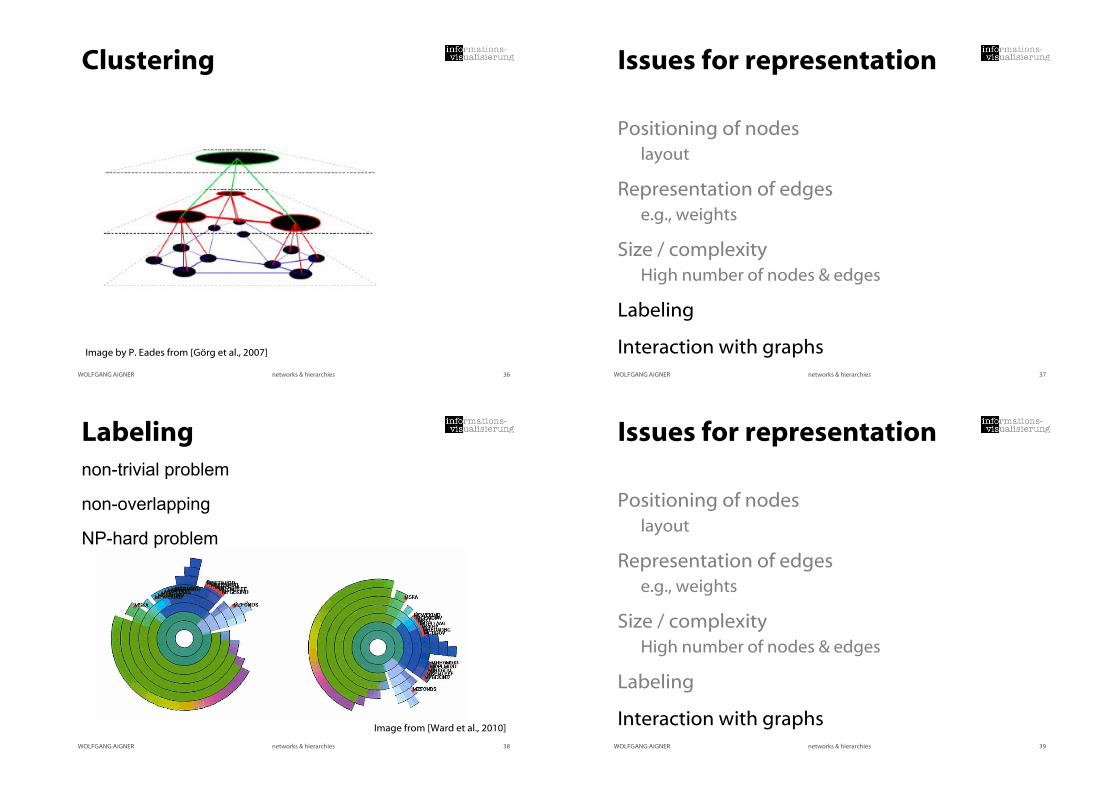
WOLFGANG AiGNER networks & hierarchies 36
Clustering
Image by P. Eades from [Görg et al., 2007]
WOLFGANG AiGNER networks & hierarchies 37
Issues for representation
Positioning of nodes
layout
Representation of edgese.g., weights
Size / complexity
High number of nodes & edges
Labeling
Interaction with graphs
WOLFGANG AiGNER networks & hierarchies 38
Labeling
non-trivial problem
non-overlapping
NP-hard problem
Image from [Ward et al., 2010]
WOLFGANG AiGNER networks & hierarchies 39
Issues for representation
Positioning of nodes
layout
Representation of edgese.g., weights
Size / complexity
High number of nodes & edges
Labeling
Interaction with graphs
Page 10
WOLFGANG AiGNER networks & hierarchies 40
Interaction with graphs
move nodes
zoom & pan
hide or show edges
selection
focus+contextVideo
CGV
WOLFGANG AiGNER networks & hierarchies 41
Part B.2visualizing hierarchies
WOLFGANG AiGNER networks & hierarchies 42
Visual Encodings for Hierarchies
indentation
representation of hierarchy level via indentation
focus on linear structure
pros: well-known, simple, text-based
cons: aspect ratio
connection / node-link
convention: root mostly on top, leafs on bottom
pros: popular, well-known
cons: scales badly (space usage, aspect ratio)
containment
summed values
propagation through hierarchy
space-filling graphs
pros: no occlusion, no edge crossing
cons: labeling, reading order
Dept-A
Dept-B
Dept-C
Dept-D
Dept-E
Dept-F
Center-3
Center-2
Center-1
Company-X
WOLFGANG AiGNER networks & hierarchies 43
Interaction
why?aspect ratio
large information space
do not fit onto display space
Problem: large structures that don't fit on a singleview/screen
expand / collapse
navigate
focus + contextsee upcoming lecture for details
Video
CGV
Page 11
WOLFGANG AiGNER networks & hierarchies 44
Demo application: HierarchicalVisualization System (HVS)
Acedemic prototype
Graz University of Technology,Institute for Information Systemsand Computer Media (IICM)
Lead by Prof. Keith Andrews
Extensible InfoVis toolkit forvisualizing hierarchicallystructured data
Visualizations provided:
Tree View
Information Pyramids
Hyperbolic Tree
Magic Eye
InfoLens
TreeMaps
Sunburst
[Andrews, 2005]
Demo(HVS)
WOLFGANG AiGNER networks & hierarchies 45
Indented Listsrepresentation of hierarchy
level via indentation
focus on linear structure
WOLFGANG AiGNER networks & hierarchies 46
SpaceTree / DOI Treehttp://www.cs.umd.edu/hcil/spacetree/
[Plaisant et al., 2002]
[Heer and Card, 2004]
http://www.cs.umd.edu/hcil/spacetree/
http://prefuse.org/gallery/treeview/
Demo
WOLFGANG AiGNER networks & hierarchies 47
Cone Trees[Robertson, Mackinlay, Card 1991]
Page 12
WOLFGANG AiGNER networks & hierarchies 48
Cone Trees vs. Cam TreesVertical (Cone Tree) vs.
Horizontal (Cam Tree)
Shadows provide 2D structure
Video
WOLFGANG AiGNER networks & hierarchies 49
Cone Trees
Important:
Interaction!
[Robertson, Mackinlay, Card 1991]
WOLFGANG AiGNER networks & hierarchies 50
Starlight – File System[Pacific Northwest National Laboratory – USA]
WOLFGANG AiGNER networks & hierarchies 51
[Herman, Melancon, and Marshall, 2000]
Balloon Trees
Flattened cone trees
Page 13
WOLFGANG AiGNER networks & hierarchies 52
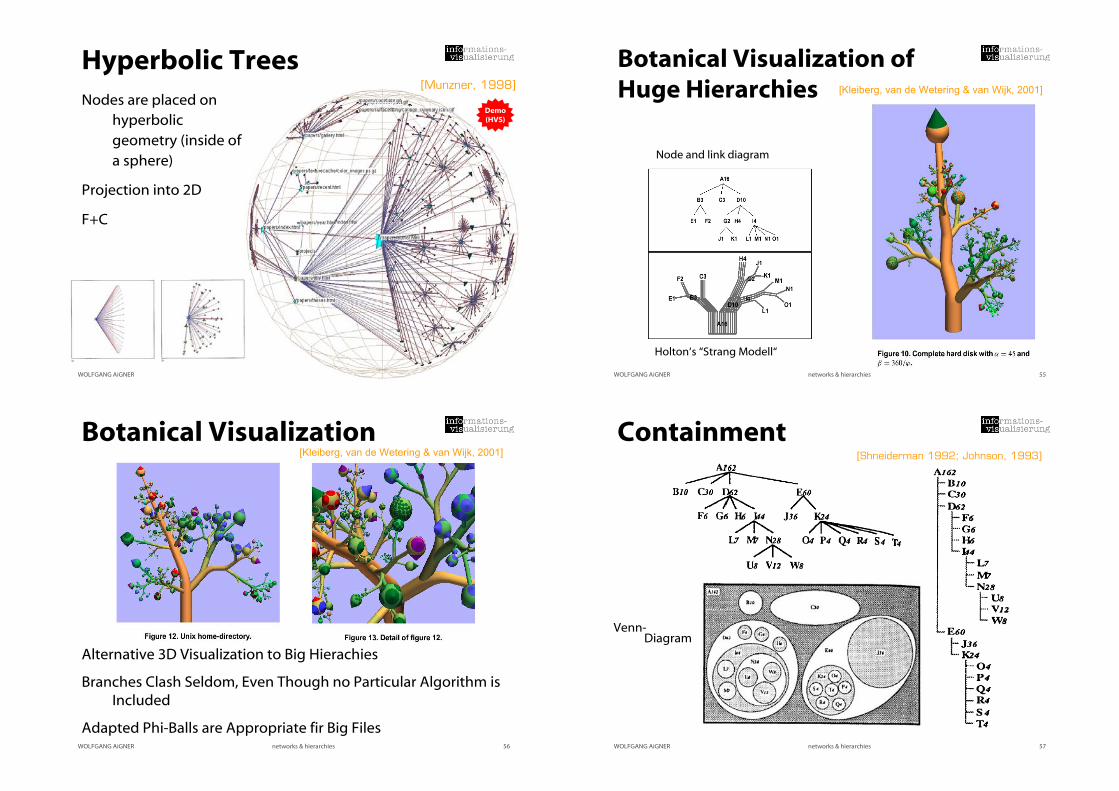
Hyperbolic Trees
Nodes are placed on
hyperbolic
geometry (inside of
a sphere)
Projection into 2D
F+C
[Munzner, 1998]
Demo(HVS)
WOLFGANG AiGNER networks & hierarchies 55
Botanical Visualization ofHuge Hierarchies
Node and link diagram
[Kleiberg, van de Wetering & van Wijk, 2001]
Holton‘s “Strang Modell“
WOLFGANG AiGNER networks & hierarchies 56
Botanical Visualization[Kleiberg, van de Wetering & van Wijk, 2001]
Alternative 3D Visualization to Big Hierachies
Branches Clash Seldom, Even Though no Particular Algorithm isIncluded
Adapted Phi-Balls are Appropriate fir Big FilesWOLFGANG AiGNER networks & hierarchies 57
Containment
Venn-Diagram
[Shneiderman 1992; Johnson, 1993]
Page 14
WOLFGANG AiGNER networks & hierarchies 61
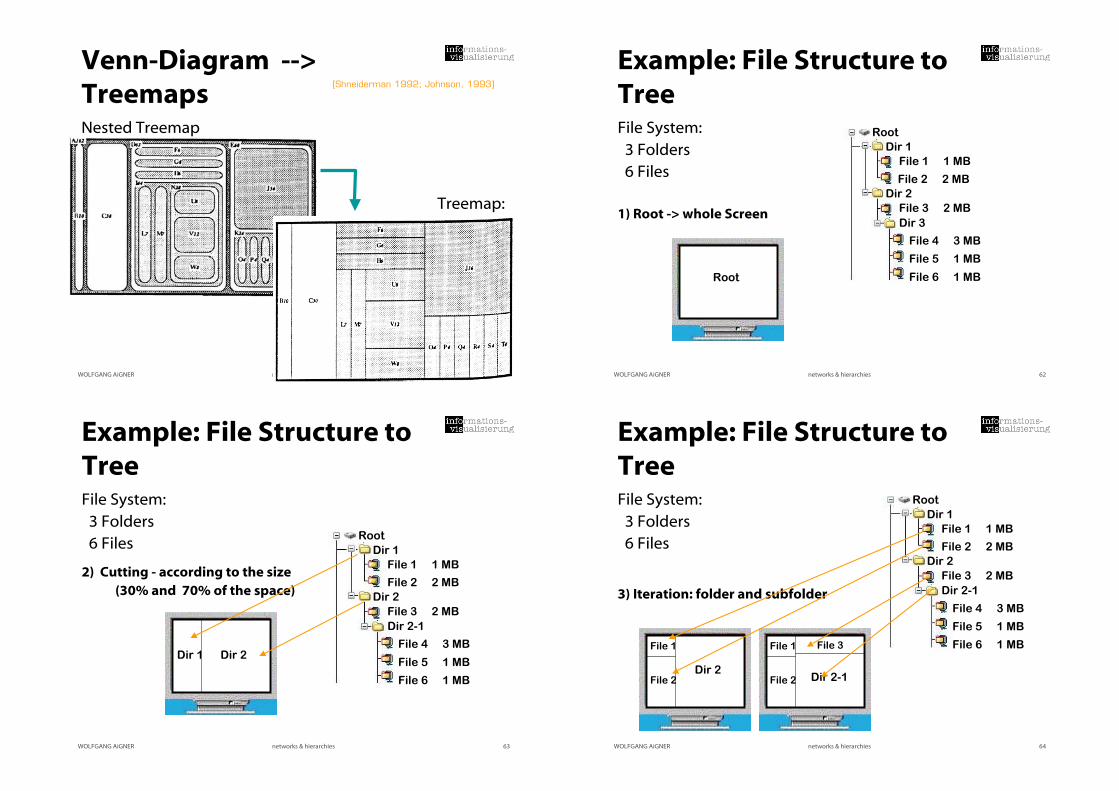
Venn-Diagram -->TreemapsNested Treemap
Treemap:
[Shneiderman 1992; Johnson, 1993]
WOLFGANG AiGNER networks & hierarchies 62
Example: File Structure toTreeFile System:
3 Folders
6 Files
1) Root -> whole Screen
RootRoot
Root
Dir 1
File 1 1 MB
File 2 2 MB
Dir 2
File 3 2 MB
File 4 3 MB
File 5 1 MB
File 6 1 MB
Dir 3
WOLFGANG AiGNER networks & hierarchies 63
Example: File Structure toTreeFile System:
3 Folders
6 Files
2) Cutting - according to the size
(30% and 70% of the space)
Root
Dir 1
File 1 1 MB
File 2 2 MB
Dir 2
File 3 2 MB
File 4 3 MB
File 5 1 MB
File 6 1 MB
Dir 2-1
RootDir 1 Dir 2
WOLFGANG AiGNER networks & hierarchies 64
Example: File Structure toTreeFile System:
3 Folders
6 Files
3) Iteration: folder and subfolder
Root
Dir 1
File 1 1 MB
File 2 2 MB
Dir 2
File 3 2 MB
File 4 3 MB
File 5 1 MB
File 6 1 MB
Dir 2-1
Root
File 1
File 2
Dir 2 Root
File 1
File 2 Dir 2-1
File 3
Page 15
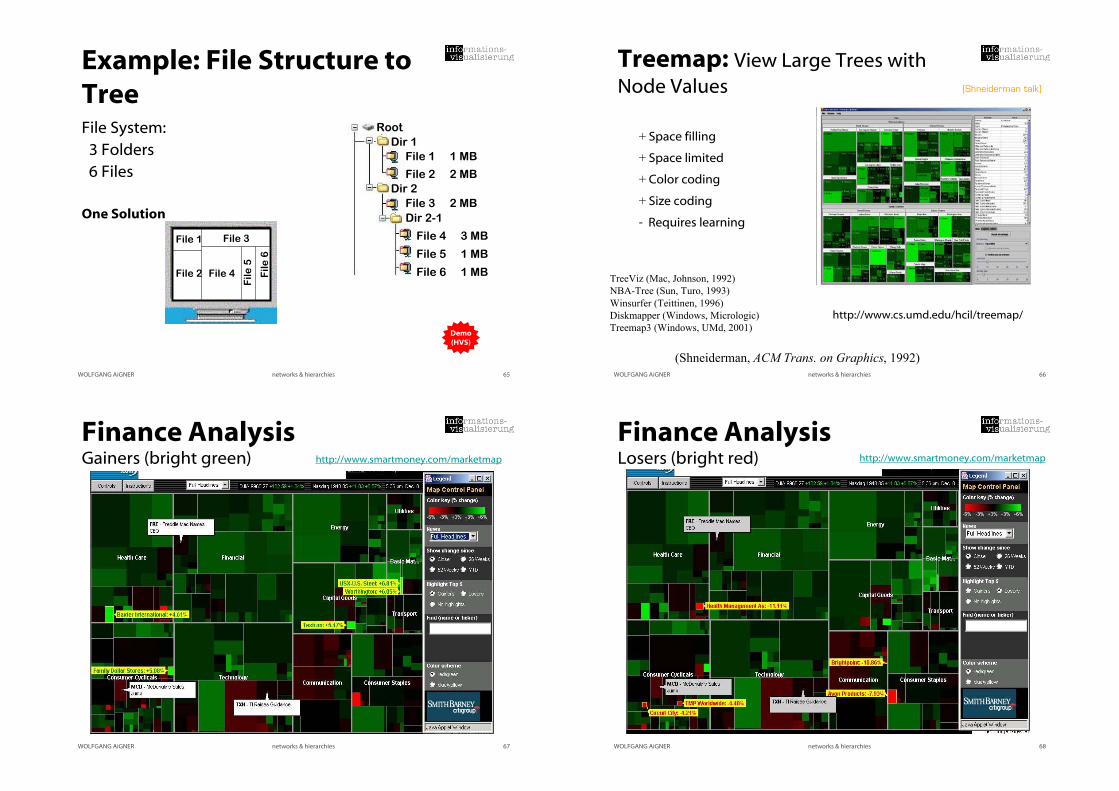
WOLFGANG AiGNER networks & hierarchies 65
Example: File Structure toTreeFile System:
3 Folders
6 Files
One Solution
Root
Dir 1
File 1 1 MB
File 2 2 MB
Dir 2
File 3 2 MB
File 4 3 MB
File 5 1 MB
File 6 1 MB
Dir 2-1
Root
File 1
File 2
File 3
File 4
Fil
e 5
Fil
e 6
Demo(HVS)
WOLFGANG AiGNER networks & hierarchies 66
+ Space filling
+ Space limited
+ Color coding
+ Size coding
- Requires learning
(Shneiderman, ACM Trans. on Graphics, 1992)
TreeViz (Mac, Johnson, 1992)
NBA-Tree (Sun, Turo, 1993)
Winsurfer (Teittinen, 1996)
Diskmapper (Windows, Micrologic)
Treemap3 (Windows, UMd, 2001)
[Shneiderman talk]
Treemap: View Large Trees with
Node Values
http://www.cs.umd.edu/hcil/treemap/
WOLFGANG AiGNER networks & hierarchies 67
Finance Analysishttp://www.smartmoney.comGainers (bright green) http://www.smartmoney.com/marketmap
WOLFGANG AiGNER networks & hierarchies 68
Finance Analysishttp://www.smartmoney.comLosers (bright red) http://www.smartmoney.com/marketmap
Page 16
WOLFGANG AiGNER networks & hierarchies 72
www.hivegroup.com
Treemap: Newsmaphttp://newsmap.jp
WOLFGANG AiGNER networks & hierarchies 73
Map of the market [Wattenberg,
smartmoney.com]
TreeMaps Summary
Turning a tree into a planar space-filling map
Capacity to see tens of thousands of nodes in a fixedspace and find large areas or duplicate directoriesis very powerful
Treemap algorithmsBinaryTree
Ordered
SliceAndDice
Squarified
Strip
Beamtree
WOLFGANG AiGNER networks & hierarchies 74
Icicle Trees
Tree levels side by
side horizontal /
vertical
Subdivision by size
Randelshofer, 2007. http://www.randelshofer.ch/oop/treeviz/index.html
Demo
WOLFGANG AiGNER networks & hierarchies 75
Sunburst Tree
Radial version of icicle
trees
Interaction facilities to
navigate / zoom
[Stasko]
Randelshofer, 2007. http://www.randelshofer.ch/oop/treeviz/index.html
Demo Video
Page 17
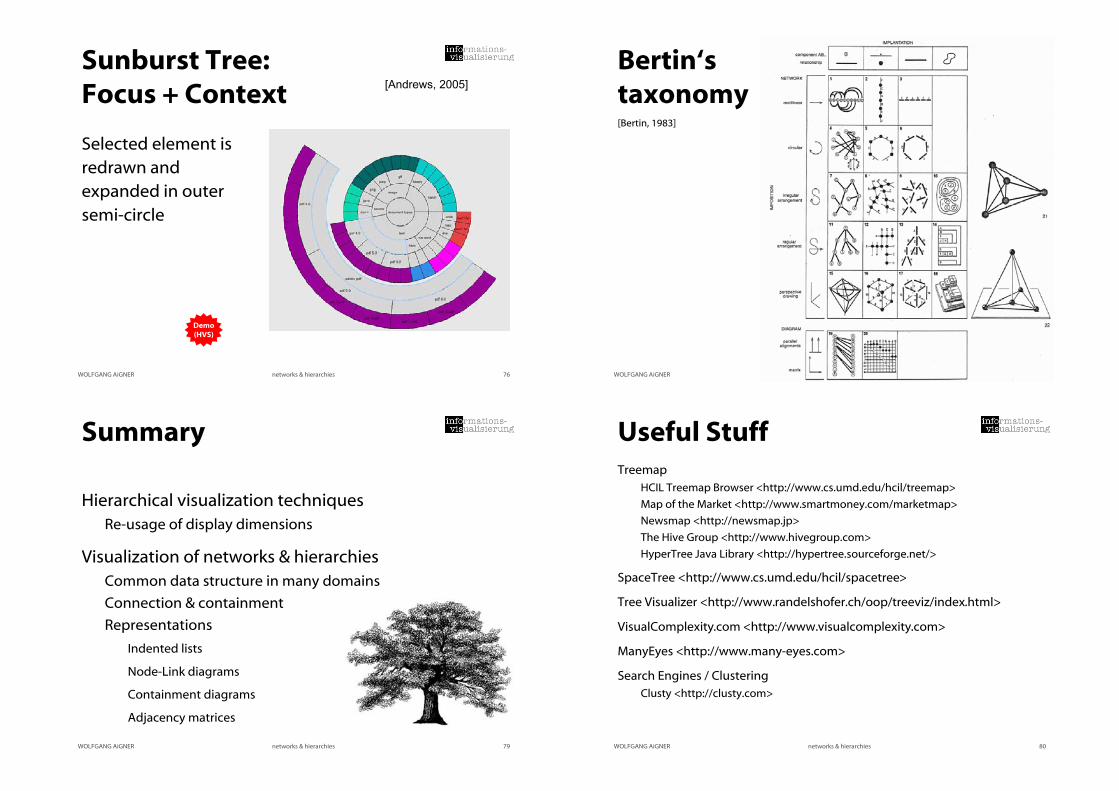
WOLFGANG AiGNER networks & hierarchies 76
Sunburst Tree:Focus + Context
Selected element is
redrawn and
expanded in outer
semi-circle
[Andrews, 2005]
Demo(HVS)
WOLFGANG AiGNER networks & hierarchies 78
Bertin‘staxonomy[Bertin, 1983]
WOLFGANG AiGNER networks & hierarchies 79
Summary
Hierarchical visualization techniques
Re-usage of display dimensions
Visualization of networks & hierarchies
Common data structure in many domains
Connection & containment
Representations
Indented lists
Node-Link diagrams
Containment diagrams
Adjacency matrices
WOLFGANG AiGNER networks & hierarchies 80
Useful StuffTreemap
HCIL Treemap Browser <http://www.cs.umd.edu/hcil/treemap>
Map of the Market <http://www.smartmoney.com/marketmap>
Newsmap <http://newsmap.jp>
The Hive Group <http://www.hivegroup.com>
HyperTree Java Library <http://hypertree.sourceforge.net/>
SpaceTree <http://www.cs.umd.edu/hcil/spacetree>
Tree Visualizer <http://www.randelshofer.ch/oop/treeviz/index.html>
VisualComplexity.com <http://www.visualcomplexity.com>
ManyEyes <http://www.many-eyes.com>
Search Engines / Clustering
Clusty <http://clusty.com>
Page 18
WOLFGANG AiGNER networks & hierarchies 81
Acknowledgements
Thanks to Silvia Miksch and Paolo Federico whose slides form
the basis of this presentation.
Ideas have been taken from Katy Börner’s, Jeff Heer’s, and Jock
Mackinlay’s presentation slides of their visualization
classes.
WOLFGANG AiGNER networks & hierarchies 82
Literature[Görg et al., 2007] Görg, C. and Pohl, M. and Qeli, E. and Xu, K.: Visual Representations,
in Kerren, A., Ebert, A. and Meyer J. (Eds.): Human-centered Visualization
Environments, pp. 189-224, volume 4417 of LNCS Tutorial, Springer, 2007.
[Mazza, 2009] Mazza, R.: Introduction to Information Visualization, Chapter 5
(Networks and Hierarchies), pp. 63-89, Springer-Verlag, London, 2009.
[Ward et al., 2010] Ward, M. and Grinstein, G. and Keim, D.: Interactive Data
Visualization: Foundations, Techniques, and Application, Chapter 8
(Visualization Techniques for Trees, Graphs, and Networks), pp. 271-290, A K
Peters, 2010.