268
Information Qimonda AG Annual Report 2006 Global Reports LLC

Information
Qimonda AGAnnual Report 2006
Global Reports LLC

Financial Key Figures
Past performance does not guarantee future results.* EBIT is a non-GAAP financial measure. A reconciliation of EBIT to net income appears in Qimonda’s 2006 Form 20-F.** This Annual Report to Shareholders contains forward-looking statements, and actual results could differ materially. Risk factors that could cause actual results to differ are set forth in the “Risk Factors”
section and throughout Qimonda’s 2006 Form 20-F. Financial information as of dates before and for periods beginning before May 1, 2006 are derived from Qimonda’s combined financial statementsprepared in connection with its carve-out from Infineon Technologies AG, which occurred on that date.
We started operating as an independent company, Qimonda AG, on May 1, 2006 after our carve-out from
Infineon Technologies AG. On August 9, 2006 we went public on the NYSE under the symbol “QI”. We concluded
our 2006 financial year with record revenue of €3.8 billion, up 35% from our 2005 financial year and we
recorded net income of €74 million. In the 2006 financial year, our earnings before interest and tax (EBIT*) of
€213 million were the highest since the 2000 financial year, and marked the fourth year in a row where we
recorded positive EBIT. We improved revenue and earnings from quarter to quarter throughout the 2006 finan-
cial year as we grew our DRAM bit-shipments and successfully diversified our product portfolio towards infra-
structure, graphics and consumer applications. In the first nine months of the 2006 calendar year we were the
second largest DRAM supplier in terms of revenue.**
0
500
1000
1500
2000
2500
3000
3500
4000
4500Net Sales in million Euro
2544
FY 03
3008
FY 04
2825
FY 05
3815
FY 060
50
100
150
200
250
15
FY 03
162
FY 04
111
FY 05
213
FY 06
EBIT* in million Euro
Capex and Long-term Investments in million Euro
Long-term Investments Capital Expenditures
598
FY 03
1,120
FY 04
1,009
FY 05
689
FY 060
200
400
600
800
1000
1200
0
50
100
150
200
250
300
350
400
450
500
R&D in million Euro
298
FY 03
347
FY 04
390
FY 05
433
FY 06
FY 04 FY 05 FY 06FY 04 FY 05 FY 06
Net Sales by Region Headcount by Region
0 %
20 %
40 %
60 %
80 %
100 %
0 %
20 %
40 %
60 %
80 %
100 %Headcount 11,058 9,606 11,802
2 Annual Report 2006
Global Reports LLC

Dear shareholders,This is our first letter to you as shareholders of
Qimonda, and I would like to thank you for your
interest in and support for our young company.
Qimonda went public on the New York Stock
Exchange on August 9, 2006 and has made
tremendous progress in its first financial year.
We were able to achieve a record performance
by improving our net sales to €3.8 billion in the
2006 financial year, a strong increase of 35 %
compared to the previous year. We recorded a strong consolidated net income of
€74 million and significantly improved our consolidated EBIT (earnings before
interest and tax) to €213 million. With this strong performance we achieved a
top two position in the DRAM market (by revenues) and also made much faster
progress in our product diversification than originally planned.
Our product diversification into the non-PC arena is a cornerstone of Qimonda’s
strategy to further improve our results and achieve sustained profitability over the
DRAM cycle. This had a substantial impact on our positive sales and earnings
performance in the 2006 financial year. We improved our share of bit-shipments
into non-PC markets such as server, graphics, consumer and mobile communication
applications to significantly above 50 % in the last quarter of our 2006 financial
year. In addition, we benefited from the strong overall DRAM demand, in particular
in the second half of the 2006 financial year.
Let me share with you a few commercial, technology and manufacturing highlights
that were key to the successful execution of our product diversification strategy:
Qimonda has significantly expanded its graphics DRAM business in the 2006 financial
year. We are now a key supplier for the game console market and deliver high-end
graphics RAM to all three major game console manufacturers: Microsoft, Nintendo
and Sony.
We have further strengthened our leading market position in the infrastructure
and high-end computing arena. Today we provide the most advanced Fully Buffered
and Very Low Profile dual inline memory modules (DIMMs) to the leading server
manufacturers. And we are currently the only DRAM supplier that can provide a
fully integrated memory module with an Advanced Memory Buffer (AMB) for high
performance server applications.
Qimonda has developed a unique Power-Saving Trench Technology that has enabled
us to achieve important design wins in the infrastructure, mobile communication
and consumer space where power consumption and heat dissipation are critical
factors for servers, mobile phones, digital music players and digital TVs. For the
second time we won Sun’s Best in Class Supplier Award for Delivering Superior
Quality and Value which shows our strong commitment to quality, reliability and
customer service.
We have further strengthened our technology leadership with the early validation
of our 75 nm platform at Intel and at some of our customers. This is an excellent
basis for the early introduction of next-generation, high-performance DRAM prod-
ucts for infrastructure and graphics applications. Additionally, we have in place a
comprehensive trench manufacturing roadmap down to 48 nm process technologies
with special platforms optimizing power consumption, speed or cost to be able to
serve the future needs of our customers in their respective target markets.
In addition, Qimonda has increased its share of manufacturing capacities on
300mm wafers to more than 70% by the end of the 2006 financial year, based
on our access to five 300mm manufacturing locations worldwide. We have devel-
oped a cost-efficient technology shrink of our 90 nm DRAM trench technology with
feature sizes of 80 nm to improve productivity and help reduce our manufacturing
costs even further.
Last but not least we are very pleased with the progress of our manufacturing
and technology development partners. This enables us to increase our capacities
and manage the conversion to next generation technologies in a more capital-effi-
cient manner.
Your Management Board has chosen Return on Capital Employed (RoCE) as the
major parameter to measure the company’s business success. RoCE expresses our
after-tax profitability relative to the capital we use in our business. Our goal is to
achieve a sustainable business model within the DRAM industry and to earn more
than our cost of capital.
Our first financial year was a great success but is only one milestone in our vision
to become the world’s leading creative memory company. At Qimonda, we are
creative, passionate and fast. Creative means: we challenge existing rules and
boundaries to enable the future. Passionate means: we love to explore ideas and
work very hard to make them happen. And fast means: we anticipate opportunities
and execute efficiently.
We are convinced that our business strategy as a clearly focused memory player
will enable us to succeed in the growing and attractive memory market. Memory
has truly developed into a key enabler for today’s and tomorrow’s consumer and
communication applications. Memory is an essential prerequisite to enabling indi-
vidual mobility and at the same time it is fulfilling ever more demanding perform-
ance and power requirements in the PC and infrastructure segments.
We are confident that based on our long-standing DRAM expertise, leadership in
300mm and unique Power-Saving Trench Technology we are on the right path to
improve our returns throughout the DRAM cycle. At Qimonda we are all dedicated
to execute on our vision to become the world’s leading creative memory company
and thus create value for you as our shareholders.
Sincerely,
Kin Wah Loh
President and Chief Executive Officer
Letter to the Shareholders
Annual Report 2006 3
Global Reports LLC

Key Areas of Activity of the Supervisory Board s Appointment of Management Board members
s Initial Public Offering at the NYSE
s Development of business strategy
Appointment of Management Board MembersThe Supervisory Board concerned itself intensely with the appointment of Man-
agement Board members after the contribution of the memory products segment
by Infineon Technologies AG.
With effect from April 15, 2006 the Supervisory Board appointed Mr. Kin Wah Loh,
Dr. Michael Majerus and Mr. Thomas Seifert as Management Board members and
appointed Mr. Kin Wah Loh as Chairman of the Management Board.
Initial Public Offering at the NYSEThe Supervisory Board was informed by the Management Board in a timely and
detailed manner about the preparations for and the planned implementation of the
flotation of stocks on the New York Stock Exchange. The planned procedure was
discussed with the Management Board and the decisions necessary for ensuring
a smooth implementation were taken.
The Supervisory Board was very pleased to follow the rapid progress of this impor-
tant project for what is still a new company. The crucial phase of marketing the
company to the investors took place in a difficult stock market trading environment.
The Management Board of Qimonda generated sufficient interest in the company
in the capital market thanks to its significant commitment during the roadshow,
and together with the Management Board we took the necessary decisions to
complete the flotation. We are delighted that as a result of this flotation Qimonda
was able to expand its shareholder structure in a very robust way, particularly in
the USA.
Development of Company StrategyA further focus of the meetings between the Supervisory Board and the Manage-
ment Board was the development of the company strategy. In the course of in-
depth discussions with the Management Board, the Supervisory Board addressed
the key issues of market and customer orientation, of product diversification,
development of technology, and further development of partnerships.
The Supervisory Board is very pleased with the significant progress that Qimonda
made over the last financial year in the area of product diversification. In particular
we would like to highlight the successful entry into and the establishment of a
leading position in the memory market for the latest generation of games consoles.
Also worth mentioning is the increase in the share of business in the attractive
server market and the building up of supplier relations in the entertainment elec-
tronics market. In the area of technology development, Qimonda, together with its
development partner Nanya, was able to launch the next generation of memory
technologies with a feature size of 75 nm. The Supervisory Board was informed
by the Management Board about further plans for technology development. The
Supervisory Board and the Management Board agree that the company must push
ahead with its efforts in terms of increasing productivity without delay in order
to further improve its competitive position.
Dear Shareholders,With this report, the Supervisory Board would like to inform you about the fulfilment of its duties during the recent financial year.
In the course of regular meetings the Management Board provided the Supervisory Board with comprehensive information about
the development of business, the economic situation of the company and the financial and investment planning. The Super-
visory Board discussed the information provided by the Management Board in detail during its meetings. The Management Board
also gave written and verbal reports about events of particular significance, especially with respect to the Initial Public Offering
at the NYSE that took place on August 9, 2006. In addition, the Chairman of the Supervisory Board was kept informed by the
Management Board about key developments and decisions within the company in the course of individual meetings. The Super-
visory Board regularly monitored the activities of the Management Board and provided consulting support to the Management
Board. For this purpose it also thoroughly examined the reports of the internal auditing department. All matters that required
the approval of the Supervisory Board were duly submitted to it.
Report by the Supervisory Board to theGeneral Meeting of Shareholders
Peter J. Fischl
Chairman of the Supervisory Board of Qimonda AG
4 Annual Report 2006
Global Reports LLC

There was a very sharp fall in prices for Flash memory since the beginning of the
2006 calendar year. In view of the low prices for Flash memory the Management
Board decided to stop production of these items as soon as possible and to use
the capacities released through that step for the production of DRAM memory,
which is currently more profitable. The Supervisory Board supports this decision
by the Management Board as well as the resolution to continue the development
efforts in the area of non-volatile memory. We agree with the view of market
researchers that this fiercely contested market segment offers great growth
potential which can only be realised by having a competitive technology platform
and the right choice of product solutions.
Furthermore, our discussions centred on the expected impact of the business and
capacity strategy on the medium-term planning of the finance and investment
budget.
Overall, we totally support the Management Board’s strategy of increasing the
company’s profitability over the business cycles.
Corporate GovernanceThe Supervisory Board is convinced that good corporate governance is a key basis
for the company’s success and therefore examined German, US and international
corporate governance rules and their implementation within the company. The
rules of procedure for the Supervisory Board and the Investment, Finance, and
Audit Committee as enacted by the Supervisory Board, as well as the rules of pro-
cedure for the Management Board as approved by the Supervisory Board comply
with all requirements in terms of good corporate governance. The cooperation
with the Management Board and within the Supervisory Board is seen as posi-
tive. The Supervisory Board issued the Declaration of Compliance 2006 as per §
161 of the German Stock Corporation Act (AktG) in November 2006.
No conflicts of interest have arisen with individual members of the Supervisory
Board or its committees.
Meetings of the Supervisory Board and the CommitteesIn the year under review two regular meetings of the Supervisory Board were held.
The Presidential Committee did not meet and instead passed resolutions by
written consent.
The Investment, Finance and Audit Committee met once in the year under review.
As the pre-audit of the annual financial statements and the discussion of the audit
report with the auditor only took place in the ongoing financial year for the year
under review, the focus of its activity was the review of the financial and invest-
ment planning.
The recently formed Technology Committee has not had a meeting yet.
Financial StatementsThe Qimonda financial statements were audited by KPMG Deutsche Treuhand-
Gesellschaft AG Wirtschaftsprüfungsgesellschaft, Berlin and Frankfurt/Main in the
year under review. KPMG audited the annual financial statements of Qimonda AG
prepared according to HGB [German Commercial Code] and the combined and con-
solidated financial statements of the Qimonda Group prepared according to US-GAAP
for the year ended September 30, 2006, as well as the management report of
Qimonda AG and gave an unqualified auditor’s opinion. We have also reviewed
these documents ourselves. KPMG also confirmed that the combined and consoli-
dated financial statements were produced in accordance with US-GAAP and that
under § 291 HGB no combined and consolidated group financial statements had
to be drawn up, neither in accordance with HGB, nor with IAS rules. The report by
KPMG concerning the audit of the financial statements of Qimonda AG prepared
according to HGB had been submitted to the Supervisory Board in good time and
were presented and commented on by the auditor and discussed in detail in the
meeting of the Investment, Finance and Audit Committee on November 14, 2006
and were then also discussed in our financial review meeting on the same day in
the presence of the auditor. In these meetings the Management Board also gave
a detailed report concerning the scope, key points and costs of the audit.
The Supervisory Board had no objections, approved the results of the audit and
therefore approved the annual financial statements of Qimonda AG prepared
according to HGB and the annual combined and consolidated financial statements
of the Qimonda Group prepared according to US-GAAP. The annual financial state-
ments are therefore confirmed.
Annual Report 2006 5
Global Reports LLC
Report on Relation to Infineon Technologies AG as ControllingShareholderThe Investment, Finance and Audit Committee and the Supervisory Board thor-
oughly examined the Report on Relation to Infineon Technologies AG as Controlling
Shareholder in accordance with § 312 of the German Stock Corporation Act (AktG)
concerning the relations between the company and Infineon Technologies AG and
affiliated companies as well as the audit report of KPMG in this respect in the
presence of the auditor. This did not lead to any reservations.
KPMG issued the following opinion on the report in accordance with § 312 AktG:
“In our opinion, based on the audit that we were commissioned to conduct, we
confirm that the factual information contained in the report is correct, that in
respect of the legal transactions detailed in the report the consideration by the
company was not unacceptably high, or that any disadvantages have been com-
pensated, and that in respect of the measures detailed in the report there are no
grounds for a significantly different assessment from that given by the
Management Board.”
The final results of our audit have not led to any reservations in respect of
the declaration by the Management Board about the relations with Infineon
Technologies AG and affiliated companies contained given at the end of the
report .
Formation of the Supervisory Board and its CommitteesAs a result of the contribution of the memory products segment by Infineon
Technologies AG, the company now has more than 500 employees, which is why
employee representatives must make up one third of the Supervisory Board mem-
bers. After carrying out the relevant status procedure in accordance with § 97 AktG,
the appointment of the former Supervisory Board members Peter J. Fischl,
Michael v. Eickstedt and Michael Ruth ceased at the end of the general meeting
of shareholders on July 14, 2006 pursuant to § 97 para. 2 Sentence 3 AktG.
In the general meeting of shareholders on July 14, 2006 Mr. Peter J. Fischl,
Mr. Richard Previte, Prof. Yoshio Nishi and Michael v. Eickstedt were elected as
shareholders’ representatives on the Supervisory Board.
On July 21, 2006 the Munich District Court appointed Dr. Lothar Armbrecht and
Mr. Johann Grundbacher as representatives of the employees on the Supervisory
Board.
By a resolution adopted by way of circulation procedure dated July 25, 2006
Mr. Peter J. Fischl was elected as chairman and Mr. Richard Previte as deputy
chairman of the Supervisory Board.
Under the rules of procedure of the Supervisory Board, the chairman of the
Supervisory Board and his deputy belong to the Presidential Committee of the
Supervisory Board. Mr. Michael v. Eickstedt was elected as a further member of
the Presidential Committee.
Again, under the rules of procedure of the Supervisory Board, the chairman of the
Supervisory Board belongs to the Investment, Finance and Audit Committee. As
additional members, the Supervisory Board elected Mr. Richard Previte as Super-
visory Board member for the shareholders and Dr. Lothar Armbrecht as Supervisory
Board member for the employees.
The Supervisory Board also established a Technology Committee, which deals with
the company’s strategic and technological policy, and elected Prof. Yoshio Nishi,
Mr. Peter J. Fischl and Mr. Johann Grundbacher as members of this committee.
The Supervisory Board would like to thank the Management Board and all em-
ployees for their commitment and performance over the last financial year. The
Supervisory Board would also like to thank all members of the staff committees
for their constructive cooperation.
Munich, November 2006
For the Supervisory Board
Peter J. Fischl
Chairman of the Supervisory Board
6 Annual Report 2006
Global Reports LLC

Annual Report 2006 7
Type of SharesOrdinary registered shares with a notional value of € 2.00 each, are traded in the form of
American Depositary Shares, (ADS:shares = 1:1). The notional value can be determined by
dividing the share capital amount by the number of shares outstanding.
Share Price Development Since IPO:Investor Information:
Please visit our website www.qimonda.com for more information
about our company and our products. Our investor relations web-
pages include useful information about future events, financial
reports and SEC-Filings, recent presentations and webcasts as well
as Corporate Governance at Qimonda AG. For more information,
please contact our investor relations department at
12,00
13,00
14,00
15,00
16,00
17,00
18,00
09.08
.2006
16.08
.2006
23.08
.2006
30.08
.2006
06.09
.2006
13.09
.2006
20.09
.2006
27.09
.2006
04.10
.2006
11.10
.2006
18.10
.2006
25.10
.2006
01.11
.2006
08.11
.2006
15.11
.2006
22.11
.2006
11.12
.2006
Qimonda Stock
Shareholder structure after the IPO:
Total number of shares: 342,000,000
14,1%
85,9%
Infineon
Freefloat
Share capital:
EUR 684,000,000 (as of 2006-09-30)
Shares outstanding:
342,000,000 (as of 2006-09-30)
Listing:
ADS: New York Stock Exchange (NYSE)
Initial Public Offering (IPO):
August 9, 2006 on the NYSE
IPO price:
USD 13.00 per ADS
Ticker Symbol:
QI
Global Reports LLC

Sales offices
Europe
Munich – GermanyQimonda AGGustav-Heinemann-Ring 21281739 Munich, GermanyPhone +49 800951951951Fax +49 (89)2349553431
Dublin – IrelandQimonda Sales UK Co. Ltd.69 Fitzwilliam LaneDublin 2, IrelandPhone +353 (1)7999518Fax +353 (1)7999501
Bellshill – ScotlandQimonda Sales UK Co. Ltd.International HouseStanley BoulevardHamilton Intern. Technology ParkHigh Blantyre, UK G72 0BNPhone +44 (0)1698404923Fax +44 (0)1698404921
USA
San Jose – USAQimonda North America Corp.1730 First St, M/S 15302 San Jose, CA 95112, USAPhone +1 (408)5017000Fax +1 (408)5012444
Asia
SingaporeQimonda Asia Pacific Pte. Ltd.8 Kallang SectorSingapore 349282Phone +65 (6876)3888Fax +65 (6876)3688
Seoul – KoreaQimonda Asia Pacific Pte. Ltd.(Korea Office)4th floor, Sigma Tower7-19, Shincheon-dong, Songpa GuSeoul 135-971, KoreaPhone +82 (2)34600899Fax +82 (2)34600901
Shanghai – ChinaQimonda International Trade(Shanghai) Co. Ltd.No. 7 & 8, Lane 647 Song Tao RoadZhang Jiang Hi-Tech ParkShanghai 201203People's Republic of ChinaPhone +86 (21)61019288Fax +86 (21)61019080
Beijing – ChinaQimonda International Trade(Shanghai) Co. Ltd. (Beijing Office)12th Floor, Quantum PlazaNo.27 Zhi Chun RoadHai Dian DistrictBeijing 100083 People’s Republic of ChinaPhone +86 (10)82356118Fax +86 (10)82355474
Shenzhen – ChinaQimonda International Trade(Shanghai) Co. Ltd.(Shenzhen Office)Rm 1502, Block A,Tian An International BuildingRenmin Nan South RoadShenZhen 518001People's Republic of China Phone +86 (755)82289104Fax +86 (755)82280217
Taipei – TaiwanQimonda Taiwan Co. Ltd.12F-1, No. 3-2 Yuan Qu St.Nan Kang Software Park115 Taipei, TaiwanPhone +886 (2)26515000Fax +886 (2)26517527
Japan
Tokyo – JapanQimonda Japan K.K. Gate City Osaki East Tower 23F1-11-2 OsakiShinagawa-kuTokyo 141-0032, JapanPhone: +81 (3)57457444Fax: +81 (3)5745-7499
Osaka – Japan Qimonda Japan K.K. Orix Dojima Building 8F2-1-31 DojimaKita-kuOsaka-shiOsaka-fu 530-0003, JapanPhone: +81 (6)47974460
Representative offices
Europe
Paris Saint-Denis – FranceInfineon TechnologiesFrance S.A.S.39 – 47, Boulevard Ornano93527 Saint-Denis CEDEX 2 FrancePhone +33 (1)48097200Fax +33 (1)48097290
Zurich – SwitzerlandInfineon Technologies Schweiz AGBadenerstrasse 6238048 Zurich, SwitzerlandPhone +41 (1)4978040Fax +41 (1)4978050
Madrid – SpainSiemens S.A. División ComponentesRonda de Europa, 528760 Tres Cantos-Madrid, SpainPhone +34 (91)5147155Fax +34 (91)5147015
Qimonda Offices Worldwide
Global Reports LLC

Qimonda AG Annual Report 2006 on Form 20-F
Rücken
www.qimonda.com
Rücken
Qim
onda
AG –
Ann
ual Re
port
2006
on
Form
20-
F06109_AnnualReport2006_rz 22.11.2006 14:08 Uhr Seite 1
Global Reports LLC

Global Reports LLC

As filed with the Securities and Exchange Commission on November 21, 2006
UNITED STATES SECURITIES AND EXCHANGE COMMISSIONWashington, D.C. 20549
Form 20-F(Mark One)
n REGISTRATION STATEMENT PURSUANT TO SECTION 12(b) OR 12(g) OF THE SECURITIES EXCHANGE ACT OF 1934
OR¥ ANNUAL REPORT PURSUANT TO SECTION 13 OR 15(d)
OF THE SECURITIES EXCHANGE ACT OF 1934For the fiscal year ended September 30, 2006.
ORn TRANSITION REPORT PURSUANT TO SECTION 13 OR 15(d)
OF THE SECURITIES EXCHANGE ACT OF 1934OR
n SHELL COMPANY REPORT PURSUANT TO SECTION 13 OR 15(d)OF THE SECURITIES EXCHANGE ACT OF 1934Date of event requiring this shell company report
For the transition period from to
Commission file number 001-32972
QIMONDA AG(Exact name of Registrant as specified in its charter)
Gustav-Heinemann-Ring 21281739 Munich, Germany°(49)(89) 234-20390
(Address of principal executive offices)
Securities registered or to be registered pursuant to Section 12(b) of the Act.
Title of Each Class: Name of Each Exchange on Which Registered:
American Depositary Shares representing Qimonda AG New York Stock Exchangeordinary shares of no par value
Qimonda AG ordinary shares of no par value New York Stock Exchange** Not for trading, but only in connection with the registration of American Depositary Shares.
Securities registered or to be registered pursuant to Section 12(g) of the Act.None
(Title of class)
Securities for which there is a reporting obligation pursuant to Section 15(d) of the Act.
None
(Title of class)
Indicate the number of outstanding shares of each of the issuer's classes of capital or common stock as of the close of the period covered by the annual report.
As of September 30, 2006, 342,000,000 ordinary shares, of no par value, of Qimonda AG were outstanding.
Indicate by check mark if the registrant is a well-known seasoned issuer, as defined in Rule 405 of the Securities Act.
Yes n No ¥
If this report is an annual or transition report, indicate by check mark if the registrant is not required to file reports pursuant to Section 13 or 15(d) of theSecurities Exchange Act of 1934.
Yes n No ¥
Note Ì Checking the box above will not relieve any registrant required to file reports pursuant to Section 13 or 15(d) of the Securities Exchange Act of 1934from their obligations under those Sections.
Indicate by check mark whether the Registrant (1) has filed all reports required to be filed by Section 13 or 15(d) of the Securities Exchange Act of 1934during the preceding 12 months (or for such shorter period that the registrant was required to file such reports), and (2) has been subject to such filingrequirements for the past 90 days.
Yes ¥ No n Not applicable n.
Indicate by check mark whether the registrant is a large accelerated filer, an accelerated filer, or a non-accelerated filer. See definition of ""accelerated filer andlarge accelerated filer'' in Rule 12b-2 of the Exchange Act. (Check one):
n Large accelerated filer n Accelerated filer ¥ Non-accelerated filer
Indicate by check mark which financial statement item the registrant has elected to follow:
Item 17 n Item 18 ¥
If this is an annual report, indicate by check mark whether the registrant is a shell company (as defined in Rule 12b-2 of the Exchange Act).
Yes n No ¥
(APPLICABLE ONLY TO ISSUERS INVOLVED IN BANKRUPTCY PROCEEDINGS DURING THE PAST FIVE YEARS)
Indicate by check mark whether the registrant has filed all documents and reports required to be filed by Sections 12, 13 or 15(d) of the Securities ExchangeAct of 1934 subsequent to the distribution of securities under a plan confirmed by a court.
Yes n No n
Global Reports LLC

[THIS PAGE INTENTIONALLY LEFT BLANK]
Global Reports LLC

CROSS REFERENCES TO FORM 20-F
Page
PART I:
Item 1: Identity of Directors, Senior Management and Advisers ÏÏÏÏÏÏÏÏÏÏÏÏÏÏÏÏÏÏÏÏÏÏÏÏÏ n/a
Item 2: Offer Statistics and Expected Timetable ÏÏÏÏÏÏÏÏÏÏÏÏÏÏÏÏÏÏÏÏÏÏÏÏÏÏÏÏÏÏÏÏÏÏÏÏÏÏ n/a
Item 3: Key Information ÏÏÏÏÏÏÏÏÏÏÏÏÏÏÏÏÏÏÏÏÏÏÏÏÏÏÏÏÏÏÏÏÏÏÏÏÏÏÏÏÏÏÏÏÏÏÏÏÏÏÏÏÏÏÏÏÏÏ
Selected Financial DataÏÏÏÏÏÏÏÏÏÏÏÏÏÏÏÏÏÏÏÏÏÏÏÏÏÏÏÏÏÏÏÏÏÏÏÏÏÏÏÏÏÏÏÏÏÏÏÏÏÏ 30
Exchange Rate InformationÏÏÏÏÏÏÏÏÏÏÏÏÏÏÏÏÏÏÏÏÏÏÏÏÏÏÏÏÏÏÏÏÏÏÏÏÏÏÏÏÏÏÏÏÏÏÏ 140
Risk Factors ÏÏÏÏÏÏÏÏÏÏÏÏÏÏÏÏÏÏÏÏÏÏÏÏÏÏÏÏÏÏÏÏÏÏÏÏÏÏÏÏÏÏÏÏÏÏÏÏÏÏÏÏÏÏÏÏÏÏÏ 3
Item 4: Information on the Company ÏÏÏÏÏÏÏÏÏÏÏÏÏÏÏÏÏÏÏÏÏÏÏÏÏÏÏÏÏÏÏÏÏÏÏÏÏÏÏÏÏÏÏÏÏÏÏ 2
History and Development of the Company ÏÏÏÏÏÏÏÏÏÏÏÏÏÏÏÏÏÏÏÏÏÏÏÏÏÏÏÏÏÏÏÏÏÏ 81
Business Overview ÏÏÏÏÏÏÏÏÏÏÏÏÏÏÏÏÏÏÏÏÏÏÏÏÏÏÏÏÏÏÏÏÏÏÏÏÏÏÏÏÏÏÏÏÏÏÏÏÏÏÏÏÏÏ 78
Organizational Structure ÏÏÏÏÏÏÏÏÏÏÏÏÏÏÏÏÏÏÏÏÏÏÏÏÏÏÏÏÏÏÏÏÏÏÏÏÏÏÏÏÏÏÏÏÏÏÏÏÏ 81, 139
Property, Plant and EquipmentÏÏÏÏÏÏÏÏÏÏÏÏÏÏÏÏÏÏÏÏÏÏÏÏÏÏÏÏÏÏÏÏÏÏÏÏÏÏÏÏÏÏÏÏ 116
Item 4A Unresolved Staff Comments ÏÏÏÏÏÏÏÏÏÏÏÏÏÏÏÏÏÏÏÏÏÏÏÏÏÏÏÏÏÏÏÏÏÏÏÏÏÏÏÏÏÏÏÏÏÏÏÏ n/a
Item 5: Operating and Financial Review and Prospects ÏÏÏÏÏÏÏÏÏÏÏÏÏÏÏÏÏÏÏÏÏÏÏÏÏÏÏÏÏÏÏÏ 32
Operating Results ÏÏÏÏÏÏÏÏÏÏÏÏÏÏÏÏÏÏÏÏÏÏÏÏÏÏÏÏÏÏÏÏÏÏÏÏÏÏÏÏÏÏÏÏÏÏÏÏÏÏÏÏÏÏÏ 45
Liquidity and Capital ResourcesÏÏÏÏÏÏÏÏÏÏÏÏÏÏÏÏÏÏÏÏÏÏÏÏÏÏÏÏÏÏÏÏÏÏÏÏÏÏÏÏÏÏÏ 56
Research and Development; Patents and Licenses ÏÏÏÏÏÏÏÏÏÏÏÏÏÏÏÏÏÏÏÏÏÏÏÏÏÏÏÏ 90, 102
Trend Information ÏÏÏÏÏÏÏÏÏÏÏÏÏÏÏÏÏÏÏÏÏÏÏÏÏÏÏÏÏÏÏÏÏÏÏÏÏÏÏÏÏÏÏÏÏÏÏÏÏÏÏÏÏÏ 65
Off-Balance Sheet Arrangements ÏÏÏÏÏÏÏÏÏÏÏÏÏÏÏÏÏÏÏÏÏÏÏÏÏÏÏÏÏÏÏÏÏÏÏÏÏÏÏÏÏÏ 65
Contractual Obligations ÏÏÏÏÏÏÏÏÏÏÏÏÏÏÏÏÏÏÏÏÏÏÏÏÏÏÏÏÏÏÏÏÏÏÏÏÏÏÏÏÏÏÏÏÏÏÏÏÏÏ 60
Item 6: Directors, Senior Management and EmployeesÏÏÏÏÏÏÏÏÏÏÏÏÏÏÏÏÏÏÏÏÏÏÏÏÏÏÏÏÏÏÏÏÏ
Directors and Senior Management ÏÏÏÏÏÏÏÏÏÏÏÏÏÏÏÏÏÏÏÏÏÏÏÏÏÏÏÏÏÏÏÏÏÏÏÏÏÏÏÏÏ 117
Compensation ÏÏÏÏÏÏÏÏÏÏÏÏÏÏÏÏÏÏÏÏÏÏÏÏÏÏÏÏÏÏÏÏÏÏÏÏÏÏÏÏÏÏÏÏÏÏÏÏÏÏÏÏÏÏÏÏÏÏ 122
Board Practices ÏÏÏÏÏÏÏÏÏÏÏÏÏÏÏÏÏÏÏÏÏÏÏÏÏÏÏÏÏÏÏÏÏÏÏÏÏÏÏÏÏÏÏÏÏÏÏÏÏÏÏÏÏÏÏÏÏ 118
Employees ÏÏÏÏÏÏÏÏÏÏÏÏÏÏÏÏÏÏÏÏÏÏÏÏÏÏÏÏÏÏÏÏÏÏÏÏÏÏÏÏÏÏÏÏÏÏÏÏÏÏÏÏÏÏÏÏÏÏÏÏÏ 106
Share OwnershipÏÏÏÏÏÏÏÏÏÏÏÏÏÏÏÏÏÏÏÏÏÏÏÏÏÏÏÏÏÏÏÏÏÏÏÏÏÏÏÏÏÏÏÏÏÏÏÏÏÏÏÏÏÏÏÏ 124
Item 7: Major Shareholders and Related Party Transactions ÏÏÏÏÏÏÏÏÏÏÏÏÏÏÏÏÏÏÏÏÏÏÏÏÏÏÏÏ
Major Shareholders ÏÏÏÏÏÏÏÏÏÏÏÏÏÏÏÏÏÏÏÏÏÏÏÏÏÏÏÏÏÏÏÏÏÏÏÏÏÏÏÏÏÏÏÏÏÏÏÏÏÏÏÏÏ 126
Related Party Transactions ÏÏÏÏÏÏÏÏÏÏÏÏÏÏÏÏÏÏÏÏÏÏÏÏÏÏÏÏÏÏÏÏÏÏÏÏÏÏÏÏÏÏÏÏÏÏÏ 127
Item 8: Financial InformationÏÏÏÏÏÏÏÏÏÏÏÏÏÏÏÏÏÏÏÏÏÏÏÏÏÏÏÏÏÏÏÏÏÏÏÏÏÏÏÏÏÏÏÏÏÏÏÏÏÏÏÏÏÏ F-1
Litigation ÏÏÏÏÏÏÏÏÏÏÏÏÏÏÏÏÏÏÏÏÏÏÏÏÏÏÏÏÏÏÏÏÏÏÏÏÏÏÏÏÏÏÏÏÏÏÏÏÏÏÏÏÏÏÏÏÏÏÏÏÏÏ 107
Dividend PolicyÏÏÏÏÏÏÏÏÏÏÏÏÏÏÏÏÏÏÏÏÏÏÏÏÏÏÏÏÏÏÏÏÏÏÏÏÏÏÏÏÏÏÏÏÏÏÏÏÏÏÏÏÏÏÏÏÏ 139
Significant Changes ÏÏÏÏÏÏÏÏÏÏÏÏÏÏÏÏÏÏÏÏÏÏÏÏÏÏÏÏÏÏÏÏÏÏÏÏÏÏÏÏÏÏÏÏÏÏÏÏÏÏÏÏÏ 139
Item 9: The Offer and Listing ÏÏÏÏÏÏÏÏÏÏÏÏÏÏÏÏÏÏÏÏÏÏÏÏÏÏÏÏÏÏÏÏÏÏÏÏÏÏÏÏÏÏÏÏÏÏÏÏÏÏÏÏÏ
Price History of the StockÏÏÏÏÏÏÏÏÏÏÏÏÏÏÏÏÏÏÏÏÏÏÏÏÏÏÏÏÏÏÏÏÏÏÏÏÏÏÏÏÏÏÏÏÏÏÏÏ 140
Markets ÏÏÏÏÏÏÏÏÏÏÏÏÏÏÏÏÏÏÏÏÏÏÏÏÏÏÏÏÏÏÏÏÏÏÏÏÏÏÏÏÏÏÏÏÏÏÏÏÏÏÏÏÏÏÏÏÏÏÏÏÏÏÏ 140
Item 10: Additional InformationÏÏÏÏÏÏÏÏÏÏÏÏÏÏÏÏÏÏÏÏÏÏÏÏÏÏÏÏÏÏÏÏÏÏÏÏÏÏÏÏÏÏÏÏÏÏÏÏÏÏÏÏÏ
Articles of Association ÏÏÏÏÏÏÏÏÏÏÏÏÏÏÏÏÏÏÏÏÏÏÏÏÏÏÏÏÏÏÏÏÏÏÏÏÏÏÏÏÏÏÏÏÏÏÏÏÏÏÏ 135
Material Contracts ÏÏÏÏÏÏÏÏÏÏÏÏÏÏÏÏÏÏÏÏÏÏÏÏÏÏÏÏÏÏÏÏÏÏÏÏÏÏÏÏÏÏÏÏÏÏÏÏÏÏÏÏÏÏ 147
Exchange Controls ÏÏÏÏÏÏÏÏÏÏÏÏÏÏÏÏÏÏÏÏÏÏÏÏÏÏÏÏÏÏÏÏÏÏÏÏÏÏÏÏÏÏÏÏÏÏÏÏÏÏÏÏÏÏ 145
TaxationÏÏÏÏÏÏÏÏÏÏÏÏÏÏÏÏÏÏÏÏÏÏÏÏÏÏÏÏÏÏÏÏÏÏÏÏÏÏÏÏÏÏÏÏÏÏÏÏÏÏÏÏÏÏÏÏÏÏÏÏÏÏÏ 141
Documents on Display ÏÏÏÏÏÏÏÏÏÏÏÏÏÏÏÏÏÏÏÏÏÏÏÏÏÏÏÏÏÏÏÏÏÏÏÏÏÏÏÏÏÏÏÏÏÏÏÏÏÏÏ 145
i
Global Reports LLC

Page
Subsidiary InformationÏÏÏÏÏÏÏÏÏÏÏÏÏÏÏÏÏÏÏÏÏÏÏÏÏÏÏÏÏÏÏÏÏÏÏÏÏÏÏÏÏÏÏÏÏÏÏÏÏÏÏ 139
Item 11: Quantitative and Qualitative Disclosure About Market Risk ÏÏÏÏÏÏÏÏÏÏÏÏÏÏÏÏÏÏÏÏÏ 63
Item 12: Description of Securities Other Than Equity Securities ÏÏÏÏÏÏÏÏÏÏÏÏÏÏÏÏÏÏÏÏÏÏÏÏÏ n/a
PART II:
Item 13: Defaults, Dividend Arrearages and Delinquencies ÏÏÏÏÏÏÏÏÏÏÏÏÏÏÏÏÏÏÏÏÏÏÏÏÏÏÏÏÏÏ none
Item 14: Material Modifications to the Rights of Security Holders and Use of Proceeds ÏÏÏÏÏ 146
Item 15: Controls and Procedures ÏÏÏÏÏÏÏÏÏÏÏÏÏÏÏÏÏÏÏÏÏÏÏÏÏÏÏÏÏÏÏÏÏÏÏÏÏÏÏÏÏÏÏÏÏÏÏÏÏÏÏ 145
Item 16A: Audit Committee Financial Expert ÏÏÏÏÏÏÏÏÏÏÏÏÏÏÏÏÏÏÏÏÏÏÏÏÏÏÏÏÏÏÏÏÏÏÏÏÏÏÏÏÏÏ 146
Item 16B: Code of Ethics ÏÏÏÏÏÏÏÏÏÏÏÏÏÏÏÏÏÏÏÏÏÏÏÏÏÏÏÏÏÏÏÏÏÏÏÏÏÏÏÏÏÏÏÏÏÏÏÏÏÏÏÏÏÏÏÏÏÏÏ 147
Item 16C: Principal Accountant Fees and Services ÏÏÏÏÏÏÏÏÏÏÏÏÏÏÏÏÏÏÏÏÏÏÏÏÏÏÏÏÏÏÏÏÏÏÏÏÏÏ 146
Item 16D: Exemption from the Listing Standards for Audit Committees ÏÏÏÏÏÏÏÏÏÏÏÏÏÏÏÏÏÏÏÏ 147
Item 16E: Purchases of Equity Securities by the Issuer and Affiliated Purchasers ÏÏÏÏÏÏÏÏÏÏÏÏ none
PART III:
Item 18: Financial Statements ÏÏÏÏÏÏÏÏÏÏÏÏÏÏÏÏÏÏÏÏÏÏÏÏÏÏÏÏÏÏÏÏÏÏÏÏÏÏÏÏÏÏÏÏÏÏÏÏÏÏÏÏÏÏ F-1
Item 19: Exhibits (See Exhibit Index) ÏÏÏÏÏÏÏÏÏÏÏÏÏÏÏÏÏÏÏÏÏÏÏÏÏÏÏÏÏÏÏÏÏÏÏÏÏÏÏÏÏÏÏÏÏÏÏ Ì
ii
Global Reports LLC

CONTENT OVERVIEW
Content OverviewÏÏÏÏÏÏÏÏÏÏÏÏÏÏÏÏÏÏÏÏÏÏÏÏÏÏÏÏÏÏÏÏÏÏÏÏÏÏÏÏÏÏÏÏÏÏÏÏÏÏÏÏÏÏÏÏÏÏÏÏÏÏÏÏÏÏÏÏÏÏÏÏÏÏÏÏÏÏÏÏ iii
PRESENTATION OF FINANCIAL AND OTHER INFORMATION ÏÏÏÏÏÏÏÏÏÏÏÏÏÏÏÏÏÏÏÏÏÏÏÏÏÏÏÏÏÏÏÏ 1
Forward-Looking Statements And Market Data ÏÏÏÏÏÏÏÏÏÏÏÏÏÏÏÏÏÏÏÏÏÏÏÏÏÏÏÏÏÏÏÏÏÏÏÏÏÏÏÏÏÏÏÏÏÏÏÏÏÏÏÏ 1
Company Information ÏÏÏÏÏÏÏÏÏÏÏÏÏÏÏÏÏÏÏÏÏÏÏÏÏÏÏÏÏÏÏÏÏÏÏÏÏÏÏÏÏÏÏÏÏÏÏÏÏÏÏÏÏÏÏÏÏÏÏÏÏÏÏÏÏÏÏÏÏÏÏÏÏÏ 2
Use of Non-U.S. GAAP Financial MeasuresÏÏÏÏÏÏÏÏÏÏÏÏÏÏÏÏÏÏÏÏÏÏÏÏÏÏÏÏÏÏÏÏÏÏÏÏÏÏÏÏÏÏÏÏÏÏÏÏÏÏÏÏÏÏÏ 2
RISK FACTORS ÏÏÏÏÏÏÏÏÏÏÏÏÏÏÏÏÏÏÏÏÏÏÏÏÏÏÏÏÏÏÏÏÏÏÏÏÏÏÏÏÏÏÏÏÏÏÏÏÏÏÏÏÏÏÏÏÏÏÏÏÏÏÏÏÏÏÏÏÏÏÏÏÏÏÏÏÏÏÏ 3
Risks related to the semiconductor memory products industryÏÏÏÏÏÏÏÏÏÏÏÏÏÏÏÏÏÏÏÏÏÏÏÏÏÏÏÏÏÏÏÏÏÏÏÏÏÏÏÏÏ 3
Risks related to our operations ÏÏÏÏÏÏÏÏÏÏÏÏÏÏÏÏÏÏÏÏÏÏÏÏÏÏÏÏÏÏÏÏÏÏÏÏÏÏÏÏÏÏÏÏÏÏÏÏÏÏÏÏÏÏÏÏÏÏÏÏÏÏÏÏÏÏÏ 6
Risks related to our carve-out as a stand-alone company and our continuing relationship with Infineon ÏÏÏÏÏÏ 21
Risks related to the securities markets and ownership of our shares or ADSs ÏÏÏÏÏÏÏÏÏÏÏÏÏÏÏÏÏÏÏÏÏÏÏÏÏÏÏÏ 26
SELECTED COMBINED AND CONSOLIDATED FINANCIAL DATA ÏÏÏÏÏÏÏÏÏÏÏÏÏÏÏÏÏÏÏÏÏÏÏÏÏÏÏÏÏ 30
OPERATING AND FINANCIAL REVIEW ÏÏÏÏÏÏÏÏÏÏÏÏÏÏÏÏÏÏÏÏÏÏÏÏÏÏÏÏÏÏÏÏÏÏÏÏÏÏÏÏÏÏÏÏÏÏÏÏÏÏÏÏÏÏÏ 32
Executive SummaryÏÏÏÏÏÏÏÏÏÏÏÏÏÏÏÏÏÏÏÏÏÏÏÏÏÏÏÏÏÏÏÏÏÏÏÏÏÏÏÏÏÏÏÏÏÏÏÏÏÏÏÏÏÏÏÏÏÏÏÏÏÏÏÏÏÏÏÏÏÏÏÏÏÏÏÏ 32
Overview ÏÏÏÏÏÏÏÏÏÏÏÏÏÏÏÏÏÏÏÏÏÏÏÏÏÏÏÏÏÏÏÏÏÏÏÏÏÏÏÏÏÏÏÏÏÏÏÏÏÏÏÏÏÏÏÏÏÏÏÏÏÏÏÏÏÏÏÏÏÏÏÏÏÏÏÏÏÏÏÏÏÏÏÏÏ 33
Factors that Affect our Results of Operations ÏÏÏÏÏÏÏÏÏÏÏÏÏÏÏÏÏÏÏÏÏÏÏÏÏÏÏÏÏÏÏÏÏÏÏÏÏÏÏÏÏÏÏÏÏÏÏÏÏÏÏÏÏÏ 35
Strategic CooperationsÏÏÏÏÏÏÏÏÏÏÏÏÏÏÏÏÏÏÏÏÏÏÏÏÏÏÏÏÏÏÏÏÏÏÏÏÏÏÏÏÏÏÏÏÏÏÏÏÏÏÏÏÏÏÏÏÏÏÏÏÏÏÏÏÏÏÏÏÏÏÏÏÏÏ 37
Critical Accounting Policies ÏÏÏÏÏÏÏÏÏÏÏÏÏÏÏÏÏÏÏÏÏÏÏÏÏÏÏÏÏÏÏÏÏÏÏÏÏÏÏÏÏÏÏÏÏÏÏÏÏÏÏÏÏÏÏÏÏÏÏÏÏÏÏÏÏÏÏÏÏ 39
Results of OperationsÏÏÏÏÏÏÏÏÏÏÏÏÏÏÏÏÏÏÏÏÏÏÏÏÏÏÏÏÏÏÏÏÏÏÏÏÏÏÏÏÏÏÏÏÏÏÏÏÏÏÏÏÏÏÏÏÏÏÏÏÏÏÏÏÏÏÏÏÏÏÏÏÏÏÏ 45
Financial Condition ÏÏÏÏÏÏÏÏÏÏÏÏÏÏÏÏÏÏÏÏÏÏÏÏÏÏÏÏÏÏÏÏÏÏÏÏÏÏÏÏÏÏÏÏÏÏÏÏÏÏÏÏÏÏÏÏÏÏÏÏÏÏÏÏÏÏÏÏÏÏÏÏÏÏÏÏ 56
Liquidity ÏÏÏÏÏÏÏÏÏÏÏÏÏÏÏÏÏÏÏÏÏÏÏÏÏÏÏÏÏÏÏÏÏÏÏÏÏÏÏÏÏÏÏÏÏÏÏÏÏÏÏÏÏÏÏÏÏÏÏÏÏÏÏÏÏÏÏÏÏÏÏÏÏÏÏÏÏÏÏÏÏÏÏÏÏ 56
Capital Requirements ÏÏÏÏÏÏÏÏÏÏÏÏÏÏÏÏÏÏÏÏÏÏÏÏÏÏÏÏÏÏÏÏÏÏÏÏÏÏÏÏÏÏÏÏÏÏÏÏÏÏÏÏÏÏÏÏÏÏÏÏÏÏÏÏÏÏÏÏÏÏÏÏÏÏ 59
Quantitative and Qualitative Disclosure About Market Risk ÏÏÏÏÏÏÏÏÏÏÏÏÏÏÏÏÏÏÏÏÏÏÏÏÏÏÏÏÏÏÏÏÏÏÏÏÏÏÏÏÏÏ 63
Off-Balance Sheet ArrangementsÏÏÏÏÏÏÏÏÏÏÏÏÏÏÏÏÏÏÏÏÏÏÏÏÏÏÏÏÏÏÏÏÏÏÏÏÏÏÏÏÏÏÏÏÏÏÏÏÏÏÏÏÏÏÏÏÏÏÏÏÏÏÏÏÏ 65
Outlook ÏÏÏÏÏÏÏÏÏÏÏÏÏÏÏÏÏÏÏÏÏÏÏÏÏÏÏÏÏÏÏÏÏÏÏÏÏÏÏÏÏÏÏÏÏÏÏÏÏÏÏÏÏÏÏÏÏÏÏÏÏÏÏÏÏÏÏÏÏÏÏÏÏÏÏÏÏÏÏÏÏÏÏÏÏÏ 65
Recent Accounting Pronouncements ÏÏÏÏÏÏÏÏÏÏÏÏÏÏÏÏÏÏÏÏÏÏÏÏÏÏÏÏÏÏÏÏÏÏÏÏÏÏÏÏÏÏÏÏÏÏÏÏÏÏÏÏÏÏÏÏÏÏÏÏÏÏ 66
THE SEMICONDUCTOR MEMORY INDUSTRYÏÏÏÏÏÏÏÏÏÏÏÏÏÏÏÏÏÏÏÏÏÏÏÏÏÏÏÏÏÏÏÏÏÏÏÏÏÏÏÏÏÏÏÏÏÏÏÏÏ 69
Semiconductor Memory Product Features ÏÏÏÏÏÏÏÏÏÏÏÏÏÏÏÏÏÏÏÏÏÏÏÏÏÏÏÏÏÏÏÏÏÏÏÏÏÏÏÏÏÏÏÏÏÏÏÏÏÏÏÏÏÏÏÏÏ 69
DRAM TechnologiesÏÏÏÏÏÏÏÏÏÏÏÏÏÏÏÏÏÏÏÏÏÏÏÏÏÏÏÏÏÏÏÏÏÏÏÏÏÏÏÏÏÏÏÏÏÏÏÏÏÏÏÏÏÏÏÏÏÏÏÏÏÏÏÏÏÏÏÏÏÏÏÏÏÏÏ 71
The Semiconductor Manufacturing Process ÏÏÏÏÏÏÏÏÏÏÏÏÏÏÏÏÏÏÏÏÏÏÏÏÏÏÏÏÏÏÏÏÏÏÏÏÏÏÏÏÏÏÏÏÏÏÏÏÏÏÏÏÏÏÏÏ 72
DRAM Applications ÏÏÏÏÏÏÏÏÏÏÏÏÏÏÏÏÏÏÏÏÏÏÏÏÏÏÏÏÏÏÏÏÏÏÏÏÏÏÏÏÏÏÏÏÏÏÏÏÏÏÏÏÏÏÏÏÏÏÏÏÏÏÏÏÏÏÏÏÏÏÏÏÏÏÏ 73
Drivers of DRAM Demand and Recent TrendsÏÏÏÏÏÏÏÏÏÏÏÏÏÏÏÏÏÏÏÏÏÏÏÏÏÏÏÏÏÏÏÏÏÏÏÏÏÏÏÏÏÏÏÏÏÏÏÏÏÏÏÏÏ 74
Drivers of DRAM Supply and Recent Trends ÏÏÏÏÏÏÏÏÏÏÏÏÏÏÏÏÏÏÏÏÏÏÏÏÏÏÏÏÏÏÏÏÏÏÏÏÏÏÏÏÏÏÏÏÏÏÏÏÏÏÏÏÏÏ 75
OUR BUSINESS ÏÏÏÏÏÏÏÏÏÏÏÏÏÏÏÏÏÏÏÏÏÏÏÏÏÏÏÏÏÏÏÏÏÏÏÏÏÏÏÏÏÏÏÏÏÏÏÏÏÏÏÏÏÏÏÏÏÏÏÏÏÏÏÏÏÏÏÏÏÏÏÏÏÏÏÏÏÏÏ 78
Overview ÏÏÏÏÏÏÏÏÏÏÏÏÏÏÏÏÏÏÏÏÏÏÏÏÏÏÏÏÏÏÏÏÏÏÏÏÏÏÏÏÏÏÏÏÏÏÏÏÏÏÏÏÏÏÏÏÏÏÏÏÏÏÏÏÏÏÏÏÏÏÏÏÏÏÏÏÏÏÏÏÏÏÏÏÏ 78
Our Strengths ÏÏÏÏÏÏÏÏÏÏÏÏÏÏÏÏÏÏÏÏÏÏÏÏÏÏÏÏÏÏÏÏÏÏÏÏÏÏÏÏÏÏÏÏÏÏÏÏÏÏÏÏÏÏÏÏÏÏÏÏÏÏÏÏÏÏÏÏÏÏÏÏÏÏÏÏÏÏÏÏÏ 79
Our Strategy ÏÏÏÏÏÏÏÏÏÏÏÏÏÏÏÏÏÏÏÏÏÏÏÏÏÏÏÏÏÏÏÏÏÏÏÏÏÏÏÏÏÏÏÏÏÏÏÏÏÏÏÏÏÏÏÏÏÏÏÏÏÏÏÏÏÏÏÏÏÏÏÏÏÏÏÏÏÏÏÏÏÏ 80
Our HistoryÏÏÏÏÏÏÏÏÏÏÏÏÏÏÏÏÏÏÏÏÏÏÏÏÏÏÏÏÏÏÏÏÏÏÏÏÏÏÏÏÏÏÏÏÏÏÏÏÏÏÏÏÏÏÏÏÏÏÏÏÏÏÏÏÏÏÏÏÏÏÏÏÏÏÏÏÏÏÏÏÏÏÏ 81
Expected Benefits of our Carve-out ÏÏÏÏÏÏÏÏÏÏÏÏÏÏÏÏÏÏÏÏÏÏÏÏÏÏÏÏÏÏÏÏÏÏÏÏÏÏÏÏÏÏÏÏÏÏÏÏÏÏÏÏÏÏÏÏÏÏÏÏÏÏÏ 81
Products and ApplicationsÏÏÏÏÏÏÏÏÏÏÏÏÏÏÏÏÏÏÏÏÏÏÏÏÏÏÏÏÏÏÏÏÏÏÏÏÏÏÏÏÏÏÏÏÏÏÏÏÏÏÏÏÏÏÏÏÏÏÏÏÏÏÏÏÏÏÏÏÏÏÏ 82
Customers, Sales and Marketing ÏÏÏÏÏÏÏÏÏÏÏÏÏÏÏÏÏÏÏÏÏÏÏÏÏÏÏÏÏÏÏÏÏÏÏÏÏÏÏÏÏÏÏÏÏÏÏÏÏÏÏÏÏÏÏÏÏÏÏÏÏÏÏÏÏ 87
Competition ÏÏÏÏÏÏÏÏÏÏÏÏÏÏÏÏÏÏÏÏÏÏÏÏÏÏÏÏÏÏÏÏÏÏÏÏÏÏÏÏÏÏÏÏÏÏÏÏÏÏÏÏÏÏÏÏÏÏÏÏÏÏÏÏÏÏÏÏÏÏÏÏÏÏÏÏÏÏÏÏÏÏ 89
Research and DevelopmentÏÏÏÏÏÏÏÏÏÏÏÏÏÏÏÏÏÏÏÏÏÏÏÏÏÏÏÏÏÏÏÏÏÏÏÏÏÏÏÏÏÏÏÏÏÏÏÏÏÏÏÏÏÏÏÏÏÏÏÏÏÏÏÏÏÏÏÏÏÏ 90
Strategic Alliances and AgreementsÏÏÏÏÏÏÏÏÏÏÏÏÏÏÏÏÏÏÏÏÏÏÏÏÏÏÏÏÏÏÏÏÏÏÏÏÏÏÏÏÏÏÏÏÏÏÏÏÏÏÏÏÏÏÏÏÏÏÏÏÏÏÏ 93
Facilities and Manufacturing ÏÏÏÏÏÏÏÏÏÏÏÏÏÏÏÏÏÏÏÏÏÏÏÏÏÏÏÏÏÏÏÏÏÏÏÏÏÏÏÏÏÏÏÏÏÏÏÏÏÏÏÏÏÏÏÏÏÏÏÏÏÏÏÏÏÏÏÏ 98
Intellectual PropertyÏÏÏÏÏÏÏÏÏÏÏÏÏÏÏÏÏÏÏÏÏÏÏÏÏÏÏÏÏÏÏÏÏÏÏÏÏÏÏÏÏÏÏÏÏÏÏÏÏÏÏÏÏÏÏÏÏÏÏÏÏÏÏÏÏÏÏÏÏÏÏÏÏÏÏÏ 102
EquipmentÏÏÏÏÏÏÏÏÏÏÏÏÏÏÏÏÏÏÏÏÏÏÏÏÏÏÏÏÏÏÏÏÏÏÏÏÏÏÏÏÏÏÏÏÏÏÏÏÏÏÏÏÏÏÏÏÏÏÏÏÏÏÏÏÏÏÏÏÏÏÏÏÏÏÏÏÏÏÏÏÏÏÏÏ 105
Raw Materials ÏÏÏÏÏÏÏÏÏÏÏÏÏÏÏÏÏÏÏÏÏÏÏÏÏÏÏÏÏÏÏÏÏÏÏÏÏÏÏÏÏÏÏÏÏÏÏÏÏÏÏÏÏÏÏÏÏÏÏÏÏÏÏÏÏÏÏÏÏÏÏÏÏÏÏÏÏÏÏÏ 105
EmployeesÏÏÏÏÏÏÏÏÏÏÏÏÏÏÏÏÏÏÏÏÏÏÏÏÏÏÏÏÏÏÏÏÏÏÏÏÏÏÏÏÏÏÏÏÏÏÏÏÏÏÏÏÏÏÏÏÏÏÏÏÏÏÏÏÏÏÏÏÏÏÏÏÏÏÏÏÏÏÏÏÏÏÏÏ 106
Backlog ÏÏÏÏÏÏÏÏÏÏÏÏÏÏÏÏÏÏÏÏÏÏÏÏÏÏÏÏÏÏÏÏÏÏÏÏÏÏÏÏÏÏÏÏÏÏÏÏÏÏÏÏÏÏÏÏÏÏÏÏÏÏÏÏÏÏÏÏÏÏÏÏÏÏÏÏÏÏÏÏÏÏÏÏÏÏ 107
Legal Matters ÏÏÏÏÏÏÏÏÏÏÏÏÏÏÏÏÏÏÏÏÏÏÏÏÏÏÏÏÏÏÏÏÏÏÏÏÏÏÏÏÏÏÏÏÏÏÏÏÏÏÏÏÏÏÏÏÏÏÏÏÏÏÏÏÏÏÏÏÏÏÏÏÏÏÏÏÏÏÏÏÏ 107
iii
Global Reports LLC

Environmental Protection, Safety and HealthÏÏÏÏÏÏÏÏÏÏÏÏÏÏÏÏÏÏÏÏÏÏÏÏÏÏÏÏÏÏÏÏÏÏÏÏÏÏÏÏÏÏÏÏÏÏÏÏÏÏÏÏÏÏÏ 113
Real Property ÏÏÏÏÏÏÏÏÏÏÏÏÏÏÏÏÏÏÏÏÏÏÏÏÏÏÏÏÏÏÏÏÏÏÏÏÏÏÏÏÏÏÏÏÏÏÏÏÏÏÏÏÏÏÏÏÏÏÏÏÏÏÏÏÏÏÏÏÏÏÏÏÏÏÏÏÏÏÏÏÏ 115
MANAGEMENT ÏÏÏÏÏÏÏÏÏÏÏÏÏÏÏÏÏÏÏÏÏÏÏÏÏÏÏÏÏÏÏÏÏÏÏÏÏÏÏÏÏÏÏÏÏÏÏÏÏÏÏÏÏÏÏÏÏÏÏÏÏÏÏÏÏÏÏÏÏÏÏÏÏÏÏÏÏÏÏ 117
Overview of Corporate Governance Structure ÏÏÏÏÏÏÏÏÏÏÏÏÏÏÏÏÏÏÏÏÏÏÏÏÏÏÏÏÏÏÏÏÏÏÏÏÏÏÏÏÏÏÏÏÏÏÏÏÏÏÏÏÏÏ 117
Supervisory Board ÏÏÏÏÏÏÏÏÏÏÏÏÏÏÏÏÏÏÏÏÏÏÏÏÏÏÏÏÏÏÏÏÏÏÏÏÏÏÏÏÏÏÏÏÏÏÏÏÏÏÏÏÏÏÏÏÏÏÏÏÏÏÏÏÏÏÏÏÏÏÏÏÏÏÏÏÏ 118
Management Board ÏÏÏÏÏÏÏÏÏÏÏÏÏÏÏÏÏÏÏÏÏÏÏÏÏÏÏÏÏÏÏÏÏÏÏÏÏÏÏÏÏÏÏÏÏÏÏÏÏÏÏÏÏÏÏÏÏÏÏÏÏÏÏÏÏÏÏÏÏÏÏÏÏÏÏÏ 121
Employee Stock Option ProgramÏÏÏÏÏÏÏÏÏÏÏÏÏÏÏÏÏÏÏÏÏÏÏÏÏÏÏÏÏÏÏÏÏÏÏÏÏÏÏÏÏÏÏÏÏÏÏÏÏÏÏÏÏÏÏÏÏÏÏÏÏÏÏÏÏ 124
Employee Share Purchase Programs ÏÏÏÏÏÏÏÏÏÏÏÏÏÏÏÏÏÏÏÏÏÏÏÏÏÏÏÏÏÏÏÏÏÏÏÏÏÏÏÏÏÏÏÏÏÏÏÏÏÏÏÏÏÏÏÏÏÏÏÏÏÏ 125
PRINCIPAL SHAREHOLDERS ÏÏÏÏÏÏÏÏÏÏÏÏÏÏÏÏÏÏÏÏÏÏÏÏÏÏÏÏÏÏÏÏÏÏÏÏÏÏÏÏÏÏÏÏÏÏÏÏÏÏÏÏÏÏÏÏÏÏÏÏÏÏÏÏÏ 126
RELATED PARTY TRANSACTIONS AND RELATIONSHIPS ÏÏÏÏÏÏÏÏÏÏÏÏÏÏÏÏÏÏÏÏÏÏÏÏÏÏÏÏÏÏÏÏÏÏÏÏ 127
With Infineon ÏÏÏÏÏÏÏÏÏÏÏÏÏÏÏÏÏÏÏÏÏÏÏÏÏÏÏÏÏÏÏÏÏÏÏÏÏÏÏÏÏÏÏÏÏÏÏÏÏÏÏÏÏÏÏÏÏÏÏÏÏÏÏÏÏÏÏÏÏÏÏÏÏÏÏÏÏÏÏÏÏ 127
With Management ÏÏÏÏÏÏÏÏÏÏÏÏÏÏÏÏÏÏÏÏÏÏÏÏÏÏÏÏÏÏÏÏÏÏÏÏÏÏÏÏÏÏÏÏÏÏÏÏÏÏÏÏÏÏÏÏÏÏÏÏÏÏÏÏÏÏÏÏÏÏÏÏÏÏÏÏÏ 133
With Siemens ÏÏÏÏÏÏÏÏÏÏÏÏÏÏÏÏÏÏÏÏÏÏÏÏÏÏÏÏÏÏÏÏÏÏÏÏÏÏÏÏÏÏÏÏÏÏÏÏÏÏÏÏÏÏÏÏÏÏÏÏÏÏÏÏÏÏÏÏÏÏÏÏÏÏÏÏÏÏÏÏÏ 134
ARTICLES OF ASSOCIATIONÏÏÏÏÏÏÏÏÏÏÏÏÏÏÏÏÏÏÏÏÏÏÏÏÏÏÏÏÏÏÏÏÏÏÏÏÏÏÏÏÏÏÏÏÏÏÏÏÏÏÏÏÏÏÏÏÏÏÏÏÏÏÏÏÏÏ 135
Share Capital ÏÏÏÏÏÏÏÏÏÏÏÏÏÏÏÏÏÏÏÏÏÏÏÏÏÏÏÏÏÏÏÏÏÏÏÏÏÏÏÏÏÏÏÏÏÏÏÏÏÏÏÏÏÏÏÏÏÏÏÏÏÏÏÏÏÏÏÏÏÏÏÏÏÏÏÏÏÏÏÏÏ 135
Authorized CapitalÏÏÏÏÏÏÏÏÏÏÏÏÏÏÏÏÏÏÏÏÏÏÏÏÏÏÏÏÏÏÏÏÏÏÏÏÏÏÏÏÏÏÏÏÏÏÏÏÏÏÏÏÏÏÏÏÏÏÏÏÏÏÏÏÏÏÏÏÏÏÏÏÏÏÏÏÏ 135
Conditional Capital ÏÏÏÏÏÏÏÏÏÏÏÏÏÏÏÏÏÏÏÏÏÏÏÏÏÏÏÏÏÏÏÏÏÏÏÏÏÏÏÏÏÏÏÏÏÏÏÏÏÏÏÏÏÏÏÏÏÏÏÏÏÏÏÏÏÏÏÏÏÏÏÏÏÏÏÏ 136
Preemptive Rights ÏÏÏÏÏÏÏÏÏÏÏÏÏÏÏÏÏÏÏÏÏÏÏÏÏÏÏÏÏÏÏÏÏÏÏÏÏÏÏÏÏÏÏÏÏÏÏÏÏÏÏÏÏÏÏÏÏÏÏÏÏÏÏÏÏÏÏÏÏÏÏÏÏÏÏÏÏ 136
Shareholders' Meetings and Voting Rights ÏÏÏÏÏÏÏÏÏÏÏÏÏÏÏÏÏÏÏÏÏÏÏÏÏÏÏÏÏÏÏÏÏÏÏÏÏÏÏÏÏÏÏÏÏÏÏÏÏÏÏÏÏÏÏÏÏ 136
Dividend Rights ÏÏÏÏÏÏÏÏÏÏÏÏÏÏÏÏÏÏÏÏÏÏÏÏÏÏÏÏÏÏÏÏÏÏÏÏÏÏÏÏÏÏÏÏÏÏÏÏÏÏÏÏÏÏÏÏÏÏÏÏÏÏÏÏÏÏÏÏÏÏÏÏÏÏÏÏÏÏÏ 137
Liquidation Rights ÏÏÏÏÏÏÏÏÏÏÏÏÏÏÏÏÏÏÏÏÏÏÏÏÏÏÏÏÏÏÏÏÏÏÏÏÏÏÏÏÏÏÏÏÏÏÏÏÏÏÏÏÏÏÏÏÏÏÏÏÏÏÏÏÏÏÏÏÏÏÏÏÏÏÏÏÏ 137
Repurchase of Our Own Shares ÏÏÏÏÏÏÏÏÏÏÏÏÏÏÏÏÏÏÏÏÏÏÏÏÏÏÏÏÏÏÏÏÏÏÏÏÏÏÏÏÏÏÏÏÏÏÏÏÏÏÏÏÏÏÏÏÏÏÏÏÏÏÏÏÏÏ 138
Corporate Purpose of Our Company ÏÏÏÏÏÏÏÏÏÏÏÏÏÏÏÏÏÏÏÏÏÏÏÏÏÏÏÏÏÏÏÏÏÏÏÏÏÏÏÏÏÏÏÏÏÏÏÏÏÏÏÏÏÏÏÏÏÏÏÏÏÏ 138
Registration of the Company with Commercial Register ÏÏÏÏÏÏÏÏÏÏÏÏÏÏÏÏÏÏÏÏÏÏÏÏÏÏÏÏÏÏÏÏÏÏÏÏÏÏÏÏÏÏÏÏÏ 138
ADDITIONAL INFORMATION ÏÏÏÏÏÏÏÏÏÏÏÏÏÏÏÏÏÏÏÏÏÏÏÏÏÏÏÏÏÏÏÏÏÏÏÏÏÏÏÏÏÏÏÏÏÏÏÏÏÏÏÏÏÏÏÏÏÏÏÏÏÏÏÏÏ 139
Group Structure ÏÏÏÏÏÏÏÏÏÏÏÏÏÏÏÏÏÏÏÏÏÏÏÏÏÏÏÏÏÏÏÏÏÏÏÏÏÏÏÏÏÏÏÏÏÏÏÏÏÏÏÏÏÏÏÏÏÏÏÏÏÏÏÏÏÏÏÏÏÏÏÏÏÏÏÏÏÏÏ 139
Dividend Policy ÏÏÏÏÏÏÏÏÏÏÏÏÏÏÏÏÏÏÏÏÏÏÏÏÏÏÏÏÏÏÏÏÏÏÏÏÏÏÏÏÏÏÏÏÏÏÏÏÏÏÏÏÏÏÏÏÏÏÏÏÏÏÏÏÏÏÏÏÏÏÏÏÏÏÏÏÏÏÏ 139
Significant Changes ÏÏÏÏÏÏÏÏÏÏÏÏÏÏÏÏÏÏÏÏÏÏÏÏÏÏÏÏÏÏÏÏÏÏÏÏÏÏÏÏÏÏÏÏÏÏÏÏÏÏÏÏÏÏÏÏÏÏÏÏÏÏÏÏÏÏÏÏÏÏÏÏÏÏÏÏ 139
Market Information ÏÏÏÏÏÏÏÏÏÏÏÏÏÏÏÏÏÏÏÏÏÏÏÏÏÏÏÏÏÏÏÏÏÏÏÏÏÏÏÏÏÏÏÏÏÏÏÏÏÏÏÏÏÏÏÏÏÏÏÏÏÏÏÏÏÏÏÏÏÏÏÏÏÏÏÏ 140
Exchange Rates ÏÏÏÏÏÏÏÏÏÏÏÏÏÏÏÏÏÏÏÏÏÏÏÏÏÏÏÏÏÏÏÏÏÏÏÏÏÏÏÏÏÏÏÏÏÏÏÏÏÏÏÏÏÏÏÏÏÏÏÏÏÏÏÏÏÏÏÏÏÏÏÏÏÏÏÏÏÏÏ 140
TaxationÏÏÏÏÏÏÏÏÏÏÏÏÏÏÏÏÏÏÏÏÏÏÏÏÏÏÏÏÏÏÏÏÏÏÏÏÏÏÏÏÏÏÏÏÏÏÏÏÏÏÏÏÏÏÏÏÏÏÏÏÏÏÏÏÏÏÏÏÏÏÏÏÏÏÏÏÏÏÏÏÏÏÏÏÏÏ 141
Exchange Controls and Limitations Affecting ShareholdersÏÏÏÏÏÏÏÏÏÏÏÏÏÏÏÏÏÏÏÏÏÏÏÏÏÏÏÏÏÏÏÏÏÏÏÏÏÏÏÏÏÏÏ 145
Documents on DisplayÏÏÏÏÏÏÏÏÏÏÏÏÏÏÏÏÏÏÏÏÏÏÏÏÏÏÏÏÏÏÏÏÏÏÏÏÏÏÏÏÏÏÏÏÏÏÏÏÏÏÏÏÏÏÏÏÏÏÏÏÏÏÏÏÏÏÏÏÏÏÏÏÏÏ 145
Controls and Procedures ÏÏÏÏÏÏÏÏÏÏÏÏÏÏÏÏÏÏÏÏÏÏÏÏÏÏÏÏÏÏÏÏÏÏÏÏÏÏÏÏÏÏÏÏÏÏÏÏÏÏÏÏÏÏÏÏÏÏÏÏÏÏÏÏÏÏÏÏÏÏÏÏ 145
Audit Committee Financial Expert ÏÏÏÏÏÏÏÏÏÏÏÏÏÏÏÏÏÏÏÏÏÏÏÏÏÏÏÏÏÏÏÏÏÏÏÏÏÏÏÏÏÏÏÏÏÏÏÏÏÏÏÏÏÏÏÏÏÏÏÏÏÏÏ 146
Principal Accountant Fees and Services ÏÏÏÏÏÏÏÏÏÏÏÏÏÏÏÏÏÏÏÏÏÏÏÏÏÏÏÏÏÏÏÏÏÏÏÏÏÏÏÏÏÏÏÏÏÏÏÏÏÏÏÏÏÏÏÏÏÏÏ 146
Code of Ethics ÏÏÏÏÏÏÏÏÏÏÏÏÏÏÏÏÏÏÏÏÏÏÏÏÏÏÏÏÏÏÏÏÏÏÏÏÏÏÏÏÏÏÏÏÏÏÏÏÏÏÏÏÏÏÏÏÏÏÏÏÏÏÏÏÏÏÏÏÏÏÏÏÏÏÏÏÏÏÏÏ 147
Exemptions from the Listing Standards for Audit Committee ÏÏÏÏÏÏÏÏÏÏÏÏÏÏÏÏÏÏÏÏÏÏÏÏÏÏÏÏÏÏÏÏÏÏÏÏÏÏÏÏÏ 147
Material Contracts ÏÏÏÏÏÏÏÏÏÏÏÏÏÏÏÏÏÏÏÏÏÏÏÏÏÏÏÏÏÏÏÏÏÏÏÏÏÏÏÏÏÏÏÏÏÏÏÏÏÏÏÏÏÏÏÏÏÏÏÏÏÏÏÏÏÏÏÏÏÏÏÏÏÏÏÏÏ 147
GLOSSARY ÏÏÏÏÏÏÏÏÏÏÏÏÏÏÏÏÏÏÏÏÏÏÏÏÏÏÏÏÏÏÏÏÏÏÏÏÏÏÏÏÏÏÏÏÏÏÏÏÏÏÏÏÏÏÏÏÏÏÏÏÏÏÏÏÏÏÏÏÏÏÏÏÏÏÏÏÏÏÏÏÏÏÏ 148
FINANCIAL STATEMENTS ÏÏÏÏÏÏÏÏÏÏÏÏÏÏÏÏÏÏÏÏÏÏÏÏÏÏÏÏÏÏÏÏÏÏÏÏÏÏÏÏÏÏÏÏÏÏÏÏÏÏÏÏÏÏÏÏÏÏÏÏÏÏÏÏÏÏÏÏ F-1
EXHIBIT INDEX ÏÏÏÏÏÏÏÏÏÏÏÏÏÏÏÏÏÏÏÏÏÏÏÏÏÏÏÏÏÏÏÏÏÏÏÏÏÏÏÏÏÏÏÏÏÏÏÏÏÏÏÏÏÏÏÏÏÏÏÏÏÏÏÏÏÏÏÏÏÏÏÏÏÏÏÏÏÏ Ì
iv
Global Reports LLC

PRESENTATION OF FINANCIAL AND OTHER INFORMATION
Our combined and consolidated financial statements are prepared in accordance with U.S. GAAP and
expressed in euro, the single currency of the participating member states in the Third Stage of the European
Economic and Monetary Union (EMU) of the Treaty Establishing the European Community, as amended
from time to time. In this annual report, references to ""euro'' or ""4'' are to euro and references to ""U.S. $'' or
""$'' are to U.S. dollars. In this annual report, for convenience only, we have translated the euro amounts
reflected in our combined and consolidated financial statements as of and for the financial year ended
September 30, 2006 into U.S. dollars at the rate of 41.00 • 1.2687, the noon buying rate of the Federal
Reserve Bank of New York for euro on September 29, 2006, the last currency trading day in September 2006.
This noon buying rate was 41.2823 on November 17, 2006. You should not assume that, on that or on any
other date, one could have converted these amounts of euros into dollars at that or any other exchange rate.
Our financial year ends on September 30 of each year. References to any financial year refer to the year
ended September 30 of the calendar year specified.
This annual report contains market data that have been prepared or reported by Gartner Inc. (Gartner),
International Data Corporation (IDC), iSuppli Corporation (iSuppli) and World Semiconductor Trade
Statistics (WSTS).
The trademarks QimondaTM, TwinFlash», AENEON» and RLDRAM» have been assigned to us by
Infineon in connection with our carve-out. Pursuant to a co-development agreement between Infineon and
Micron Technology, Inc., Micron has trademark rights to CellularRAM» used on or in connection with
products sold inside the United States, whereas Infineon has those rights with respect to products sold outside
the United States. All other trademarks, trade names or service marks appearing in this annual report are the
property of their respective owners.
Figures presented in tabular format may not add up to 100% due to rounding.
Special terms used in the semiconductor industry are defined in the glossary.
In this annual report, references to:
‚ ""our company'' are to Qimonda AG; and
‚ ""we'', ""us'' or ""Qimonda'' are to Qimonda AG and, unless the context otherwise requires, to our
subsidiaries and our predecessor, the former memory products group of Infineon Technologies AG.
Forward-Looking Statements And Market Data
This annual report, including particularly the sections entitled ""Risk Factors'', ""Selected Combined and
Consolidated Financial Data'', ""Operating and Financial Review'', ""The Semiconductor Memory Industry'',
""Our Business'', ""Management'', ""Related Party Transactions and Relationships'' and ""Additional Informa-
tion'' contains forward-looking statements. These forward-looking statements include statements regarding
our financial position; our expectations concerning future operations, margins, profitability, liquidity and
capital resources; our business strategy and other plans and objectives for future operations; and all other
statements that are not historical facts. In some cases, you can identify forward-looking statements by
terminology such as ""may'', ""will'', ""should'', ""expects'', ""intends'', ""plans'', ""anticipates'', ""believes'',
""thinks'', ""estimates'', ""seeks'', ""predicts'', ""potential'', and similar expressions. Although we believe that
these statements are based on reasonable assumptions, they are subject to numerous factors, risks and
uncertainties that could cause actual outcomes and results to be materially different from those projected.
These factors, risks and uncertainties include those listed under ""Risk Factors'' and elsewhere in this annual
report. Those factors, among others, could cause our actual results and performance to differ materially from
the results and performance projected in, or implied by, the forward-looking statements. As you read and
consider this annual report, you should carefully understand that the forward-looking statements are not
guarantees of performance or results.
1
Global Reports LLC

Company Information
We were registered in the commercial register of the local court of Munich on May 25, 2004 as Invot
AG, a German stock corporation and wholly-owned subsidiary of Infineon Technologies AG, under number
HRB 152545. We changed our name to Qimonda AG on April 6, 2006. Our principal executive offices are
located at Gustav-Heinemann-Ring 212, 81739 Munich, Germany, and our telephone number is °49-89-234-
20390. Our website is http://www.qimonda.com. This website address is included in this annual report as an
inactive textual reference only. The information and other content appearing on our website are not part of this
annual report. Our agent for service of process in the United States is Qimonda North America Corp.,
Corporation Trust Center, 1209 Orange Street, Wilmington, County of New Castle, Delaware 19801.
Use of Non-U.S. GAAP Financial Measures
This document contains non-U.S. GAAP financial measures. Non-U.S. GAAP financial measures are
measures of our historical or future performance, financial position or cash flows that contain adjustments that
exclude or include amounts that are included or excluded, as the case may be, from the most directly
comparable measure calculated and presented in accordance with U.S. GAAP in our combined and
consolidated financial statements. Earnings before interest and taxes (""EBIT'') is an example of a
non-U.S. GAAP financial measure. For descriptions of these non-U.S. GAAP financial measures and the
adjustment made to the most directly comparable U.S. GAAP financial measures to obtain them, please refer
to ""Operating and Financial Review''.
2
Global Reports LLC

RISK FACTORS
Investing in our ADSs involves a high degree of risk. You should carefully consider the risk factors setforth below and all other information contained in this annual report, including our combined andconsolidated financial statements and the related notes, before making an investment decision regarding oursecurities. The risks described below are those significant risk factors, currently known and specific to us, thatwe believe are relevant to an investment in our securities. If any of these risks materialize, our business,financial condition or results of operations could suffer, the price of our ADSs could decline and you could losepart or all of your investment. Additional risks not currently known to us or that we now deem immaterialmay also harm us and adversely affect your investment in our ADSs.
Risks related to the semiconductor memory products industry
The DRAM industry is subject to cyclical fluctuations, including recurring periods of oversupply, whichresult in large swings in our operating results, including large losses.
The market for DRAM products is highly cyclical, with frequently mismatched demand and supply
cycles. Because the majority of DRAM products shipped, especially those for the personal computer market,
is of a commodity nature, DRAM prices are driven primarily by changes in worldwide DRAM supply, which
in turn is driven by manufacturing capacity and, in part, by fluctuations in demand for the end products that
use memory semiconductors. A typical DRAM market cycle is characterized by an initial period of high
demand for DRAM products, resulting in rising DRAM prices. Higher prices and suppliers' perception of
increasing demand lead many suppliers and manufacturers to decide to construct, equip or contract new
facilities to increase capacity. However, the lead times for new or improved facilities to become operational
average one to two years. By the time these facilities come on-stream, demand growth may have slowed or
even reversed. When many suppliers' additional manufacturing capacity comes on-stream, which may occur
almost simultaneously, industry-wide supply often rises past the point where it exceeds demand and DRAM
prices fall, sometimes precipitously. This in turn can cause DRAM manufacturers to incur losses. As a result
of this cyclicality, our results of operations have historically been volatile from year to year and we expect
them to remain so.
The reluctance of DRAM manufacturers to run their facilities at less than full capacity can causeoversupply-driven downturns to last for prolonged periods, keeping DRAM prices low.
Because the fixed costs of building, equipping and operating DRAM manufacturing facilities, or fabs, are
very high and constitute a high proportion of the costs of producing each DRAM chip, DRAM manufacturers
normally operate their factories at full capacity, 24 hours per day and seven days per week, even when prices
are low or falling. A manufacturer would typically continue production of DRAM products at full capacity at a
DRAM facility as long as the average selling price of the DRAM chips the facility produces remains above
that facility's variable cost of producing chips and provided that the facility cannot be converted cost-
effectively to manufacture a more profitable product. For this reason, there is typically little capacity or supply
shrinkage in response to a market downturn. Oversupply has in the past contributed to substantial declines in
average selling prices and is likely to do so again in the future. DRAM prices only begin to recover when
demand growth strengthens sufficiently to catch up with supply. While lower prices may lead to an
acceleration in demand if personal computer manufacturers, in particular, increase the amount of DRAM
""bits per box'', or the amount of memory included in each device (for example, in each personal computer, or
PC), the absorption of the oversupply may require a substantial increase in demand. As a result, oversupply-
driven downturns can last for prolonged periods. It is likely that the DRAM industry will continue to suffer
from cyclical downturns in the future and that we will be adversely affected by these downturns. Such
downturns can have material adverse effects on our business, financial condition and results of operations for
extended periods.
3
Global Reports LLC

Demand weakness in any of the end markets that use our products, especially the personal computerindustry, could have a material adverse effect on our results of operations.
The majority of our sales are of products used in PCs, notebook computers, workstations and servers, with
a smaller but growing portion used in graphics, mobile and consumer applications. Our revenue growth
depends not only on continued growth in the number of these products sold into our customers' end markets,
but also on the amount of DRAM ""bits per box''. We are likely to suffer slower growth or a decline in demand
for our products if our customers' end markets do not continue to grow or if the ""bits per box'' do not continue
to increase or if either decline. If this occurs during a period already characterized by DRAM oversupply, our
business can suffer especially severe downturns. This occurred most recently in 2001, when worldwide DRAM
sales dropped from $29 billion in 2000 to $11 billion in 2001, according to WSTS. According to Gartner,
256Mb equivalent DRAM was priced at $36 in the third quarter of 2000, but by the fourth quarter of 2001,
this price had fallen below $4. These declines had a material adverse effect on our financial condition and
results of operations and those of our competitors in 2001 and 2002. Any sustained decline in our customers'
markets for our products that may occur in the future could have a material adverse effect on our business,
financial condition and results of operations.
A mismatch between the specific DRAM chips we or the DRAM industry generally are producing andthe platforms for which equipment manufacturers require DRAMs can lead to declining prices for theDRAMs we produce and consequently to material inventory write-downs.
Which DRAMs are required by the market at any particular time depends on the platforms the
manufacturers of PCs and other electronic devices are using in their products at that time. In general,
DRAMs are designed, manufactured and assembled into modules for use on a specified platform, or logic
chipset and its associated interfaces. If DRAM manufacturers are producing DRAMs for which there is not
enough demand because the supply of the related platforms is low, the supply of these DRAMs may exceed
the demand for them, causing prices for the affected DRAM products to fall. For example, the DDR2
generation of DRAMs is designed to work together with a DDR2 logic chipset to operate a PC. In the first
quarter of our 2006 financial year, we and many of our competitors were producing large volumes of DDR2s,
but the PC manufacturers sourced far fewer DDR2 logic chipsets than would permit the manufacture of
enough PCs to absorb all of the DDR2s being produced. The result was a dramatic decline in DDR2 prices
industry-wide. A portion of the DDR2 chips that we produced remained unsold and in our inventory until
supply of appropriate logic chipsets caught up. Given the significant risk of demand and supply mismatches
characteristic of our industry, we may find it necessary to write down the carrying value of inventories in the
future depending on market conditions. Any such write-downs could have a material and adverse effect on our
business, financial condition and results of operations.
We may not respond quickly enough to the rapid technological change in our industry.
The semiconductor memory products industry is characterized by extremely rapid technological change,
both in the design of memory chips and in the manufacturing processes used to produce them. The following
technological developments are continuously driving the improvements in the performance standards of most
DRAM products:
‚ increasing the amount of data storage capacity per DRAM chip, or density (DRAM manufacturers
have generally doubled the density of DRAM chips approximately every 24 months);
‚ increasing data transfer rates, or bandwidth, between the DRAM and the central processing unit, or
CPU, of the PC or other device; and
‚ decreasing operating voltage and power consumption of the DRAM.
In 2000, the industry-standard DRAM chip had a density of 64 megabits. By 2005, the density of the
standard DRAM chip had increased to 256 megabits, with the 512 megabit generation in ramp-up and the
1 gigabit generations in early production phases. In that same period, the interface generation has evolved
from SDRAM past DDR to DDR2, with DDR3 in the development phase. At the same time, operating
4
Global Reports LLC
voltage has declined from 3.3 volts for SDRAM to 1.8 volts for DDR2. DRAM manufacturers have
continuously reduced the feature size of their technologies to enable them to manufacture higher density
memory offering higher speeds and requiring lower operating voltages.
In addition, from time to time industry participants are able to reduce the overall size of the storage cells
on DRAM chips, which could be a factor in reducing manufacturing costs by increasing the number of chips
that can be manufactured on a wafer.
For us to maintain or increase the competitiveness of our products, we must continually develop or
acquire the technologies that allow us to increase memory capacity while shrinking the size of our chips and to
do so faster than our competition. Our commitment to the development of new products and process
technologies, including making the substantial investments that are required for these developments, must be
made well in advance of the introduction of those products and technologies into the market. As part of this
commitment, we must continually be reviewing the technologies, architectures and processes we use to make
sure that they have the technological properties and robustness to permit volume manufacturing at
competitive costs. Technology and industry standards or customer demands may change during the
development process, rendering our products outdated or uncompetitive. Our failure to keep pace with the
technological advancements, to anticipate changes that might render our technologies, architectures and
processes uncompetitive or to respond quickly to market changes may materially and adversely affect our
business, financial condition and results of operations.
The semiconductor memory products industry is characterized by intense competition, which could reduceour sales or put continued pressure on our prices.
The semiconductor memory products industry is highly competitive and has been characterized by rapid
technological change, short product lifecycles, high capital expenditures, intense pricing pressure from major
customers, periods of oversupply and continuous advancements in process technologies and manufacturing
facilities. We compete globally with other major DRAM suppliers, including Samsung Electronics, Micron
Technology, Hynix Semiconductor, Elpida Memory and Nanya Technology Corporation (Nanya), which is
our joint venture partner in Inotera Memories, Inc. Some of our competitors have substantially greater capital,
human and other resources and manufacturing capacities, more efficient cost structures, higher brand
recognition, larger customer bases and more diversified product lines than we have. See ""Our Business Ì
Competition''. Competitors with greater resources and more diversified operations may have long-term
advantages, including the ability to better withstand future downturns in the DRAM market and to finance
research and development activities. In addition, unfair price competition, government support or trade
barriers by or for the benefit of our competitors would adversely affect our competitive position.
To compete successfully in the DRAM market, we must:
‚ design and develop new products and introduce them in a timely manner;
‚ develop and successfully implement improved manufacturing process technologies to reduce our per-
megabit costs; and
‚ broaden our DRAM customer base, to reduce our dependence on a small number of customers and
position us to increase our market share.
Other factors affecting our ability to compete successfully are largely beyond our control. These include:
‚ the extent to which and the pace at which customers incorporate our memory products into their
devices;
‚ whether electronics manufacturers design their products to use DRAM configurations or new types of
memory products that we do not offer;
‚ the number and nature of our competitors; and
‚ general economic conditions.
5
Global Reports LLC
Increased competitive pressure generally or the relative weakening of our competitive position caused by
these factors, or other developments we have not anticipated, could materially and adversely affect our
business, financial condition and results of operations.
Our results of operations are subject to the effects of seasonal sales patterns that apply to the demandfor the products our customers sell and these seasonal sales patterns may interact with existing DRAMsupply and demand dynamics in a way that further harms our results.
Retail demand for our customers' products fluctuates throughout the year and typically varies from region
to region. For example, as our product mix shifts towards applications used in consumer electronics, we are
increasingly exposed to the seasonal sales patterns around the Christmas season. In addition, demand in the
retail sector of the PC market is often stronger during the last three months of the calendar year as a result of
the Christmas holiday season. Many of the factors that create and affect seasonal trends are beyond our
control. Further, if DRAM prices are relatively low, our customers may react to reduced demand for their
products by increasing ""bits per box'' to offer the end-user a higher performing product in an attempt to spur
demand, such as when a PC or notebook manufacturer offers to upgrade the amount of memory included in a
product at no additional cost. However, if DRAM prices are relatively high at that time, our customers may
not increase the ""bits per box'' but instead use another method to spur demand for their products.
Alternatively, if DRAM prices are high during a period in which retail demand is relatively high, our
customers may seek to limit the growth of the ""bits per box'', which may in turn slow or reduce demand for
DRAM and cause DRAM prices to fall. Measures like these can easily obscure the seasonal factors. These
uneven sales patterns, especially when combined with the existing dynamics of DRAM demand and supply
cyclicality, make prediction of net sales for each financial period difficult and increase the risk of
unanticipated variations in our results and financial condition on a quarterly basis.
Risks related to our operations
Some of our agreements with strategic partners, such as our Inotera Memories, Inc. joint venture withNanya, have restrictions on transfers of the shares of the ventures they create that could cause ourownership or equity interest in these ventures to revert to Infineon, if Infineon ceases to be our majorityowner, and Infineon is holding our interest in Inotera in trust for us, which could subject us to loss wereInfineon to become insolvent.
Our joint venture with Nanya, Inotera Memories, Inc. manufactures DRAM products on the basis of
technology jointly developed by Nanya and us pursuant to a separate joint development agreement. The joint
venture agreement allows Infineon to transfer its shares in Inotera to us. However, under Taiwanese law,
Infineon's shares in Inotera are subject to a compulsory restriction on transfer (lock-up) as a result of
Inotera's initial public offering, or IPO, in May 2006. For that reason we had established a separate trust
agreement pursuant to which Infineon agreed to hold title to the Inotera shares in trust for us until they could
be transferred. Taiwanese law generally provides that Infineon may only transfer these shares to us gradually
over the four years following Inotera's IPO. In October 2006, the Taiwanese authorities granted an exemption
to Infineon permitting it to release the shares from the restriction. We expect that the share transfer from
Infineon to us will be completed by the end of the 2006 calendar year.
If Infineon were to reduce its shareholding in Qimonda to a minority level before the earlier of the fifth
anniversary of our carve-out from Infineon and the early mass production using 58nm process technology at
our manufacturing site in Dresden has not been achieved by that time, the joint venture agreement with
Nanya, as amended, could require us to retransfer these Inotera shares to Infineon. We have agreed with
Infineon that, in the event Nanya requests a retransfer, we would transfer the Inotera shares back to the trust.
The trust agreement provides for Infineon to again hold the Inotera shares in trust for us until they could be
transferred back to us. For as long as Infineon holds our shares in Inotera in trust for us, we must exercise our
shareholder rights, including board membership and voting rights, through Infineon, who must act according
to our instructions. This process is a more cumbersome and less efficient method of exercising these rights
than if we held the shares directly. We do not believe that these administrative complexities will have a
material adverse effect on our business, financial condition and results of operations.
6
Global Reports LLC

Although the trust agreement was drafted in a manner designed under German law to ensure that
Qimonda could force the transfer to it of the Inotera shares if Infineon were to become the subject of
insolvency proceedings, there is, in the absence of any clear statutory provision or directly applicable judicial
interpretation on the issue, a risk that the shares would remain subject to the insolvency proceeding in such a
case. Were this to occur, we would lose a portion or all of our investment in Inotera.
In addition, our limited partnership agreement with Advanced Micro Devices (AMD) and Toppan
Photomasks Inc. relating to the Advanced Mask Technology Center (AMTC) and the Maskhouse Building
Administration Company (BAC) in Dresden requires prior written consent from the other partners before
Infineon can assign its partnership interest. In the case of a transfer to an affiliate, the consent may not be
unreasonably withheld, but the interest must be transferred back to Infineon should Infineon cease to be our
majority shareholder. This could lead to similar administrative complexities as described above in the case of
Inotera. Infineon is currently in the process of negotiating with AMD and Toppan with the goal of reaching an
agreement that would allow us to retain the interest even if Infineon ceases to be our majority shareholder.
We have suffered substantial losses in the recent past, including in more recent financial quarters. Evenduring profitable years, we have suffered losses in individual quarters. Losses in the future and theunpredictability of our results may cause our share price to fall.
We have suffered substantial losses in prior periods, when the price of our products has dropped at a rate
for which we could not compensate through volume increases or reduced costs. For example, in our 2001 and
2002 financial years we incurred net operating losses of 4962 million and 4626 million. In addition, we have
incurred quarterly losses in net income and EBIT terms for individual quarters within financial years in which
we were profitable, including in our 2006 financial year, in which we experienced significant losses in the first
quarter. We may also incur losses in future periods. If we sustain losses like these, it would materially and
adversely affect our business, financial condition and results of operations. In addition, our share price is likely
to fall if we incur losses in the future or if we report quarterly or annual results that do not meet the
expectations of industry analysts or that are weaker than those reported by our competitors.
The average selling prices of our principal DRAM products may fluctuate significantly from quarter to
quarter or even from month to month. This may cause us to experience significant fluctuations in our
revenues. However, we have high fixed costs of operations, resulting in large part from the capital-intensive
nature of our business. As a result, our reported financial results can and often do fluctuate significantly from
period to period.
Nearly half of our current revenues are derived from sales of standard DRAM products for PC and
workstation applications, which accounted for 51% and 47% of our revenues in our 2005 and 2006 financial
years. While we are, as part of our strategy to reduce over-reliance on standard DRAMs, seeking to better
balance our product portfolio by offering a wider range of application-specific DRAMs and to diversify our
customer base by focusing on customer-specific DRAMs, these products remain to a greater or lesser extent
exposed to the dynamics exemplified by the standard DRAM market. Finally, after our carve-out, we are no
longer able to offer customers a range of logic products in addition to memory products. Due to these factors,
in the event of a downturn in the DRAM market, our ability to offer alternative products is very limited.
Some of our competitors have diversified production among DRAMs, flash memory, image sensors and
logic ICs, while at present we remain generally focused on DRAMs. These competitors may be able to offset
the negative effects of DRAM downturns by selling non-DRAM products, including flash memory. They may,
when they then perceive better pricing conditions in the DRAM market, be able to quickly convert production
to DRAM products, significantly increasing their DRAM capacities in response to positive environments and
significantly decreasing their DRAM capacities in response to negative environments. Conversely, if the
pricing for non-DRAM products such as flash memory deteriorate, they can convert production back to
DRAM products. Because our production is more narrowly focused on DRAMs, we are less able to adjust our
capacities in response to cyclical developments. This lower ability to adjust capacity could adversely affect our
business, financial condition and results of operations.
7
Global Reports LLC

In addition, the potential ability of these competitors to offset the negative effects of DRAM downturns
by shifting their sales to non-DRAM products may permit them to use the proceeds from those sales to invest
in their DRAM business. This may cause us to be at a competitive disadvantage with regard to technological
advancements taking place in the DRAM industry and reduce our relative ability to keep pace with these
competitors. This could adversely affect our business, financial condition and results of operations.
The ability of some of our competitors to shift their production among memory products may leave us
relatively more exposed to downturns in the DRAM industry and less able to finance technological
advancement.
Our results may suffer if we are not able to adequately forecast demand for our products.
It is not industry practice to enter into firm, long-term purchase commitments with respect to standard
DRAMs. We primarily use internal forecasts to determine the number and mix of products that we
manufacture. Although we also consult with major customers, who typically provide us with short-term rolling
forecasts of their product requirements on a monthly basis, customers may cancel orders or reduce quantities
for a number of reasons or discontinue their relationship with us at any time. Customers frequently place
orders requesting product delivery almost immediately after the order is made, which makes forecasting
customer demand even more difficult. Other customers also purchase chips on consignment, withdrawing
from our stock of products kept on our premises. They may reduce their anticipated withdrawals from these
stocks on very short notice. Based on past experience, if we over-estimate demand for a particular product, we
may need to significantly reduce the price for that product in order to sell our excess inventory. In addition,
due to the high fixed costs of operating manufacturing facilities, it is not industry practice to reduce production
in response to or anticipation of demand slumps, which may lead to excess inventory and cause us to incur
additional inventory carrying costs or write-downs. If we are unable to predict accurately the appropriate
amount of products needed to meet customer requirements, or if our customers were to unexpectedly cancel or
reduce a large number of orders simultaneously, we could fail to match our production with our customers'
demand. This could materially and adversely affect our business, financial condition and results of operations.
In addition, because our markets are volatile and subject to rapid technological and price changes, our
forecasts may be incorrect, and we may make too many or too few of certain products. For example, in the first
quarter of our 2006 financial year, we produced an excess of DDR2 chips because the corresponding DDR2
logic chipsets, which are produced by logic semiconductor manufacturers, were not available in quantities
sufficient for PC manufacturers to absorb the supply of DDR2s in the market. A portion of the DDR2 chips
that we produced remained unsold and in our inventory until supply of appropriate logic chipsets caught up.
We expect the average selling prices of the semiconductor memory products we sell to continue to declineirrespective of cyclical fluctuations in the industry, and if prices decrease faster than we are able toreduce our costs, our margins will be adversely affected.
The average selling prices of semiconductor memory products, including DRAMs, have declined in
general for many years and we expect that they will, irrespective of industry-wide fluctuations, continue to
decline as a result of, among other factors, technological advancements and cost reductions. Although we may
from time to time be able to take advantage of higher selling prices typically associated with new products and
technologies, the prices of new products also generally decline over time, and in certain cases very rapidly, in
the face of market competition. Accordingly, we need to reduce our per-megabit manufacturing costs even as
we seek to maintain our technological position. Despite our significant investments in research and
development and in modern manufacturing facilities, the product and process technologies that we develop
may fail to keep pace with the industry's continuous drive towards more powerful, smaller devices with lower
per-megabit costs. If our development fails to keep pace, our competitors may be able to offer their products
on a more profitable basis. If the average per-megabit selling price for DRAMs and other memory chips that
we produce decreases faster than we are able to reduce our per-megabit manufacturing costs, our gross
margins would decrease and our business, financial condition and results of operations may be materially and
adversely affected.
8
Global Reports LLC

To reduce our costs, we need to make investments to implement improvements and developments in ourprocess technologies quickly. If we are unable to do so, we may not be able to reduce per-megabitmanufacturing costs quickly enough to keep pace with declines in average selling prices for DRAMs andother memory products.
Implementing a significant new process technology, such as the migration to a new process technology
node (for example, from 90nm to 75nm), requires very significant long-term investments and often many
years of development effort. In addition, each successive improvement in process technology generally
involves an increase in complexity that may increase the required level of investment and demand more
development effort. In 2003, we experienced difficulties in our transition from the 140nm to the 110nm
technology node because, at the same time, we moved our development work from East Fishkill, New York to
Dresden, Germany and began to convert to 193nm lithography, both of which introduced complexities to the
technology node transition. Product yields tend to be at relatively lower levels when new process technologies
are being implemented. If we experience delays in implementing these technologies, we may not be able to
reduce our per-megabit manufacturing costs quickly enough to avoid falling margins or keep our prices
competitive. Our business, results of operations and financial condition could be hurt if we experience
substantial delays in developing new process technologies or if we do not implement production technology
transitions efficiently.
If we are unable to respond to customer demand for diversified DRAM products or are unable to do soin a cost efficient manner, we may fail to gain, or even lose, market share.
The DRAM product needs of manufacturers of servers, networking and storage equipment and graphics,
mobile and consumer devices are becoming increasingly diverse in terms of product specifications. This
diversification requires us to devote significant resources to product design and development in cooperation
with our customers. If we are unable to invest sufficient resources to meet our customers' specialized needs, if
we do so in an inefficient or untimely manner, or if our working relationships with our customers otherwise
deteriorate, we may lose business opportunities or market share as a result. We also may encounter difficulties
penetrating markets where our relationship with manufacturers is less developed. In addition, our competitors
may be able to implement similar strategies more effectively than we can.
We may be unable to recoup our investments if we bring new production facilities on-stream in times ofovercapacity.
It is difficult to predict future supply and demand in the market for DRAM and other memory products.
Because it takes one to two years to plan, finance, construct and equip a new facility, we must make a decision
to build a new facility, or to re-equip an existing facility, with no reliable forecast of what the supply and
demand ratio is likely to be when the facility is scheduled to come on-stream. The capital expenditures
required to construct and equip a semiconductor facility with competitive economies of scale are typically
between $2 to $3 billion.
In the 2005 financial year, commercial DRAM production began at the 300mm facilities of our fab in
Richmond, Virginia. In the same year, our foundry partner SMIC ramped up its new 300mm facility, in
Beijing, China with our DRAM technology. In the 2006 financial year, our foundry partner Winbond ramped
up a new 300mm fab in Taichung, Taiwan with our DRAM technology. In addition, Inotera Memories, Inc.
our joint venture with Nanya, increased its capacity at its 300mm fab in Taoyuan, Taiwan in the 2006 financial
year, and has started to equip a second 300mm manufacturing module.
A number of our competitors have also opened, or announced their intentions to open, new 300mm
production facilities. If several new 300mm DRAM manufacturing plants come on-stream at the same time,
there is a risk that the resulting supply growth might exceed demand at that point in time. This could result in
strongly reduced prices for our DRAM products at a time when we have just made very substantial
investments in new production. If this happens, it may take longer for us to recoup our investments, or we may
not be able to do so at all. This could materially and adversely affect our business, financial condition and
results of operations.
9
Global Reports LLC
If prices are significantly declining during the time when we are ramping up production at new facilities,
we may take measures to limit our cash outflows. These measures could include cancelling or delaying the
delivery of manufacturing equipment at those facilities. As a consequence, these facilities might not ramp up
to their expected capacity in the short term. This could prevent them from achieving the economies of scale
they were designed to achieve, such that the costs of manufacture at these facilities might exceed the revenues
from the sales of the products produced there. This could force us to decide to suspend manufacturing at these
facilities. This would also prevent us from recouping our investments as planned or at all, which could have a
material and adverse effect on our business, financial condition and results of operations.
We may lose sales or customers or incur losses if we are unable to successfully modify existingproduction facilities or bring new production facilities on-stream in times of high demand.
We may experience difficulty in ramping up production at new or existing facilities in a timely manner,
such as our 300mm fab in Richmond, Virginia. Similarly, our joint ventures with Nanya and CSVC, which are
currently ramping up production at their fabs, or SMIC and Winbond, foundry manufacturers who provide
some of our manufacturing capacity, may experience similar difficulties in ramping up production at their
production facilities. We may also experience delays in converting to the next step in the technology
improvements that enable us to reduce the feature sizes on chips. This could be due to a variety of factors,
including an inability to hire and train new personnel in a timely fashion, the unavailability of equipment,
difficulties or delays in implementing new fabrication processes and an inability to achieve required yield
levels.
In the future, we may face delays in the construction, equipping or ramp-up of new facilities or the
conversion of existing facilities to new process technologies. Our failure to ramp up our production on a timely
basis may result in loss of sales or customers and a loss of market share, which in turn could reduce our ability
to exploit economies of scale, negatively affecting our cost position and our ability to finance investments in
the future. This failure could also prevent us from recouping our investments in a timely manner or at all. Any
of these effects could materially and adversely affect our business, financial condition and results of operations.
The loss of one or more of our significant customers may adversely affect our business.
Historically, we have relied on a limited number of customers, primarily among the largest PC
manufacturers, for a substantial portion of our total sales. In our 2006 financial year, our five largest customers
accounted for almost 50% of our total sales. HP, our largest customer, alone accounted for approximately 18%
of our sales and Dell, our second largest customer, accounted for 16% of our sales. These major customers
generally purchase products on the basis of short-term purchase orders, can easily cancel these orders and
have no long-term obligations to purchase products from us. Although we are seeking to broaden our customer
base, there are a limited number of major manufacturers that purchase standard DRAM products in large
quantities, and most of them are existing customers of ours. Our major customers generally seek to maintain
multiple sources of supply, and it may be difficult for us to meaningfully increase our current sales volumes of
existing products to them where to do so would move us towards being an exclusive source for them. The loss
of one of our major customers, or any substantial reduction in sales to any of these customers, could have a
material adverse effect on our business, financial condition and results of operations.
Sanctions in the United States and other countries against us and other DRAM producers foranticompetitive practices in the DRAM industry and related civil litigation may have a direct or indirectmaterial adverse effect on our operations.
In September 2004, Infineon entered into a plea agreement with the Antitrust Division of the
U.S. Department of Justice in connection with the DOJ's ongoing investigation of alleged antitrust violations
in the DRAM industry. Pursuant to this plea agreement, Infineon agreed to plead guilty and pay a fine of
$160 million for conduct relating to the pricing of DRAM products between July 1, 1999 and June 15, 2002.
The plea agreement requires Infineon to pay the fine (plus accrued interest) in equal annual instalments
through 2009. Subsequent to the commencement of the DOJ investigation, a number of putative class action
lawsuits were filed against Infineon, its principal U.S. subsidiary and other DRAM manufacturers in various
10
Global Reports LLC

state and federal courts in the United States alleging violations of the Sherman Act, California's Cartwright
Act, other state laws and unfair competition law as well as unjust enrichment in connection with the sale and
pricing of memory products. Each of the cases purports to be on behalf of a class of individuals and entities
who purchased DRAMs directly or indirectly from Infineon in periods commencing after 1999. Infineon has
reached a settlement agreement in the sixteen cases filed by direct U.S. purchasers that were transferred to the
U.S. District Court for the Northern District of California for coordinated proceedings. Under the terms of the
settlement agreement Infineon agreed to pay approximately $21 million. We recorded a corresponding charge
to other operating expense in our financial year ended September 30, 2005. In addition to this settlement
payment, Infineon agreed to pay an additional amount if it is proven that sales of DRAM products to the
settlement class after opt-outs during the settlement period exceeded $208.1 million. We would also be
responsible for this payment. The additional amount payable is calculated by multiplying the amount by which
these sales exceed $208.1 million by 10.53%. We do not currently expect to pay any additional amount to the
class. On November 1, 2006 the District Court for the Northern District of California approved the settlement
with the direct U.S. purchasers. On April 28, 2006 and May 5, 2006, two separate lawsuits were filed by two
direct and indirect purchasers of DRAM against Infineon and various other DRAM suppliers seeking
unspecified damages and other relief based on the same allegations. On October 3, 2006 a number of
individuals and entities gave notice that they are opting out of the direct U.S. purchaser class and settlement.
As a consequence their claims will not be released by that settlement. As of the date hereof, 64 indirect
U.S. purchaser cases are still pending in federal and state courts. A putative class action brought on behalf of
non-U.S. direct purchasers of DRAM was dismissed with prejudice by the court. On July 31, 2006, plaintiffs
filed their opening brief on appeal in that case and defendants files their joint opening brief on September 20,
2006. No hearing date has yet been scheduled for the appeal. Furthermore, on July 13 and 14, 2006, the state
attorneys general of New York, California and 33 other states filed two separate actions in federal court in
New York and California against Infineon, its principal U.S. subsidiary and several other DRAM manufactur-
ers on behalf of governmental entities and consumers who purchased products containing DRAM beginning in
1998. The plaintiffs' claims involve the same allegations of DRAM price-fixing and artificial price inflation
practices discussed above. The plaintiffs are seeking to recover actual and treble damages in unspecified
amounts, penalties, costs and other relief.
Between December 2004 and February 2005, two putative class proceedings were also filed in the
Canadian province of Quebec and one was filed in each of Ontario and British Columbia against Infineon, its
principal U.S. subsidiary and other DRAM manufacturers on behalf of all direct and indirect purchasers
resident in Canada who purchased DRAM or products containing DRAM between July 1999 and June 2002.
Plaintiffs primarily allege conspiracy to unduly restrain competition and to illegally fix the price of DRAM. In
the British Columbia action, the certification motion has been scheduled for May 2007. In one Quebec class
action, preliminary motions are to be scheduled early 2007; the other Quebec action has been stayed pending
developments in the one that is going forward.
Infineon received a request for information regarding DRAM industry practices from the European
Commission in April 2003 and a notice of formal inquiry into alleged DRAM industry competition law
violations from the Canadian Competition Bureau in May 2004. Infineon is fully cooperating with the
Commission's investigation and the Competition Bureau's inquiry.
In the contribution agreement we entered into with Infineon, we agreed to indemnify Infineon for all of
the potential liabilities and risks in connection with the civil and criminal antitrust proceedings, including the
costs of defending these proceedings. As of September 30, 2006, we have accrued liabilities in the amount of
4141 million related to the DOJ and European antitrust investigations and the direct and indirect purchaser
litigation and settlements described above, as well as for legal expenses relating to the other matters described
in ""Our Business Ì Legal Matters''. As of September 30, 2006, no further amounts had been accrued in
respect of the other proceedings described above, including the securities class actions discussed below under
""Ì An unfavorable outcome in the pending securities litigation against Infineon or the incurrence of
significant costs in the defense of this litigation may have a direct or indirect material adverse effect on our
operations.'' As additional information becomes available, the potential liability related to these matters will
be reassessed and the estimates revised, if necessary. These accrued liabilities would be subject to change in
11
Global Reports LLC

the future based on new developments in each matter, or changes in circumstances, which could have a
material adverse effect on our financial condition and results of operations.
An adverse final resolution of the investigations or the civil claims described above could cause us to bear
significant financial liability and other adverse effects. Irrespective of the validity or the successful assertion of
the above claims, Infineon could incur significant costs in connection with the defense or settlement of these
claims, for which we are required to indemnify Infineon under the contribution agreement. An adverse final
resolution or the incurrence of significant costs could have a material adverse effect on our business, financial
condition and results of operations. See ""Our Business Ì Legal Matters'' for more information on these
matters.
An unfavorable outcome in the pending securities litigation against Infineon or the incurrence ofsignificant costs in the defense of this litigation may have a direct or indirect material adverse effect onour operations.
A consolidated putative class action lawsuit is pending against Infineon and its U.S. subsidiary, and two
of Infineon's officers, one of which is currently the chairman of our Supervisory Board, in U.S. federal court
on behalf of a putative class of purchasers of Infineon's shares who purchased them during the period from
March 2000 to July 2004. The plaintiffs allege violations of the U.S. securities laws arising out of an alleged
failure to disclose Infineon's alleged participation in DRAM price fixing activities and seek unspecified
damages. On May 22, 2006, the court denied part of the motions to dismiss this action but did not deny other
parts of the motions. On June 21, 2006, the court agreed to permit Infineon to move for reconsideration of the
May 22, 2006 order. On September 11, 2006, the court granted Infineon's motion for partial reconsideration
and dismissed Infineon, its principal U.S. subsidiary and its current and former officers from the complaint.
On October 11, 2006 the plaintiffs filed an amended complaint. In the contribution agreement we entered into
with Infineon, we agreed to share any future liabilities arising out of this lawsuit equally with Infineon,
including the cost of defending the suit.
Because this action is in its initial stages, we are unable to provide an estimate of the likelihood of an
unfavorable outcome to us or of the amount or range of potential loss arising from the action. An adverse final
resolution of the class action litigation could cause us to bear significant financial liability and other adverse
effects. Irrespective of the validity or the successful assertion of the securities claims, Infineon could incur
significant costs in connection with the defense of these claims, and we are required to indemnify Infineon for
one-half of these, as stated above. An adverse final resolution or the incurrence of significant costs could have
a material adverse effect on our business, financial condition and results of operations. Infineon's directors'
and officers' insurance legal carrier has denied coverage with respect to Infineon and the two officers that were
defendants in the class action and Infineon filed suit against the carrier in December 2005. See ""Our
Business Ì Legal Matters'' for more information on this matter.
We may not be able to protect our proprietary intellectual property or obtain rights to intellectualproperty of third parties needed to operate our business.
Our success depends on our ability to obtain and maintain patents, licenses and other intellectual property
rights covering our products and our design and manufacturing processes. The process of seeking patent
protection can be long and expensive. Patents may not be granted on currently pending or future applications
or may not be of sufficient scope or strength to provide us with meaningful protection or commercial
advantage. In addition, effective copyright and trade secret protection may be unavailable or limited in some
countries, and our trade secrets may be vulnerable to disclosure or misappropriation by employees, strategic
partners and other persons. See ""Ì Risks related to our carve-out as a stand-alone company and our
continuing relationship with Infineon Ì We may lose rights to intellectual property arrangements if Infineon's
ownership in our company drops below certain levels.''
Infineon transferred to us substantially all of the patents attributable to the Memory Products segment of
Infineon in connection with the carve-out of our company, while Infineon retained ownership of all other
Infineon patents. Qimonda's patent portfolio at the end of September 2006 included more than 20,000 patents
12
Global Reports LLC
and patent applications (representing more than 5,700 patent families) compared to more than 23,000 patents
and patent applications remaining with Infineon. Each of we and Infineon has granted the other a perpetual,
royalty free license to use these patents in each of our respective businesses. However, our rights to use these
patents are subject to the limitations and restrictions described in ""Our Business Ì Intellectual Property''.
We also may require rights to use patented technology owned by third parties, including other
semiconductor manufacturers, and have entered into licenses and cross-license agreements to obtain such
rights (ourselves or through Infineon). We anticipate that we will continue to enter into more of these
agreements in the future. If we are unable to enter into or renew our technology licensing agreements on
acceptable terms, or not at all, we may lose the legal right to use some of the processes we require to produce
our products, which may prevent us from manufacturing and selling some of our products, including our key
products. In addition, we could be at a disadvantage if our competitors obtain licenses for protected
technologies on more favorable terms than we do, or if we are unable to acquire on favorable terms any
licenses we require for patented technologies which we may determine we need to obtain from third parties in
order to maintain our competitive situation.
In addition, our rights to use some of these patents are currently based on cross-license agreements
between Infineon and those third parties. Some of these cross-license agreements will terminate with respect
to us if we cease to be a controlled subsidiary of Infineon. Although our own patent portfolio may provide us
with leverage in negotiating cross-license agreements with third parties, these agreements may be less
favorable to us than the agreements that Infineon was able to negotiate, based upon its larger patent and
product portfolios. If we are unable to protect our intellectual property, or retain or obtain the intellectual
property we need from third parties to operate our business, our business, financial condition and results of
operations could be materially and adversely affected.
We may be accused of infringing the intellectual property rights of others.
Our industry is characterized by a complex series of license and cross license agreements covering
technology used in our products and manufacturing processes and those of our competitors. Accordingly, other
companies have developed and will continue to develop technologies that are protected by patents and other
intellectual property rights and that we may require to manufacture our products. These technologies may
become unavailable to us or be offered to us only on unfavorable terms and conditions. In other cases, other
companies may claim technology as theirs and seek to force us to stop using it, even if we believe that we have
developed or otherwise have rights to exploit the technology in question. In either case, litigation, which could
require substantial financial and management resources, is often necessary to defend against claims of
infringement of intellectual property rights brought against us by others. In some cases, we might be able to
avoid or settle litigation on favorable terms because we in turn possess patents that we could assert against a
plaintiff or potential plaintiff. In other cases, the plaintiffs are engaged principally in the development and
licensing of technology, and do not require access to other parties' patent portfolios, in particular to the patents
required to manufacture products.
At any given time, Infineon and we are engaged in negotiations with a number of third parties regarding
assertions that technologies we are using infringe those parties' rights. Infineon and we are currently in
negotiations in a small number of matters of this nature. In part as a result of the complex series of license and
cross-license agreements and the uncertainty, time and expense of litigation, it is sometimes in our interests to
settle with these claimants in a way that avoids litigation. These settlements may nevertheless involve the
payment of license fees or royalties or other amounts over lengthy periods in amounts that could be material
for us. We have further agreed to bear 60% of the total license fee payments payable by Infineon and us to
which Infineon and we may agree in connection with two cases in which negotiations relating to licensing and
cross-licensing were ongoing at the time of the carve-out, one of which is still ongoing. The other has been
resolved in the meantime. We agreed to pay royalties for future periods only in amounts that are not now, and
that we expect will not be, material for us.
If any intellectual property infringement claims that may be asserted against us in the future are
successful, we may be forced to refrain from selling DRAM products in certain markets, seek to develop non-
13
Global Reports LLC

infringing technology, which may not be feasible, license the underlying technology upon economically
unfavorable terms and conditions, and/or pay damages for prior use of the technology at issue. In addition, our
insurance excludes liability arising out of claims that we have infringed the patent or other intellectual
property rights of third parties. Any of these results may have a material and adverse effect on our business,
financial condition and results of operations.
We may face difficulties in implementing next generations of our proprietary DRAM trench cellarchitecture.
We manufacture our products using our proprietary ""trench'' DRAM architecture. In 2005, approxi-
mately 27% of DRAM chips produced worldwide were manufactured using trench cell architecture, of which
we produced approximately half, according to Gartner. The remaining 73% were produced using different
kinds of an alternative architecture known as ""stack'' architecture. Although we believe that the physical
characteristics of trench cell technology can be exploited during the current and next several technology nodes
to yield advantages over the various stack architectures, this technology may not continue to perform as well
as, or better than, stack technology when migrating to smaller chip feature sizes. As part of our commitment
to the development of new products and process technologies, we must continually be reviewing the
technologies, architectures and processes we use to make sure that they have the technological properties and
robustness to permit volume manufacturing at competitive costs. If we were required to transition from trench
to stack cell technology, the transition would require a substantial period of time and a substantial investment
of capital, and may require us to acquire rights to additional technology.
To manufacture our trench cells, we need etching equipment that is specially modified to etch the deep
trench capacitors. We cannot be certain that equipment manufacturers will continue to develop and supply
such equipment on favorable terms, if at all.
We may face difficulties in shifting to new memory technologies that are not based on silicon
In the longer term, we face the potential risk of a fundamental shift from the silicon-based technology on
which the memory industry has long been based. Although we do not believe that any technology to rival
silicon-based memory is likely to prove feasible in at least the near- to medium-term, and although we devote
resources to basic research in order to keep abreast of a wide range of potential new memory technologies, the
fundamental technology of the semiconductor memory business may not continue to be broadly based on
current technology. We may be unable to respond quickly enough to any fundamental technological shift in
the industry. Our failure to implement successfully subsequent technology generations or respond to
technology developments may materially and adversely affect our business, financial condition and results of
operations.
We may misallocate our research and development resources or have insufficient resources to conduct thenecessary level of research and development to remain competitive.
We may also devote research and development resources to technologies or products that turn out to be
unsuccessful. Commitments to developing any new product must be made well in advance of sales, and
customer demands and technology may change while we are in development, rendering our products outdated
or uncompetitive before their introduction. We must therefore anticipate both future demand and the
technology features that will be required to supply such demand. If we incur losses as a result of a market
downturn or otherwise, we may not be able to devote sufficient resources to the research and development
needed to remain competitive. Our failure to properly allocate research and development resources could
materially and adversely affect our business, financial condition and results of operations.
14
Global Reports LLC

We have a limited number of suppliers of manufacturing equipment and raw materials, and our businesswould be harmed if they were to interrupt supply or increase prices.
Our manufacturing operations depend upon obtaining deliveries of the equipment used in our manufac-
turing facilities and adequate supplies of raw materials, including silicon wafers, masks, chemicals and resists,
at reasonable prices and on a timely basis.
Although there are multiple sources for most types of equipment that we use, the equipment is
sophisticated and complex and it is difficult for us to rapidly substitute one supplier for another or one piece of
equipment for another. We currently have only one significant sole-source equipment supplier, Advantest,
which supplies some of our testing equipment. If we were to experience supply or quality problems with
Advantest, it could take a long time for us to locate a secondary source of supply for that equipment.
The expansion of fabrication facilities by us, our joint venture counterparts, our foundry partners and
other semiconductor companies may put additional pressure on the supply of equipment. Shortages of
equipment could result in an increase in prices and longer delivery times. The lead time for delivery of some
equipment may be as long as six to twelve months. If we are unable to obtain equipment in a timely manner,
we may be unable to ramp up production according to our plan or fulfill our customer orders, which could
negatively impact our business, financial condition and results of operations.
We generally have more than one source available for raw materials, but materials meeting our standards
are in some cases available only from a limited number of vendors. The principal suppliers for our silicon
wafers are Siltronic, SEH, MEMC and SUMCO. Our revenues and earnings could decline if we were unable
to obtain adequate supplies of high-quality raw materials in a timely manner (for instance, due to interruption
of supply or increased industry demand) or if there were significant increases in the costs of raw materials that
we could not pass on to our customers. In addition, the raw materials we need for our business could become
scarcer or more expensive as worldwide demand for semiconductors and other products also produced with the
same raw materials increases. If we are unable to obtain sufficient raw materials in a timely manner, we may
experience interruptions in production, which could in turn, leave us unable to fulfill our customer orders,
which could negatively impact our business, financial condition and results of operations.
The success of our business may be dependent on our ability to maintain our third-party foundryrelationships.
In 2002, Infineon entered into agreements with each of SMIC, a Chinese foundry, and Winbond, a
Taiwanese foundry, for the production of some of our memory products in their fabs. In the 2006 financial
year, we sourced 22% of our DRAM capacity from these unaffiliated foundry partners and plan to maintain
approximately this level in the foreseeable future. We intend to source at least 50% of our production capacity
from our own facilities to enable us to continue to develop our manufacturing process technologies. There are
relatively few foundries that could manufacture our products, and we might not be able to secure an
agreement with an alternative foundry on acceptable terms, particularly in a period of industry-wide under-
capacity. In the event that manufacturing capacity is reduced or eliminated at one or more foundry facilities,
or if we are unsuccessful in negotiating additional capacity with our existing foundry partners or in obtaining
new foundry partners, we could have difficulties fulfilling our customer's needs, and our sales could decline.
Our reliance on third-party manufacturing relationships also subjects us to the following risks:
‚ the potential inability of our manufacturing partners to develop manufacturing methods appropriate for
our products;
‚ inability of our partners to construct and equip manufacturing facilities or to ramp up production in a
timely manner;
‚ unwillingness or inability of partners to devote adequate capacity to the manufacture of our products;
‚ potential product quality issues, where we do not have sufficient control to resolve them quickly or at
all;
15
Global Reports LLC
‚ our partners' inability to acquire manufacturing machinery and equipment required to manufacture our
products due to controls on the export or import of technology into the country where the partner is
located or limited supply of the necessary equipment; and
‚ reduced control over delivery schedules and product costs.
If any of these events, or others we have not foreseen, were to occur, we could experience an interruption
in our supply chain or an increase in costs, which could delay or decrease our sales or otherwise adversely
affect our business, financial condition and results of operations.
While building new capacity of our own would require significantly higher capital expenditures than
purchasing products from foundries, purchasing products from foundries may result in lower profit margins
than we could obtain by manufacturing the products on our own because we base the price we pay for wafers
from our foundry partners on a margin sharing principle. Therefore, in times of high DRAM prices, the prices
we pay for wafers produced by our foundry partners are likely to be higher than the cost of manufacturing
using our own capacities, resulting in lower profit margins.
If our strategic alliance partners or joint ventures fail to meet their business or technological goals wemay lose our investments in them, and we may fail to keep pace with the rapid developments in ourindustry.
As part of our strategy, we have entered into a number of long-term strategic alliances with leading
industry participants, both to manufacture memory products and to develop new manufacturing process
technologies and products. For example, we have entered into development agreements with Nanya to develop
the 75nm and 58nm process technology nodes and have formed a joint venture with Nanya called Inotera
Memories, Inc. to manufacture DRAM. We participate in a joint venture with Advanced Micro Devices and
Toppan Photomasks to develop and manufacture lithographic masks. We also established a joint venture with
China Singapore Suzhou Industrial Park Venture Co. in Suzhou, China pursuant to which we constructed a
facility for assembly and testing of our memory products. We expect that our investments in our Chinese joint
venture until the end of our 2009 financial year pursuant to our current contractual obligations will be
approximately 4132 million, and, if and when these projects are completed, we expect that our total
investments in them will total more than 4660 million.
These strategic relationships and joint ventures are subject to various risks that could cause us to lose the
value of these investments and damage our business. Some of those risks are:
‚ our alliance partners could encounter financial difficulties;
‚ our interests could diverge from those of our alliance partners in the future;
‚ we may not be able to agree with a joint venture or alliance partner on the amount or timing of further
investments in our joint projects;
‚ the management of one of our joint ventures may not be able to control costs;
‚ a joint venture may experience ramp up or manufacturing problems;
‚ a joint venture may experience delays or difficulties in reaching its research and development targets;
‚ political instability may occur in the countries where our joint ventures and/or alliance partners are
located; and
‚ economic instability, including currency devaluations or exchange rate fluctuations, may occur in the
countries where our joint ventures and/or alliance partners are located.
For example, the failure of Inotera Memories, Inc. to successfully reach and continue production at
anticipated output levels could leave us with inadequate capacity to meet customers' needs and our growth
targets. If any of our strategic alliances do not accomplish our intended goals, we may fail to keep pace with
the rapid technological developments in our industry, our revenues could be reduced and our business,
financial condition and results of operations could be materially and adversely affected.
16
Global Reports LLC
We may be unable to fund our research and development efforts and capital expenditures if we do nothave adequate access to capital.
We require significant amounts of capital to build, expand, modernize and maintain our sophisticated
manufacturing facilities and to fund our research and development efforts. For example, we invested
4686 million in property, plant and equipment during in the 2006 financial year, largely to ramp up our
manufacturing facility in Richmond, Virginia. We expect to invest between 4750 million and 4850 million in
capital expenditures in the 2007 financial year. Part of this is intended to be for the continued ramp-up of our
300mm facility in Richmond, Virginia and most of the remainder for improving productivity and upgrading
technology at existing facilities, especially at our 300mm facility in Dresden, Germany. Due to the lead times
between ordering and delivery of equipment, a substantial amount of capital expenditures typically is
committed well in advance. As of September 30, 2006, approximately 4379 million of capital expenditures
have been included in unconditional purchase commitments, mostly for investments to be made in our front-
end and back-end manufacturing facilities.
Because of the cyclical nature of DRAM demand, the need to invest in manufacturing facilities may arise
at a time when our cash flow from operations is low. We used net cash in our investing activities of
4971 million in the 2005 financial year and 4772 million in the 2006 financial year. Our research and
development expenses were 4390 million in the 2005 financial year and 4433 million in the 2006 financial
year. We plan to make additional research and development expenditures in the range of 4430 million to
4460 million during the 2007 financial year. We intend to continue to invest heavily in our manufacturing
facilities and research and development, while continuing the policy of cooperation with other semiconductor
companies to share these costs with us where appropriate.
As of September 30, 2006, our capitalization included 4151 million in external long-term debt resulting
from a dedicated financing for our manufacturing facility in Portugal and a note payable to a government
entity related to our production facility in Richmond, Virginia. We plan to service these financings from cash
generated from our operations beginning in 2008 and to refinance them upon their maturities in 2013 and
2027. We also have short-term intercompany loans payable to Infineon. As of September 30, 2006,
$435 million was drawn down under that loan. In August 2006, we executed a 4250 million syndicated
multicurrency revolving loan facility with a three year term, which may be extended for one additional year at
the option of the lenders at the end of the facility's first year of operation. As of September 30, 2006, no
amounts were outstanding under this facility.
In the future, we may not be able to raise the amount of capital required for our business or the
repayment of our existing financial obligations on acceptable terms due to a cyclical or other downturn in the
semiconductor memory products industry, general market and economic conditions, inadequate cash flow
from operations, unsuccessful asset management or other factors. Because of the high risk profile of DRAM
manufacturers (due largely to the volatility of the DRAM market cycle) and our lack of an independent credit
history, we may be unable to secure debt financing on acceptable terms. In general, our access to capital on
favorable terms may also be more limited now that we are a stand-alone entity than it was when we operated
as a segment of the Infineon Group. In particular, we no longer have access to Infineon's pool of capital. Our
business, financial condition and results of operations may be materially and adversely affected if we are not
able to fund necessary capital expenditures and research and development expenses.
If our manufacturing processes are delayed or disrupted, our business, financial condition and results ofoperations could be materially adversely affected.
We manufacture our products using processes that are highly complex and require advanced and costly
equipment that must continuously be maintained and modified to improve yields and performance when
implementing new technology generations. We may face interruptions due to human error in the operation of
the machines, power outages, earthquakes and other natural disasters or other incidences that have an impact
on the productive availability of machines, material or manpower. Difficulties encountered in the manufactur-
ing process can reduce production yields or interrupt production and may make it difficult for us to deliver
products on time or in a cost-effective, competitive manner.
17
Global Reports LLC

In addition, semiconductors must be produced in a tightly controlled, clean environment. Even small
impurities in the manufacturing materials, difficulties in the wafer fabrication process, defects in the masks
used to print circuits on a wafer, the use of defective raw materials, defective vendor-provided lead frames or
component parts, or other factors can cause a substantial percentage of wafers to be rejected or numerous
chips on each wafer to be non-functional. We may experience problems in achieving an acceptable yield rate
in the production of chips. Reduced yields will reduce our sales revenues, which could have a material adverse
effect on our business, financial condition and results of operations.
Our business can be hurt by changes in exchange rates.
Our business, financial condition and results of operations have been and may in the future be adversely
affected by changes in exchange rates, particularly between the euro and the U.S. dollar. We are exposed both
to the risk that currency changes will reduce our revenues or margins on the products we sell and the risk
arising in connection with the translation into euro of the results of subsidiaries using non-euro currencies. In
addition, we could lose money on the currency transactions, such as currency hedging contracts, that we use to
help us manage our exchange rate risk.
We prepare our combined and consolidated financial statements in euro. However, most of our sales
volumes, as well as costs relating to our design, manufacturing, selling and marketing, general and
administrative, and research and development activities are denominated in other currencies, principally the
U.S. dollar.
Memory products are generally priced worldwide in U.S. dollars, even if invoices are denominated in
another currency, while 58% of our expenses in our 2006 financial year were denominated in euro and other
currencies. In addition, the balance sheet impact of currency translation adjustments has been material in
some periods and varies widely, and we expect these characteristics to continue. Net foreign currency
derivative and transaction gains totalled 417 million in the 2005 financial year, while net foreign currency
derivative and transaction losses were 42 million in the 2006 financial year. We attempt to mitigate the effects
of foreign currency fluctuations on our business by entering into foreign currency hedging contracts. These
contracts can subject us to risks of losses if the values of the hedged currencies move in the opposite direction
from what we expected when we entered into the contracts.
Since its introduction in 1999, the euro has fluctuated in value against the U.S. dollar, ranging from a
high of 41.00 • $1.3625 on December 27, 2004 to a low of 41.00 • $0.8270 on October 25, 2000. The relative
weakness of the euro against the dollar positively affected our revenues and results of operations in the 2001
and 2002 financial years. Since the beginning of 2003, the dollar has weakened sharply against the euro, which
has had a substantial negative effect on our revenues and profitability, as reported in euro. The exchange rate
varied in the 2006 financial year between 41.00 • $1.1667 on November 14, 2005, and 41.00 • $1.2953 on
June 5, 2006. On September 29, 2006, the last currency trading day in September 2006, the noon buying rate
of the Federal Reserve Bank of New York for euro was 41.00 • $1.2687. Any further weakening of the dollar
against the euro would negatively affect our reported results of operations.
Our business could suffer as a result of negative economic developments, political instability, unfavorablelegal environments or negative currency developments in the different parts of the world in which weoperate, especially in Taiwan and the developing markets of China and Malaysia.
We operate in many locations around the world, with manufacturing, assembly and testing, and research
and development facilities in eight countries on three continents, including in Taiwan and the developing
markets of China and Malaysia. Manufacturing, assembly and testing sometimes take place in different
countries and even on different continents. In the 2006 financial year, 38% of our revenues were invoiced in
the Asia-Pacific region (including Japan), 42% were invoiced in North America, 19% were invoiced in Europe
(including Germany) and 1% were invoiced in other regions. See ""Our Business Ì Customers, Sales
18
Global Reports LLC

and Marketing''). In many cases, our products were shipped to different countries than those from which our
invoices were paid. Our business is subject to risks involved in international business, including:
‚ negative economic developments in foreign economies, in particular China, Malaysia and Taiwan,
where we have or share substantial manufacturing facilities;
‚ political instability, including the threat of war, terrorist attacks, epidemic or civil unrest, in particular
in Taiwan, which experiences recurring tensions with China;
‚ uncertainties as to the effectiveness of intellectual property protection, especially in China;
‚ devaluations of local currencies, especially in Asia;
‚ changes in laws and policies affecting trade and investment, including exchange controls and
expropriation, particularly in China; and
‚ varying laws and varying practices of the regulatory, tax, judicial and administrative bodies in the
jurisdictions where we operate, especially in developing Asian countries.
Any of these factors could have a material adverse effect on our business, financial condition and results
of operations.
Reductions in the amount of government subsidies we receive or demands for repayment could increaseour reported expenses.
As is the case with many other semiconductor companies, our reported expenses have been reduced in
recent years by various subsidies received from governmental entities. In particular, we have received, and
expect to continue to receive, subsidies for investment projects as well as for research and development
projects, including our 300mm manufacturing facility in Dresden, Germany, and our fab in Porto, Portugal.
We recognized governmental subsidies as a reduction of research and development and of cost of goods sold in
an aggregate amount of 4112 million in the 2006 financial year. In addition, we have received grants of
4179 million which are deferred and will be recognized in earnings over the useful life of the related assets in
future periods.
The availability of government subsidies is largely outside our control. We may not continue to benefit
from such support, sufficient alternative funding may not be available on a timely basis if necessary and any
alternative funding would probably be provided to us on terms less favorable to us than those we currently
receive. As a general rule, we believe that government subsidies are becoming less available in each of the
countries in which we have received funding in the past, and the competition for government funding is
intensifying.
The application for and implementation of such subsidies often involves compliance with extensive
regulatory requirements, including, in the case of subsidies to be granted within the European Union,
notification to the European Commission of the contemplated grant prior to disbursement. In particular,
establishment of compliance with project related ceilings on aggregate subsidies defined under European
Union law often involves highly complex economic evaluations. Many of the legal and other criteria for
receiving subsidies are more stringent than they were in the past. If we fail to meet applicable formal or other
requirements, we may not be able to receive the relevant subsidies or may be obliged to repay them, which
could have a material and adverse effect on our business, financial condition and results of operations.
In addition, the terms of certain of the subsidies we have received impose conditions that may limit our
flexibility to utilize the subsidized facility as we deem appropriate, to divert equipment to other facilities, to
reduce employment at the site, or to use related intellectual property outside the European Union. This could
impair our ability to operate our business in the manner we believe is most cost effective.
An inability to attract and retain skilled technical personnel could adversely impact our business.
Competition for qualified employees among companies that rely heavily on engineering and technology is
intense, and the loss of qualified employees or an inability to attract, retain and motivate additional highly
19
Global Reports LLC
skilled employees required for the operation and expansion of our business could hinder our ability to conduct
research activities successfully and to develop marketable products. The availability of highly skilled workers,
while generally constrained worldwide, is particularly constrained in places such as China where growth of this
sector of the economy is strong. Since our carve-out, we have been and will continue to compete directly with
Infineon for qualified personnel in certain geographic markets, which may make our recruitment and retention
efforts even more difficult.
Environmental laws and regulations may expose us to liability and increase our costs.
As with other companies engaged in similar activities, we face inherent risks of environmental liability in
our current and historical manufacturing activities. The manufacturing of semiconductors involves the use of
metals, solvents and other chemical substances that, if handled improperly, can cause damage to the
environment or to the people working with them. Recently, there has been increased media scrutiny and
reporting regarding a potential link between working in semiconductor manufacturing clean room environ-
ments and certain illnesses, primarily different types of cancers. Regulatory agencies and associations have
begun to study the issue to see if any actual correlation exists. While we have monitored our employees using
bio-monitoring programs since 1990, we cannot be certain that in the future no link between working in a
clean room environment and certain illnesses will be established.
Our operations are subject to many environmental laws and regulations wherever we operate that govern,
among other things, air emissions, wastewater discharges, the use and handling of hazardous substances, waste
disposal and the investigation and remediation of soil and ground water contamination. A recent directive in
the European Union known as Waste Electrical and Electronic Equipment Directive, or WEEE, imposes
""take-back'' obligations on manufacturers for the financing of the collection, recovery and disposal of
electrical and electronic equipment. The implementation of the WEEE directive has not been completed in
most EU Countries and therefore the potential costs are not yet foreseeable. As of September 30, 2006, we
had not put any WEEE-affected products directly onto the market. Once we do, we will comply with the
country specific laws.
The Registration, Evaluation and Authorization of Chemicals used in the European Union, or REACH
Regulation, is a regulatory framework that concerns the registration, evaluation and authorization of certain
chemicals. It is not yet clear which chemicals will fall under these regulations, although we believe the
regulation is targeted towards chemical companies and industries in which significant volumes of chemicals
are used. As we use very few chemicals whose volume exceeds 100 tons per year, we are classified as a
""downstream user category II'' under the current draft of the legislation. Further, the current draft contains a
proposal to exempt companies who meet certain standards from the authorization process. Due to these
uncertainties, we believe it is premature to estimate the potential costs this regulation could impose on us.
In 2006 a European directive on the Restriction of the use of Hazardous Substances, or RoHS, restricting
the usage of lead-based and other chemicals and compounds in products went into effect and we were
successful in limiting the cost impact of this new legislation upon our business. A similar set of rules is now
under discussion in the People's Republic of China and although we believe that this new law will largely
resemble the European model, this is by no means certain. The enactment of this new law may impose
additional costs upon our business or may have an effect on our ability to timely support customer demand for
our products in China.
Costs associated with future additional environmental compliance, with remediation obligations or the
costs of litigation if claims were made with respect to damages resulting from our operations or the former
operations of Infineon or Siemens at a site that we currently own or operate could have a material and adverse
effect on our business, financial condition and results of operations. For a further description of environmental
issues that we face, see ""Our Business Ì Environmental Protection, Safety and Health.'' For more informa-
tion on our ongoing relationship with Infineon, see ""Related Party Transactions and Relationships Ì With
Infineon'' and note 27 ""Related Parties'' to the combined and consolidated financial statements, and for more
information on our ongoing relationship with Siemens see ""Related Party Transactions and Relationships Ì
20
Global Reports LLC

With Siemens'' and note 27 ""Related Parties'' to the combined and consolidated financial statements
appearing elsewhere in this annual report.
Products that do not meet customer specifications or that contain, or are perceived to contain, defects orerrors or that are otherwise incompatible with their intended end use could impose significant costs on us.
The design and production processes for memory products are highly complex. It is possible that we may
produce products that do no meet customer specifications, contain or are perceived to contain defects or
errors, or are otherwise incompatible with their intended uses. We may incur substantial costs in remedying
such defects or errors, which could include material inventory write-downs. Moreover, if actual or perceived
problems with nonconforming, defective or incompatible products occur after we have shipped the products,
we might not only bear direct liability for providing replacements or otherwise compensating customers but
could also suffer from long-term damage to our relationship with important customers or to our reputation in
the industry generally. This could have a material adverse effect on our business, financial condition and
results of operations.
We may be unable to make desirable acquisitions or to integrate successfully any businesses we acquire.
Our future success may depend in part on the acquisition of businesses or technologies intended to
complement, enhance or expand our current business or products or that might otherwise offer us growth
opportunities. Our ability to complete such transactions may be hindered by a number of factors, including
potential difficulties in obtaining financing or in issuing our own securities as payment in acquisitions. In
particular, as long as Infineon is our majority shareholder, it will have substantial control over our ability to
incur certain debt or to issue equity, and may seek to limit any dilution of its interest in our company. In
addition, we may wish to avoid any securities issuances that would dilute Infineon's interest in our company
below the levels that would trigger adverse consequences under any intellectual property licenses or other
third-party agreements from which we benefit as a majority-owned subsidiary of Infineon.
Any acquisition that we do make would pose risks related to the integration of the new business or
technology with our business. We cannot be certain that we will be able to achieve the benefits we expect from
a particular acquisition or investment. Acquisitions may also strain our managerial and operational resources,
as the challenge of managing new operations may divert our staff from monitoring and improving operations in
our existing operations. Our business, financial condition and results of operations may be materially and
adversely affected if we fail to coordinate our resources effectively to manage both our existing operations and
any businesses we acquire.
We are subject to the risk of loss due to explosion and fire because some of the materials we use in ourmanufacturing processes are highly combustible.
We use highly combustible materials such as silane and hydrogen in our manufacturing processes and are
therefore subject to the risk of loss arising from explosion and fire which cannot be completely eliminated.
Although we maintain comprehensive fire and casualty insurance up to policy limits, including insurance for
loss of property and loss of profit resulting from business interruption, our insurance coverage may not be
sufficient to cover all of our potential losses. If any of our fabs were to be damaged or cease operations as a
result of an explosion and fire, it could reduce our manufacturing capacity and may cause us to lose important
customers.
Risks related to our carve-out as a stand-alone company and our continuing relationship with Infineon
We have limited experience operating as an independent company.
Our company was formed as a wholly-owned subsidiary of Infineon in May 2004 as Invot AG.
Substantially all of the assets and liabilities of the Memory Products segment of Infineon were contributed to
our company on May 1, 2006. This excluded the Memory Products operations in Korea and Japan, which
were placed in trust for us by Infineon pending their contribution and transfer. The operations in Korea were
transferred into an indirect wholly-owned subsidiary of our company in October 2006. The operations in Japan
21
Global Reports LLC

are governed by an agreement between us and Infineon under which sales and development personnel in the
region act for Qimonda. Legal transfer of Infineon's investment in the Inotera joint venture has been delayed
due to Taiwanese legal restrictions, while legal transfer of Infineon's investment in AMTC and BAC is subject
to approval by the other shareholders in the venture. Although we operated as a separate segment within the
Infineon Group, we had no experience in conducting our operations on a stand-alone basis until May 2006.
Our senior management had not previously worked together to manage a stand-alone company. We may
encounter operational, administrative and strategic difficulties as we adjust to operating as a stand-alone
company, which may cause us to react more slowly than our competitors to market conditions, may divert our
management's attention from running our business or may otherwise harm our operations. In addition, since
we only recently became a public company, our management team needs to develop the expertise necessary to
comply with the numerous regulatory and other requirements applicable to independent public companies,
including requirements relating to corporate governance, listing standards and securities and investor relations
issues. While we were, as a business within Infineon, indirectly subject to requirements to maintain an
effective internal control environment, and Infineon, as a U.S. listed company, is currently in the process of
ensuring that its own internal control procedures comply with the regulatory requirements, our management
will have to evaluate the applicability of those procedures to Qimonda in light of our new status as an
independent company, and to implement necessary changes to those procedures to account for that status. We
cannot guarantee that we will be able to do so in a timely and effective manner.
Finally, because we have not operated as an independent entity in the past, we may find that we need to
acquire assets in addition to those contributed to us in connection with our carve-out. We may also face
difficulty in integrating all of our assets. Our business, results of operations and financial condition could be
materially and adversely affected if we fail to acquire assets that prove to be important to our operations or if
we are not able to integrate all of our assets.
Our ability to operate our business effectively may suffer if we do not, quickly and cost-effectively,establish our own financial, administrative and other support functions in order to operate as a stand-alone company, and we cannot assure you that the transitional services Infineon has agreed to provide uswill be sufficient for our needs.
Historically, we have relied on financial, administrative and other resources of Infineon to operate our
business. In conjunction with our carve-out, we will need to create our own financial, administrative and other
support systems or contract with third parties to replace Infineon's systems, as well as the independent internal
controls referred to above. We have entered into agreements with Infineon under which Infineon provides
certain transitional services to us, including services related to information technology systems, treasury
functions and financial and accounting services. See ""Related Party Transactions and Relationships Ì With
Infineon'' for a description of these services. These services may not be sufficient to meet our needs, and, after
these agreements with Infineon expire, we may not be able to replace these services at all or obtain these
services at prices and on terms as favorable as we currently have. Any failure or significant downtime in our
own financial or administrative systems or in Infineon's financial or administrative systems during the
transitional period could impact our results and prevent us from paying our suppliers and employees, executing
foreign currency transactions or performing other administrative services on a timely basis and could
materially harm our business, financial condition and results of operations.
Our pre-carve-out financial information may not be representative of our results as an independentcompany.
The combined financial information included in this annual report for periods prior to the legal carve-out
of our company has been prepared on a carve-out basis. We have made numerous estimates, assumptions and
allocations in our financial information because Infineon did not account for us, and we did not operate, as a
single stand-alone business for any period prior to May 1, 2006. The historical financial information included
in this annual report for these periods does not reflect many significant changes that have occurred since we
have begun to operate as a separate company. The primary categories of assumptions we have made relate to
22
Global Reports LLC
our allocation of expenses that could not be specifically identified as belonging to the Memory Products
business.
Use of these assumptions and estimates means that the combined financial statements for periods prior to
our carve-out presented in this annual report are likely not to be representative of what our financial condition,
results of operations and cash flows would have been had we been a separate, stand-alone entity during the
periods presented. Furthermore, the combined financial statements cannot be used to forecast or predict our
future financial condition, results of operations or cash flows.
We may lose rights to intellectual property arrangements if Infineon's ownership in our company dropsbelow certain levels.
As a majority-owned subsidiary of Infineon, we are the beneficiary of some of Infineon's intellectual
property arrangements, including cross-licensing arrangements with other semiconductor companies and
licenses from third parties of technology incorporated in our products and used to operate our business. We
will no longer be a beneficiary under some of these agreements if Infineon's direct or indirect equity ownership
in our company no longer exceeds 50%.
With Infineon's support, we are engaged in negotiating assignments of existing agreements as well as our
own agreements and arrangements with some third parties for intellectual property and technology that is
important to our business and that was previously obtained through our relationship with Infineon. We may be
unable to enter into these agreements successfully. If we do not successfully conclude such agreements and
Infineon's direct or indirect equity ownership of our company no longer exceeds 50%, we may be exposed to
infringement claims or lose access to important intellectual property and technology. We may not then be able
to obtain or renegotiate licensing arrangements or supply agreements on favorable terms or at all. Qimonda's
patent portfolio at the end of September 2006 included more than 20,000 patents and patent applications
(representing more than 5,700 patent families) compared to more than 23,000 patents and patent applications
remaining with Infineon. This smaller patent portfolio may make it more difficult for us to negotiate third-
party patent cross licenses on terms that are as favorable to us as those previously negotiated by Infineon,
especially since partners under existing cross-license agreements with Infineon will generally be able to
continue to use patents transferred to us as part of the carve-out under these agreements even after Infineon's
ownership in us no longer exceeds 50%. If as a result we were to infringe intellectual property rights of others
or otherwise lose access to intellectual property or technology important in the conduct of our business, it
could have a material and adverse effect on our business, financial condition and results of operations. We
could, for example, be forced to agree to make substantially higher royalty payments to continue using that
intellectual property or technology or, if we are unable to agree on licensing terms on our own, could have to
cease manufacturing products that use that intellectual property or technology. For a detailed description of
the intellectual property rights contributed to us and retained by Infineon and the circumstances under which
our access to the rights retained by Infineon may be affected if we cease to be a controlled subsidiary of
Infineon, see ""Our Business Ì Intellectual Property.''
We may not be successful in establishing a brand identity.
We have not yet established a brand identity. Prior to our carve-out, all memory products sold by the
Infineon Group were sold under either the Infineon or AENEON» brand names. The Infineon and
AENEON» brand names are well known by memory customers, suppliers and potential employees. We will
need to expend significant time, effort and resources to continue to establish our brand name in the
marketplace. This effort may not be successful. If we are unsuccessful in establishing our brand identity, our
business, financial condition or results of operations may be materially adversely affected. We have applied for
protection of our QimondaTM brand as a trademark, domain and company name, but may not be successful in
actually gaining much protection at all or may only gain protection in some jurisdictions.
23
Global Reports LLC

We have and may continue to face increased administrative and related expenses as a result of operatingas an independent company.
As a business segment of the Infineon Group, we historically had access to a wide range of
administrative, financial, information technology, logistics and other services that are provided centrally to
Infineon Group companies. The combined financial statements included in this annual report for periods prior
to our carve-out do not reflect the additional costs of our operating as an independent company. Our
administrative expenses have increased since we became a stand-alone company, and may increase in the
future. This includes expenses for services that will continue to be provided by the Infineon Group pursuant to
services agreements at prices intended more closely to correspond to those obtainable among unrelated parties.
As a substantially smaller company, we may also lose the benefit of some economies of scale that Infineon was
able to achieve with respect to administrative operations.
In addition, during our 2004 financial year, ownership of the entire 200mm fab in Dresden was
transferred to Infineon's Communications segment. We continue to own the newer 300mm fab and the
research and development center in Dresden. We are currently in negotiations with Infineon regarding our use,
or acquisition, after September 30, 2007, of capacity at Infineon's 200mm manufacturing facility in Dresden.
If we stop using capacity or reduce our capacity requirement below a defined level, Infineon and we have
already agreed in principle that we will share equally any potential restructuring costs arising in connection
with one module.
We may experience increased costs resulting from a decrease in the purchasing power we havehistorically had as a segment of Infineon.
We have historically been able to take advantage of Infineon's size and purchasing power in procuring
goods, technology and services, including insurance, employee benefit support and audit services. Following
our carve-out from Infineon, we are a smaller and less diversified company than Infineon. Although we
anticipate that, while we are a majority-owned subsidiary of Infineon, we will be able to continue to take
advantage of many of these benefits, we cannot guarantee that this will continue to be the case. As a separate,
stand-alone company, we may be unable to obtain goods, technology and services at prices and on terms as
favorable as those available to us prior to the carve-out, which could have a material adverse effect on our
business, financial condition and results of operations.
Our agreements with Infineon relating to our carve-out may be less favorable to us than similaragreements negotiated between unaffiliated third parties.
We entered into our contribution and related agreements with Infineon while we were a wholly owned
subsidiary of Infineon, and they may be less favorable to us than would be the case if they were negotiated
with unaffiliated third parties. Pursuant to our contribution agreement with Infineon, we agreed to indemnify
Infineon for, among other things, liabilities arising from litigation and other contingencies related to our
business such as guarantee commitments, and assumed these liabilities as part of our carve-out from Infineon.
The allocation of assets and liabilities between Infineon and our company may not reflect the allocation that
would have been reached by two unaffiliated parties.
Infineon will initially control the outcome of shareholder actions in our company, and may thereby limitour ability to obtain additional financing or make acquisitions.
Infineon currently holds, directly or indirectly a 85.9% equity interest in Qimonda AG. Infineon has
advised us that it does not anticipate owning a majority of our shares over the long term. Its equity
shareholding gives it the power to control actions that require shareholder approval, including the election of
the four shareholder representatives on our Supervisory Board, which appoints our Management Board. Two
of the current Supervisory Board members elected by the shareholders are affiliated with Infineon.
Even if Infineon ceases to own or control more than 50% of our shares, for so long as it continues to have
a substantial equity interest in our company it may, as a practical matter, be in a position to control many or all
actions that require shareholder approval. Under German law, for so long as Infineon holds more than 25% of
24
Global Reports LLC

our shares, it will be in a position to block shareholder action on any capital increase or decrease, merger,
consolidation, spin-off, sale or other transfer of all or substantially all of our assets, a change in the corporate
form or business purpose of our company or the dissolution of our company.
Significant corporate actions, including the incurrence of material indebtedness or the issuance of a
material amount of equity securities, may require the consent of our shareholders. Infineon might oppose any
action that would dilute its equity interest in our company, and may be unable or unwilling to participate in a
future financing of our company. Infineon, as our majority shareholder, could block any such action and
thereby materially harm our business or prospects.
We may have conflicts of interest with Infineon and, because of Infineon's controlling ownership interestin our company, may not be able to resolve such conflicts on favorable terms for us.
Conflicts of interest may arise between Infineon and us in a number of areas relating to our past and
ongoing relationships. Potential conflicts of interest that we have identified include the following:
‚ Indemnification arrangements in connection with our carve-out from Infineon. We have agreed to
indemnify Infineon with respect to lawsuits and other matters as part of our carve-out from Infineon.
These indemnification arrangements could result in us having interests that are adverse to those of
Infineon, for example different interests with respect to settlement arrangements in a litigation matter.
In addition, under these arrangements, we agreed to reimburse Infineon for liabilities incurred
(including legal defense costs) in connection with certain litigation, while Infineon will be the party
prosecuting or defending the litigation.
‚ Employee recruiting and retention. Because we operate in many of the same geographical areas, we
expect to compete with Infineon in the hiring and retention of employees, in particular with respect to
highly-skilled technical employees. We have no agreement with Infineon that would restrict either
Infineon or us from hiring any of the other's employees.
‚ Members of our Supervisory Board and Management Board may have conflicts of interest. Certain
members of our Supervisory Board and Management Board own shares in Infineon or options to
purchase Infineon shares. In addition, two members of our Supervisory Board are members of the
Management Board or other senior management of Infineon. Mr. Fischl is CFO of Infineon and a
member of its Management Board and Mr. von Eickstedt is General Counsel of Infineon. These
relationships could create, or appear to create, conflicts of interest when these persons are faced with
decisions with potentially different implications for Infineon and us, even though these persons owe a
duty of loyalty to take into account only our interests.
‚ Sale of shares in our company. Infineon may decide to sell all or a portion of the shares that it holds
in us to a third party, including to one of our competitors, thereby giving that third party substantial
influence over our business and our affairs. Such a sale could be contrary to the interests of certain of
our stakeholders, including our employees or our public shareholders.
‚ Allocation of business opportunities. Business opportunities may arise that both we and Infineon find
attractive, and which would complement our respective businesses. Infineon may decide to take the
opportunities itself, which would prevent us from taking advantage of the opportunity ourselves.
Although our company is an independent entity, we expect to operate for as long as Infineon is our
majority shareholder as a part of the Infineon Group. Infineon may from time to time make strategic decisions
that it believes are in the best interests of its business as a whole, including our company. These decisions may
be different from the decisions that we would have made on our own. Infineon's decisions with respect to us or
our business may be resolved in ways that favor Infineon and therefore Infineon's own shareholders, which
may not coincide with the interests of our company's other shareholders. We may not be able to resolve any
potential conflicts and, even if we do so, the resolution may be less favorable to us than if we were dealing with
an unaffiliated party. Even if both parties seek to transact business on terms intended to approximate those
that could have been achieved among unaffiliated parties, this may not succeed in practice.
25
Global Reports LLC

Third parties may seek to hold us responsible for liabilities of Infineon that we did not assume in thecontribution agreement.
Pursuant to the contribution agreement we entered into with Infineon, Infineon agreed to retain all of its
liabilities that we do not expressly assume under that agreement. Liabilities we expressly assumed include
those arising out of legal matters that relate to the business that was transferred to us at the time of our carve-
out. See ""Our Business Ì Legal Matters'' for a description of the relevant indemnification provisions.
Third parties may seek to hold us responsible for Infineon's retained liabilities. Under the contribution
agreement, Infineon agreed to indemnify us for claims and losses relating to these retained liabilities.
However, if those liabilities are significant and we are ultimately held liable for them, we might not be able to
recover the full amount of our losses from Infineon.
We may experience difficulty in separating our assets and resources from Infineon.
We may face difficulty in separating our assets and resources from Infineon's assets and resources. We
are currently in negotiations with Infineon regarding our use, after September 30, 2007, of capacity at
Infineon's 200mm manufacturing facility in Dresden or our acquisition of that facility. We may have
unexpected costs or complications with this project, and there is no guarantee it will be completed
successfully. We have already agreed in principle with Infineon that we will share equally any potential
restructuring costs arising in connection with one module. Our business, financial condition and results of
operations could be harmed if we incur unexpected costs in separating our assets from Infineon's assets
relating to this matter or other aspects of the carve-out.
Risks related to the securities markets and ownership of our shares or ADSs
Sales of substantial numbers of shares or ADSs in the public market could adversely affect the marketprice of our securities.
Infineon currently holds, directly or indirectly, an 85.9% equity interest in Qimonda AG. Infineon does
not anticipate owning a majority of our shares over the long term. Infineon agreed not to sell or transfer any of
the remaining shares it holds until 190 days after the date of our IPO on August 9, 2006. However, sales of
substantial numbers of the shares of our company by Infineon, either in the public market or in private
transactions, or the perception that such sales may occur, could adversely affect the market price of the shares
and ADSs and could adversely affect our ability to raise capital through subsequent offerings of equity or
equity-related securities.
The price of our ADSs may be subject to wide fluctuations.
The trading price of our ADSs may fluctuate widely and may fall below the price at which ADSs were
sold in our IPO or below our net asset value. Among the factors that could affect the price of our ADSs are
the risk factors described in this section and other factors, including:
‚ the volatility of DRAM prices and therefore of our revenues;
‚ changes in market valuations of technology companies in general and memory product companies in
particular;
‚ variations in our operating results;
‚ changes in demand for, and supply of, our products;
‚ technological changes that hurt our competitive position;
‚ unfavorable developments in litigation or governmental investigations in which we are involved;
‚ strategic moves by us or our competitors, such as acquisitions or restructurings;
‚ failure of our quarterly operating results to meet market expectations;
26
Global Reports LLC

‚ changes in expectations as to our future financial performance, including financial estimates by
securities analysts;
‚ review of the long-term values of our assets, which could lead to impairment charges that could reduce
our earnings; and
‚ general market conditions.
Stock markets have experienced extreme volatility in recent years that has often been unrelated to the
operating performance of a particular company. These broad market fluctuations may adversely affect the
trading price of our securities.
Exchange rate fluctuations may reduce the amount of U.S. dollars you receive in respect of dividends orother distributions in respect of your ADSs.
Exchange rate fluctuations will affect the amount of U.S. dollars our shareholders receive upon the
payment of cash dividends or other distributions paid in euro, if any. Therefore, such fluctuations could also
adversely affect the value of our ADSs, and, in turn, adversely affect the U.S. dollar proceeds holders receive
from the sale of our ADSs.
You may not be able to participate in rights offerings and may experience dilution of your holdings as aresult.
We may from time to time distribute rights to our shareholders, including rights to acquire our securities.
Under the deposit agreement for the ADSs, the depositary will not offer those rights to ADS holders unless
both the rights and the underlying securities to be distributed to ADS holders are either registered under the
Securities Act or exempt from registration under the Securities Act with respect to all holders of ADSs. We
are under no obligation to file a registration statement with respect to any such rights or underlying securities
or to endeavor to cause such a registration statement to be declared effective. In addition, we may not be able
to take advantage of any exemptions from registration under the Securities Act. Accordingly, holders of our
ADSs may be unable to participate in our rights offerings and may experience dilution in their holdings as a
result.
If the depositary is unable to sell the rights that are not exercised or not distributed or if the sale is not
lawful or reasonably practicable, it will allow the rights to lapse, in which case you will receive no value for
these rights.
You may not be able to exercise your right to vote the ordinary shares underlying your ADSs.
Holders of ADSs may exercise voting rights with respect to the ordinary shares represented by our ADSs
only in accordance with the provisions of the deposit agreement. The deposit agreement provides that, upon
receipt of notice of any meeting of holders of our common shares, the depositary will, as soon as practicable
thereafter, fix a record date for the determination of ADS holders who shall be entitled to give instructions for
the exercise of voting rights. Upon timely receipt of notice from us, the depositary shall distribute to the
holders as of the record date (i) the notice of the meeting or solicitation of consent or proxy sent by us, (ii) a
statement that such holder will be entitled to give the depositary instructions and a statement that such holder
may be deemed, if we have appointed a proxy bank as set forth in the deposit agreement, to have instructed
the depositary to give a proxy to the proxy bank to vote the ordinary shares underlying the ADSs in accordance
with the recommendations of the proxy bank and (iii) a statement as to the manner in which instructions may
be given by the holders.
You may instruct the depositary of your ADSs to vote the ordinary shares underlying your ADSs but only
if we ask the depositary to ask for your instructions. Otherwise, you will not be able to exercise your right to
vote, unless you withdraw our ordinary shares underlying the ADSs you hold. However, you may not know
about the meeting far enough in advance to withdraw those ordinary shares. If we ask for your instructions, the
depositary, upon timely notice from us, will notify you of the upcoming vote and arrange to deliver our voting
materials to you. We cannot guarantee you that you will receive the voting materials in time to ensure that you
27
Global Reports LLC
can instruct the depositary to vote your ordinary shares. In addition, the depositary and its agents are not
responsible for failing to carry out voting instructions or for the manner of carrying out voting instructions.
This means that you may not be able to exercise your right to vote, and there may be nothing you can do if the
ordinary shares underlying your ADSs are not voted as you requested.
Under the deposit agreement for the ADS, we may choose to appoint a proxy bank in accordance with
the German Stock Corporation Act. In this event, the depositary will receive a proxy which will be given to the
proxy bank to vote our ordinary shares underlying your ADSs at shareholders' meetings if you do not vote in a
timely fashion and in the manner specified by the depositary.
The effect of this proxy is that you cannot prevent our ordinary shares underlying your ADSs from being
voted, and it may make it more difficult for shareholders to influence the management of our company, which
could adversely affect your interests. Holders of our ordinary shares are not subject to this proxy.
You may not receive distributions on our ordinary shares represented by our ADSs or any value for themif it is illegal or impractical to make them available to holders of ADSs.
The depositary of our ADSs has agreed to pay to you the cash dividends or other distributions it or the
custodian receives on our ordinary shares or other deposited securities after deducting its fees and expenses.
You will receive these distributions in proportion to the number of our ordinary shares your ADSs represent.
However, the depositary is not responsible if it decides that it is unlawful or impractical to make a distribution
available to any holders of ADSs. We have no obligation to take any other action to permit the distribution of
our ADSs, ordinary shares, rights or anything else to holders of our ADSs. This means that you may not
receive the distributions we make on our ordinary shares or any value from them if it is illegal or impractical
for us to make them available to you. These restrictions may have a material adverse effect on the value of
your ADSs.
You may be subject to limitations on transfer of your ADSs.
Your ADSs, which may be evidenced by ADRs, are transferable on the books of the depositary.
However, the depositary may close its books at any time or from time to time when it deems expedient in
connection with the performance of its duties. The depositary may refuse to deliver, transfer or register
transfers of your ADSs generally when our books or the books of the depositary are closed, or at any time if we
or the depositary think it is advisable to do so because of any requirement of law or government or
governmental body, or under any provision of the deposit agreement, or for any other reason.
The rights of shareholders in German companies differ in material respects from the rights ofshareholders of corporations incorporated in the United States.
Our company is incorporated in Germany, and the rights of our shareholders are governed by German
law, which differs in many respects from the laws governing corporations incorporated in the United States.
For example, individual shareholders in German companies do not have standing to initiate a shareholder
derivative action, either in Germany or elsewhere, including the United States unless they meet thresholds set
forth under German corporate law. Therefore, our public shareholders may have more difficulty protecting
their interests in the face of actions by our management, directors or controlling shareholders than would
shareholders of a corporation incorporated in a jurisdiction in the United States.
It may be difficult for you to bring any action or enforce any judgment obtained in the United Statesagainst our company or members of our Supervisory Board or Management Board, which may limit theremedies otherwise available to our shareholders.
Our company is incorporated in Germany and the majority of our assets are located outside the United
States. In addition, most of the members of our Supervisory Board, Management Board and other senior
management, named in this annual report, are nationals and residents of Germany. Most or all of the assets of
these individuals are located outside the United States. As a result, it may be difficult or impossible for you to
bring an action against us or against these individuals in the United States if you believe your rights have been
28
Global Reports LLC

infringed under the securities laws or otherwise. In addition, a German court may prevent you from enforcing
a judgment of a United States court against us or these individuals based on the securities law of the United
States or any state thereof. A German court may not allow you to bring an action in Germany against us or
these individuals based on the securities laws of the United States or any state thereof.
We have no present intention to pay dividends on our ordinary shares in the foreseeable future and,consequently, your only opportunity to achieve a return on your investment during that time is if theprice of our ADSs appreciates.
We have no present intention to pay dividends on our ordinary shares in the foreseeable future. No
earnings are available for distribution as a dividend for the 2006 financial year, since Qimonda AG, on a
standalone basis, as the parent company, incurred a cumulative loss (Bilanzverlust) as of September 30, 2006
despite our consolidated profit for the financial year. Any determination by our Supervisory and Management
Boards to pay dividends will depend on many factors, including our financial condition, results of operations,
legal requirements and other factors. Accordingly, if the price of our ADSs falls in the foreseeable future, you
will lose money on your investment, without the likelihood that this loss will be offset in part or at all by cash
dividends.
29
Global Reports LLC

SELECTED COMBINED AND CONSOLIDATED FINANCIAL DATA
The following table presents selected historical combined and consolidated financial data for the years
indicated. We derived the selected combined and consolidated financial data as of and for the years ended
September 30, 2004, 2005 and 2006 from our combined and consolidated financial statements for those years.
These combined and consolidated financial statements have been audited by our independent registered public
accounting firm, KPMG Deutsche Treuhand-Gesellschaft Aktiengesellschaft Wirtschaftspr ufungsgesell-
schaft, whom we refer to as KPMG, and are included elsewhere in this annual report. We derive the selected
combined financial data as of and for the year ended September 30, 2003 from our unaudited combined
financial statements for that year. In the opinion of our management, these unaudited combined financial
statements include all adjustments necessary to present fairly the financial information for the period they
represent.
We have been a segment of Infineon for all of the periods indicated. Infineon did not allocate most non-
operating financial statement line items among its segments during that time. We have not prepared complete
selected combined financial data reflecting these items as of and for the financial year ended September 30,
2002 because of the significant cost and effort involved with properly preparing, compiling and verifying all the
financial information needed to present our complete results of operations and financial position as a stand-
alone-company for periods so long ago. We derived the selected financial data for the financial year ended
September 30, 2002 from Infineon's reported data of its Memory Products segment for that period. This
financial data was prepared in accordance with US-GAAP and on a basis consistent with the financial data for
the later periods we have presented. Infineon contributed our business to our company on May 1, 2006. We
refer to this contribution as our carve-out. Our combined financial information for all periods before the date
of our carve-out from Infineon may not be representative of what our results would have been had we been a
stand-alone company during any of those periods. In addition, historical results are not necessarily indicative
of the results that you may expect for any future period.
In particular, the combined financial statements do not reflect estimates of one-time and ongoing
incremental costs required for us to operate as a separate company. Infineon allocated to our company costs it
incurred relating to research and development, logistics, purchasing, selling, information technology, employee
benefits, general corporate functions and other costs. General corporate functions include accounting, treasury,
tax, legal, executive oversight, human resources and other services. These and other allocated costs totalled
4203 million for our 2006 financial year before the carve-out date, 4305 million for our 2005 financial year and
4387 million for our 2004 financial year. Following our carve-out from Infineon, we are responsible for
substantially all of these items, subject to Infineon's continued provision of some of these services pursuant to
service agreements. These agreements are described in ""Related Party Transactions and Relationships Ì
With Infineon''. Had we been incurring these costs directly during these periods before the carve-out, they
may have been materially different than the allocated amounts in the combined financial statements.
30
Global Reports LLC

As of and for the financial year ended September 30,
2002 2003 2004 2005 2006 2006(2)
(Unaudited)(1) (Unaudited) (Unaudited)(in millions, except share and per share data)
Selected Combined and ConsolidatedStatement of Operations data:
Net sales ÏÏÏÏÏÏÏÏÏÏÏÏÏÏÏÏÏÏÏÏÏÏÏÏÏÏÏ 41,971 4 2,544 4 3,008 4 2,825 4 3,815 $ 4,840Cost of goods sold ÏÏÏÏÏÏÏÏÏÏÏÏÏÏÏÏÏÏÏ 2,106 2,090 2,063 2,164 3,048 3,867
Gross (loss) profit ÏÏÏÏÏÏÏÏÏÏÏÏÏÏÏÏÏÏÏ (135) 454 945 661 767 973Research and development expenses ÏÏÏÏ 311 298 347 390 433 549Selling, general and administrative
expensesÏÏÏÏÏÏÏÏÏÏÏÏÏÏÏÏÏÏÏÏÏÏÏÏÏÏ 179 209 232 206 215 273Restructuring chargesÏÏÏÏÏÏÏÏÏÏÏÏÏÏÏÏÏ 7 3 2 1 Ì ÌOther operating expenses (income), net (6) 16 194 13 60 76
Operating (loss) income ÏÏÏÏÏÏÏÏÏÏÏÏÏÏ (626) (72) 170 51 59 75Interest income (expense), netÏÏÏÏÏÏÏÏÏ (35) (30) (7) (25) (32)Equity in earnings (losses) of associated
companies ÏÏÏÏÏÏÏÏÏÏÏÏÏÏÏÏÏÏÏÏÏÏÏÏ 22 (16) 45 80 102Gain (loss) on associated company share
issuance ÏÏÏÏÏÏÏÏÏÏÏÏÏÏÏÏÏÏÏÏÏÏÏÏÏÏ (2) 2 Ì 72 92Other non-operating income (expense),
net ÏÏÏÏÏÏÏÏÏÏÏÏÏÏÏÏÏÏÏÏÏÏÏÏÏÏÏÏÏÏ 56 (11) 13 8 10Minority interests ÏÏÏÏÏÏÏÏÏÏÏÏÏÏÏÏÏÏÏÏ 11 17 2 (6) (8)
Income (loss) before income taxes ÏÏÏÏÏ (20) 132 104 188 239Income tax expense ÏÏÏÏÏÏÏÏÏÏÏÏÏÏÏÏÏÏ (55) (211) (86) (114) (145)
Net (loss) income ÏÏÏÏÏÏÏÏÏÏÏÏÏÏÏÏÏÏÏ 4 (75) 4 (79) 4 18 4 74 $ 94
Net (loss) income per share and ADS(unaudited)(3):Basic and diluted ÏÏÏÏÏÏÏÏÏÏÏÏÏÏÏÏÏÏ 4 (0.25) 4 (0.26) 4 0.06 4 0.24 $ 0.30
Number of shares used in earnings pershare computation(3):Basic and diluted (in thousands) ÏÏÏÏÏ 300,000 300,000 300,000 305,984 305,984
Summary Combined and ConsolidatedBalance Sheet data:
Cash and cash equivalentsÏÏÏÏÏÏÏÏÏÏÏÏÏ 4 544 4 577 4 632 4 932 $ 1,182Marketable securities ÏÏÏÏÏÏÏÏÏÏÏÏÏÏÏÏÏ 23 2 Ì 138 175Working capital, net(4)ÏÏÏÏÏÏÏÏÏÏÏÏÏÏÏÏ 787 78 437 1,328 1,684Total assets ÏÏÏÏÏÏÏÏÏÏÏÏÏÏÏÏÏÏÏÏÏÏÏÏÏ 4,634 4,750 4,861 5,861 7,436Short-term debt, including current
portion of long-term debt ÏÏÏÏÏÏÏÏÏÏÏ 51 551 524 344 435Long-term debt, excluding current
portion ÏÏÏÏÏÏÏÏÏÏÏÏÏÏÏÏÏÏÏÏÏÏÏÏÏÏÏ 516 27 108 151 192Business/shareholders' equity ÏÏÏÏÏÏÏÏÏÏ 2,736 2,779 2,967 3,871 4,911Summary Combined and Consolidated
Cash Flow data:Net cash provided by operating activities 4 300 4 693 4 483 4 297 $ 377Net cash used in investing activities ÏÏÏÏ (242) (1,048) (971) (772) (981)Depreciation and amortization ÏÏÏÏÏÏÏÏÏ 815 752 528 703 892
(1) Figures for 2002, other than those provided, are not available without undue effort to properly prepare, compile and verify all the
financial information needed to present the complete results of operations and financial position as a stand-alone company for periods
so long ago.
(2) Translated into U.S. dollars solely for convenience of the reader at the rate of 41.00 • $1.2687, the noon buying rate of the Federal
Reserve Bank of New York for euro on September 29, 2006, the last currency trading day in September 2006.
(3) Before the carve-out, the Memory Products business was wholly owned by Infineon, and there were no earnings (loss) per share for
our company. Following the carve-out, earnings (loss) per share reflects the contributed capital structure and the additions due to the
IPO for all periods presented.
(4) Calculated by subtracting current liabilities from current assets.
31
Global Reports LLC

OPERATING AND FINANCIAL REVIEW
This discussion and analysis of our financial condition and results of operations is based on, and shouldbe read in conjunction with, our audited combined and consolidated financial statements as of and for theyears ended September 30, 2004, 2005 and 2006 and the accompanying notes and the other financialinformation included elsewhere in this annual report. We have prepared our combined and consolidatedfinancial statements in accordance with accounting principles generally accepted in the United States ofAmerica (""U.S. GAAP'').
This discussion and analysis of our financial condition and results of operations contains forward-looking
statements. Statements that are not statements of historical fact, including expressions of our beliefs and
expectations, are forward-looking in nature and are based on current plans, estimates and projections.
Forward-looking statements are applicable only as of the date they are made, and we undertake no obligation
to update any of them in light of new information or future events. Forward-looking statements involve
inherent risks and uncertainties. We caution you that a number of important factors could cause actual results
or outcomes to differ materially from those expressed in any forward-looking statement. These factors include
those identified under the headings ""Risk Factors'' and ""Forward-Looking Statements and Market Data''.
Executive Summary
Effective May 1, 2006, Infineon contributed substantially all of the assets, liabilities, operations and
activities, as well as the employees, of its former Memory Products segment to us. On August 9, 2006 we
completed our IPO on the New York Stock Exchange through the issuance of 42 million ordinary shares,
which are traded as American Depositary Shares (ADSs) under the symbol QI. We intend to use the offering
proceeds of 4 415 million, net of offering costs and tax benefits thereon, to finance investments in our
manufacturing facilities and for research and development; some of these proceeds have already been used in
investment and R&D activities and for working capital purposes since our IPO. The remainder is being held in
cash, cash equivalents and marketable securities pending application. In addition, Infineon sold 6.3 million
shares upon exercise of the underwriters' over-allotment option, which reduced its shareholding in the
Company to 85.9%.
Our financial performance in our financial years ended September 30, 2005 and 2006 as shown by the
combined and consolidated financial statements we prepared in connection with the carve-out, demonstrated
important elements of the strategy we are adopting in response to developments in our industry.
Compared to the 2005 financial year, we accelerated the growth of the volume of memory we sold, based
on bits of data storage (which we refer to as our bit shipments), during our 2006 financial year mainly due to
the ramp-up of additional capacities and increased sourcing of chips from our foundry partners. As a
consequence, we achieved bit shipment growth of 79% in the 2006 financial year, which was well above the
market growth rate of 43%, as reported by WSTS, thereby increasing our market share in the DRAM market.
During our 2006 financial year we accelerated the shift of our product mix towards the relatively higher priced
graphics, mobile and infrastructure DRAM products. While our average selling prices declined overall, this
change in product mix caused this decline to be smaller than it would have been had our product mix
remained unchanged. Our average per-megabit selling prices (expressed in U.S. dollars) were 20% lower in
the 2006 financial year than in the 2005 financial year. In our 2005 financial year this decline was 27%
compared to our 2004 financial year. These price declines were offset by significantly higher bit shipment,
which led to the strong improvement in our net sales in our 2006 financial year. Whereas in our 2005 financial
year the depreciation of the U.S. dollar against the euro exacerbated the effects of these price declines, in our
2006 financial year, the U.S. dollar gained slightly against the euro, which had a positive effect on our net
sales.
Despite the continuous price pressure, we were able to retain positive operating income in our 2005 and
2006 financial years as we focused on our strategic direction. We increased the share of our production based
on 300mm wafers to approximately 68% in the 2006 financial year and enhanced our productivity in other
ways, primarily through conversion of capacities to the 110nm process node in the 2005 financial year and to
the 90nm process node in the 2006 financial year. Late in the 2006 financial year, we began commercial
32
Global Reports LLC

production based on the 75nm node. Our net income was 474 million in our 2006 financial year, compared to
418 million in our 2005 financial year and a net loss of 479 million in the 2004 financial year.
During the first three months of the 2006 financial year the DRAM market experienced a very
substantial price decline in DDR2 DRAM products due to a mismatch between the high volume of DDR2
memories being produced and other semiconductor manufacturers' lower supply of logic chipsets compatible
with them. This led to a significant loss in the first quarter. However, the market situation improved markedly
in the months thereafter. Combined with the effects described above, our increasing proportion of higher
priced products resulted in improved profitability, especially in the fourth quarter. Consequently, we ended the
2006 financial year with substantially higher sales and net income than we generated in our 2005 financial
year.
We continued to generate significant amounts of cash from operations. We invested this cash together
with proceeds from our IPO in our manufacturing facilities, as we continued our migration to 300mm wafers
and the 90nm process node.
Overview
Business Overview
We are one of the world's leading suppliers of semiconductor memory products. We design semiconduc-
tor memory technologies and develop, manufacture, market and sell a large variety of semiconductor memory
products on a chip, component and module level. For the first time in the quarter ended March 31, 2006, we
were the world's second largest supplier of DRAM by revenues and bit shipment, with a market share of
approximately 17%. In the quarter ended June 30, 2006, we maintained our position as the world's second
largest supplier of DRAM by revenue, with a market share of approximately 16%, and we were the third
largest supplier based on bit shipment, according to industry research firm Gartner. Although our market
share fluctuates, and we may lose market share quarter-to-quarter or year-to-year as we did in the fourth
quarter of the 2005 calendar year and in 2005 overall, in each of those five years, we remained among the four
largest DRAM suppliers worldwide based on revenues. In each of the past five calendar years, we captured
between 9% and 15% of the worldwide DRAM market based on revenues, according to Gartner.
Our principal products are DRAM components and modules for use in a wide variety of electronic
products. In our 2006 financial year 47% of our net sales were of standard DRAMs for use in PC, notebook
and workstation applications, while 50% were of DRAM products for more advanced infrastructure
applications and graphics, mobile and consumer DRAMs. Flash memory, other products and licensing
revenue accounted for the remaining 3%. In our financial year ended September 30, 2005, 51% of our net sales
were of standard DRAMs for use in PC, notebook and workstation applications, 38% were of DRAM products
for more advanced infrastructure applications and graphics, mobile and consumer DRAMs and flash memory,
other products and licensing revenues accounted for the remaining 11%. For the financial year ended
September 30, 2006, our net sales were 43,815 million, our EBIT was 4213 million and our net income was
474 million. For the financial year ended September 30, 2005, our net sales were 42,825 million, our EBIT was
4111 million and our net income was 418 million.
Our Carve-Out from Infineon
On November 17, 2005, Infineon announced its intention to separate its Memory Product business from
the remainder of its activities and place the Memory Products business in a stand-alone legal structure, with
the preferred goal of conducting a public offering of the shares of the new company. For this purpose,
substantially all of the assets, liabilities, operations and activities, as well as the employees, of Infineon's
former Memory Products segment were contributed to us effective May 1, 2006. This excluded the Memory
Products operations in Korea and Japan, which were placed in trust for us by Infineon pending their
contribution and transfer. The operations in Korea were transferred into an indirect wholly-owned subsidiary
of our company in October 2006. The operations in Japan are governed by an agreement between us and
Infineon under which sales and development personnel in the region act for Qimonda. While Infineon's
investment in the Inotera joint venture and Infineon's investment in the Advanced Mask Technology Center
33
Global Reports LLC
(AMTC) and the Maskhouse Building Administration Company (BAC) in Dresden have been contributed
to us, the legal transfer of these investments is not yet effective. In the case of Inotera, Taiwanese legal
restrictions have delayed the legal transfer, although an exemption from these restrictions has been granted
and we expect the transfer to be completed by the end of the 2006 calendar year. In the case of Infineon's
investment in the Dresden AMTC and BAC, Infineon's co-venturers have not yet given the required consent
to the transfer of the AMTC and BAC interest, although pursuant to the AMTC and BAC limited partnership
agreements, such consent may not be unreasonably withheld. Infineon is obligated under the contribution
agreement and a separate trust agreement with us to hold the Inotera shares in trust for us and exercise
shareholder rights, including board appointments and voting, at our instruction, while the AMTC and BAC
interest is held for our economic benefit pursuant to the contribution agreement. For as long as Infineon holds
our interest in Inotera, AMTC and BAC, we must exercise our shareholder rights through Infineon, which is a
more cumbersome and less efficient method of exercising these rights than if we held the interest directly. We
do not expect these administrative complexities to have a material adverse effect on our business, financial
condition and results of operations. We refer to the former segment's assets, liabilities, operations and
activities as the ""Memory Products business''. Infineon owns 85.9% of our company as of September 30, 2006.
Basis of Presentation of Our Combined Financial Statements
Our combined and consolidated financial statements have been prepared in accordance with U.S. GAAP.
They are presented on a ""carve-out'' or combined basis for all periods prior to our carve-out and comprise the
combined historical financial statements of the transferred Memory Products business assuming that we had
existed as a separate legal entity for all of the financial periods presented. Our financial statements are
presented on a consolidated basis for all periods thereafter. The combined financial statements have been
derived from the consolidated financial statements and historical accounting records of Infineon, employing
the methods and assumptions we describe below and in note 1 to the combined and consolidated financial
statements. Most of the assets, liabilities, operations and activities of the Memory Products business are those
that comprised the Memory Products segment of Infineon during the financial periods presented.
Methodology. Infineon took two broad steps to reflect the structure of the Memory Products business in
the historical financial data for the periods presented in this annual report. The first step was to determine
which companies and business areas of Infineon belong to the Memory Products business. The second step
was to combine these companies and business areas for accounting purposes.
The combined financial statements differ from the segment data in Infineon's consolidated financial
statements in terms of their stated objectives as well as in aspects of the information they convey. The
objective of Infineon's segment reporting was to present its Memory Products business as an integral part of
Infineon. Infineon historically allocated most financial statement items among its segments, including the
Memory Products segment. However, for purposes of reporting segment data, Infineon did not allocate some
items among its various segments, including certain corporate overhead costs that supported Infineon's
businesses overall, including the Memory Products business. The combined financial statements are intended
to present the Memory Products business on a ""carve-out'' basis, which means as if it had been a separate
legal entity during all of the periods presented in this annual report. In other words, the combined financial
statements present our historical financial condition, statements of operations and cash flows based on the
fictitious assumption that our structure as it stands after the carve-out had already existed in the past. The
combined financial statements therefore reflect further allocations to us, consistent with our post-carve-out
operation as a separate legal entity.
Statements of Operations. The combined statements of operations reflect all revenues and expenses that
were attributable to the Memory Products business. Operating expenses or revenues of the Memory Products
business that could be specifically identified as pertaining to the Memory Products business were charged or
credited directly to it without allocation or apportionment. This was the case for all of the revenues appearing
on the combined statements of operations. Operating expenses that could not be specifically identified as
pertaining solely to the Memory Products business were allocated to us to the extent they were related to us.
The combined statements of operations include expense allocations for certain corporate functions historically
provided to us by Infineon, including basic research costs, employee benefits, incentives and pension costs,
34
Global Reports LLC

interest expense, restructuring costs, the costs of our share of central departments such as finance and treasury
and controlling and other costs. These allocations were made on a specifically identifiable basis or using the
relative percentages, as compared to Infineon's other businesses, of total sales, cost of goods sold, other cost
measures, headcount or other reasonable methods. We and Infineon considered these allocations to be a
reasonable reflection of the utilization of services provided. Our expenses as a separate, stand-alone company
may be higher or lower than the amounts reflected in the statement of operations for historical periods. We
describe the allocation methods we used in note 1 to the combined and consolidated financial statements.
Balance Sheets. As a general rule, the assets and liabilities attributable to the Memory Products
business were contributed to us at their historical book values as shown in Infineon's balance sheet. Unless
otherwise noted, all assets and liabilities specifically identifiable as pertaining to the Memory Products
business are included in the combined financial statements. Where legal entities and their businesses are
wholly allocable to the Memory Products business, the shares of these entities were transferred to the Memory
Products business. In some cases, including at the Infineon parent company level, the memory-related assets
and liabilities were identified and carved out by means of asset and liability transfer transactions.
The assets and liabilities that were directly identifiable as pertaining to Infineon's Memory Products
business include inventories, fixed assets and accounts receivable. The assumptions and allocations used for
assets and liabilities that were not specifically identifiable as being part of Infineon's Memory Products
business are set forth in note 1 to the combined and consolidated financial statements.
Investments by and Advances from Infineon and our Capital Structure. Because a direct ownership
relationship did not exist among the various entities comprising the Memory Products business prior to our
carve-out, Infineon's investments in and advances to the Memory Products business represent Infineon's
interest in the recorded net assets of the Memory Products business. These are shown as business equity in lieu
of shareholder's equity in the combined financial statements. All intercompany transactions, including
purchases of inventory and charges and cost allocations for facilities, functions and services performed by
Infineon for the Memory Products business, are reflected in this business equity. After we became a separate
company and Infineon contributed the Memory Products business to us, this business equity in the amount of
43,372 million became our shareholders' equity.
Capital Structure. The Memory Products business has historically relied on Infineon to provide
financing of its operations. Because we have historically used more cash in our investing activities than we
have generated through our operations, we have historically relied on Infineon to provide a portion of the
financing necessary to fund our capital expenditures. These financings are reflected in our short-term debt
(which reflected 4524 million of interest-bearing advances to us from Infineon at September 30, 2005) and in
our business equity. The capital structure attributed to the Memory Products business in connection with the
preparation of the combined financial statements is based on the business equity concept and shows only
4108 million of independent financing on our combined balance sheet as of September 30, 2005. As such, it is
not indicative of the capital structure that the Memory Products business would have required had it been an
independent company during the financial periods presented.
The preparation of the accompanying combined and consolidated financial statements required us to
make estimates and assumptions, as described in ""Ì Critical Accounting Policies'' below. We believe that the
estimates and assumptions underlying the combined financial statements are reasonable. However, the
combined financial statements included herein may not necessarily reflect our results of operations, financial
position and cash flows in the future or what our results of operations, financial position and cash flows would
have been had we been a separate, stand-alone company during the periods presented.
Factors that Affect our Results of Operations
Relationship between DRAM prices and reduced unit costs
The average selling prices of standard DRAMs and, to a certain extent, other semiconductor memory
products, have generally declined throughout the semiconductor memory products industry during the past ten
years. We expect them to continue to do so in future periods irrespective of industry-wide fluctuations as a
35
Global Reports LLC

result of, among other factors, technological advancements and cost reductions. Although we may from time
to time be able to take advantage of higher selling prices typically associated with new products and
technologies, we nevertheless expect the prices of new products to also decline over time, in certain cases very
rapidly, primarily as a result of market competition. We have adopted enhancements to our technology to
reduce our per-megabit manufacturing costs. These efforts have included the introduction of new technology
such as smaller feature sizes and manufacturing using 300mm wafers. We expect that these measures will
enable us to reduce our costs per chip and thereby offset declining chip prices. We will realize the full effects
of these manufacturing unit cost reductions after our conversion to the 90nm technology node is complete and
we have fully ramped up our 300mm wafer production in Richmond, Virginia and our back-end production in
Suzhou, China. In the meantime, we are incurring higher per-unit costs in connection with this conversion and
ramp-up which is expected to extend through the 2007 financial year. We have also increased our production
in Asia, where we can take advantage of lower-cost economies. Our margins are to a significant extent
dependent on the extent to which we can reduce our unit manufacturing costs as prices decline.
Relationship between the Capital Intensive Nature of our Business and the Industry's Cyclicality
Declining prices have driven manufacturers, including ourselves, to invest substantial sums to shrink die
sizes and to construct modern manufacturing facilities that permit the manufacture using larger wafers at
lower costs per chip. We have made significant investments, individually and together with the other
companies with which we cooperate, to meet the challenges these lower prices have brought. We invested a
total of 4686 million during our 2006 financial year and a total of 4926 million in our 2005 financial year in
property, plant and equipment, mainly related to our 300mm fab in Richmond, Virginia. As a result of this
investment, we have substantially increased our ratio of bits manufactured using 300mm wafers to the point
where we believe we are ahead of our major competitors on this measure. However, as we continue to ramp up
our 300mm capacity, many of our competitors are expanding their own capacities. To the extent that demand
for DRAM does not keep pace with these capacity increases, an oversupply situation could arise in the
industry, as has occurred on a cyclical basis in the past.
Exchange Rate Fluctuations
We are subject to two categories of exchange rate risks, transaction and translation risk.
Transaction risk arises where sales of a product are generated in one currency but costs relating to those
revenues are incurred in a different currency. In the case of transaction risk, changes in the value of the euro
relative to the U.S. dollar and other currencies generally have interrelated consequences. For example, an
increase in the value of the euro relative to the U.S. dollar and other currencies generally has these effects:
‚ our margins (in euros) decline or become negative to the extent our costs were incurred in euros and
the sales were generated in currencies weaker than the euro, and
‚ our competitiveness may decline as compared with competitors based in the countries with weaker
currencies because our products manufactured in Europe will have been produced at constant costs (in
euro) while their (constant) costs denominated in weaker currencies will appear to have declined.
Conversely, a decrease in the value of the euro relative to the U.S. dollar and other currencies generally
has these effects:
‚ our margins (in euros) increase to the extent our costs were incurred in euros and the sales were
generated in currencies stronger than the euro, and
‚ our competitiveness may increase as compared with competitors based in the countries with stronger
currencies because our products manufactured in Europe will have been produced at constant costs (in
euro) while their (constant) costs denominated in stronger currencies will appear to have increased.
We prepare our combined and consolidated financial statements in euro. However, most of our sales
volumes, as well as many of our worldwide costs, primarily those relating to our design, manufacturing, selling
and marketing, general and administrative, and research and development activities, are denominated in other
36
Global Reports LLC
currencies, principally the U.S. dollar. The portions of our sales and costs denominated in currencies other
than the euro are exposed to exchange rate fluctuations in the values of these currencies relative to the euro. If
our non-euro denominated expenses do not match our non-euro denominated sales, this currency difference
may have an adverse effect on our operating result.
Over time, transaction risk could adversely affect our cash flows and results of operations to the extent we
are unable to reflect changes in exchange rates in the pricing of the products in local currency. Given our
revenue and expense structure, in which most of our revenues are denominated in dollars but a substantial
portion of the costs relating to those revenues are in euro, we experienced pressure, on our gross margin in
particular, in our 2004, 2005 and 2006 financial years as a result of transaction risk. The effects of transaction
risk are not quantified in our combined and consolidated financial statements.
Translation risk refers to the fact that the euro-denominated amounts in our consolidated financial
statements will differ based on the exchange rates we use to prepare our euro-denominated financial
statements. Our subsidiaries located outside the euro zone prepare their financial statements in their local
currencies. For us the most important currency outside the euro zone is the U.S. dollar. The U.S. dollar
depreciated against the euro during our 2004 and 2005 financial years and appreciated against the euro during
our 2006 financial year, based on the average exchange rates we use in our financial statements. When we
prepare our financial statements, we translate the local currency amounts in which the financial statements of
our non-euro zone subsidiaries are prepared into euro. Changes in the value of these currencies relative to the
euro from period to period therefore affect our results of operations and financial condition as expressed in
euro. Currency translation risks do not affect local currency cash flows or results of operations, but do affect
our consolidated annual financial statements. In general, an increase in the euro value relative to the
U.S. dollar and other currencies will result in a lower euro value of the sales generated in currencies that have
depreciated relative to the euro. Even if the margin on these sales remains constant in a non-euro currency, its
value translated into euro will be reduced.
Additional information on transaction and currency translation risks and our efforts to manage them are
contained in ""Ì Quantitative and Qualitative Disclosure About Market Risk''.
Strategic Cooperations
We believe that cooperations, such as alliances for research and development, and manufacturing and
foundry partnerships, provide us with access to several benefits that can be derived from improved economies
of scale. These benefits include sharing risks and costs with our business partners, reducing our capital
requirements, developing a broader range of products, gaining inter-cultural know-how and accessing
additional production capacities. We have invested substantial sums in these cooperations in past periods, and
they are in some cases associated with commitments for further investments. The 4132 million in other long-
term commitments included in our contractual commitments table included in note 31 to the combined and
consolidated financial statements as of September 30, 2006 relate to our investments in Infineon Technologies
Suzhou Co., Ltd. In addition, we have extensive commitments to purchase products from our manufacturing
partners. The commitments relating to those purchases can not accurately be quantified because they are
dependent on future market prices for memory products. These purchases aggregated approximately
4520 million in our 2005 financial year and 41,185 million in our 2006 financial year, as we increased our share
of foundry purchases from Winbond and SMIC, and from Inotera.
The most significant of our current co-operations in terms of impact on our financial statements are:
‚ Nanya. In November 2002, Infineon entered into agreements with Nanya Technology Corporation, a
Taiwanese corporation, that set out the terms of a strategic cooperation for the development of DRAM
products and DRAM process technology and for the foundation of a joint venture to construct and
operate a 300mm manufacturing facility in Taiwan, called Inotera Memories, Inc. Inotera's 300mm
manufacturing facilities in Taiwan employs production technology developed under Infineon's joint
development agreements with Nanya. Under the first of these agreements, we are co-developing and
sharing the development costs for advanced 90nm and 75nm process technologies. Infineon also
entered into a new agreement with Nanya in September 2005, under which we will jointly develop
37
Global Reports LLC

advanced 58nm technologies. Inotera's current capacity is approximately 62,000 300mm wafer starts
per month. Under the terms of the venture, Nanya and we each purchase 50% of Inotera's output.
Inotera completed an initial public offering of its common stock in Taiwan in March 2006. In May
2006, Inotera listed Global Depositary Receipts, or GDRs, on the Luxembourg Stock Exchange. After
these transactions we owned 36.0% of Inotera's shares. Infineon currently holds the investment in
Inotera in trust for us. We expect the investment to be transferred to us by December 31, 2006. We
account for Inotera by the equity method. Because of Inotera's significance for us within the meaning
of Rule 3-09 of the SEC's Regulation S-X, we have included, elsewhere in this annual report, Inotera's
audited consolidated financial statements as of and for the years ended December 31, 2004 and 2005.
‚ CSVC. In June 2003, Infineon established a venture with China Singapore Suzhou Industrial Park
Ventures Co., Ltd. (CSVC) in Suzhou, China. CSVC is a limited liability company organized under
the laws of the People's Republic of China. The venture, Infineon Technologies Suzhou Co., Ltd.
(recently renamed Qimonda Technologies (Suzhou) Co., Ltd. and herein referred to as Qimonda
Suzhou), constructed a back-end facility for the assembly and testing of our products, which officially
opened in September 2004. Infineon is required to purchase the entire output of the facility. In the
2005 financial year Infineon invested $29 million in the venture and is contractually required to invest
an additional $167 million through 2008. We undertook these commitments as part of the carve-out.
Infineon contributed its ownership in Qimonda Suzhou to us in the carve-out effective May 1, 2006
(45% of the venture's share capital, representing 72.5% of the voting rights in the venture). Because we
exercise voting control over this venture, we consolidate it in our combined and consolidated financial
statements. We plan to increase our investment in Qimonda Suzhou such that we will hold
approximately 72.5% of its share capital by the end of 2008, with CSVC owning the remaining 27.5%.
We have the option to acquire CSVC's stake at the nominal investment value plus accrued and
undistributed returns on that investment. The joint venture intends to arrange external financing for
any further investment required to purchase additional equipment. There can be no assurance that this
external financing can be obtained at favorable terms or at all.
‚ SMIC. In December 2002 Infineon entered into an agreement, as most recently amended in
November 2006, with Semiconductor Manufacturing International Corporation (SMIC), a Cayman
Islands corporation with head offices in Shanghai, China. As amended, the agreement provides access
to additional DRAM manufacturing capacity (up to 20,000 200mm wafer starts per month plus up to
15,000 300mm wafer starts per month). This agreement has been assigned to us as part of the carve-
out.
‚ Winbond. In May 2002 and August 2004, Infineon entered into product purchase and capacity
reservation agreements with Winbond Electronics Corporation, a Taiwanese corporation, which give us
access to additional DRAM production capacity (up to 19,000 200mm wafer starts per month plus up
to 15,000 300mm wafer starts per month). We procure an immaterial quantity of our finished products
under the 2002 agreement. These agreements have been assigned to us as part of the carve-out. On
August 29, 2006, we signed agreements with Winbond to expand our existing cooperation with
Winbond and our reservation of capacity at Winbond's facility. Under the terms of the agreements, we
will transfer our 80nm DRAM trench technology to Winbond's 300mm-wafer facility. In return,
Winbond will manufacture DRAMs for computing applications using this technology exclusively for
us.
Please see ""Our Business'' and ""Related Party Transactions and Relationships Ì With Infineon'' for
more details on these strategic cooperations.
As part of our carve-out, some agreements, including licensing, purchase and shareholding agreements,
and investments of Infineon relating to our business were not be transferable to us, or restrictions are delaying
this transfer or, in the future, could cause our interests to revert to Infineon. Any such reversion could
materially adversely effect our financial condition and results of operations. See ""Risk Factors Ì Risks related
to our operations Ì Some of our agreements with strategic partners, such as our Inotera Memories, Inc. joint
venture with Nanya, have restrictions on transfers of the shares of the ventures they create that could cause
38
Global Reports LLC

our ownership or equity interest in these ventures to revert to Infineon, if Infineon ceases to be our majority
owner, and Infineon is holding our interest in Inotera in trust for us, which could subject us to loss were
Infineon to become insolvent.''
Critical Accounting Policies
The preparation of our combined and consolidated financial statements required us to make estimates
and assumptions that affect the reported amounts of assets and liabilities, disclosure of contingent assets and
liabilities at the date of the financial statements and revenues and expenses during the years reported. We have
identified the following critical accounting policies and related assumptions, estimates and uncertainties,
which we believe are essential to understanding the underlying financial reporting risks and the impact that
these accounting methods, assumptions, estimates and uncertainties have on our reported financial results.
These policies have the potential to have a significant impact on our combined and consolidated financial
statements, either because of the significance of the combined and consolidated financial statement item to
which they relate or because they require judgment and estimation due to the uncertainty involved in
measuring, at a specific point in time, events which are continuous in nature. Actual results may differ from
our estimates under different assumptions and conditions. Our critical accounting policies include:
‚ those made in connection with our initial preparation of the combined financial statements;
‚ recoverability of long-lived assets;
‚ valuation of inventory;
‚ pension plan accounting;
‚ realization of deferred tax assets;
‚ revenue recognition; and
‚ contingencies.
Assumptions and Estimates We Made in Preparing Our Combined Financial Statements
The preparation of our combined financial statements requires us to make estimates and assumptions that
affect the reported amounts of assets and liabilities, as well as disclosure of contingent amounts and liabilities,
at the dates of the financial statements and the reported amounts of revenues and expenses during the
financial periods we present. Actual results could differ materially from those estimates. In addition, due to
the significant relationship between Infineon and our company, the terms of the carve-out transactions, the
allocations and estimations of assets and liabilities and of expenses and other transactions between our
business and Infineon are not the same as those that would have resulted from transactions among unrelated
third parties. We believe that the assumptions underlying the combined financial statements are reasonable.
Allocations from Infineon during the financial years ended September 30, 2004, 2005 and the seven
months ended April 30, 2006 are reflected in the combined statements of operations as follows:
For the financial yearended September 30,
2004 2005 2006
(in millions)
Cost of goods sold ÏÏÏÏÏÏÏÏÏÏÏÏÏÏÏÏÏÏÏÏÏÏÏÏÏÏÏÏÏÏÏÏÏÏÏÏÏÏÏÏÏÏÏÏÏÏÏ 4180 4168 4111
Research and development expenses ÏÏÏÏÏÏÏÏÏÏÏÏÏÏÏÏÏÏÏÏÏÏÏÏÏÏÏÏÏÏÏÏ 43 27 17
Selling, general and administrative expenses ÏÏÏÏÏÏÏÏÏÏÏÏÏÏÏÏÏÏÏÏÏÏÏÏÏ 160 109 75
Other operating expenses, netÏÏÏÏÏÏÏÏÏÏÏÏÏÏÏÏÏÏÏÏÏÏÏÏÏÏÏÏÏÏÏÏÏÏÏÏÏÏ 2 Ì Ì
Restructuring charges ÏÏÏÏÏÏÏÏÏÏÏÏÏÏÏÏÏÏÏÏÏÏÏÏÏÏÏÏÏÏÏÏÏÏÏÏÏÏÏÏÏÏÏÏ 2 1 Ì
4387 4305 4203
39
Global Reports LLC

The allocation during the 2006 financial year relates to the seven-month period between October 1, 2005
and April 30, 2006. After our carve-out on May 1, 2006, costs are charged according to agreements with
Infineon. See note 1 to the combined and consolidated financial statements for a description of the
assumptions used for periods prior to the carve-out. However, these transactions, allocations and estimates are
not indicative of those that would have obtained had our company actually been operated on a stand-alone
basis, nor are they indicative of our future transactions or of our expenses or results of operations. In addition,
the process of preparing the combined financial statements does not permit the revaluation of historical
transactions to attempt to introduce an arms' length relationship where one did not at the time exist. We
believe that it is not practicable to estimate what the actual costs of our company would have been on a stand-
alone basis if it had operated as an unaffiliated entity. Rather than allocating the expenses that Infineon
actually incurred on behalf of our business, we would have had to choose from a wide range of estimates and
assumptions that could have been made regarding joint overhead, joint financing, shared processes and other
matters. Any of these assumptions may have led to unreliable results and would not have been more useful as
an indicator of historical business development and performance than the methods employed in preparing the
combined financial statements.
Recoverability of Long-Lived Assets
Our business is extremely capital-intensive, and requires significant investment in property, plant and
equipment. Due to rapid technological change in the semiconductor industry, we anticipate the level of capital
expenditures to be significant in future periods. During the 2006 financial year, we spent 4686 million, and
during the 2005 financial year, we spent 4926 million to purchase property, plant and equipment.
At September 30, 2006, the carrying value of our property, plant and equipment was 42,080 million and
at September 30, 2005, the carrying value was 42,216 million. We have acquired other businesses, which
resulted in the generation of significant amounts of long-lived intangible assets, including goodwill. At
September 30, 2006 we had long-lived intangible assets of 4143 million and at September 30, 2005 we had
long-lived intangible assets of 4157 million, mainly because we entered into license agreements for intellectual
property.
We adopted the provisions of Financial Accounting Standards Board (""FASB'') Statement of Financial
Accounting Standards (""SFAS'') No. 142, ""Goodwill and Other Intangible Assets'', as of October 1, 2001.
Pursuant to the requirements of SFAS No. 142, a test for impairment is done at least once a year.
We review long-lived assets, including intangible assets, for impairment when events or changes in
circumstances indicate that the carrying value of an asset may not be recoverable. Recoverability of assets to
be held and used is measured by a comparison of the carrying value of an asset to future net cash flows
expected to be generated by the asset. If such assets are considered to be impaired, the impairment recognized
is measured by the amount by which the carrying value of the assets exceeds the fair value of the assets.
Estimated fair value is generally based on either appraised value or discounted estimated future cash flows.
Considerable judgment is necessary to estimate discounted future cash flows.
We test goodwill for impairment pursuant to SFAS No. 142, however did not recognize any goodwill
impairment charges during the years ended September 30, 2004 or 2005. In light of the weak market
conditions for commodity NAND flash memories in the three months ended September 30, 2006, we decided
to ramp down our flash production and stop the current development of NAND-compatible flash memory
products based on Saifun's proprietary NROM» technology. We and Saifun amended the license agreement
relating to this technology to terminate the payment of quarterly installments as of December 31, 2006. As a
result of the partial termination, we reduced payables, goodwill and other intangible assets, and recognized an
impairment charge of 49 million related to the license (47 million) and fixed assets (42 million) that were not
considered to be recoverable as of September 30, 2006.
Valuation of Inventory
The memory industry has historically experienced periods of extreme volatility in product demand and in
industry capacity, resulting in significant price fluctuations. See ""Ì Factors that Affect our Results of
40
Global Reports LLC

Operations'' and ""Risk Factors Ì Risks related to the semiconductor memory products industry Ì The
DRAM industry is subject to cyclical fluctuations, including recurring periods of oversupply, which result in
large swings in our operating results, including large losses.'' These significant price fluctuations have often
occurred within relatively short timeframes. For example, the average ""spot'' market price for 256Mb DDR
400 DRAM as reported by DRAM exchange fell from $4.00 at January 26, 2005 to $2.42 at March 30, 2005,
a drop of nearly 40% in two months. The average ""spot'' market price for 512Mb DDR2 DRAM as reported
by DRAM exchange fell from $5.07 at October 3, 2005 to $3.71 at December 14, 2005, a drop of nearly 27%
in two and a half months.
We value inventory on a quarterly basis at the lower of cost or market value. Market value of inventory
represents the net realizable value for finished goods and work-in-process. As of September 30, 2005 and
2006, we had inventory of 4484 million and 4622 million, respectively. We review the recoverability of
inventory based on regular monitoring of the size and composition of inventory positions, current economic
events and market conditions, projected future product demand and the pricing environment. This evaluation
is inherently judgmental and requires material estimates. These estimates relate both to forecasted product
demand and to the pricing environment. Both of these are susceptible to rapid and significant change.
In the 2004, 2005 and 2006 financial years we recorded recurring mark-to-market adjustments to value
our inventory according to this policy. Likewise, in future periods write-downs on inventory may become
necessary due one or more of the following:
‚ temporary or fundamental price declines as a consequence of an imbalance of demand and supply,
which can occur due to weak demand and/or greatly increased supply;
‚ technological obsolescence due to rapid developments of new products and technological
improvements; and
‚ changes in economic circumstances or in other conditions that impact the market price for our
products.
These factors could result in adjustments to the valuation of inventory in future periods, and have a
material adverse effect on our consolidated financial statements.
Pension Plan Accounting
We account for our pension-benefit liabilities and related postretirement benefit costs in accordance with
SFAS No. 87 ""Employers' Accounting for Pensions''. We currently do not have our own pension plans and
until we do, our employees will continue to participate in Infineon's pension plans. Infineon's plans generally
specify the amount of pension benefit that each employee will receive for services performed during a specified
period of employment (so-called ""defined benefit plans''). Nearly all of Infineon's pension plans are defined
benefit plans. As part of the carve-out, Infineon transferred to us the portion of pension liabilities related to
our employees. In our combined and consolidated financial statements, the level of plan assets, or funding, of
our pension obligations is proportional to Infineon's funding of its pension plans in relation to its pension
obligations. On September 13, 2006, Qimonda AG established the Qimonda Pension Trust for the purpose of
funding future pension benefit payments for employees in Germany. In September and October 2006,
Infineon's pension trust transferred 426 million of cash, representing our proportion of the funding in
Infineon's pension trust (determined on an actuarial basis as of the carve-out date) to this trust for use in
funding these pension benefit obligations. The Qimonda Pension Trust's investment strategy is to invest this
cash in a well-diversified portfolio of investments aimed at maximizing long-term returns.
Our pension benefit costs and liabilities are actuarially calculated using various assumptions, including
discount rates, expected return on plan assets, rate of compensation increase and rate of projected future
pension increases. These assumptions are based on prevailing market conditions, long-term historical averages,
and estimates of future developments of rates of returns. Please see note 28 to the combined and consolidated
financial statements for a quantification of the major assumptions underlying our pension plan accounting,
information on our plan asset allocations and a discussion of our current funding status. A significant variation
41
Global Reports LLC

in one or more of the underlying assumptions could have a material effect on the measurement of our long-
term obligation or our pension cost and therefore our financial condition or results of operation.
If the assumptions used to calculate the pension liabilities and expected return on plan assets turn out to
be accurate, we will pay our recorded net liability as pension benefits to our employees after they retire, and no
adjustments to our balance sheet accrual will be necessary. Differences between actual experience and these
assumptions, however, can result in differences between our recorded net liability and the related actuarially
calculated amount. These differences, also referred to as actuarial gains and losses, are generally not
recognized in the consolidated statements of operations as they occur. Instead, due to the long-term nature of
pensions and the related assumptions, they affect pension costs over the remaining service years of the relevant
employees. However, differences exceeding a standard significance threshold are recorded immediately as
pension cost. Our actuarial losses amounted to 41 million in the 2004 financial year, 44 million in the 2005
financial year and zero in the 2006 financial year. The decrease in actuarial losses in the 2006 financial year
was primarily the result of our use of new mortality tables in the actuarial calculations for our domestic
(German) pension plans in the 2005 financial year. The increase in actuarial losses in the 2005 financial year
was primarily the result of the reduction of the discount rate used to determine the benefit obligation and our
use of the new mortality tables in the actuarial calculations mentioned above.
Pension Benefits Ì Sensitivity Analysis
The expense related to pension plans and similar commitments we recognize in our consolidated financial
statements is referred to as net periodic pension cost (""NPPC'') and consists of several separately calculated
components. We estimate that our NPPC for our 2007 financial year will be 47.4 million. A one percentage
point change in the major assumptions mentioned above would result in the following impact on the estimated
pension cost for the 2007 financial year:
Effect on net periodicpension costs
One percent One percentincrease decrease
(in millions)
Discount rate ÏÏÏÏÏÏÏÏÏÏÏÏÏÏÏÏÏÏÏÏÏÏÏÏÏÏÏÏÏÏÏÏÏÏÏÏÏÏÏÏÏÏÏÏÏÏÏÏÏÏ 4(2.3) 42.8
Rate of compensation increase ÏÏÏÏÏÏÏÏÏÏÏÏÏÏÏÏÏÏÏÏÏÏÏÏÏÏÏÏÏÏÏÏÏÏÏ 1.4 (1.7)
Rate of projected future pension increasesÏÏÏÏÏÏÏÏÏÏÏÏÏÏÏÏÏÏÏÏÏÏÏÏÏÏ 1.4 (1.6)
Expected return on plan assets ÏÏÏÏÏÏÏÏÏÏÏÏÏÏÏÏÏÏÏÏÏÏÏÏÏÏÏÏÏÏÏÏÏÏÏ (0.5) 0.0
Increases and decreases in the discount rate, rate of compensation increase and rate of projected future
pension increases, which are used in determining the pension obligation, do not have a symmetrical effect on
NPPC primarily due to the compound interest effect created when determining the present value of the future
pension obligation. If more than one assumption were changed simultaneously, the impact would not
necessarily be the same as if only one assumption were changed in isolation.
Our pension plans were underfunded by an aggregate of 429 million as of September 30, 2006, and after
adjusting for unrecognized actuarial losses as described above of 47 million, we recognized the remaining
422 million as a liability on our balance sheet. Our pension plans were underfunded by an aggregate of
431 million as of September 30, 2005, and after adjusting for unrecognized actuarial losses of 44 million as
described above, we recognized the remaining 427 million as a liability on our balance sheet. As the present
value of our expected future benefits payable over the years through 2016 was 412 million on September 30,
2006, we do not perceive a need to increase our plan funding in the immediate future.
Realization of Deferred Tax Assets
Income taxes as presented in the accompanying combined and consolidated financial statements are
determined on a separate return basis. Although in numerous tax jurisdictions, including Germany, the
company was included in the consolidated tax returns of Infineon, where the Memory Products business was
only a part of an Infineon entity, the tax provision has been prepared on an as-if separate company basis except
42
Global Reports LLC
that, pursuant to the terms of the contribution agreement between us and Infineon, any net operating losses
generated by the Memory Products business and carried forward are treated as a reduction of equity at the end
of the year, as such losses were retained by Infineon. Infineon evaluates its tax position and related tax
strategies for its entire group as a whole, which may differ from the tax strategies we would have followed as a
stand-alone company.
We recognize deferred income tax assets only if we determine that it is more likely than not that we will
be able to realize the tax benefits in the future from accumulated temporary differences and tax loss carry-
forwards. At September 30, 2005 and 2006, our total net deferred tax assets were 4165 million and
4153 million, respectively. Included in this amount are the tax benefits of net operating loss and credit carry-
forwards of approximately 487 million as of September 30, 2005 and of approximately 432 million as of
September 30, 2006. We provided a valuation allowance against our total deferred tax assets of 459 million
and 470 million, as of September 30, 2005 and 2006, respectively. These tax credit carry-forwards are
generally limited to the amount used by the particular entity that generated the loss or credit and do not expire
under current law. Because as a general matter net operating loss carry-forwards are not transferable, certain
net operating loss and credit carry-forwards, remain on Infineon's balance sheet because they were generated
by legal entities not transferred to us in connection with the carve-out. In the future, Infineon will be able to
offset its tax expense with these carry-forwards. This is shown on our balance sheets prior to our carve-out as a
reduction in our business equity of 46 million as of September 30, 2005 and 459 million as of September 30,
2004.
We evaluate our deferred tax asset position and the need for a valuation allowance on a regular basis. The
assessment requires the exercise of judgment on the part of our management with respect to, among other
things, benefits that can be realized from available tax strategies and future taxable income. Our ability to
realize deferred tax assets depends on our ability to generate future taxable income sufficient to use tax loss
carry-forwards or tax credits before their expiration. The assessment is based on the benefits that could be
realized from available tax strategies, the reversal of taxable temporary differences in future periods and the
impact of forecasted future taxable income. As a result of this assessment, we increased the deferred tax asset
valuation allowance in the 2006 financial year by 411 million and in the 2005 financial year by 414 million to
reduce the deferred tax asset to an amount that we believe is more likely than not expected to be realized in
the future. This amount excluded tax losses of 4101 million before the carve-out that could not be transferred
to us and will instead be available to Infineon in the future. The highly subjective character of many of the
determinations Statement of Financial Accounting Standards (""SFAS'') No. 109 ""Accounting For Income
Taxes'' requires in measuring the valuation allowance means that our deferred tax assets may be subject to
further reduction if our expectations, especially those relating to the future taxable income from operations
(and to benefits from available tax strategies), prove to be too optimistic.
Revenue Recognition
We sell our memory products throughout the world. Our policy is to record revenue when persuasive
evidence of an arrangement to sell products exists, the price is fixed or determinable, shipment is made and
collectibility is reasonably assured. In general, persuasive evidence of an arrangement exists when the
customer's written purchase order has been accepted. More judgment is required in the case of our licensing
agreements, while the revenues from most of our DRAM business can be recognized using standardized
processes.
We record reductions to revenue for estimated product returns and allowances for discounts and price
protection, based on actual historical experience, at the time the related revenue is recognized. We also
establish reserves for sales discounts, price protection allowances and product returns based upon our
evaluation of a variety of factors, including industry demand. This process requires the exercise of substantial
judgments in evaluating the above-mentioned factors and requires material estimates, including forecasted
demand, returns and industry pricing assumptions.
We have entered into licensing agreements for our technology in the past, and anticipate that we will
continue our efforts to monetize the value of our technology in the future. As with certain of our existing
43
Global Reports LLC

licensing agreements, any new licensing arrangements may include capacity reservation agreements with the
licensee. Such transactions could represent multiple element arrangements pursuant to SEC Staff Accounting
Bulletin (""SAB'') 104, ""Revenue Recognition'', and Emerging Issues Task Force (""EITF'') Issue No. 00-21,
""Revenue Arrangements with Multiple Elements''. This treatment can have the result of deferring license
revenues and recognizing them over the period in which we are purchasing products from the licensee. The
process of determining the appropriate revenue recognition in such transactions is highly complex and requires
significant judgment, which includes evaluating material estimates in the determination of fair value and the
level of our continuing involvement.
Contingencies
We are subject to various legal actions and claims that arise in the normal course of business. In
particular, we are subject to significant civil lawsuits that relate to the operations of the Memory Products
business prior to the carve-out, including the civil antitrust litigation in the United States and Canada,
securities class actions and patent litigation. These matters are described in ""Our Business Ì Legal Matters''.
As part of our carve-out, we agreed to indemnify Infineon with respect to claims (including any related
expenses) arising in connection with certain matters, which are described under ""Related Party Transactions
and Relationships Ì With Infineon''.
We regularly assess the likelihood of any adverse outcome or judgments related to these matters and,
where appropriate, estimate the range of possible losses and recoveries. We record liabilities, including
accruals for significant litigation costs related to legal proceedings, when it is probable that a liability has been
incurred and the associated amount of the loss can be reasonably estimated. Where the estimated amount of
loss is within a range of amounts and no amount within the range is a better estimate than any other amount or
the range cannot be estimated, we accrue the minimum amount. Accordingly, we have accrued a liability and
charged operating income in our combined and consolidated financial statements related to certain asserted
and unasserted claims existing as of each balance sheet date. As additional information becomes available, we
assess any potential liability related to these actions and revise the estimates, if necessary. These accrued
liabilities may be insufficient and are subject to change in the future based on new developments in each
matter, or changes in circumstances. Any change we make in them could have a material impact on our
results of operations, financial position and cash flows. See ""Risk Factors Ì Risks related to our operations Ì
Sanctions in the United States and other countries against us and other DRAM producers for anticompetitive
practices in the DRAM industry and related civil litigation may have a direct or indirect material adverse
effect on our operations'' and ""Ì An unfavorable outcome in the pending securities litigation against Infineon
or the incurrence of significant costs in the defense of this litigation may have a direct or indirect material
adverse effect on our operations.''
44
Global Reports LLC

Results of Operations
The following table presents the various line items in our combined and consolidated statements of
operations expressed as percentages of net sales for the periods indicated.
For the financial year endedSeptember 30,
2004 2005 2006
(in percent)
Net sales ÏÏÏÏÏÏÏÏÏÏÏÏÏÏÏÏÏÏÏÏÏÏÏÏÏÏÏÏÏÏÏÏÏÏÏÏÏÏÏÏÏÏÏÏÏÏÏÏÏÏÏÏÏ 100.0% 100.0% 100.0%
Cost of goods soldÏÏÏÏÏÏÏÏÏÏÏÏÏÏÏÏÏÏÏÏÏÏÏÏÏÏÏÏÏÏÏÏÏÏÏÏÏÏÏÏÏÏÏÏÏÏ 68.6 76.6 79.9
Gross profit ÏÏÏÏÏÏÏÏÏÏÏÏÏÏÏÏÏÏÏÏÏÏÏÏÏÏÏÏÏÏÏÏÏÏÏÏÏÏÏÏÏÏÏÏÏÏÏÏÏÏÏ 31.4 23.4 20.1
Research and development expenses ÏÏÏÏÏÏÏÏÏÏÏÏÏÏÏÏÏÏÏÏÏÏÏÏÏÏÏÏÏÏ 11.5 13.8 11.3
Selling, general and administrative expenses ÏÏÏÏÏÏÏÏÏÏÏÏÏÏÏÏÏÏÏÏÏÏÏÏ 7.7 7.3 5.6
Restructuring charges ÏÏÏÏÏÏÏÏÏÏÏÏÏÏÏÏÏÏÏÏÏÏÏÏÏÏÏÏÏÏÏÏÏÏÏÏÏÏÏÏÏÏÏ 0.1 Ì Ì
Other operating expenses, net ÏÏÏÏÏÏÏÏÏÏÏÏÏÏÏÏÏÏÏÏÏÏÏÏÏÏÏÏÏÏÏÏÏÏÏÏ 6.4 0.5 1.6
Operating income ÏÏÏÏÏÏÏÏÏÏÏÏÏÏÏÏÏÏÏÏÏÏÏÏÏÏÏÏÏÏÏÏÏÏÏÏÏÏÏÏÏÏÏÏÏÏ 5.7 1.8 1.6
Interest expense, netÏÏÏÏÏÏÏÏÏÏÏÏÏÏÏÏÏÏÏÏÏÏÏÏÏÏÏÏÏÏÏÏÏÏÏÏÏÏÏÏÏÏÏÏ (1.0) (0.2) (0.7)
Equity in (losses) earnings of associated companies ÏÏÏÏÏÏÏÏÏÏÏÏÏÏÏÏÏ (0.5) 1.6 2.1
Gain on associated company share issuance ÏÏÏÏÏÏÏÏÏÏÏÏÏÏÏÏÏÏÏÏÏÏÏÏ 0.1 Ì 1.9
Other non-operating (expense) income, net ÏÏÏÏÏÏÏÏÏÏÏÏÏÏÏÏÏÏÏÏÏÏÏÏ (0.4) 0.4 0.2
Minority interests ÏÏÏÏÏÏÏÏÏÏÏÏÏÏÏÏÏÏÏÏÏÏÏÏÏÏÏÏÏÏÏÏÏÏÏÏÏÏÏÏÏÏÏÏÏÏ 0.5 0.1 (0.2)
Income before income taxes ÏÏÏÏÏÏÏÏÏÏÏÏÏÏÏÏÏÏÏÏÏÏÏÏÏÏÏÏÏÏÏÏÏÏÏÏÏ 4.4 3.7 4.9
Income tax expense ÏÏÏÏÏÏÏÏÏÏÏÏÏÏÏÏÏÏÏÏÏÏÏÏÏÏÏÏÏÏÏÏÏÏÏÏÏÏÏÏÏÏÏÏ (7.0) (3.1) (3.0)
Net (loss) income ÏÏÏÏÏÏÏÏÏÏÏÏÏÏÏÏÏÏÏÏÏÏÏÏÏÏÏÏÏÏÏÏÏÏÏÏÏÏÏÏÏÏÏÏÏ (2.6)% 0.6% 1.9%
Net Sales
We generate our net sales primarily from the sale of our memory products. Our memory products consist
primarily of dynamic random access memory (DRAM) products, which are used in computers and other
electronic devices. We also offer a limited range of non-volatile flash memory products, which are used in
consumer applications such as digital still cameras or cellular handsets. We generate the vast majority of our
memory product sales through our direct sales force, with approximately 13% of our total revenue in the 2006
financial year derived from sales made through distributors.
We also generate a small stream of revenues from royalties and license fees earned on technology that we
own and license to third parties. This often enables us to gain access to manufacturing capacity at foundries
through joint licensing and capacity reservation arrangements, and also permits us to recover a small portion of
our research and development expenses.
45
Global Reports LLC
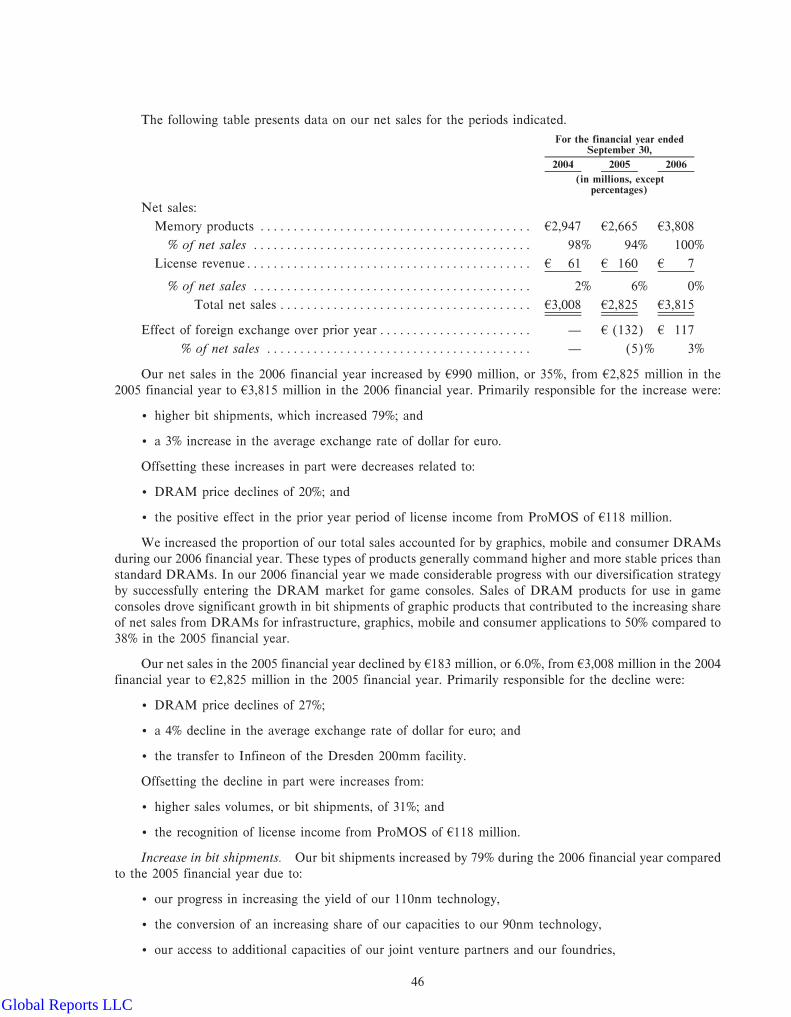
The following table presents data on our net sales for the periods indicated.
For the financial year endedSeptember 30,
2004 2005 2006
(in millions, exceptpercentages)
Net sales:
Memory products ÏÏÏÏÏÏÏÏÏÏÏÏÏÏÏÏÏÏÏÏÏÏÏÏÏÏÏÏÏÏÏÏÏÏÏÏÏÏÏÏÏ 42,947 42,665 43,808
% of net sales ÏÏÏÏÏÏÏÏÏÏÏÏÏÏÏÏÏÏÏÏÏÏÏÏÏÏÏÏÏÏÏÏÏÏÏÏÏÏÏÏÏÏ 98% 94% 100%
License revenueÏÏÏÏÏÏÏÏÏÏÏÏÏÏÏÏÏÏÏÏÏÏÏÏÏÏÏÏÏÏÏÏÏÏÏÏÏÏÏÏÏÏÏ 4 61 4 160 4 7
% of net sales ÏÏÏÏÏÏÏÏÏÏÏÏÏÏÏÏÏÏÏÏÏÏÏÏÏÏÏÏÏÏÏÏÏÏÏÏÏÏÏÏÏÏ 2% 6% 0%
Total net sales ÏÏÏÏÏÏÏÏÏÏÏÏÏÏÏÏÏÏÏÏÏÏÏÏÏÏÏÏÏÏÏÏÏÏÏÏÏÏ 43,008 42,825 43,815
Effect of foreign exchange over prior year ÏÏÏÏÏÏÏÏÏÏÏÏÏÏÏÏÏÏÏÏÏÏÏ Ì 4 (132) 4 117
% of net sales ÏÏÏÏÏÏÏÏÏÏÏÏÏÏÏÏÏÏÏÏÏÏÏÏÏÏÏÏÏÏÏÏÏÏÏÏÏÏÏÏ Ì (5)% 3%
Our net sales in the 2006 financial year increased by 4990 million, or 35%, from 42,825 million in the
2005 financial year to 43,815 million in the 2006 financial year. Primarily responsible for the increase were:
‚ higher bit shipments, which increased 79%; and
‚ a 3% increase in the average exchange rate of dollar for euro.
Offsetting these increases in part were decreases related to:
‚ DRAM price declines of 20%; and
‚ the positive effect in the prior year period of license income from ProMOS of 4118 million.
We increased the proportion of our total sales accounted for by graphics, mobile and consumer DRAMs
during our 2006 financial year. These types of products generally command higher and more stable prices than
standard DRAMs. In our 2006 financial year we made considerable progress with our diversification strategy
by successfully entering the DRAM market for game consoles. Sales of DRAM products for use in game
consoles drove significant growth in bit shipments of graphic products that contributed to the increasing share
of net sales from DRAMs for infrastructure, graphics, mobile and consumer applications to 50% compared to
38% in the 2005 financial year.
Our net sales in the 2005 financial year declined by 4183 million, or 6.0%, from 43,008 million in the 2004
financial year to 42,825 million in the 2005 financial year. Primarily responsible for the decline were:
‚ DRAM price declines of 27%;
‚ a 4% decline in the average exchange rate of dollar for euro; and
‚ the transfer to Infineon of the Dresden 200mm facility.
Offsetting the decline in part were increases from:
‚ higher sales volumes, or bit shipments, of 31%; and
‚ the recognition of license income from ProMOS of 4118 million.
Increase in bit shipments. Our bit shipments increased by 79% during the 2006 financial year compared
to the 2005 financial year due to:
‚ our progress in increasing the yield of our 110nm technology,
‚ the conversion of an increasing share of our capacities to our 90nm technology,
‚ our access to additional capacities of our joint venture partners and our foundries,
46
Global Reports LLC
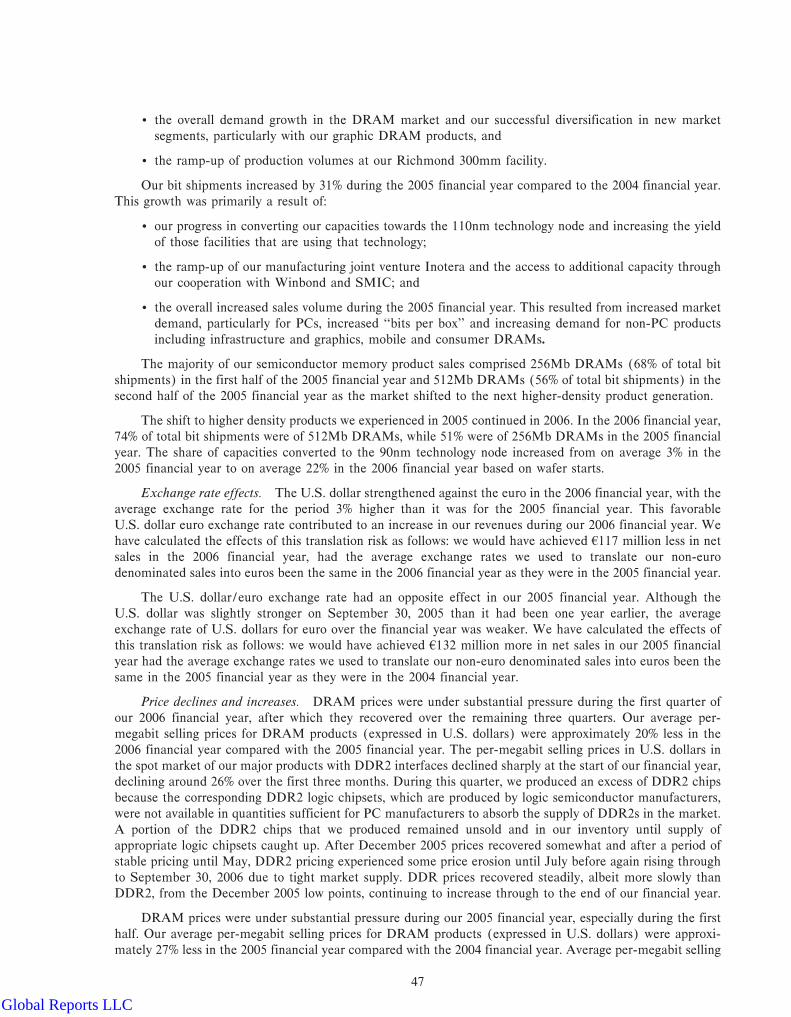
‚ the overall demand growth in the DRAM market and our successful diversification in new market
segments, particularly with our graphic DRAM products, and
‚ the ramp-up of production volumes at our Richmond 300mm facility.
Our bit shipments increased by 31% during the 2005 financial year compared to the 2004 financial year.
This growth was primarily a result of:
‚ our progress in converting our capacities towards the 110nm technology node and increasing the yield
of those facilities that are using that technology;
‚ the ramp-up of our manufacturing joint venture Inotera and the access to additional capacity through
our cooperation with Winbond and SMIC; and
‚ the overall increased sales volume during the 2005 financial year. This resulted from increased market
demand, particularly for PCs, increased ""bits per box'' and increasing demand for non-PC products
including infrastructure and graphics, mobile and consumer DRAMs.
The majority of our semiconductor memory product sales comprised 256Mb DRAMs (68% of total bit
shipments) in the first half of the 2005 financial year and 512Mb DRAMs (56% of total bit shipments) in the
second half of the 2005 financial year as the market shifted to the next higher-density product generation.
The shift to higher density products we experienced in 2005 continued in 2006. In the 2006 financial year,
74% of total bit shipments were of 512Mb DRAMs, while 51% were of 256Mb DRAMs in the 2005 financial
year. The share of capacities converted to the 90nm technology node increased from on average 3% in the
2005 financial year to on average 22% in the 2006 financial year based on wafer starts.
Exchange rate effects. The U.S. dollar strengthened against the euro in the 2006 financial year, with the
average exchange rate for the period 3% higher than it was for the 2005 financial year. This favorable
U.S. dollar euro exchange rate contributed to an increase in our revenues during our 2006 financial year. We
have calculated the effects of this translation risk as follows: we would have achieved 4117 million less in net
sales in the 2006 financial year, had the average exchange rates we used to translate our non-euro
denominated sales into euros been the same in the 2006 financial year as they were in the 2005 financial year.
The U.S. dollar/euro exchange rate had an opposite effect in our 2005 financial year. Although the
U.S. dollar was slightly stronger on September 30, 2005 than it had been one year earlier, the average
exchange rate of U.S. dollars for euro over the financial year was weaker. We have calculated the effects of
this translation risk as follows: we would have achieved 4132 million more in net sales in our 2005 financial
year had the average exchange rates we used to translate our non-euro denominated sales into euros been the
same in the 2005 financial year as they were in the 2004 financial year.
Price declines and increases. DRAM prices were under substantial pressure during the first quarter of
our 2006 financial year, after which they recovered over the remaining three quarters. Our average per-
megabit selling prices for DRAM products (expressed in U.S. dollars) were approximately 20% less in the
2006 financial year compared with the 2005 financial year. The per-megabit selling prices in U.S. dollars in
the spot market of our major products with DDR2 interfaces declined sharply at the start of our financial year,
declining around 26% over the first three months. During this quarter, we produced an excess of DDR2 chips
because the corresponding DDR2 logic chipsets, which are produced by logic semiconductor manufacturers,
were not available in quantities sufficient for PC manufacturers to absorb the supply of DDR2s in the market.
A portion of the DDR2 chips that we produced remained unsold and in our inventory until supply of
appropriate logic chipsets caught up. After December 2005 prices recovered somewhat and after a period of
stable pricing until May, DDR2 pricing experienced some price erosion until July before again rising through
to September 30, 2006 due to tight market supply. DDR prices recovered steadily, albeit more slowly than
DDR2, from the December 2005 low points, continuing to increase through to the end of our financial year.
DRAM prices were under substantial pressure during our 2005 financial year, especially during the first
half. Our average per-megabit selling prices for DRAM products (expressed in U.S. dollars) were approxi-
mately 27% less in the 2005 financial year compared with the 2004 financial year. Average per-megabit selling
47
Global Reports LLC
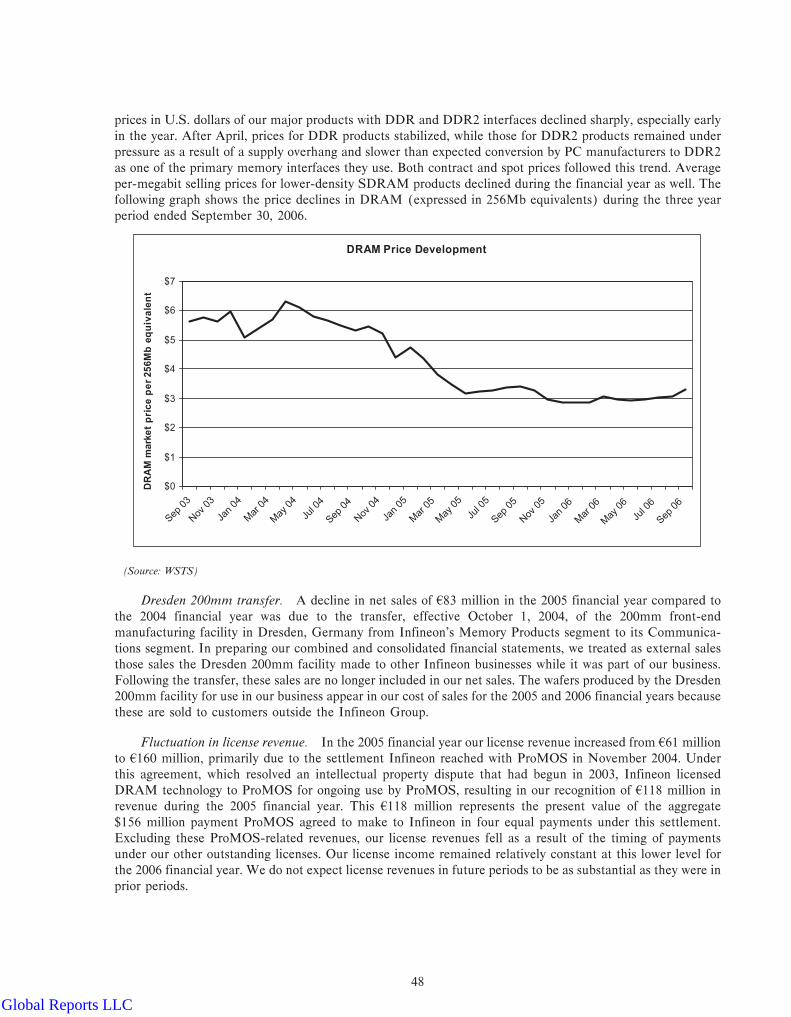
prices in U.S. dollars of our major products with DDR and DDR2 interfaces declined sharply, especially early
in the year. After April, prices for DDR products stabilized, while those for DDR2 products remained under
pressure as a result of a supply overhang and slower than expected conversion by PC manufacturers to DDR2
as one of the primary memory interfaces they use. Both contract and spot prices followed this trend. Average
per-megabit selling prices for lower-density SDRAM products declined during the financial year as well. The
following graph shows the price declines in DRAM (expressed in 256Mb equivalents) during the three year
period ended September 30, 2006.
DRAM Price Development
$0
$1
$2
$3
$4
$5
$6
$7
Sep 0
3
Nov
03
Jan
04
Mar
04
May
04
Jul 0
4
Sep 0
4
Nov
04
Jan
05
Mar
05
May
05
Jul 0
5
Sep 0
5
Nov
05
Jan
06
Mar
06
May
06
Jul 0
6
Sep 0
6
DR
AM
mark
et
pri
ce
pe
r 2
56
Mb
eq
uiv
ale
nt
(Source: WSTS)
Dresden 200mm transfer. A decline in net sales of 483 million in the 2005 financial year compared to
the 2004 financial year was due to the transfer, effective October 1, 2004, of the 200mm front-end
manufacturing facility in Dresden, Germany from Infineon's Memory Products segment to its Communica-
tions segment. In preparing our combined and consolidated financial statements, we treated as external sales
those sales the Dresden 200mm facility made to other Infineon businesses while it was part of our business.
Following the transfer, these sales are no longer included in our net sales. The wafers produced by the Dresden
200mm facility for use in our business appear in our cost of sales for the 2005 and 2006 financial years because
these are sold to customers outside the Infineon Group.
Fluctuation in license revenue. In the 2005 financial year our license revenue increased from 461 million
to 4160 million, primarily due to the settlement Infineon reached with ProMOS in November 2004. Under
this agreement, which resolved an intellectual property dispute that had begun in 2003, Infineon licensed
DRAM technology to ProMOS for ongoing use by ProMOS, resulting in our recognition of 4118 million in
revenue during the 2005 financial year. This 4118 million represents the present value of the aggregate
$156 million payment ProMOS agreed to make to Infineon in four equal payments under this settlement.
Excluding these ProMOS-related revenues, our license revenues fell as a result of the timing of payments
under our other outstanding licenses. Our license income remained relatively constant at this lower level for
the 2006 financial year. We do not expect license revenues in future periods to be as substantial as they were in
prior periods.
48
Global Reports LLC
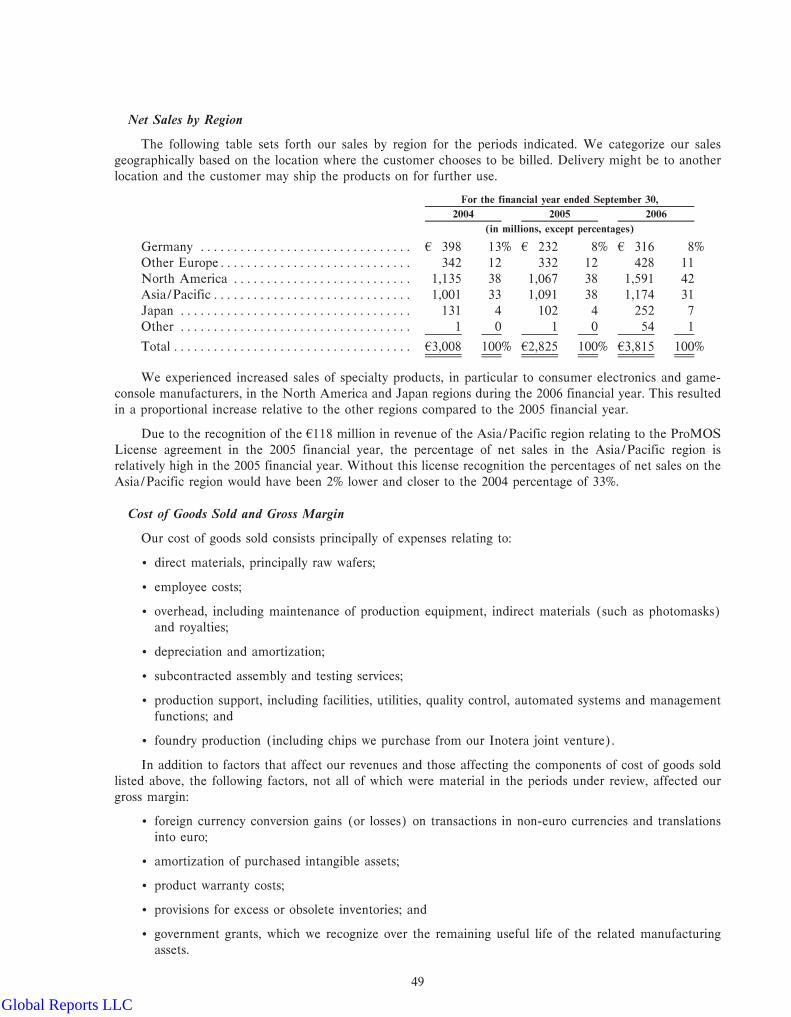
Net Sales by Region
The following table sets forth our sales by region for the periods indicated. We categorize our sales
geographically based on the location where the customer chooses to be billed. Delivery might be to another
location and the customer may ship the products on for further use.
For the financial year ended September 30,
2004 2005 2006
(in millions, except percentages)
Germany ÏÏÏÏÏÏÏÏÏÏÏÏÏÏÏÏÏÏÏÏÏÏÏÏÏÏÏÏÏÏÏÏ 4 398 13% 4 232 8% 4 316 8%
Other EuropeÏÏÏÏÏÏÏÏÏÏÏÏÏÏÏÏÏÏÏÏÏÏÏÏÏÏÏÏÏ 342 12 332 12 428 11
North America ÏÏÏÏÏÏÏÏÏÏÏÏÏÏÏÏÏÏÏÏÏÏÏÏÏÏÏ 1,135 38 1,067 38 1,591 42
Asia/PacificÏÏÏÏÏÏÏÏÏÏÏÏÏÏÏÏÏÏÏÏÏÏÏÏÏÏÏÏÏÏ 1,001 33 1,091 38 1,174 31
Japan ÏÏÏÏÏÏÏÏÏÏÏÏÏÏÏÏÏÏÏÏÏÏÏÏÏÏÏÏÏÏÏÏÏÏÏ 131 4 102 4 252 7
Other ÏÏÏÏÏÏÏÏÏÏÏÏÏÏÏÏÏÏÏÏÏÏÏÏÏÏÏÏÏÏÏÏÏÏÏ 1 0 1 0 54 1
Total ÏÏÏÏÏÏÏÏÏÏÏÏÏÏÏÏÏÏÏÏÏÏÏÏÏÏÏÏÏÏÏÏÏÏÏÏ 43,008 100% 42,825 100% 43,815 100%
We experienced increased sales of specialty products, in particular to consumer electronics and game-
console manufacturers, in the North America and Japan regions during the 2006 financial year. This resulted
in a proportional increase relative to the other regions compared to the 2005 financial year.
Due to the recognition of the 4118 million in revenue of the Asia/Pacific region relating to the ProMOS
License agreement in the 2005 financial year, the percentage of net sales in the Asia/Pacific region is
relatively high in the 2005 financial year. Without this license recognition the percentages of net sales on the
Asia/Pacific region would have been 2% lower and closer to the 2004 percentage of 33%.
Cost of Goods Sold and Gross Margin
Our cost of goods sold consists principally of expenses relating to:
‚ direct materials, principally raw wafers;
‚ employee costs;
‚ overhead, including maintenance of production equipment, indirect materials (such as photomasks)
and royalties;
‚ depreciation and amortization;
‚ subcontracted assembly and testing services;
‚ production support, including facilities, utilities, quality control, automated systems and management
functions; and
‚ foundry production (including chips we purchase from our Inotera joint venture).
In addition to factors that affect our revenues and those affecting the components of cost of goods sold
listed above, the following factors, not all of which were material in the periods under review, affected our
gross margin:
‚ foreign currency conversion gains (or losses) on transactions in non-euro currencies and translations
into euro;
‚ amortization of purchased intangible assets;
‚ product warranty costs;
‚ provisions for excess or obsolete inventories; and
‚ government grants, which we recognize over the remaining useful life of the related manufacturing
assets.
49
Global Reports LLC

Our purchases from our joint ventures and other associated and related companies, such as Inotera,
amounted to 4438 million in the 2006 financial year, 4247 million in the 2005 financial year and 423 million in
the 2004 financial year. In addition, we purchased 4747 million in our 2006 financial year of inventory from
our foundry partners compared to 4273 million in our 2005 financial year and 491 million in our 2004 financial
year. These amounts are included in cost of goods sold.
The following table sets forth our cost of goods sold and related data for the periods indicated.
For the financial year endedSeptember 30,
2004 2005 2006
(in millions, exceptpercentages)
Cost of goods soldÏÏÏÏÏÏÏÏÏÏÏÏÏÏÏÏÏÏÏÏÏÏÏÏÏÏÏÏÏÏÏÏÏÏÏÏÏÏÏÏÏÏÏ 42,063 42,164 43,048% of net sales ÏÏÏÏÏÏÏÏÏÏÏÏÏÏÏÏÏÏÏÏÏÏÏÏÏÏÏÏÏÏÏÏÏÏÏÏÏÏÏÏÏÏÏÏ 69% 77% 80%
Gross margin ÏÏÏÏÏÏÏÏÏÏÏÏÏÏÏÏÏÏÏÏÏÏÏÏÏÏÏÏÏÏÏÏÏÏÏÏÏÏÏÏÏÏÏÏÏÏÏ 31% 23% 20%
Cost of goods sold increased by 4884 million, or 41% from 42,164 million in 2005 financial year to
43,048 million in 2006 financial year. The increase in our cost of goods sold was due primarily to:
‚ higher bit shipments;
‚ higher absolute costs from production ramp-up and increased purchases from foundries; and
‚ exchange rate effects.
Offsetting these increases in part were improvements in our productivity.
Cost of goods sold increased by 4101 million, or 5%, from 42,063 million in the 2004 financial year to
42,164 million in the 2005 financial year. The increase in our cost of goods sold was due primarily to:
‚ higher bit shipments; and
offsetting these increases in part were decreases related to:
‚ the Dresden 200mm transfer;
‚ exchange rate effects; and
‚ increases in our productivity.
Higher bit shipments. The 79% increase in bit shipments in the 2006 financial year was due primarily to
the ramp-up of production volumes at our Richmond 300mm facility, at Inotera and at those of our foundry
partners manufacturing on 300mm wafers. In the 2006 financial year, we sourced in bits over 198% more chips
from these partners than we had during the 2005 financial year. As discussed below, we believe that
productivity improvements were partially responsible for holding the percentage increase in costs below the
percentage increase in bit shipments, as was the spreading of our fixed costs against a greater level of bit
shipments.
The 31% increase in bit shipments in our 2005 financial year led to an increase in material and personnel
costs. As discussed below, we believe that productivity improvements were partly responsible for holding the
percentage increase in costs below the percentage increase in bit shipments, as was the spreading of our fixed
costs across greater bit shipments.
Higher absolute costs from production ramp-up and increased purchases from foundries. While we
expect our ongoing shift to production on 300mm wafers to lead to reduced manufacturing costs once the
conversions are complete, during the 2006 financial year our gross margin was adversely affected by the
increased depreciation and amortization charges of 4175 million mainly associated with the commencement of
production in our 300mm production facility in Richmond and the back-end manufacturing facility in Suzhou.
Increased average costs per wafer and personnel. In addition to the general increases in materials and
personnel costs that result from increased bit shipments, our migration to a higher proportion of production on
50
Global Reports LLC

300mm wafers has led to increased costs per wafer. These larger wafers are more expensive per wafer than
200mm wafers, although due to the substantially higher bit output per 300mm wafer, the per bit costs for
using these wafers are considerably lower. The personnel costs included in cost of goods sold also increased as
we ramped up production in our 300mm facility in Richmond.
Exchange rate effects. The relative strength of the exchange rate of the U.S. dollar against the euro in
the 2006 financial year, as compared to the 2005 financial year, increased the euro value of our costs that are
denominated in U.S. dollars by approximately 445 million. This means that we would have incurred
approximately 445 million less in costs of goods sold in our 2006 financial year, had the average exchange rates
we use to translate our non-euro expenses into euros been the same in the 2006 financial year as they were in
the 2005 financial year. However, given the increase in our net sales due to foreign exchange effects, foreign
currency movements overall had a positive net effect on our gross margin during the 2006 financial year.
The depreciation of the U.S. dollar against the euro in the 2005 financial year reduced the euro value of
our expenses that are denominated in dollars by approximately 440 million. This means that we would have
incurred approximately 440 million more in costs of goods sold in our 2005 financial year had the average
exchange rates we use to translate our non-euro expenses into euros been the same in the 2005 financial year
as they were in the 2004 financial year. However, given the relatively large decline in our net sales due to
foreign exchange effects, foreign currency movements overall had a negative net effect on our gross margin.
Dresden 200mm transfer. In the 2005 financial year 472 million of the decrease in cost of goods sold
related to the transfer of the Dresden 200mm facility. Following the transfer of this facility, we no longer
included in our cost of goods sold the costs relating to the chips the facility produces for Infineon's logic
business. We did, however, begin paying Infineon a margin for the chips we began to purchase from Infineon.
Although the transfer of the Dresden 200mm facility did impact both net sales and cost of goods sold, the net
impact on our gross margin was not significant.
Productivity increase. We achieved productivity improvements through the increased conversion of
capacities to 110nm and 90nm process technologies and the increasing share of our chips produced on 300mm
wafers. The ramp-up of 300mm capacities at our manufacturing facility at Richmond, Virginia, at our joint
venture Inotera and at our foundry partner SMIC contributed to the increased share of production on 300mm
wafers. Measured in wafer starts, 68% of our total production (including capacity sourced from our strategic
and foundry partners) was on 300mm wafers in the 2006 financial year as compared to 53% of our production
in the 2005 financial year.
In the 2005 financial year we achieved productivity improvements through the conversion of capacities
from 140nm to 110nm process technology and the increasing share of our chips produced on 300mm wafers.
The share of wafer starts based on 110nm technology increased from almost 50% in the 2004 financial year to
more than 80% in the 2005 financial year. By the end of the 2005 financial year, we had begun mass
production at the 90nm node, such that on average 3% of our DRAMs were being manufactured using that
process technology, which improved to on average 22% at the end of the 2006 financial year.
Our gross margin decreased slightly during the 2006 financial year, falling to 20% from 23% in the 2005
financial year, primarily as a result of the lower level of license income. Excluding the changes in license
income, our gross margins would have remained nearly unchanged. The sales price declines experienced in the
first months of the 2006 financial year had an adverse impact on the gross margin. The recovery in prices in
the later part of the year and our bit growth led to an increase in gross margin, particularly in the fourth
quarter of the 2006 financial year. Since our average selling price declined at a faster rate than our cost per
unit did during the 2005 financial year, our gross margin decreased, falling from 31% in the 2004 financial year
to 23% in the 2005 financial year.
Research and Development (R&D) Expenses
Research and development (R&D) expenses consist primarily of salaries and benefits for research and
development personnel, materials costs, depreciation and maintenance of equipment used in our research and
development efforts and contracted technology development costs. Materials costs include expenses for
51
Global Reports LLC

development wafers and costs relating to pilot production activities prior to the commencement of commercial
production. R&D expenses also include our joint technology development arrangements with partners such as
Nanya.
The following table sets forth our R&D expenses and government subsidies for the periods indicated:
For the financial yearended September 30,
2004 2005 2006
(in millions, exceptpercentages)
Research and development expenses ÏÏÏÏÏÏÏÏÏÏÏÏÏÏÏÏÏÏÏÏÏÏÏÏÏÏÏÏÏÏÏÏ 4347 4390 4433% of net sales ÏÏÏÏÏÏÏÏÏÏÏÏÏÏÏÏÏÏÏÏÏÏÏÏÏÏÏÏÏÏÏÏÏÏÏÏÏÏÏÏÏÏÏÏÏÏÏÏÏ 12% 14% 11%
Government subsidies ÏÏÏÏÏÏÏÏÏÏÏÏÏÏÏÏÏÏÏÏÏÏÏÏÏÏÏÏÏÏÏÏÏÏÏÏÏÏÏÏÏÏÏÏ 4 25 4 16 4 17% of net sales ÏÏÏÏÏÏÏÏÏÏÏÏÏÏÏÏÏÏÏÏÏÏÏÏÏÏÏÏÏÏÏÏÏÏÏÏÏÏÏÏÏÏÏÏÏÏÏÏÏ 1% 1% *
* less than 1%
In the 2006 financial year, research and development expenses increased by 11%, from 4390 million to
4433 million, due to our effort to strengthen the development capabilities with respect to the next generation
of memory technologies and further diversification of our portfolio of memory products. We also paid
410 million for research services provided by Infineon in the 2006 financial year after the carve-out.
In the 2005 financial year, research and development expenses increased by 12%, from 4347 million to
4390 million, due to increased spending on the acceleration of the development of next generation memory
technologies, the broadening of our overall portfolio of memory products and reduced government subsidies.
We recognized less in government subsidies, which decreased from 425 million in the 2004 financial year to
416 million in the 2005 financial year, mainly due to the transfer to Infineon of the Dresden 200mm facility to
which a portion of prior subsidies relates.
Some of our research and development projects qualify for subsidies from local and regional governments
where we do business. If the criteria to receive a grant are met, the subsidies received reduce R&D expenses
over the project term as expenses are incurred.
Selling, General and Administrative (SG&A) Expenses
Selling expenses consist primarily of salaries and benefits for personnel engaged in sales and marketing
activities, costs of customer samples, non-R&D costs related to developing prototypes, other marketing
incentives and related marketing expenses.
General and administrative expenses consist primarily of salaries and benefits for administrative
personnel, non-manufacturing related overhead costs, consultancy, legal and other fees for professional
services, and recruitment and training expenses.
The following table sets forth information on our selling, general and administrative expenses for the
periods indicated.
For the financial yearended September 30,
2004 2005 2006
(in millions, exceptpercentages)
Selling, general and administrative expenses ÏÏÏÏÏÏÏÏÏÏÏÏÏÏÏÏÏÏÏÏÏÏÏÏÏ 4232 4206 4215% of net sales ÏÏÏÏÏÏÏÏÏÏÏÏÏÏÏÏÏÏÏÏÏÏÏÏÏÏÏÏÏÏÏÏÏÏÏÏÏÏÏÏÏÏÏÏÏÏÏÏÏ 8% 7% 6%
During the 2006 financial year selling, general and administrative expenses increased by 4% as compared
to the 2005 financial year, from 4206 million to 4215 million. The increase was driven by higher cost
allocations from Infineon through April 30, 2006 and project costs related to the carve-out and IPO. We also
paid 414 million for corporate services provided by Infineon in the 2006 financial year after the carve-out. In
52
Global Reports LLC

addition, in the 2006 financial year we had expenses of 48 million relating to stock based compensation, of
which 43 million are included in selling, general and administrative expenses. The remainder are in other
categories based on the cost centers of the employees concerned. These employees received these options on
Infineon shares when they were Infineon employees in periods prior to our carve-out. We have not yet issued
any options.
During the 2005 financial year, selling, general and administrative expenses declined by 11% from
4232 million to 4206 million as a result of lower cost allocations from Infineon reflecting mainly cost savings
measures, particularly with respect to central services and information technology (IT).
Restructuring Charges
We did not incur any restructuring charges in the 2006 financial year. In the 2004 and 2005 financial
years, we accrued charges of 42 million and 41 million, respectively, for restructuring and cost-saving efforts
taken by Infineon, which included downsizing our workforce and consolidating certain functions and
operations.
Other Operating Expense, Net
The following table sets forth information on our other operating expense, net for the periods indicated.
For the financial yearended September 30,
2004 2005 2006
(in millions, exceptpercentages)
Other operating expense, net ÏÏÏÏÏÏÏÏÏÏÏÏÏÏÏÏÏÏÏÏÏÏÏÏÏÏÏÏÏÏÏÏÏÏÏÏÏÏÏÏ 4194 413 460% of net salesÏÏÏÏÏÏÏÏÏÏÏÏÏÏÏÏÏÏÏÏÏÏÏÏÏÏÏÏÏÏÏÏÏÏÏÏÏÏÏÏÏÏÏÏÏÏÏÏÏÏÏ 6% 0% 1%
In the 2006 financial year other operating expense, net reflected expenses related to litigation settlement
charges of 454 million as well as impairment charges of 49 million related to our decision to ramp down our
flash production and NROM» development activities. Other operating expense, net in the 2004 financial year
related principally to charges from our settlement of an antitrust investigation by the U.S. Department of
Justice, related settlements with customers and a related ongoing investigation in Europe. We accrued reserves
in respect of these matters in the amount of 4194 million in our 2004 financial year. Other operating expense
in the 2005 financial year principally reflected expenses related to antitrust matters.
Equity in (Losses) Earnings of Associated Companies
The following table sets forth information on our equity in losses or earnings of associated companies for
the periods indicated.
For the financial yearended September 30,
2004 2005 2006
(in millions, exceptpercentages)
Equity in (losses) earnings of associated companiesÏÏÏÏÏÏÏÏÏÏÏÏÏÏÏÏÏÏÏÏÏ 4(16) 445 480% of net salesÏÏÏÏÏÏÏÏÏÏÏÏÏÏÏÏÏÏÏÏÏÏÏÏÏÏÏÏÏÏÏÏÏÏÏÏÏÏÏÏÏÏÏÏÏÏÏÏÏÏÏ (1)% 2% 2%
Our principal associated company is Inotera. Inotera is a DRAM manufacturer that we established as a
joint venture with Nanya. Our equity in this venture's earnings has been sensitive to fluctuations in the price of
DRAM. Inotera contributed most of our equity in earnings from associated companies, which increased in the
2006 financial year, reflecting the increased volume production by this joint venture.
53
Global Reports LLC
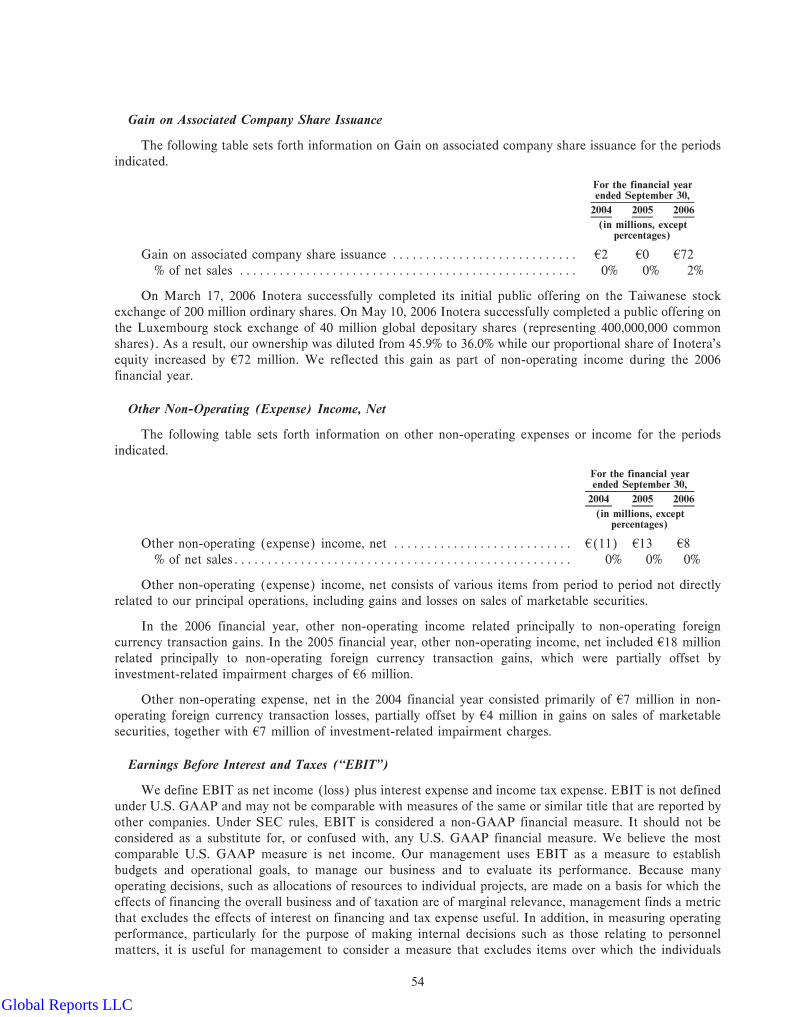
Gain on Associated Company Share Issuance
The following table sets forth information on Gain on associated company share issuance for the periods
indicated.
For the financial yearended September 30,
2004 2005 2006
(in millions, exceptpercentages)
Gain on associated company share issuance ÏÏÏÏÏÏÏÏÏÏÏÏÏÏÏÏÏÏÏÏÏÏÏÏÏÏÏÏ 42 40 472% of net sales ÏÏÏÏÏÏÏÏÏÏÏÏÏÏÏÏÏÏÏÏÏÏÏÏÏÏÏÏÏÏÏÏÏÏÏÏÏÏÏÏÏÏÏÏÏÏÏÏÏÏÏ 0% 0% 2%
On March 17, 2006 Inotera successfully completed its initial public offering on the Taiwanese stock
exchange of 200 million ordinary shares. On May 10, 2006 Inotera successfully completed a public offering on
the Luxembourg stock exchange of 40 million global depositary shares (representing 400,000,000 common
shares). As a result, our ownership was diluted from 45.9% to 36.0% while our proportional share of Inotera's
equity increased by 472 million. We reflected this gain as part of non-operating income during the 2006
financial year.
Other Non-Operating (Expense) Income, Net
The following table sets forth information on other non-operating expenses or income for the periods
indicated.
For the financial yearended September 30,
2004 2005 2006
(in millions, exceptpercentages)
Other non-operating (expense) income, net ÏÏÏÏÏÏÏÏÏÏÏÏÏÏÏÏÏÏÏÏÏÏÏÏÏÏÏ 4(11) 413 48% of net salesÏÏÏÏÏÏÏÏÏÏÏÏÏÏÏÏÏÏÏÏÏÏÏÏÏÏÏÏÏÏÏÏÏÏÏÏÏÏÏÏÏÏÏÏÏÏÏÏÏÏÏ 0% 0% 0%
Other non-operating (expense) income, net consists of various items from period to period not directly
related to our principal operations, including gains and losses on sales of marketable securities.
In the 2006 financial year, other non-operating income related principally to non-operating foreign
currency transaction gains. In the 2005 financial year, other non-operating income, net included 418 million
related principally to non-operating foreign currency transaction gains, which were partially offset by
investment-related impairment charges of 46 million.
Other non-operating expense, net in the 2004 financial year consisted primarily of 47 million in non-
operating foreign currency transaction losses, partially offset by 44 million in gains on sales of marketable
securities, together with 47 million of investment-related impairment charges.
Earnings Before Interest and Taxes (""EBIT'')
We define EBIT as net income (loss) plus interest expense and income tax expense. EBIT is not defined
under U.S. GAAP and may not be comparable with measures of the same or similar title that are reported by
other companies. Under SEC rules, EBIT is considered a non-GAAP financial measure. It should not be
considered as a substitute for, or confused with, any U.S. GAAP financial measure. We believe the most
comparable U.S. GAAP measure is net income. Our management uses EBIT as a measure to establish
budgets and operational goals, to manage our business and to evaluate its performance. Because many
operating decisions, such as allocations of resources to individual projects, are made on a basis for which the
effects of financing the overall business and of taxation are of marginal relevance, management finds a metric
that excludes the effects of interest on financing and tax expense useful. In addition, in measuring operating
performance, particularly for the purpose of making internal decisions such as those relating to personnel
matters, it is useful for management to consider a measure that excludes items over which the individuals
54
Global Reports LLC

being evaluated have minimal control, such as enterprise-level taxation and financing. We report EBIT
information because we believe that it provides investors with meaningful information about our operating
performance in a manner similar to that which management uses to assess and direct the business. EBIT is not
a substitute for net income, however, because the exclusion of interest and tax expense is not appropriate when
reviewing the overall profitability of our company. Although EBIT is our primary measure of evaluating
operating performance, we also evaluate the costs and benefits associated with various financing structures and
the income tax consequences, where relevant and material independent of the operational assessment.
EBIT is determined from the consolidated statements of operations as follows:
For the financial yearended September 30,
2004 2005 2006
(in millions, exceptpercentages)
Net income (loss) ÏÏÏÏÏÏÏÏÏÏÏÏÏÏÏÏÏÏÏÏÏÏÏÏÏÏÏÏÏÏÏÏÏÏÏÏÏÏÏÏÏÏÏÏÏÏÏ 4(79) 4 18 4 74Add: Income tax expense ÏÏÏÏÏÏÏÏÏÏÏÏÏÏÏÏÏÏÏÏÏÏÏÏÏÏÏÏÏÏÏÏÏÏÏÏÏÏÏÏÏ 211 86 114Add: Interest expense, net ÏÏÏÏÏÏÏÏÏÏÏÏÏÏÏÏÏÏÏÏÏÏÏÏÏÏÏÏÏÏÏÏÏÏÏÏÏÏÏÏ 30 7 25
EBIT ÏÏÏÏÏÏÏÏÏÏÏÏÏÏÏÏÏÏÏÏÏÏÏÏÏÏÏÏÏÏÏÏÏÏÏÏÏÏÏÏÏÏÏÏÏÏÏÏÏÏÏÏÏÏÏÏÏÏ 4162 4111 4213
Interest Income (Expense), Net
We derive interest income primarily from cash, cash equivalents and marketable securities. Interest
expense is primarily attributable to loans from Infineon and external banks and excludes interest capitalized on
manufacturing facilities under construction.
The following table sets forth information on our net interest expense for the periods indicated.
For the financial yearended September 30,
2004 2005 2006
(in millions, exceptpercentages)
Interest expense, net ÏÏÏÏÏÏÏÏÏÏÏÏÏÏÏÏÏÏÏÏÏÏÏÏÏÏÏÏÏÏÏÏÏÏÏÏÏÏÏÏÏÏÏÏÏÏ 4(30) 4(7) 4(25)% of net salesÏÏÏÏÏÏÏÏÏÏÏÏÏÏÏÏÏÏÏÏÏÏÏÏÏÏÏÏÏÏÏÏÏÏÏÏÏÏÏÏÏÏÏÏÏÏÏÏÏÏ (1)% 0% (1)%
Capitalized interest ÏÏÏÏÏÏÏÏÏÏÏÏÏÏÏÏÏÏÏÏÏÏÏÏÏÏÏÏÏÏÏÏÏÏÏÏÏÏÏÏÏÏÏÏÏÏÏ 4 9 4 7 4 0
Interest expense mainly relates to interest on amounts due to Infineon, net of interest earned. The
increase in the 2006 financial year was due to higher average borrowings from Infineon.
Interest expense in the 2004 financial year included 421 million paid upon the redemption of the other
investors' ownership interests in the 300mm venture Infineon Technologies SC300 GmbH & Co. OHG
(""SC300'') in Dresden, which we now refer to as our Dresden 300mm facility. Interest expense was partially
reduced in both the 2004 and 2005 financial years as a result of capitalization of interest related to facilities
under construction (principally Inotera and Richmond), as well as interest income from financial derivatives.
Income Taxes
The following table sets forth information on our income taxes for the periods indicated.
For the financial year endedSeptember 30,
2004 2005 2006
(in millions, exceptpercentages)
Income tax expense ÏÏÏÏÏÏÏÏÏÏÏÏÏÏÏÏÏÏÏÏÏÏÏÏÏÏÏÏÏÏÏÏÏÏÏÏÏÏÏÏÏÏÏÏ 4(211) 4(86) 4(114)% of net sales ÏÏÏÏÏÏÏÏÏÏÏÏÏÏÏÏÏÏÏÏÏÏÏÏÏÏÏÏÏÏÏÏÏÏÏÏÏÏÏÏÏÏÏÏÏÏÏ (7)% (3)% (3)%
Effective tax rate ÏÏÏÏÏÏÏÏÏÏÏÏÏÏÏÏÏÏÏÏÏÏÏÏÏÏÏÏÏÏÏÏÏÏÏÏÏÏÏÏÏÏÏÏÏÏ 160% 83% 61%
55
Global Reports LLC

We assess our deferred tax asset and the need for a valuation allowance pursuant to SFAS No. 109. As a
result of this assessment, we have increased our deferred tax asset valuation allowance in our 2004, 2005 and
2006 financial years to reduce the net deferred tax asset to an amount that is more likely than not expected to
be realized in future periods. Our effective tax rate in the 2005 financial year was substantially higher than our
statutory tax rate due to increases in our valuation allowances, for losses which can not be utilized by us and
have been retained by Infineon. In the 2006 financial year our effective rate was still higher than our statutory
rate, but lower than in the 2005 financial year, as a result of reduced losses in jurisdictions for which tax
benefits could not be recognized, since for certain jurisdictions losses prior to our carve-out could not be used
to offset taxable income after our carve-out.
Net Income (Loss)
Our net income increased from 418 million in the 2005 financial year to 474 million in the 2006 financial
year and improved from a net loss of 479 million in the 2004 financial year to net income of 418 million in the
2005 financial year.
Financial Condition
The following table sets forth selected items from our combined and consolidated balance sheets for the
periods indicated.
As of September 30,
2005 2006 % Change
(in millions, except percentages)
Current assets ÏÏÏÏÏÏÏÏÏÏÏÏÏÏÏÏÏÏÏÏÏÏÏÏÏÏÏÏÏÏÏÏÏÏÏÏÏÏÏÏÏÏÏÏÏ 41,802 42,807 56%
Non-current assets ÏÏÏÏÏÏÏÏÏÏÏÏÏÏÏÏÏÏÏÏÏÏÏÏÏÏÏÏÏÏÏÏÏÏÏÏÏÏÏÏÏ 3,059 3,054 0
Total assets ÏÏÏÏÏÏÏÏÏÏÏÏÏÏÏÏÏÏÏÏÏÏÏÏÏÏÏÏÏÏÏÏÏÏÏÏÏÏÏÏÏÏÏÏÏÏÏ 4,861 5,861 21
Current liabilities ÏÏÏÏÏÏÏÏÏÏÏÏÏÏÏÏÏÏÏÏÏÏÏÏÏÏÏÏÏÏÏÏÏÏÏÏÏÏÏÏÏÏ 1,365 1,479 8
Non-current liabilities ÏÏÏÏÏÏÏÏÏÏÏÏÏÏÏÏÏÏÏÏÏÏÏÏÏÏÏÏÏÏÏÏÏÏÏÏÏÏ 529 511 (3)
Total liabilities ÏÏÏÏÏÏÏÏÏÏÏÏÏÏÏÏÏÏÏÏÏÏÏÏÏÏÏÏÏÏÏÏÏÏÏÏÏÏÏÏÏÏÏÏ 1,894 1,990 5
Business/Shareholders' equity ÏÏÏÏÏÏÏÏÏÏÏÏÏÏÏÏÏÏÏÏÏÏÏÏÏÏÏÏÏÏÏ 42,967 43,871 30%
As of September 30, 2006, our total assets increased as compared to September 30, 2005. Total current
assets increased primarily due to increased trade accounts receivable and inventories reflecting our sales
growth. Non-current assets decreased slightly because depreciation expenses more than offset capital
expenditures.
Current liabilities increased as of September 30, 2006 due to increased accounts payable, which reflected
increased purchases from our foundry partners and increased capital expenditures. Non-current liabilities
mainly decreased due to the recognition of deferred government grants.
As of September, 2006, our shareholders' equity increased, principally due to advances made to us by
Infineon and additional capital from our IPO. At September 30, 2006, our debt-to-equity ratio, which we
define as total liabilities divided by our shareholders' equity, decreased to 51% from 64% at September 30,
2005. At September, 2006 our equity-to-fixed-assets ratio, which we define as our shareholders' equity divided
by property, plant and equipment, was 186%, compared to 134% at September 30, 2005.
Liquidity
Cash Flows
Our consolidated statement of cash flows shows the sources and uses of cash during the reported periods.
It is of key importance for the evaluation of our financial position. Although our combined and consolidated
statements of operations and balance sheets include allocations of financial statement line items from
56
Global Reports LLC
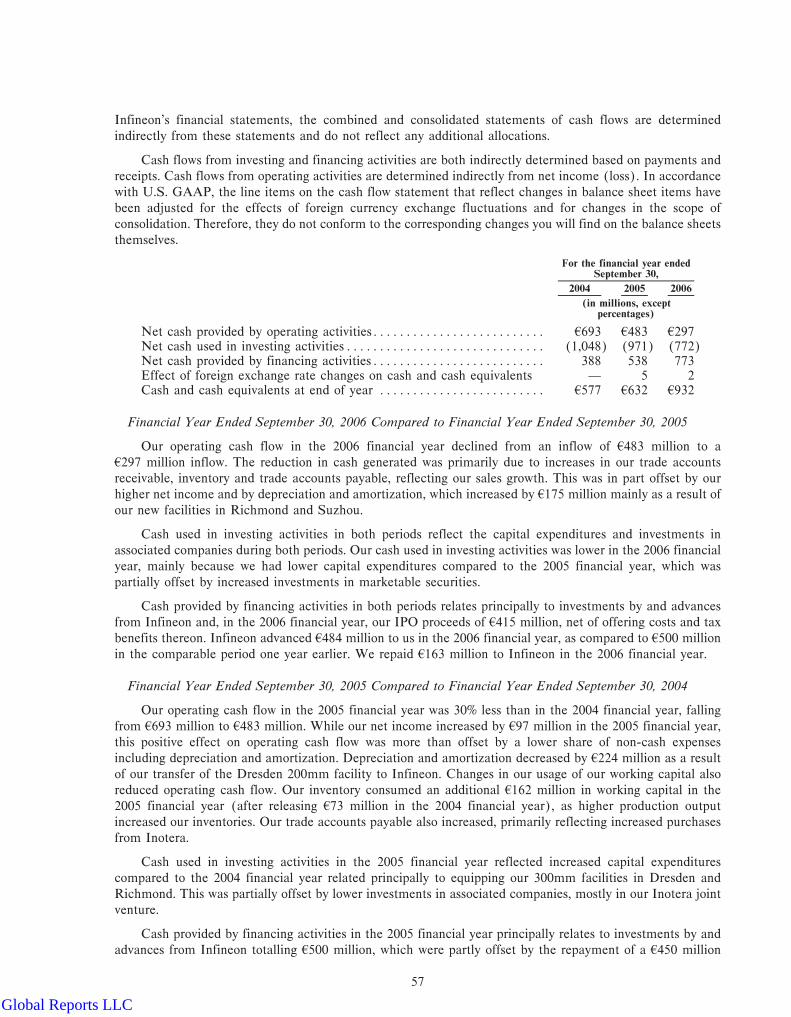
Infineon's financial statements, the combined and consolidated statements of cash flows are determined
indirectly from these statements and do not reflect any additional allocations.
Cash flows from investing and financing activities are both indirectly determined based on payments and
receipts. Cash flows from operating activities are determined indirectly from net income (loss). In accordance
with U.S. GAAP, the line items on the cash flow statement that reflect changes in balance sheet items have
been adjusted for the effects of foreign currency exchange fluctuations and for changes in the scope of
consolidation. Therefore, they do not conform to the corresponding changes you will find on the balance sheets
themselves.
For the financial year endedSeptember 30,
2004 2005 2006
(in millions, exceptpercentages)
Net cash provided by operating activitiesÏÏÏÏÏÏÏÏÏÏÏÏÏÏÏÏÏÏÏÏÏÏÏÏÏÏ 4693 4483 4297Net cash used in investing activitiesÏÏÏÏÏÏÏÏÏÏÏÏÏÏÏÏÏÏÏÏÏÏÏÏÏÏÏÏÏÏ (1,048) (971) (772)Net cash provided by financing activitiesÏÏÏÏÏÏÏÏÏÏÏÏÏÏÏÏÏÏÏÏÏÏÏÏÏÏ 388 538 773Effect of foreign exchange rate changes on cash and cash equivalents Ì 5 2Cash and cash equivalents at end of year ÏÏÏÏÏÏÏÏÏÏÏÏÏÏÏÏÏÏÏÏÏÏÏÏÏ 4577 4632 4932
Financial Year Ended September 30, 2006 Compared to Financial Year Ended September 30, 2005
Our operating cash flow in the 2006 financial year declined from an inflow of 4483 million to a
4297 million inflow. The reduction in cash generated was primarily due to increases in our trade accounts
receivable, inventory and trade accounts payable, reflecting our sales growth. This was in part offset by our
higher net income and by depreciation and amortization, which increased by 4175 million mainly as a result of
our new facilities in Richmond and Suzhou.
Cash used in investing activities in both periods reflect the capital expenditures and investments in
associated companies during both periods. Our cash used in investing activities was lower in the 2006 financial
year, mainly because we had lower capital expenditures compared to the 2005 financial year, which was
partially offset by increased investments in marketable securities.
Cash provided by financing activities in both periods relates principally to investments by and advances
from Infineon and, in the 2006 financial year, our IPO proceeds of 4415 million, net of offering costs and tax
benefits thereon. Infineon advanced 4484 million to us in the 2006 financial year, as compared to 4500 million
in the comparable period one year earlier. We repaid 4163 million to Infineon in the 2006 financial year.
Financial Year Ended September 30, 2005 Compared to Financial Year Ended September 30, 2004
Our operating cash flow in the 2005 financial year was 30% less than in the 2004 financial year, falling
from 4693 million to 4483 million. While our net income increased by 497 million in the 2005 financial year,
this positive effect on operating cash flow was more than offset by a lower share of non-cash expenses
including depreciation and amortization. Depreciation and amortization decreased by 4224 million as a result
of our transfer of the Dresden 200mm facility to Infineon. Changes in our usage of our working capital also
reduced operating cash flow. Our inventory consumed an additional 4162 million in working capital in the
2005 financial year (after releasing 473 million in the 2004 financial year), as higher production output
increased our inventories. Our trade accounts payable also increased, primarily reflecting increased purchases
from Inotera.
Cash used in investing activities in the 2005 financial year reflected increased capital expenditures
compared to the 2004 financial year related principally to equipping our 300mm facilities in Dresden and
Richmond. This was partially offset by lower investments in associated companies, mostly in our Inotera joint
venture.
Cash provided by financing activities in the 2005 financial year principally relates to investments by and
advances from Infineon totalling 4500 million, which were partly offset by the repayment of a 4450 million
57
Global Reports LLC

loan entered into in connection with the expansion of our 300mm facility in Dresden. In the 2004 financial
year, Infineon advanced 4165 million to us.
Free Cash Flow
We define free cash flow as cash from operating and investing activities excluding purchases or sales of
marketable securities. Free cash flow is not defined under U.S. GAAP and may not be comparable with
measures of the same or similar title that are reported by other companies. Under SEC rules, ""free cash flow''
is considered a non-GAAP financial measure. It should not be considered as a substitute for, or confused with,
any U.S. GAAP financial measure. We believe the most comparable U.S. GAAP measure is net cash
provided by operating activities. Since we operate in a capital-intensive industry, we report free cash flow to
provide investors with a measure that can be used to evaluate changes in liquidity after taking capital
expenditures into account. It is not intended to represent residual cash flow available for discretionary
expenditures, since debt service requirements or other non-discretionary expenditures are not deducted. The
free cash flow is determined as follows from our consolidated statements of cash flows:
For the financial year endedSeptember 30,
2004 2005 2006
(in millions, exceptpercentages)
Net cash provided by operating activitiesÏÏÏÏÏÏÏÏÏÏÏÏÏÏÏÏÏÏÏÏÏÏÏÏ 4 693 4 483 4 297Net cash used in investing activitiesÏÏÏÏÏÏÏÏÏÏÏÏÏÏÏÏÏÏÏÏÏÏÏÏÏÏÏÏ (1,048) (971) (772)Net (proceeds) purchases of marketable securities ÏÏÏÏÏÏÏÏÏÏÏÏÏÏÏ (17) (1) 138
Free cash flow ÏÏÏÏÏÏÏÏÏÏÏÏÏÏÏÏÏÏÏÏÏÏÏÏÏÏÏÏÏÏÏÏÏÏÏÏÏÏÏÏÏÏÏÏÏÏ 4 (372) 4(489) 4(337)
Free cash flow was negative in each financial year because capital expenditures exceeded the cash
provided from operating activities. Prior to the carve-out this shortfall was financed principally by advances
from Infineon and subsequent to the carve-out was financed by our available cash balances.
Net Cash Position
The following table presents our gross and net cash positions and the maturity of our debt. It is not
intended to be a forecast of cash available to us in future periods.
Payments due by period
Less than AfterAs of September 30, 2006 Total 1 year 1-2 years 2-3 years 3-4 years 4-5 years 5 years
(in millions)
Cash and cash equivalents ÏÏÏÏÏÏ 4 932 4932 4 Ì 4 Ì 4 Ì 4 Ì 4 ÌMarketable securitiesÏÏÏÏÏÏÏÏÏÏÏ 138 138
Gross cash position ÏÏÏÏÏÏÏÏÏÏÏÏ 1,070 1,070
Less: ÏÏÏÏÏÏÏÏÏÏÏÏÏÏÏÏÏÏÏÏÏÏÏÏ Ì Ì Ì Ì ÌLong-term debt ÏÏÏÏÏÏÏÏÏÏÏÏÏ 151 Ì 21 21 21 21 67Short-term debt and current
maturities ÏÏÏÏÏÏÏÏÏÏÏÏÏÏÏÏ 344 344 Ì Ì Ì Ì Ì
Total financial debt ÏÏÏÏÏÏÏÏÏÏÏÏ 495 344 21 21 21 21 67
Net cash position ÏÏÏÏÏÏÏÏÏÏÏÏÏÏ 4 575 4726 4(21) 4(21) 4(21) 4(21) 4(67)
Our gross cash position increased to 41,070 million at September 30, 2006, compared with 4632 million
at the prior year end. As part of Infineon, our historical capital structure was based on the assumption that our
net cash position is zero. The capital structure attributed to us in connection with the preparation of the
combined financial statements, based as it is on the business equity concept and without independent
financing, is not indicative of the capital structure that we would have required had we been an independent
company during the financial periods presented, and will almost certainly differ from our capital structure in
the future.
58
Global Reports LLC

Short-term debt consists of loans from Infineon totalling 4344 million, which do not carry any restrictions
on their use. These loans bear interest at floating rates determined by reference to market interest rates. Long-
term debt principally consists of an unsecured loan from banks of 4124 million, which is restricted to use in
Module 2 of our backend facility in Porto, Portugal, and used primarily for the financing of R&D projects and
construction at that facility. A 427 million note payable to a governmental entity in connection with our
Richmond plant had been fully drawn as of September 30, 2006. These loans bear interest at a floating rate.
To secure our cash position and to maintain flexibility with regards to liquidity, we have implemented a
risk management policy with risk limits with respect to counterparty, credit rating, sector, duration, credit
support and type of instrument. See note 30 to the combined and consolidated financial statements included
elsewhere in this annual report.
Capital Requirements
We require capital in our 2007 financial year to:
‚ finance our operations;
‚ make scheduled debt payments;
‚ settle contingencies if and when they occur; and
‚ make planned capital expenditures.
We expect to meet these requirements through:
‚ cash flow generated from operations;
‚ cash on hand and securities we can sell;
‚ available credit facilities;
‚ the proceeds from the IPO; and
‚ capital market transactions we may engage in the future.
As of September 30, 2006, we require funds for the 2007 financial year aggregating 41,175 million. This
consists of 4831 million for commitments and our 4344 million shareholder loan from Infineon Technologies
Holding B.V. with initial maturities in July and August 2007, which may be extended upon mutual agreement
up to the second anniversary of our IPO. In addition, we may need up to 4113 million for currently known
contingencies. We also plan to invest up to an additional 4471 million in capital expenditures that have not
been otherwise committed. The aggregate capital required for such commitments, contingencies and planned
capital expenditures during the 2007 financial year is 41,759 million as of September 30, 2006. We have a
gross cash position (which we define as cash and cash equivalents plus marketable securities) of 41,070 mil-
lion as of September 30, 2006. Our sources of funding, in addition to this cash position, include our cash flows
from operations (we generated cash flows from operations of 4297 million in our 2006 financial year) and our
ability to draw 4250 million from our revolving credit facility described below. We can also draw, for short-
term purposes, on the working capital lines we maintain in several locations in an aggregate amount of
4177 million; there were no amounts outstanding under these facilities as of September 30, 2006.
59
Global Reports LLC

Commitments and Contingencies
The following table sets forth information on our commitments and known contingencies by due date or
expiration.
Payments due/expirations by period(1)
Less than AfterAs of September 30, 2006(2)(3) Total 1 year 1-2 years 2-3 years 3-4 years 4-5 years 5 years
(in millions)
Other contractual liabilities reflected onthe balance sheet:
Settlement for antitrust relatedmatters(4) ÏÏÏÏÏÏÏÏÏÏÏÏÏÏÏÏÏÏÏÏÏÏÏÏ 4 88 4 24 4 22 422 420 4Ì 4 Ì
Contractual commitments:
Operating lease paymentsÏÏÏÏÏÏÏÏÏÏÏ 4 107 4 27 4 26 424 4 9 4 8 4 13
Unconditional purchasecommitments(5) ÏÏÏÏÏÏÏÏÏÏÏÏÏÏÏÏÏ 954 738 50 38 38 40 50
Other long-term commitments ÏÏÏÏÏÏ 132 66 66 Ì Ì Ì Ì
Total commitmentsÏÏÏÏÏÏÏÏÏÏÏÏÏÏÏÏÏÏ 41,193 4 831 4142 462 447 448 4 63
Other contingencies:
Guarantees(6) ÏÏÏÏÏÏÏÏÏÏÏÏÏÏÏÏÏÏÏÏÏ 4 71 4 Ì 4 2 4 7 4Ì 4 9 4 53
Contingent government grants(7) ÏÏÏÏÏ 452 113 111 18 43 22 145
Total contingencies ÏÏÏÏÏÏÏÏÏÏÏÏÏÏÏÏÏÏ 4 523 4 113 4113 425 443 431 4198
(1) The above table should be read together with note 31 to our combined and consolidated financial
statements.(2) Certain payments of obligations or expiration of commitments that are based on the achievement of
milestones or other events that are not date-certain are included in this table, based on our estimate of the
reasonably likely timing of payments or expirations in each particular case. Actual outcomes could differ
from those estimates.(3) Product purchase commitments associated with capacity reservation agreements are not included in this
table, since the purchase prices are based in part on future market prices, and are accordingly not
quantifiable as of September 30, 2005 and 2006. Purchases under these agreements aggregated approxi-
mately 41,185 million for the 2006 financial year and 4520 million for the 2005 financial year.(4) These amounts are recorded as other current or other non-current liabilities on our balance sheet and
reflect payments to be made under settlement agreements relating to antitrust matters.(5) Primarily purchase orders that have been placed with suppliers of fixed assets, raw materials and services.
Fixed price orders for products from our foundry partners are also shown here.(6) Guarantees are mainly issued by the parent company for the payment of import duties, rentals of buildings,
contingent obligations related to government grants received.(7) ""Contingent government grants'' refers to amounts previously received that are related to the construction
and financing of certain production facilities, but that are not guaranteed otherwise. These could be
repayable if the total project requirements are not met.
60
Global Reports LLC
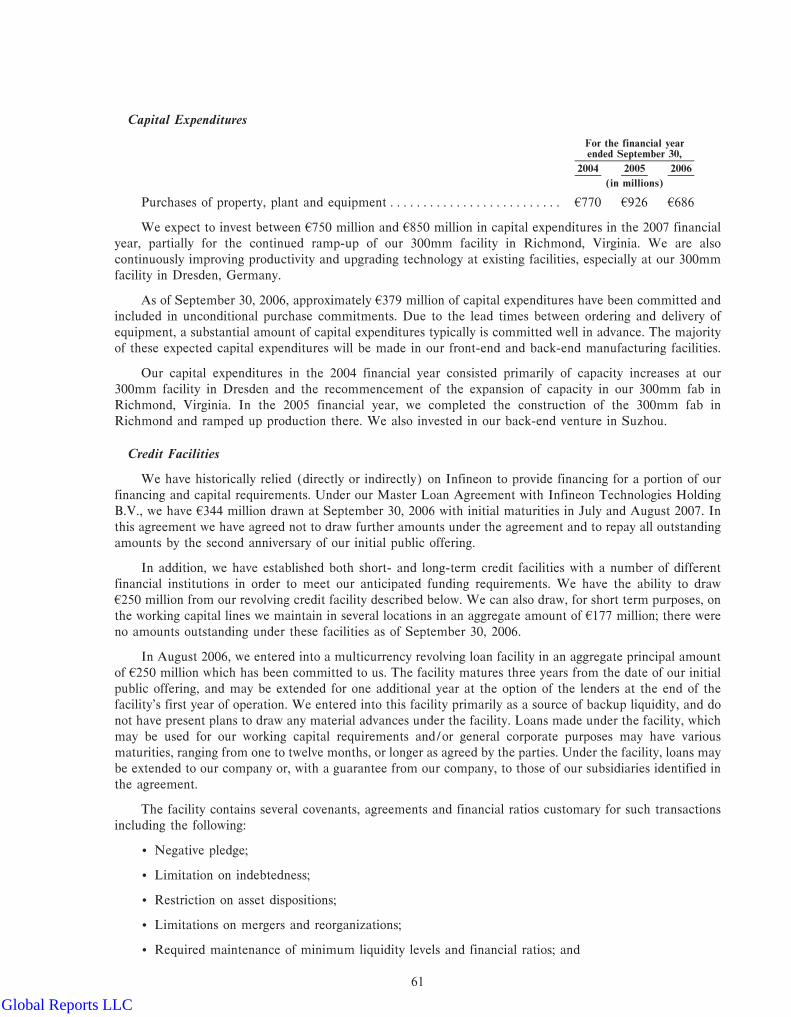
Capital Expenditures
For the financial yearended September 30,
2004 2005 2006
(in millions)
Purchases of property, plant and equipment ÏÏÏÏÏÏÏÏÏÏÏÏÏÏÏÏÏÏÏÏÏÏÏÏÏÏ 4770 4926 4686
We expect to invest between 4750 million and 4850 million in capital expenditures in the 2007 financial
year, partially for the continued ramp-up of our 300mm facility in Richmond, Virginia. We are also
continuously improving productivity and upgrading technology at existing facilities, especially at our 300mm
facility in Dresden, Germany.
As of September 30, 2006, approximately 4379 million of capital expenditures have been committed and
included in unconditional purchase commitments. Due to the lead times between ordering and delivery of
equipment, a substantial amount of capital expenditures typically is committed well in advance. The majority
of these expected capital expenditures will be made in our front-end and back-end manufacturing facilities.
Our capital expenditures in the 2004 financial year consisted primarily of capacity increases at our
300mm facility in Dresden and the recommencement of the expansion of capacity in our 300mm fab in
Richmond, Virginia. In the 2005 financial year, we completed the construction of the 300mm fab in
Richmond and ramped up production there. We also invested in our back-end venture in Suzhou.
Credit Facilities
We have historically relied (directly or indirectly) on Infineon to provide financing for a portion of our
financing and capital requirements. Under our Master Loan Agreement with Infineon Technologies Holding
B.V., we have 4344 million drawn at September 30, 2006 with initial maturities in July and August 2007. In
this agreement we have agreed not to draw further amounts under the agreement and to repay all outstanding
amounts by the second anniversary of our initial public offering.
In addition, we have established both short- and long-term credit facilities with a number of different
financial institutions in order to meet our anticipated funding requirements. We have the ability to draw
4250 million from our revolving credit facility described below. We can also draw, for short term purposes, on
the working capital lines we maintain in several locations in an aggregate amount of 4177 million; there were
no amounts outstanding under these facilities as of September 30, 2006.
In August 2006, we entered into a multicurrency revolving loan facility in an aggregate principal amount
of 4250 million which has been committed to us. The facility matures three years from the date of our initial
public offering, and may be extended for one additional year at the option of the lenders at the end of the
facility's first year of operation. We entered into this facility primarily as a source of backup liquidity, and do
not have present plans to draw any material advances under the facility. Loans made under the facility, which
may be used for our working capital requirements and/or general corporate purposes may have various
maturities, ranging from one to twelve months, or longer as agreed by the parties. Under the facility, loans may
be extended to our company or, with a guarantee from our company, to those of our subsidiaries identified in
the agreement.
The facility contains several covenants, agreements and financial ratios customary for such transactions
including the following:
‚ Negative pledge;
‚ Limitation on indebtedness;
‚ Restriction on asset dispositions;
‚ Limitations on mergers and reorganizations;
‚ Required maintenance of minimum liquidity levels and financial ratios; and
61
Global Reports LLC

‚ Limitation on dividend payments.
Loans under the facility will bear interest at either EURIBOR or LIBOR, depending on the currency
borrowed, plus a margin based in part on a measure of our earnings. If we issue senior unsecured bonds, or if
we provide a senior guarantee for such bonds issued by a finance subsidiary, we will have to repay any
outstanding amounts we have borrowed under the facility and redraw them from our subsidiary Qimonda
Holding B.V. prior to the bonds' issuance. In that case, we will also have to use all commercially reasonable
efforts to arrange for the transfer of our interest in Inotera Memories, Inc. to our subsidiary Qimonda Holding
B.V. Funds drawn under the facility will not be used to repay indebtedness to Infineon and the agreement will
contain restrictions on our ability to repay indebtedness to Infineon other than from capital market issuance,
unless our liquidity exceeds certain levels.
The facility is subject to a provision permitting lenders to terminate their advances if a person or group of
persons, acting in concert, other than Infineon, gains either 35% of our company's voting power or other
indices of control or share ownership exceeding 35% of our issued share capital.
Subject to conditions in the capital markets, we expect from time to time during the period after our
initial public offering to consider engaging in additional financing transactions. We would expect to use a
portion or all of the proceeds from any such transactions to refinance some or all our indebtedness to Infineon.
A 4124 million non-recourse project financing facility for the expansion of the Porto, Portugal
manufacturing facility was executed in May 2005. As of September 30, 2006, this facility was fully drawn.
This loan is on the books of the Porto entity, which was transferred to us as part of the carve-out.
A 427 million note payable to a government entity in connection with our Richmond plant had been fully
drawn as of September 30, 2006.
At September 30, 2006, we were in compliance with our debt covenants under the relevant facilities.
We plan to fund our working capital requirements from cash provided by operations, available funds,
bank loans, government subsidies and, if needed, the issuance of additional debt or equity securities. We have
also applied for governmental subsidies in connection with certain capital expenditure projects, but can
provide no assurance that such subsidies will be granted on a timely basis or at all. We can provide no
assurance that we will be able to obtain additional financing for our research and development, working capital
or investment requirements or that any such financing, if available, will be on terms favorable to us.
Taking into consideration the financial resources available to us, including our internally generated funds
and currently available borrowing facilities, we believe that we will be in a position to fund our capital
requirements in the 2007 financial year.
Pension Plan Funding
Our company's projected benefit obligation, which considers future compensation increases, amounted to
456 million at September 30, 2006, compared to 465 million at September 30, 2005. The fair value of plan
assets as of September 30, 2006 was 427 million, compared to 434 million as of September 30, 2005.
We have estimated the return on plan assets for the next financial year to be 5.86% for domestic plans
and 6.41% for foreign plans. The actual return on plan assets between the last measurement dates amounted to
4.40% for domestic plans and 6.40% for foreign plans, compared to the expected return on plan assets for that
period of 6.47% for domestic plans and 6.63% for foreign plans.
At September 30, 2005 and 2006, the funding status of our domestic and foreign pension plans reflected
an underfunding of 431 million and 429 million, respectively, and we recognized these amounts on our balance
sheets on those dates, net of unrecognized actuarial losses of 44 million and 47 million, respectively. As the
value of our expected future benefits payable over the years through 2016 was 412 million on September 30,
2006, we do not perceive a need to increase our plan funding in the immediate future.
Our investment approach with respect to the pension plans involves employing a sufficient level of
flexibility to capture investment opportunities as they occur, while maintaining reasonable parameters to
62
Global Reports LLC
ensure that prudence and care are exercised in the execution of the investment program. The pension plans'
assets are invested with an investment manager in co-operation with an investment consultant. Considering
the duration of the underlying liabilities, a portfolio of investments of plan assets in equity securities, debt
securities and other assets is targeted to maximize the long-term return on plan assets for a given level of risk.
Investment risk is monitored on an ongoing basis through periodic portfolio reviews, meetings with investment
managers and liability measurements. Investment policies and strategies are periodically reviewed to ensure
the objectives of the plans are met considering any changes in benefit plan design, market conditions or other
material items.
Our asset allocation targets for pension plan assets are based on our assessment of business and financial
conditions, demographic and actuarial data, funding characteristics, related risk factors, market sensitivity
analyses and other relevant factors. The overall allocation is expected to help protect the plans' level of funding
while generating sufficiently stable real returns (i.e., net of inflation) to meet current and future benefit
payment needs. Due to active portfolio management, the asset allocation may differ from the target allocation
up to certain limits. As a matter of policy, our pension plans will not be permitted to invest in our company or
Infineon AG shares. We intend that the Qimonda Pension Trust will adopt an asset allocation strategy similar
to that of the Infineon Pension Trust, which employs a mix of active and passive investment management
programs. In September and October 2006 Infineon Pension Trust transferred 426 million of cash to the
Qimonda Pension Trust for use in funding these pension benefit obligations, thereby reducing accrued pension
liabilities. Beginning in October the Pension Trust will invest this cash in a well diversified portfolio of
investments aimed at maximizing long term returns.
Research and Development
Research and development form a significant part of our operations. Our research and development
expenses were 4433 million in the 2006 financial year and 4390 million in the 2005 financial year. We plan to
make additional research and development expenditures in the range of 4430 million to 4460 million during
the 2007 financial year. We intend to fund these expenditures in the normal course of business through cash
provided by operating activities. For a description of our research and development policies, please see ""Our
Business Ì Research and Development.''
Quantitative and Qualitative Disclosure About Market Risk
Market risk is the risk of loss related to adverse changes in market prices, including commodity prices,
foreign exchange rates and interest rates, of financial instruments. We are exposed to various financial market
risks in our ordinary course business transactions, primarily from changes in commodity prices, foreign
exchange rates and interest rates. We use derivative instruments to manage these risks. Since the carve-out
from Infineon, Qimonda has set up a separate financial risk management function. We enter into diverse
financial transactions with several counterparties to limit our risk. Derivative instruments are only used for
hedging purposes and not for speculative purposes. You should read the following discussion of the categories
of market risk to which we are exposed in conjunction with notes 2, 29 and 30 to our combined and
consolidated financial statements.
Commodity Price Risk
A significant portion of our business is exposed to fluctuations in market prices for standard DRAM
products. For these products, the sales price responds to market forces in a way similar to that of other
commodities. This price volatility can be extreme and has resulted in significant fluctuations within relatively
short time-frames. We attempt to mitigate the effects of volatility by continuously improving our cost position,
by entering into new strategic partnerships and by focusing our product portfolio on application-specific
products that are subject to less volatility, such as DRAM products for infrastructure, graphics, mobile and
consumer applications.
63
Global Reports LLC

We are also exposed to commodity price risks with respect to raw materials used in the manufacture of
our products. We seek to minimize these risks through our sourcing policies (including the use of multiple
sources, where possible) and our operating procedures.
We do not use derivative financial instruments to manage any exposure to fluctuations in commodity
prices remaining after the operating measures we describe above.
Foreign Exchange Rate Risk
Although we prepare our combined and consolidated financial statements in euro, most of our sales
volumes, as well as slightly over one-half of our costs, (primarily those relating to design, manufacturing,
selling, marketing, general and administrative functions, and research and development of products), are
denominated in other currencies, primarily U.S. dollars. The portions of our sales and expenses denominated
in currencies other than the euro are exposed to exchange rate fluctuations in the values of these currencies
relative to the euro. We are therefore subject to both transaction and translation risk. For more information on
these risks, please refer to ""Ì Factors that Affect our Results of Operations Ì Exchange Rate Fluctuations''.
Exchange rate fluctuations may have substantial effects on our sales, our costs and our overall results of
operations. Although the U.S. dollar was weaker on September 30, 2006 than it had been one year earlier, the
average exchange rate of U.S. dollars for euro over the 2006 financial year was stronger, increasing 3% from
U.S. $1.00 • 40.7869 to U.S. $1.00 • 40.8117.
The table below provides information about derivative financial instruments as of September 30, 2006
including those foreign currency forward contracts sensitive to changes in foreign currency exchange and
interest rates. For foreign currency forward contracts related to certain sale and purchase transactions, the
table presents the notional amounts and the weighted average contractual foreign exchange rates.
The euro equivalent notional amounts in millions and fair values of our derivative instruments as of
September 30, 2005 and 2006 are as follows:
As of September 30,
2005 2006
Notional Fair Notional Fairamount value amount value
(in millions)
Forward contracts sold:U.S. dollar ÏÏÏÏÏÏÏÏÏÏÏÏÏÏÏÏÏÏÏÏÏÏÏÏÏÏÏÏÏÏÏÏÏÏÏÏÏÏÏÏÏ 442 42 4168 4 (1)Japanese yen ÏÏÏÏÏÏÏÏÏÏÏÏÏÏÏÏÏÏÏÏÏÏÏÏÏÏÏÏÏÏÏÏÏÏÏÏÏÏÏ 34 Ì 26 Ì
Forward contracts purchased:U.S. dollar ÏÏÏÏÏÏÏÏÏÏÏÏÏÏÏÏÏÏÏÏÏÏÏÏÏÏÏÏÏÏÏÏÏÏÏÏÏÏÏÏÏ 122 1 17 ÌJapanese yen ÏÏÏÏÏÏÏÏÏÏÏÏÏÏÏÏÏÏÏÏÏÏÏÏÏÏÏÏÏÏÏÏÏÏÏÏÏÏÏ Ì Ì 22 ÌSingapore dollarÏÏÏÏÏÏÏÏÏÏÏÏÏÏÏÏÏÏÏÏÏÏÏÏÏÏÏÏÏÏÏÏÏÏÏÏÏ Ì Ì 3 ÌMalaysian ringgit ÏÏÏÏÏÏÏÏÏÏÏÏÏÏÏÏÏÏÏÏÏÏÏÏÏÏÏÏÏÏÏÏÏÏÏÏ 11 Ì 5 ÌOther currencies ÏÏÏÏÏÏÏÏÏÏÏÏÏÏÏÏÏÏÏÏÏÏÏÏÏÏÏÏÏÏÏÏÏÏÏÏ 16 Ì Ì Ì
OtherÏÏÏÏÏÏÏÏÏÏÏÏÏÏÏÏÏÏÏÏÏÏÏÏÏÏÏÏÏÏÏÏÏÏÏÏÏÏÏÏÏÏÏÏÏÏÏÏ Ì Ì 94 5
Fair value, net ÏÏÏÏÏÏÏÏÏÏÏÏÏÏÏÏÏÏÏÏÏÏÏÏÏÏÏÏÏÏÏÏÏÏÏÏÏÏÏÏ 43 4 4
Before our carve-out occurred, these financial instruments were financial instruments of Infineon that
were specifically identified to the Memory Products business. We have entered into our own financial
instruments for hedging purposes. We do not enter into derivative transactions for trading or speculative
purposes.
Our policy with respect to limiting short-term foreign currency exposure generally is to economically
hedge at least 75% of our estimated net exposure for a minimum period of two months in advance and,
depending on the nature of the underlying transactions, a significant portion of the period thereafter. Our
foreign currency exposure resulting from differences between actual and forecasted amounts cannot be
mitigated. We calculate this net exposure on a cash-flow basis taking into account balance sheet items, actual
orders received or made and all other planned revenues and expenses.
64
Global Reports LLC
We record our derivative instruments according to the provisions of SFAS No. 133 ""Accounting for
Derivative Instruments and Hedging Activities'', as amended.
SFAS No. 133 requires all derivative instruments to be recorded on the balance sheet at their fair value.
Gains and losses resulting from changes in the fair values of those derivatives are accounted for depending on
the use of the derivative instrument and whether it qualifies for hedge accounting. Our economic hedges are
generally not considered hedges under SFAS No. 133. We report these derivatives at fair value in our
combined and consolidated financial statements, with changes in fair values recorded on our statement of
operations.
In the 2006 financial year, our allocated foreign exchange transaction gains amounted to 42 million and
were offset by losses from our economic hedge transactions of 44 million, resulting in a net loss of 42 million.
This compares to foreign exchange gains of 418 million, offset by hedging losses of 41 million, resulting in a
net gain of 417 million in the 2005 financial year. For purposes of the carve-out, foreign exchange gains and
losses were allocated based on Infineon's segments' proportions of total costs.
Interest Rate Risk
We are exposed to interest rate risk through our fixed term deposits and loans. Due to the high volatility
of our core business and to maintain high operational flexibility, we have historically kept a substantial amount
of cash and cash equivalents. These assets are mainly invested in instruments with contractual maturities
ranging from three to twelve months, bearing interest at short-term rates. To reduce the risk caused by
changes in market interest rates, we attempt to align the duration of the interest rates of our debts and current
assets by the use of interest rate derivatives. We had no outstanding interest rate transactions at September 30,
2006.
Fluctuating interest rates have an impact on parts of our financial instruments such as cash and
marketable securities as well as our interest-bearing debt obligations. Since we have historically received
financing from Infineon, we did not have a specific need to enter into derivative instruments such as interest
rate swaps to hedge against adverse interest rate developments. We anticipate making use of such instruments
depending on the nature of our debt financing in the future.
Based on our long and short term debt outstanding on September 30, 2006 and the interest rates in effect
at that time for those loans a 1% increase or decrease in our overall interest rate environment would (keeping
all other variables constant) have increased or decreased our annualized debt service cost by an estimated
45 million.
Off-Balance Sheet Arrangements
We have no off-balance sheet arrangements other than operating leases in respect of office equipment
including personal computers and workstations. These arrangements are not material.
Outlook
Our revenues are a function of the bit volume we ship and the selling price we achieve for our products.
While we have an influence over our production growth, through capacity additions and productivity
improvements, our sales volume depends on the extent to which our product offerings match market demand.
Our selling prices are a function of the supply and demand relationship in the DRAM market. These market
forces are beyond our control and accordingly, we can not reliably estimate what these future sales prices, and
the resulting revenues and the contribution to our earnings will be.
65
Global Reports LLC

For the 2007 financial year, we expect bit demand to be driven in part by the introduction of the Windows
Vista operating system and continued strong growth for DRAM products in consumer and communication
applications. More specifically, we expect the overall DRAM market, measured in bits, to grow between 55
and 65 percent. We intend to increase our bit production in line with overall market growth based on our
investment in additional capacities in the Richmond 300mm manufacturing facility and the ramp-up of the
second 300mm module at our Inotera joint venture. In addition, during the 2007 financial year, we aim to
realize productivity improvements in manufacturing as we convert further production to 90nm technology and
begin the transition to next generation 80nm and 75nm technologies.
We are continuously taking steps to reduce our cost-per-bit in manufacturing, such as the introduction of
advanced process technologies featuring smaller die-sizes, the ramp-up of more productive 300-mm capacities
and other cost savings and productivity improvement measures.
We expect to make capital expenditures in the 2007 financial year ranging between 4750 million and
4850 million. In the years thereafter our aim is to have capital expenditures of approximately 15% to 25% of
revenues on average over the DRAM cycle.
Depreciation and amortization during the 2007 financial year is estimated to range between 4650 million
and 4750 million, and for the years thereafter to be in line with capital expenditures.
Research and development expenses are anticipated to be between 4430 million and 4460 million for the
2007 financial year, and approximate 10% of sales on average for the years thereafter.
Selling, general and administrative expenses are expected to range between 4210 million and 4230 million
for the 2007 financial year, and approximate 5% of sales on average for the years thereafter.
We anticipate that our number of employees will increase moderately in certain areas in the coming year
due to the expansion of our business and the diversification of our product portfolio.
Historically we have received financing from our parent company, Infineon Technologies. Depending on
market conditions and our financial performance in the coming year, we may redeem a portion or all of this
debt prior to its maturity in 2008 through repayment and/or external refinancing.
Recent Accounting Pronouncements
In November 2004, the Financial Accounting Standards Board (FASB) issued Statement of Financial
Auditing Standards (SFAS) No. 151, ""Inventory Costs Ì an amendment of ARB No. 43, Chapter 4'', which
clarifies the accounting for abnormal amounts of idle facility expense, freight, handling costs, and wasted
material (spoilage), requiring that such costs be recognized as current period charges and requiring the
allocation of fixed production overheads to inventory based on the normal capacity of the production facilities.
We adopted SFAS No. 151 with effect from October 1, 2005. This did not have a significant impact on its
consolidated financial position or results of operations.
In December 2004, the FASB issued SFAS No. 153, ""Exchanges of Nonmonetary Assets Ì anAmendment of APB Opinion No. 29'', which eliminates the exception for nonmonetary exchanges of similar
productive assets and replaces it with a general exception for exchanges of nonmonetary assets that do not
have commercial substance. We adopted SFAS No. 153 for nonmonetary asset exchanges occurring on or
after July 1, 2005. The adoption of SFAS No. 153 did not have a significant impact on our combined and
consolidated financial position or results of operations.
In March 2005, the FASB issued Interpretation No. 47, ""Accounting for Conditional Asset RetirementObligations'', which clarifies that an entity is required to recognize a liability for the fair value of a conditional
asset retirement obligation if the fair value can be reasonably estimated even though uncertainty exists about
the timing and (or) method of settlement. We adopted Interpretation No. 47 during the 2006 financial year as
required. This did not have a significant impact on its consolidated financial positions or results of operations.
66
Global Reports LLC

In May 2005, the FASB issued SFAS No. 154, ""Accounting Changes and Error Corrections''.SFAS No. 154 replaces APB Opinion No. 20, ""Accounting Changes'', and SFAS No. 3, ""ReportingAccounting Changes in Interim Financial Statements'', and changes the requirements for the accounting and
reporting of a change in accounting principle. We are required to adopt SFAS No. 154 for accounting changes
and error corrections that occur after September 30, 2006. Our results of operations and financial condition
will only be impacted following the adoption of SFAS No. 154 if we implement changes in accounting
principle that are addressed by the standard or correct accounting errors in future periods.
In July 2006, the FASB issued FASB Interpretation 48, ""Accounting for Income Tax Uncertainties''which defines the threshold for recognizing the benefits of tax return positions in the financial statements as
""more-likely-than-not'' to be sustained by the taxing authority. The recently issued literature also provides
guidance on the derecognition, measurement and classification of income tax uncertainties, along with any
related interest and penalties. Interpretation No. 48 also includes guidance concerning accounting for income
tax uncertainties in interim periods and increases the level of disclosures associated with any recorded income
tax uncertainties. Interpretation No. 48 is effective for fiscal years beginning after December 15, 2006. The
differences between the amounts recognized in the statements of financial position prior to the adoption of
Interpretation No. 48 and the amounts reported after adoption will be accounted for as a cumulative-effect
adjustment recorded to the beginning balance of retained earnings. We are in the process of determining the
impact, if any, that the adoption of Interpretation No. 48 will have on its consolidated financial position and
results of operations.
In September 2006, the FASB released SFAS No. 157, ""Fair Value Measurements'', which provides
guidance for using fair value to measure assets and liabilities. SFAS No. 157 defines fair value, establishes a
framework for measuring fair value in generally accepted accounting principles, and expands disclosures about
fair value measurements. The standard also responds to investors' requests for more information about the
extent to which companies measure assets and liabilities at fair value, the information used to measure fair
value, and the effect that fair value measurements have on earnings. SFAS No. 157 will apply whenever
another standard requires (or permits) assets or liabilities to be measured at fair value. The standard does not
expand the use of fair value to any new circumstances. SFAS No. 157 is effective for financial statements
issued for financial years beginning after November 15, 2007, and interim periods within those financial years.
SFAS No. 157 is effective for us for financial years beginning after October 1, 2008, and interim periods
within those financial years. We are in the process of evaluating the impact that the adoption of
SFAS No. 157 will have on our consolidated financial position and results of operations.
In September 2006, the FASB issued SFAS No. 158, ""Employers' Accounting for Defined BenefitPension and Other Postretirement Plans Ì an amendment of FASB Statements No. 87, 88, 106, and 132(R),''which requires an employer to recognize the overfunded or underfunded status of a defined benefit
postretirement plan (other than a multiemployer plan) as an asset or liability in its statement of financial
position and to recognize changes in that funded status in the year in which the changes occur through
comprehensive income of a business entity or changes in unrestricted net assets of a not-for-profit organization
(""Recognition Provision''). SFAS No. 158 also requires an employer to measure the funded status of a plan as
of the date of its year-end statement of financial position, with limited exceptions (""Measurement Date
Provision''). We currently measure the funded status of our plan annually on June 30. The Recognition
Provision of SFAS No. 158 is effective for us as of the end of the fiscal year ending September 30, 2007, and
the Measurement Date Provision is effective for us as of the end of the fiscal year ending September 30, 2009.
We do not expect the change in the annual measurement date to September 30 to have a significant impact on
our results of operations or financial position. As of September 30, 2006 the application of the Recognition
Provision of SFAS No. 158 would have resulted in an increase in other long-term liabilities of 47 million, an
increase in non-current deferred tax assets of 43 million and an increase in accumulated other comprehensive
loss of 44 million.
67
Global Reports LLC

In September 2006, the SEC issued Staff Accounting Bulletin No. 108, ""Considering the Effects of PriorYear Misstatements when Quantifying Misstatements in Current Year Financial Statements''. SAB No. 108
provides interpretive guidance on how the effects of prior-year uncorrected misstatements should be
considered when quantifying misstatements in the current year financial statements. SAB No. 108 requires
registrants to quantify misstatements using both an income statement (""rollover'') and balance sheet (""iron
curtain'') approach and evaluate whether either approach results in a misstatement that, when all relevant
quantitative and qualitative factors are considered, is material. If prior year errors that had been previously
considered immaterial now are considered material based on either approach, no restatement is required so
long as management properly applied its previous approach and all relevant facts and circumstances were
considered. If prior years are not restated, the cumulative effect adjustment is recorded in opening
accumulated earnings (deficit) as of the beginning of the year of adoption. SAB No. 108 is effective for fiscal
years ending on or after November 15, 2006, with earlier adoption encouraged. We do not expect that the
adoption of SAB No. 108 will have a significant impact on our combined and consolidated financial position
and results of operations.
68
Global Reports LLC

THE SEMICONDUCTOR MEMORY INDUSTRY
Semiconductor devices, generally referred to as integrated circuits, or ICs, enable a wide variety of
everyday electronic products and systems to capture, process, store and transmit data. In addition to their
familiar use in computers, semiconductors also increasingly enable or control functions in mobile telephones,
digital still cameras, digital audio players, DVD recorders, digital TVs, electronic gaming consoles and other
telecom, consumer, automotive and industrial electronic devices.
Semiconductor devices generally fall within three broad categories: processors, which process instruc-
tions; logic devices, which capture, manipulate and transmit data or monitor or control functions within
electronic devices; and memory devices, which store data in digital form. Electronic devices generally require a
combination of processing, logic and memory functions. Although these may be combined on a single chip,
the three are more typically produced on separate chips and then integrated in a module or chipset or in an end
product through hardware and software interfaces.
There are three major types of semiconductor memory:
‚ Dynamic Random Access Memory, or DRAM, products, which are the most common volatile
memories. A ""volatile'' memory IC retains information only while electrical power is switched on,
while a ""non-volatile'' memory IC retains its data content after the power supply is switched off.
DRAM products offer large densities at low cost with relatively fast access times and virtually
unlimited endurance for the life of the product. They are ""dynamic'' because they must be
electronically refreshed frequently in order to retain the stored data;
‚ ""Flash'' memory products, which are non-volatile memories offering large densities at low cost with
slower access times and limited endurance; and
‚ Static Random Access Memory, or SRAM, products, which are volatile memories offering low
densities at relatively higher cost with very fast access times and virtually unlimited endurance for the
life of the product.
DRAM manufacturers can sell either individual DRAM chips, known as dies, or components, which are
packaged dies, or DRAM modules, which are printed circuit boards generally containing between four and
thirty-six components.
According to Gartner, DRAM sales in calendar year 2005 were $25 billion, representing 50% of the
$50 billion semiconductor memory industry, which in turn represented 21% of the $235 billion semiconductor
industry. Sales of flash memory reached $19 billion or 38% of the semiconductor memory industry in calendar
year 2005.
Semiconductor Memory Product Features
The increasing complexity of the electronic devices in which memory ICs are used, including the ever
more sophisticated software needed to operate them, has required growing amounts of memory to permit
efficient and high-speed operation. At the same time, many of these electronic devices are themselves
becoming smaller or more portable, with limited room to accommodate, and limited power to operate, the
additional semiconductors they contain. These factors have driven continuous efforts to improve semiconduc-
tor design and process technologies over the years to enable manufacturers to produce ever smaller, more
complex and more powerful memory products at a lower cost-per-megabit.
The principal technical features that DRAM suppliers have focused on to meet these requirements are:
Memory density
Density of a DRAM chip is the amount of data it can store and is usually measured in megabits (Mb) or
gigabits (Gb). Density of a DRAM module is measured in megabytes (MB) and gigabytes (GB), where each
byte contains eight bits. DRAM chips are currently offered in a variety of densities for different end uses,
generally ranging from 4Mb to 1Gb per chip, or 128MB to 8GB per module for high-end modules. In recent
69
Global Reports LLC
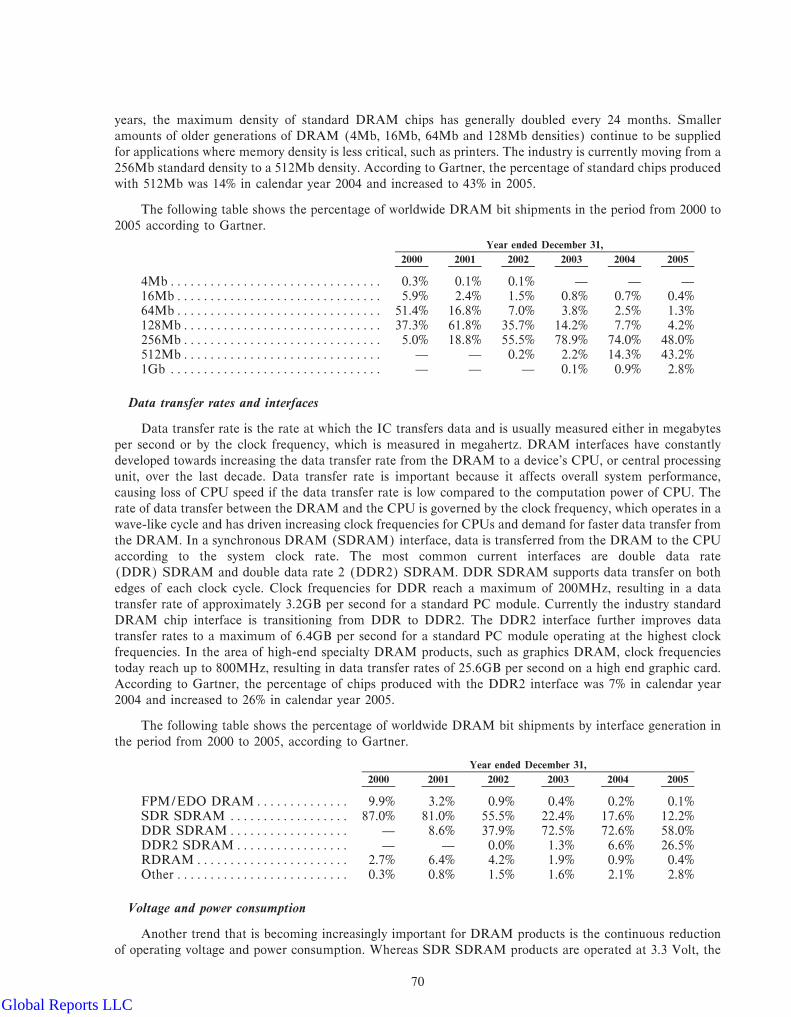
years, the maximum density of standard DRAM chips has generally doubled every 24 months. Smaller
amounts of older generations of DRAM (4Mb, 16Mb, 64Mb and 128Mb densities) continue to be supplied
for applications where memory density is less critical, such as printers. The industry is currently moving from a
256Mb standard density to a 512Mb density. According to Gartner, the percentage of standard chips produced
with 512Mb was 14% in calendar year 2004 and increased to 43% in 2005.
The following table shows the percentage of worldwide DRAM bit shipments in the period from 2000 to
2005 according to Gartner.
Year ended December 31,
2000 2001 2002 2003 2004 2005
4MbÏÏÏÏÏÏÏÏÏÏÏÏÏÏÏÏÏÏÏÏÏÏÏÏÏÏÏÏÏÏÏÏ 0.3% 0.1% 0.1% Ì Ì Ì16MbÏÏÏÏÏÏÏÏÏÏÏÏÏÏÏÏÏÏÏÏÏÏÏÏÏÏÏÏÏÏÏ 5.9% 2.4% 1.5% 0.8% 0.7% 0.4%64MbÏÏÏÏÏÏÏÏÏÏÏÏÏÏÏÏÏÏÏÏÏÏÏÏÏÏÏÏÏÏÏ 51.4% 16.8% 7.0% 3.8% 2.5% 1.3%128MbÏÏÏÏÏÏÏÏÏÏÏÏÏÏÏÏÏÏÏÏÏÏÏÏÏÏÏÏÏÏ 37.3% 61.8% 35.7% 14.2% 7.7% 4.2%256MbÏÏÏÏÏÏÏÏÏÏÏÏÏÏÏÏÏÏÏÏÏÏÏÏÏÏÏÏÏÏ 5.0% 18.8% 55.5% 78.9% 74.0% 48.0%512MbÏÏÏÏÏÏÏÏÏÏÏÏÏÏÏÏÏÏÏÏÏÏÏÏÏÏÏÏÏÏ Ì Ì 0.2% 2.2% 14.3% 43.2%1Gb ÏÏÏÏÏÏÏÏÏÏÏÏÏÏÏÏÏÏÏÏÏÏÏÏÏÏÏÏÏÏÏÏ Ì Ì Ì 0.1% 0.9% 2.8%
Data transfer rates and interfaces
Data transfer rate is the rate at which the IC transfers data and is usually measured either in megabytes
per second or by the clock frequency, which is measured in megahertz. DRAM interfaces have constantly
developed towards increasing the data transfer rate from the DRAM to a device's CPU, or central processing
unit, over the last decade. Data transfer rate is important because it affects overall system performance,
causing loss of CPU speed if the data transfer rate is low compared to the computation power of CPU. The
rate of data transfer between the DRAM and the CPU is governed by the clock frequency, which operates in a
wave-like cycle and has driven increasing clock frequencies for CPUs and demand for faster data transfer from
the DRAM. In a synchronous DRAM (SDRAM) interface, data is transferred from the DRAM to the CPU
according to the system clock rate. The most common current interfaces are double data rate
(DDR) SDRAM and double data rate 2 (DDR2) SDRAM. DDR SDRAM supports data transfer on both
edges of each clock cycle. Clock frequencies for DDR reach a maximum of 200MHz, resulting in a data
transfer rate of approximately 3.2GB per second for a standard PC module. Currently the industry standard
DRAM chip interface is transitioning from DDR to DDR2. The DDR2 interface further improves data
transfer rates to a maximum of 6.4GB per second for a standard PC module operating at the highest clock
frequencies. In the area of high-end specialty DRAM products, such as graphics DRAM, clock frequencies
today reach up to 800MHz, resulting in data transfer rates of 25.6GB per second on a high end graphic card.
According to Gartner, the percentage of chips produced with the DDR2 interface was 7% in calendar year
2004 and increased to 26% in calendar year 2005.
The following table shows the percentage of worldwide DRAM bit shipments by interface generation in
the period from 2000 to 2005, according to Gartner.
Year ended December 31,
2000 2001 2002 2003 2004 2005
FPM/EDO DRAMÏÏÏÏÏÏÏÏÏÏÏÏÏÏ 9.9% 3.2% 0.9% 0.4% 0.2% 0.1%SDR SDRAM ÏÏÏÏÏÏÏÏÏÏÏÏÏÏÏÏÏÏ 87.0% 81.0% 55.5% 22.4% 17.6% 12.2%DDR SDRAMÏÏÏÏÏÏÏÏÏÏÏÏÏÏÏÏÏÏ Ì 8.6% 37.9% 72.5% 72.6% 58.0%DDR2 SDRAMÏÏÏÏÏÏÏÏÏÏÏÏÏÏÏÏÏ Ì Ì 0.0% 1.3% 6.6% 26.5%RDRAMÏÏÏÏÏÏÏÏÏÏÏÏÏÏÏÏÏÏÏÏÏÏÏ 2.7% 6.4% 4.2% 1.9% 0.9% 0.4%Other ÏÏÏÏÏÏÏÏÏÏÏÏÏÏÏÏÏÏÏÏÏÏÏÏÏÏ 0.3% 0.8% 1.5% 1.6% 2.1% 2.8%
Voltage and power consumption
Another trend that is becoming increasingly important for DRAM products is the continuous reduction
of operating voltage and power consumption. Whereas SDR SDRAM products are operated at 3.3 Volt, the
70
Global Reports LLC
voltage has been reduced to 2.5 Volt for DDR SDRAM and to 1.8 Volt for DDR2 SDRAM products, thus
constantly reducing the power consumption by mainstream DRAMs. With the increasing number of battery
powered mobile applications such as mobile phones, smart handheld devices and digital audio players, the
demand for ultra low-power memories has increased significantly. Specifically designed DRAM products,
such as ""mobile DRAM'', include active power saving features that allow the further reduction of power
consumption and thus an increase in battery life for mobile applications. Recently, heat dissipation has
become an additional important driver for low-power demand for DRAM products. The heat produced by
high density DRAM content in server farms and the related expenditures for electricity has reached a level
that has driven server manufacturers to focus on low power DRAM products in the market. Heat dissipation is
also an important topic for non-portable consumer applications such as digital TVs that use slim cases and
must avoid noisy cooling systems such as fans for aesthetic reasons.
DRAM Technologies
DRAM Architecture
A DRAM storage cell consists of a capacitor and a transistor, and a key element in the physical layout of
DRAM chips produced today is the arrangement of capacitors and transistors on the chip. In early DRAM
chips, capacitors and transistors were arranged in a plane across the surface of the chip. As DRAM feature
sizes have become smaller, the planar space for the capacitor has become too small to hold a sufficient amount
of charges and the capacitor had to move in the third dimension. Two different technological approaches have
evolved to address this issue, one in which the capacitor is laid into holes etched into the surface of the silicon,
commonly referred to as the ""trench'' process, and another in which the capacitor is laid on top of the silicon,
commonly referred to as the ""stack'' process. In the market today, each of several manufacturers using stack
technology has developed a unique stack architecture, while all manufacturers using trench architecture use
technology first developed by Infineon, Toshiba and IBM during the 1990s. The trench technology was later
advanced by Qimonda and is currently being further developed cooperatively by Qimonda and Nanya. Both
stack and trench cell technology have to date been accepted in the market. According to Gartner, based on bit
shipments, in 2005, trench-based DRAMs accounted for approximately 27% of the worldwide DRAM market,
while the various stack technologies accounted for the remainder.
Feature Size
DRAM technology development has generally followed ""Moore's Law'', which estimates that the
number of transistors per square inch of silicon doubles every two years. Manufacturers have achieved this
progress in chip productivity by ""shrinking'' the circuitry on chips Ì that is, by reducing the minimum
distance between circuits, known as the feature size. Smaller feature sizes require increasingly sophisticated
manufacturing process technology, including advanced masks and photolithography techniques for printing
the circuitry on the chip. The distance between circuits on a standard DRAM chip is measured in nanometers
(nm) where one nm equals one-billionth of a meter. The minimum feature size has declined from 250nm in
1998 to 90nm today. The future shrinkage of feature sizes is estimated by the International Technology
Roadmap for Semiconductors, or ITRS, which provides details and naming conventions for upcoming feature
sizes called ""technology nodes''. The next technology nodes the ITRS foresees, which industry participants
generally refer to as the ""shrinkage roadmap'' after 90nm are 80nm, 70nm, 65nm, 57nm and 50nm. However,
the actual feature sizes of the technology nodes that individual industry participants implement may differ
from the node naming convention because each participant adjusts its technology to meet its manufacturing
and capital requirements. Industry participants are in the advanced stages of developing process technology for
80 and even 75/70nm feature sizes, and anticipate the development of progressive generations down to
approximately 50nm in the coming years. The transition from one generation to the next, for example from
170nm to 140nm technology, has typically occurred every 12 to 18 months. Due to increasing space
restrictions necessitated by feature sizes of 50nm and below, transistors are also expected to move into the
third dimension in future feature size generations of both trench and stack architectures. It is not yet clear if
either approach will produce greater space or cost efficiencies as chips become still smaller and memory
densities continue to increase.
71
Global Reports LLC
The Semiconductor Manufacturing Process
Semiconductor manufacturing is a very capital intensive process, with substantial fixed costs for
fabrication facilities, known as ""fabs'', and for manufacturing equipment. Moreover, given the rapid
technology transitions in the industry, manufacturers must depreciate this equipment over short time periods,
increasing the ratio of fixed costs to variable costs per chip produced. The manufacturing process, which is
substantially the same for both DRAM and flash memory products, is generally divided into two steps,
referred to as the front-end process and the back-end process.
The front-end process
In the front-end process, electronic circuits are produced on a silicon wafer. This process involves several
hundred process steps and takes place over a period of approximately two months in a clean room environment
in which humidity, temperature and particle contamination are precisely controlled. Because of the very small
geometries involved in wafer processing, highly complex and specialized equipment, materials and techniques
are used. In the first phase of processing, transistor arrays are created through cycles of the following steps:
‚ oxidation/deposition, which involves depositing oxide material on the surface of the wafer;
‚ photolithography, which utilizes a light-sensitive material called photoresist, a pre-formatted ""mask''
and a light source, to imprint the desired circuitry on the deposited oxide material;
‚ etching, which involves removing the oxide material that is not still covered by photoresist, and
‚ ion implantation, during which ionic materials known as dopants are shot into the wafer to create
charged regions within the silicon wafer to enable transistor functionality.
After transistors are created, they are connected together to form the logic gates using an interconnect
material, usually aluminum or copper. The metal layers are built with stages of deposition, lithography, and
etching, similar to the pre-metal stage but using separate equipment and masks. Dieletric material is deposited
between the layers to insulate them. A final passivation layer is added above the top metal layer to protect the
circuitry. At the end of the front-end process the chips are tested on the wafer for functionality.
Wafer processing is conducted in specialized fabrication facilities, or fabs. A fab's capacity is generally
stated in terms of the number of wafers on which processing can begin in a given period, or ""wafer starts per''
week or month. The standard diameter of silicon wafers used to produce semiconductors increased from 50
mm in 1970, to 100 mm by 1980, 150 mm by 1990 and 200 mm by 1995. Most current production continues to
be on 200 mm wafers, but the industry transition to 300 mm wafers is under way. To transition a fabrication
facility to larger wafer sizes requires the acquisition of adequate equipment and a lengthy testing and ramp-up
period to achieve satisfactory manufacturing yields. The transition to still larger 450 mm wafers, if and when it
occurs, will likely require a similarly long transition and substantial investments.
While larger silicon wafers cost more than smaller ones and the equipment used to manufacture chips on
larger wafers costs more than equipment used for smaller wafers, these additional costs are more than offset by
the productivity gains provided by the larger wafer. These productivity gains are primarily driven by the
increase in the number of chips produced from each wafer. For example, the surface area of 300 mm wafers is
approximately 2.25 times greater than that of 200 mm wafers, which yields approximately 140% more chips
per wafer. Because the cost of labor and certain other fixed costs is largely independent of the size of the
wafers used, use of larger wafers results in reduction of the costs per chip.
Increasing complexity and capital intensiveness of front-end processing has facilitated emergence of
front-end foundries, who partner with semiconductor designers or manufacturers to perform front-end
processing services.
The back-end process
In the back-end process, also called the packaging, assembly and test phase, processed wafers are diced
into individual chips, which, after having interconnecting pins added, are encapsulated into a packaged
72
Global Reports LLC

component using a compound material. Packaged components are tested extensively to ensure quality and
technical specifications are maintained. After final testing, components are often soldered onto printed circuit
boards to create modules, which themselves undergo application testing. Increasing requirements for higher
component performance and smaller size have led to development of back-end processing technologies and
innovative package types that optimize speed and reliability of device interconnects while reducing the extra
size added by a chip's packaging. Because back-end processing can take place in a different location than the
front-end processing, several back-end foundries have emerged to specialize on back-end processing and offer
outsourced services to semiconductor manufacturers who would like to specialize on front-end processing
alone or augment their in-house back-end capacity.
DRAM Applications
DRAM, the most common type of memory IC, is found in a wide variety of electronic devices, including
servers and workstations, personal and notebook computers, upgrade modules, graphic cards, game consoles,
mobile phones, printers, digital TVs, set-top boxes and other consumer electronic devices. Because these
applications require different DRAM products, we believe the DRAM's intended application determines its
pricing and competitive dynamics. We have identified the following main applications for DRAMs:
Standard DRAMs for PC and Workstation Applications
PCs, workstations and other computing applications were the first users of DRAM and have historically
represented the majority of DRAM sales. DRAM components and modules for use in desktop and notebook
PCs and workstations accounted for approximately 52% of global DRAM bit-shipments in 2005, according to
Gartner. These components and modules can be best described as ""standard DRAMs'', because they are
standardized across suppliers with respect to performance and package specifications and trade like a
commodity in a relatively liquid market. They combine high-density and high-speed data storage and retrieval
with the lowest cost per-megabit of any volatile memory product.
Typical customers of these standard DRAMs are large PC manufactures, such as Dell, HP and Lenovo,
either directly or through contract manufacturers that assemble PCs for the large manufacturers, as well as
local original equipment manufacturers, or OEMs, and module manufacturers, such as Kingston. We believe
that these customers tend to select their standard DRAM suppliers on the basis of price and ability to supply
high volumes of product reliably. Some standard DRAM customers also produce infrastructure equipment
such as servers, and networking and storage equipment, and we believe a supplier's ability to offer other
DRAM products is an additional factor that may influence these customers' selection of standard DRAM
suppliers.
The market for standard DRAMs has been characterized by intense competition, often involving price
cuts, and significant volatility of revenues and operating results of market participants. The major DRAM
manufacturers typically have contracts with each of their major OEM customers, with specific prices
negotiated twice per month. However, there are many suppliers in the standard DRAM market, including
module manufacturers and smaller DRAM manufacturers, whose DRAM sales prices are often based on spot
market average selling prices, or ASPs, which fluctuate daily.
DRAMs for Infrastructure Applications
The high performance equipment that forms the backbone of the Internet, such as servers and other
networking and storage equipment, also use DRAMs. DRAMs for these applications accounted for
approximately 24% of global DRAM bit-shipments in 2005, according to Gartner. Due to the large data
volume that is handled by these applications, these customers usually demand DRAM products with higher
memory capacities. DRAM modules for infrastructure applications differ from the modules used in PCs by
providing extra high densities and error correction features to provide highest reliability. We believe that,
because these high-performance products often perform critical tasks, their producers select DRAM suppliers
whose DRAMs display advanced features and reliability and whose manufacturing processes have proven to
be of high quality. In addition there is also demand for customized products by some customers, who typically
73
Global Reports LLC

provide their product specifications to DRAM suppliers, who in turn design and produce the requested
product. The customer will ""validate'' the DRAM supplied, testing it rigorously over a process that may last
several months. DRAM products for infrastructure applications such as Registered DIMMs generally
command a higher per-unit price than standard DRAM products. Typical customers who purchase DRAM
products for infrastructure applications are server producers such as Sun Microsystems and network and
storage equipment vendors such as Cisco Systems and EMC.
Because DRAMs used in infrastructure applications tend to be less standardized and more customer- or
application-specific, interchangeability is lower relative to standard DRAMs and consequently the level of
competition among suppliers is less intense. In addition, there are fewer suppliers of these types of DRAM
products than standard DRAMs and these suppliers typically sell infrastructure DRAM products pursuant to
contract. The smaller number of suppliers and high percentage of these products sold pursuant to contract
tends to result in the prices for these DRAM products being less volatile than those for standard DRAM
products.
DRAMs for Other Applications including Graphics, Mobile and Consumer Applications
With the growth of the mobile communication industry and the digitalization of consumer products
during the last decade, the range of applications using DRAM products has significantly broadened. Graphics
applications such as game consoles and graphics cards are requiring and driving demand for high-performance
graphics DRAMs that support the increasingly advanced graphics in computer games. The increasing number
of communication and consumer mobile devices, including mobile phones and digital still cameras and audio
players, has driven growth in demand for low-power DRAM products that allow for longer battery lifetimes.
As a result, a variety of specialty DRAM components have been developed to address the specific needs of
these applications. In addition there is a growing number of other consumer applications such as digital TVs,
DVD players and recorders and set-top boxes that require a whole range of standard or even customized
DRAM products. Products for graphics, mobile and consumer applications accounted for about 13% of
DRAM bit shipments in 2005, according to Gartner.
Successful DRAM suppliers maintain close relationships with mobile phone, game console and consumer
electronic device producers, to understand the customer's requirements early in their product development
stage. Many of these customers expect their DRAM suppliers to be able to proactively provide advanced
products so that customers can integrate them into their product design. As a result, compared to standard
DRAMs with the same density, these DRAMs tend to be relatively higher in price. Typical customers of these
types of DRAMs include mobile handset manufacturers such as Motorola, Nokia and Sony Ericsson, graphic
card manufacturers such as ATI and nVidia, game console manufacturers such as Microsoft, Sony and
Nintendo and major consumer electronics manufacturers.
Unlike standard DRAMs, DRAM products for graphics, mobile and consumer applications tend to be
customer- and application-specific, and, therefore, prices for these DRAM products tend to be more stable,
with prices fixed by comparatively long-term contracts.
Drivers of DRAM Demand and Recent Trends
According to Gartner, between calendar years 1998 and 2005, bit shipments grew at a CAGR of 56% over
the period. Historically, growth of DRAM bit shipments was driven by DRAM's primary application,
computing, and depended on growth in units shipped and DRAM content per unit. Rapid adoption of PCs by
business and home users, combined with operating system upgrades that demanded more DRAM per unit,
drove strong growth in bit demand. However, as more DRAM components began to be used in a broader
range of applications, DRAMs for infrastructure and graphics, mobile and consumer applications began to
represent a larger share of total DRAM bit shipments. In calendar year 2005, PCs, workstations and memory
modules and upgrades represented only 53% of total DRAM consumption compared to 64% in 2001.
Current estimates by Gartner predict continued strong growth in DRAM bit shipments at a CAGR of
52% between calendar years 2005 and 2010. DRAM revenues are expected to grow at a CAGR of 5% over the
74
Global Reports LLC

same period and reach $32 billion in 2010, although DRAM prices are expected to continue to fall. Key
drivers of the growth in bit demand include the following:
‚ Emergence of mobile phones as a significant consumer of DRAM. While mobile phones consumed
nearly no DRAM five years ago, in calendar year 2005 this application represented 2% of DRAM
consumption and is expected to reach 5% in calendar year 2010, according to Gartner. The 12% CAGR
of units shipped between calendar years 2005 and 2010, combined with 63% CAGR in megabytes per
unit, is expected to lead to 82% CAGR of total DRAM consumption by mobile phones. Rapid growth
in DRAM content in phones is driven by emergence of multimedia phones and adoption of
sophisticated digital audio and video functions into handsets. Market research firm International Data
Corporation (IDC) estimates that smart handheld devices, including keypad- and pen-based devices,
will each contain as much as 500 megabytes of DRAM by calendar year 2010.
‚ New or increased DRAM consumption by graphics applications and digital consumer devices.Evolution of consumer electronics has created several device categories that offer sophisticated
functionality and require substantial amount of DRAM to operate. These devices, including digital
TVs and digital audio players, are often characterized by strong unit growth and represent a significant
incremental opportunity for DRAM suppliers. In addition, technological advances in established
consumer devices have led newer models to require more advanced DRAM and consume more
DRAM per unit. Such devices include game consoles, where the latest products include 512 or 256
MB of highly specialized GDDR3 DRAM. Two of the major game console developers are expected to
introduce new consoles during 2006, while the third major game console developer is currently ramping
up production of its new console. Newer DVD technologies, including advanced optical drives that
demand more discrete DRAM chips per DVD player or recorder, are also expected to contribute to
this growth. These and other trends are expected to drive 47% CAGR of DRAM consumption in
consumer devices between calendar years 2005 and 2010, according to Gartner.
‚ Continuing strong growth in DRAMs for infrastructure. DRAM consumption in servers is expected
to grow at 47% CAGR between 2005 and 2010, according to Gartner, driven by an estimated increase
of DRAM content per unit at a CAGR of over 35% and strong unit growth of blade servers. Evolution
of processor architectures, combined with increasing complexity of systems, places significant demands
on DRAM components used in these systems, including power efficiency, speed and density. However,
demand for such DRAMs tends to be contract-based and therefore relatively steady, resulting in more
stable and favorable pricing than the overall DRAM market.
‚ Multiple drivers of growth in DRAMs for PC and workstations. PCs, workstations and memory
modules and upgrades are expected to increase DRAM consumption at 52% CAGR between 2005 and
2010, according to Gartner. One of the drivers of this growth involves increasing adoption of dual-core
and 64-bit processors, which are expected to be incorporated in almost half of total PC shipments by
the end of 2007, according to IDC. In addition, introduction of Microsoft's first mainstream 64-bit
operating system, Windows Vista, currently anticipated by Microsoft to take place in early 2007, is
expected to stimulate DRAM demand by facilitating higher DRAM per unit and by triggering PC
upgrades by consumers, followed by companies. Gartner expects mobile PCs to play an important role
in DRAM demand as their strong unit growth is expected to continue at a 19% CAGR in the period
between calendar years 2005 and 2010, driven by improved power efficiency, wireless and multimedia
functionality and other trends, including substitution of desktop PCs. Given the space and power
constraints present in mobile devices, this is expected to lead to increase in demand for advanced
DRAM components that address the above constraints. Significant DRAM market potential also
exists in desktop PC penetration in emerging markets such as China and India.
Drivers of DRAM Supply and Recent Trends
Given the standardized nature of a significant share of DRAM bit shipments, supply plays a crucial role
in determining DRAM selling prices, which, in turn, drive industry revenues and the financial performance of
suppliers. Historically, DRAM supply has grown at high rates to meet the increasing bit demand, although
75
Global Reports LLC
time lags associated with increasing supply, coupled with unexpected changes in demand have resulted in
periods of excess DRAM supply or demand. These mismatches of supply and demand have caused severe
price fluctuations that, in turn have led to revenue fluctuations, such as the 51% increase in DRAM revenues
from calendar years 1998 to 1999, the 63% decline from calendar years 2000 to 2001 and the 50% increase
from calendar years 2003 to 2004, according to Gartner. Further, DRAM supply is relatively inelastic. In
periods of declining selling prices, suppliers nonetheless continue production at full capacity as long as prices
exceed their variable costs of production, while in periods of increasing selling prices, suppliers usually need a
long time, up to two years, to bring new capacities on-stream.
Supply of DRAM components involves constructing and equipping complex and expensive fabrication,
assembly and test facilities as well as developing and continuously improving semiconductor manufacturing
technologies. Growth of DRAM supply is driven by several factors, including:
‚ Capacity additions. DRAM suppliers periodically build new manufacturing facilities or upgrade
existing facilities to increase their overall capacity. Historically, periods of supply shortages led many
market participants to decide to add more capacity or accelerate existing capacity addition plans. Given
the long time required to bring new capacity on-stream, these capacity additions may result in excess
supply if a significant amount of capacity comes on-stream simultaneously, in particular when demand
had subsided. Recently, several market participants have experienced strong revenue growth and have
announced (or completed) increased investment in new manufacturing capacities. However, some of
these capacities have been or will be used to produce non-DRAM products as well, as discussed below.
‚ Wafer size, process technology and other manufacturing improvements. Successive generations of
semiconductor manufacturing technology enable higher output and productivity, resulting in growth of
supply without investments in incremental capacity. For example, the transition from 200mm to
300mm wafer-based manufacturing yields higher output given the larger size of wafers being
processed. The production capacity on 300mm wafers has increased almost four fold since the
beginning of calendar year 2004. According to iSuppli, the worldwide percentage of DRAM bits output
on 300mm wafers was 19% in the first quarter of calendar year 2004. By the end of the fourth quarter of
calendar year 2005, the percentage of bit output produced on 300mm wafers was 49%, according to
iSuppli. In addition, transition to smaller process technology, for example from 110nm to 90nm and
then to 75nm nodes, reduces the die size and increases the density per unit of die surface. As a result,
more chips are produced from the same wafer and higher bit shipments are achieved without adding
incremental capacity. When these major transitions occur in DRAM manufacturing, lithography
methods or materials used, initial manufacturing yields tend to be low, resulting in output below full
potential. Over time, as DRAM suppliers solve the manufacturing problems and increase their yield, a
higher proportion of usable components are produced per wafer and bit supply increases.
We have observed the following trends in DRAM supply in recent periods:
‚ Consolidation among DRAM suppliers. Market dynamics have driven significant consolidation in the
DRAM industry, as a number of major manufacturers have withdrawn from the industry. NEC and
Hitachi combined their DRAM operations into Elpida Corporation in December 1999, later consoli-
dating some of Mitsubishi's DRAM development activities. Texas Instruments sold its DRAM
operations to Micron Corporation in calendar year 1998 and Toshiba sold its U.S. DRAM fab to
Micron in calendar year 2002. In January 2006, Micron combined its flash activities with Intel.
Hyundai merged its DRAM operations with those of LG in calendar year 1999 (later renaming its
DRAM operations as Hynix). According to Gartner, market share (measured by revenues in U.S.
dollars) commanded by the four largest vendors has increased during the last decade from 46% in
calendar year 1995 to 77% in calendar year 2005. We believe the market to be moderately concentrated
as, according to Gartner, only eight DRAM suppliers had revenue market share of over 1% in 2005.
‚ Increasing cost of technology development and manufacturing facilities. The level of complexity
increases with each successive generation of semiconductor manufacturing technology, as the leading
edge processes are nearing limits caused by the physical properties of materials employed in the
process. To solve such problems and to successfully introduce technologically advanced manufacturing
76
Global Reports LLC
capacity, DRAM suppliers need to consistently make significant investments in research and
development and in expensive manufacturing equipment.
‚ Increasing use of foundries, joint ventures and licensing agreements. In recent years, the high costs of
constructing fabs has led to the expansion of the use of semiconductor foundries, which are contract
manufacturers that produce chips to the specifications of others. Historically, foundries have produced
chips for what are known as ""fabless semiconductor companies'', which are firms that design chips but
that do not have their own manufacturing facilities. Increasingly, however, even large semiconductor
companies that do have their own facilities are supplementing their capacity by making use of
foundries. Using foundries involves less capital investment and may provide greater flexibility to
increase or decrease output in a volatile market.
Among companies seeking to share the risks and costs of manufacturing investments, these factors have
likewise increased the attractiveness of joint venture and partnership arrangements, as well as of licensing and
cross-licensing arrangements. For companies with substantial intellectual property portfolios, including
manufacturing know-how, licensing arrangements present an opportunity to supplement income from
manufacturing semiconductors. Because technological know-how is very concentrated in the semiconductor
memory products industry, many manufacturers would be unable to produce memory chips were it not for
their access to the relevant technology through licensing. For example, we estimate that four of the nine
largest DRAM suppliers today license most of their technology from the other top-nine suppliers.
‚ Expansion of DRAM suppliers into flash memory products. Driven by the historical and projected
strong growth in the NAND flash market, and taking advantage of similarities between DRAM and
NAND flash manufacturing, some DRAM suppliers have entered or expanded their presence in
particular in the NAND flash market by adding new NAND flash manufacturing capacity or
converting existing DRAM capacity to the manufacture of NAND flash memory. DRAM manufac-
turing capacity can generally be transferred to NAND flash and back without major cost or investment
and in relatively short time. We believe that this gives suppliers flexibility to allocate capacity away
from a product in periods of excess supply of that product. As suppliers convert capacity from DRAM
to NAND flash, the impact may be beneficial to DRAM producers because the resulting reduced rate
of growth in the supply of DRAM could operate to moderate price declines for DRAM products that
would likely have occurred had the new capacity been dedicated to DRAM production.
We believe that the above trends are having an effect on the fundamentals of the DRAM industry and
may be facilitating a reduction in the severity of supply and demand imbalances, and of price fluctuations, in
the future.
77
Global Reports LLC
OUR BUSINESS
Overview
We are one of the world's leading suppliers of semiconductor memory products. We design semiconduc-
tor memory technologies and develop, manufacture, market and sell a large variety of semiconductor memory
products on a chip, component and module level. We began operations within the Semiconductor Group of
Siemens AG, whose roots in semiconductor R&D and manufacturing date back to 1952, and operated as the
Memory Products segment of Infineon Technologies AG since its carve-out from Siemens AG in 1999. In
each of the past five calendar years, we captured between 9% and 15% of the worldwide DRAM market based
on revenues, according to industry research firm Gartner. Although our market share fluctuates, and we may
lose market share quarter-to-quarter or year-to-year as we did in the fourth quarter of the 2005 calendar year
and in 2005 overall, in each of those five years, we remained among the four largest DRAM suppliers
worldwide based on revenues. For the first time in the quarter ended March 31, 2006, we were the world's
second largest supplier of DRAM by revenue and bit shipment, with a market share of approximately 17%. In
the quarter ended June 30, 2006, we maintained our position as the world's second largest supplier of DRAM
by revenue, with a market share of approximately 16%, and were the third largest supplier based on bit
shipment according to Gartner.
Our revenues are derived from:
‚ Standard DRAM products used in personal computers, or PCs, and workstations. Sales of these
standard DRAM products accounted for approximately 51% of our net sales in our 2005 financial year
and for approximately 47% of our net sales in our 2006 financial year;
‚ Technologically more advanced DRAM products used in infrastructure, graphics, mobile and con-
sumer applications. Our infrastructure DRAMs address the high reliability requirements of servers,
networking and storage equipment. Our graphics, mobile and consumer DRAMs principally include
""specialty DRAMs'' that are designed for high performance or incorporate logic circuitry to enable low
power consumption. Our graphics DRAMs deliver advanced performance to graphics cards and game
consoles, and our mobile and consumer DRAMs provide low power consumption benefits to mobile
phones, digital audio players, televisions, set-top boxes, DVD recorders and other consumer electronic
devices. Sales of infrastructure, graphics, mobile and consumer DRAM products accounted for
approximately 38% of our net sales in our 2005 financial year and for approximately 50% of our net
sales in our 2006 financial year; and
‚ Other products, including embedded DRAM and NAND-compatible flash memory products, and
technology licensing. Our flash memory products are primarily used in digital still cameras, mobile
phones, USB drives and digital audio players. Sales of embedded DRAM and flash memory products
and revenues from technology licensing and royalties accounted for approximately 11% of our net sales
in our 2005 financial year and for approximately 3% of our net sales in our 2006 financial year.
The memory products business of Infineon, substantially all of which Infineon has contributed to us, has
a long-standing reputation as a supplier of high-quality DRAMs. We intend to continue to build on this
reputation to broaden our product portfolio and, in turn, our customer base, by focusing on DRAM products
for infrastructure and for graphics, mobile and consumer applications. In our experience, demand for DRAM
products used in these applications is generally more stable than the demand for standard DRAM products
due to their customized nature and advanced features, making them subject to relatively less price volatility.
We believe that increasing the share of our revenues from these products will improve our average selling price
and make our operating results more stable.
Our customers include the world's largest suppliers of computers and electronic devices. Our current
principal customers include major computing original equipment manufacturers, or OEMs, including HP,
Dell, IBM, Sun Microsystems and Sony. To expand our customer coverage and breadth, we also sell a wide
range of products to memory module manufacturers that have diversified customer bases such as Kingston,
and to a number of distributors. More recently and in connection with the ongoing expansion of our product
78
Global Reports LLC

portfolio, especially into graphics applications, we have added customers with a strong focus on enabling these
applications, such as nVidia, ATI and customers who are active in the game console market, such as
Microsoft. By having a close relationship with these customers we believe we can benefit in the development
of future memory generations.
We supply our customers through our own front-end facilities in Germany and the United States, and
through our back-end facilities in Germany, Portugal and Malaysia. We supplement our manufacturing
capacity through two joint ventures, Inotera Memories, Inc. and Qimonda Technologies (Suzhou) Co., Ltd.,
China, and through supply agreements with the DRAM foundries SMIC and Winbond. In addition, we
supplement our back-end manufacturing through agreements with several subcontractors. We operate these
facilities as a coherent unit via our ""fab cluster'' concept, which enables us to share manufacturing best
practice and gain operational flexibility through customer qualification of our entire cluster of fabs.
Our Strengths
We believe that we are well positioned to benefit from the projected growth in the semiconductor
memory industry and to remain at its technological forefront. We consider our key strengths to include the
following:
‚ We are a leading supplier of DRAM products. We have grown our operations significantly over the
last decade and, as the suppliers in our industry have continued to consolidate, we have increased our
market share from 3% to 13% (based on revenues) between calendar years 1995 and 2005, according to
Gartner. Although our market share fluctuates from quarter-to-quarter and year-to-year, by the end of
calendar year 2005, we were among the four largest DRAM suppliers, which together accounted for
77% of the global DRAM market in calendar year 2005. According to Gartner, we were the second
largest supplier of DRAM products by revenues, and we were third largest supplier by bits shipped, in
the first half of the 2006 calendar year. We believe that our size and scale will enable us to continue to
improve our position as a prominent developer of leading semiconductor memory technologies, as a
manufacturer with facilities among the most modern in our industry and as a supplier of an increasingly
broad portfolio of competitive products to customers worldwide.
‚ We are among the leaders in the transition to manufacturing on 300mm wafers. We were among the
first DRAM suppliers to transition a substantial portion of our manufacturing to 300mm technology
and began volume production on this basis in 2001. Today, we own and operate two 300mm facilities
and have access through our Inotera Memories, Inc. joint venture to the largest 300mm facility in the
world according to Gartner. In the second quarter of the calendar year 2006, about 74% of the DRAM
bits we produced were manufactured using 300mm wafers. This compares favorably to the industry
average of 59%, as reported by iSuppli for the same quarter. We believe this places us ahead of our
major competitors, many of which still manufacture mostly on 200mm technology. We believe the
primary benefit of this early transition to 300mm will be a reduction in our costs per bit, as our fixed
costs of production are spread over a higher number of chips per wafer. Because implementation of
300mm technology is complex, requires time and substantial capital investments, we expect our
300mm leadership to give us an advantage relative to competitors who have not yet transitioned the
majority of their capacity to 300mm.
‚ Our proprietary ""trench'' architecture possesses advantageous physical characteristics we can exploitnow. Our proprietary trench architecture is one of the two principal approaches to arranging storage
capacitors on a chip. While the various alternative ""stack'' architectures involve stacking capacitors on
the surface of a silicon die, our proprietary trench architecture places capacitors in trenches carved into
the surface of the die. We believe that our proprietary ""trench'' architecture possesses physical
characteristics that we can exploit during the current and next several technology nodes to yield
advantages over the various alternative ""stack'' architectures. In particular, the larger capacitors
featured by the trench architecture can be used to design DRAM products with high performance or
low power consumption characteristics. We believe these characteristics are increasingly important in
79
Global Reports LLC

specialty DRAM applications such as graphics, mobile and consumer devices, and that they will
continue to drive our strong growth in these end markets in the near term.
‚ We are a leading developer of semiconductor process technologies and an active innovator. We have
successfully developed and implemented several generations of process technologies. We are currently
converting our volume production to 90nm process technology and have started commercial production
based on the next generation 75nm process technology at our lead facility in Dresden. We are also
developing subsequent generations of process technology, or ""nodes'', including 58nm. We are working
on designs beyond the next several technology nodes with a range of technologies and architectures
under construction. We expect that our accumulated experience, including that which we have
acquired through our strategic alliances, should enable us to accelerate our feature size shrinkage from
the 90nm node to the 75nm node. We achieved the qualification of our 75nm node in approximately
30% less time than we did when shrinking from the 110nm to the 90nm node. If we are successfully
able to ramp up our manufacturing yield on this node, we will be able to produce more bits per wafer
and therefore reduce our costs per bit, as our fixed costs are applied to a larger volume of bits produced.
Reduced feature sizes also enable us to develop and produce innovative products such as DDR3
DRAM products for our customers.
‚ Our business model leverages strong strategic alliances. We have entered into strategic alliances that
leverage our research and development capabilities and augment our front- and back-end manufactur-
ing capacity in a capital-efficient manner. We believe that we use strategic alliances to a greater extent
than our competitors and that the continued success of our ""fab cluster'' concept is a key element of
our business model. We believe our strategic alliances, including our Inotera and Qimonda Suzhou
joint ventures, as well as our foundry partnerships with SMIC and Winbond, enable us to benefit from
significant economies of scale at a reduced level of capital expenditures. We also believe that these
arrangements increase our operating flexibility by reducing our fixed costs, which, in turn, can help us
reduce volatility in our operating margins throughout our industry's business cycle.
Our Strategy
In formulating our strategy, we aim to leverage our key strengths to address our target markets and
emerging opportunities that we have identified. The key elements of our strategy include the following:
‚ Improve our average selling price by increasing our focus on DRAM products for advanced infrastruc-ture, graphics, mobile and consumer applications. We believe significant growth opportunities exist
for DRAMs used in servers, graphics cards, game consoles, mobile phones, digital audio players,
televisions, set-top boxes, DVD recorders and other consumer electronic devices. We plan to continue
to leverage our proprietary trench technology over the next several technology nodes to increase our
sales of products used in these applications. We have substantially enhanced our product development
capabilities related to these products and have hired a significant number of product development
engineers, many of whom work directly with customers on application- and customer-specific product
designs. This has enabled us to substantially expand our product offerings and market share in these
areas. We plan to continue to introduce advanced infrastructure, graphics, mobile and consumer
DRAMs with what we believe are compelling characteristics in an effort to expand our share of
revenues from these products. Because in our experience these products generally command higher and
more stable prices, we believe that these efforts will result in a higher blended average selling price for
our DRAMs and reduced volatility of our operating results.
‚ Leverage our technology leadership and increase our presence in low cost regions to continue to reduceunit costs. We believe that our leadership in the transition to 300mm manufacturing technology will
enable us to realize the potential benefits of reduced unit costs offered by this transition earlier than our
major competitors. We intend to remain ahead of our major competitors in this process and plan to
substantially complete our transition to manufacturing on 300mm wafers within the next few years. We
are also seeking to complete the introduction of our 75nm technology node on the accelerated
timetable we have met so far and to successfully ramp up manufacturing yield on this node, which
80
Global Reports LLC

would enable us to derive unit cost improvements. We further intend to successfully develop and
implement future process technology nodes by leveraging our accumulated expertise, R&D capabilities
and strategic alliances. In addition, we are actively increasing the proportion of our manufacturing
located in low cost Asian regions. We expect our focus on Asia to remain a key part of our strategy as
we seek further opportunities to reduce our fixed and variable production costs.
‚ Improve profitability and return on capital throughout our industry's business cycle. We believe that
we will achieve significantly improved profitability throughout our industry's business cycle through the
average selling price improvement and unit cost reduction strategies outlined above. We also believe
that we will reduce the volatility of our operating results by increasing the flexibility of our operations
through our foundry partnerships and by continuing to expand the share of our revenues that are from
advanced infrastructure, graphics, mobile and consumer DRAM products. While we intend to
maintain at least half of our front-end production in-house, we plan to continue to focus on our
strategic alliances and our fab cluster-based business model to optimize capital efficiency of our
operations. We believe this capital efficiency, combined with our targeted profitability, will enable us to
significantly improve our return on capital employed.
Our History
We began operations as a part of Siemens's Semiconductor Group, whose roots in semiconductor R&D
and manufacturing date back to 1952, four years after the invention of the transistor. In 1999, Siemens
contributed substantially all of its Semiconductor Group, including both logic and memory semiconductor
activities, to its subsidiary, Infineon Technologies AG. Following the formation of Infineon, we continued
operations as the Memory Products segment of Infineon. Infineon contributed substantially all of the assets,
liabilities, operations and activities, as well as the employees, of its Memory Products segment to our company
effective May 1, 2006. This excluded the Memory Products operations in Korea and Japan, which were placed
in trust for us by Infineon pending their contribution and transfer. The operations in Korea were transferred
into an indirect wholly-owned subsidiary of our company in October 2006. The operations in Japan are
governed by an agreement between us and Infineon under which sales and development personnel in the
region act for Qimonda. In addition, while Infineon's investment in the Inotera joint venture and Infineon's
investment in the Advanced Mask Technology Center (AMTC) and Maskhouse Building Administration
Company (BAC) in Dresden have been contributed to us, the legal transfer of these investments is not yet
effective. In the case of Inotera, Taiwanese legal restrictions have delayed the legal transfer, although an
exemption from these restrictions has been granted and we expect the transfer to be completed by the end of
the 2006 calendar year. In the case of Infineon's investment in the Dresden AMTC and BAC, Infineon's co-
venturers have not yet given the required consent to the transfer of the AMTC and BAC interest, although
pursuant to the AMTC and BAC limited partnership agreements, such consent may not be unreasonably
withheld. Infineon is obligated under a trust agreement with us to hold its investment in the Inotera joint
venture in trust for us and exercise shareholder rights (including board appointments and voting) on our
instruction. Infineon's investment in the Dresden AMTC and BAC is being held by Infineon for our economic
benefit pursuant to the contribution agreement. For as long as Infineon holds our interests in Inotera, AMTC
and BAC, we must exercise our shareholder rights with respect to these investments through Infineon, which
is a more cumbersome and less efficient method of exercising these rights than if we held the interests directly.
We do not expect these administrative complexities to have a material adverse effect on our business, financial
condition and results of operations.
Expected Benefits of our Carve-out
We believe that our carve-out and legal separation from Infineon will allow us and our shareholders to
realize the following benefits:
‚ Increased market responsiveness through an exclusive focus on the memory products business:DRAMs are subject to different market dynamics compared to Infineon's other products. By operating
as a separate business we expect to react more effectively to the dynamics of the memory market
through simplified decision-making processes independent from the requirements of Infineon's
81
Global Reports LLC
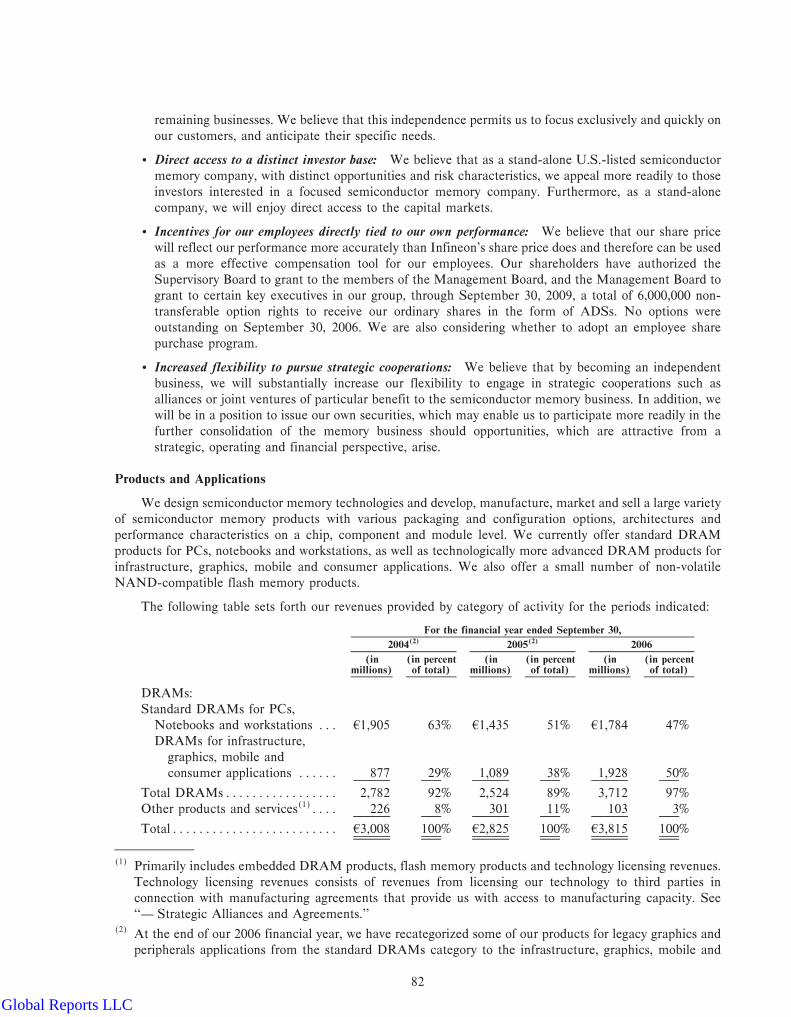
remaining businesses. We believe that this independence permits us to focus exclusively and quickly on
our customers, and anticipate their specific needs.
‚ Direct access to a distinct investor base: We believe that as a stand-alone U.S.-listed semiconductor
memory company, with distinct opportunities and risk characteristics, we appeal more readily to those
investors interested in a focused semiconductor memory company. Furthermore, as a stand-alone
company, we will enjoy direct access to the capital markets.
‚ Incentives for our employees directly tied to our own performance: We believe that our share price
will reflect our performance more accurately than Infineon's share price does and therefore can be used
as a more effective compensation tool for our employees. Our shareholders have authorized the
Supervisory Board to grant to the members of the Management Board, and the Management Board to
grant to certain key executives in our group, through September 30, 2009, a total of 6,000,000 non-
transferable option rights to receive our ordinary shares in the form of ADSs. No options were
outstanding on September 30, 2006. We are also considering whether to adopt an employee share
purchase program.
‚ Increased flexibility to pursue strategic cooperations: We believe that by becoming an independent
business, we will substantially increase our flexibility to engage in strategic cooperations such as
alliances or joint ventures of particular benefit to the semiconductor memory business. In addition, we
will be in a position to issue our own securities, which may enable us to participate more readily in the
further consolidation of the memory business should opportunities, which are attractive from a
strategic, operating and financial perspective, arise.
Products and Applications
We design semiconductor memory technologies and develop, manufacture, market and sell a large variety
of semiconductor memory products with various packaging and configuration options, architectures and
performance characteristics on a chip, component and module level. We currently offer standard DRAM
products for PCs, notebooks and workstations, as well as technologically more advanced DRAM products for
infrastructure, graphics, mobile and consumer applications. We also offer a small number of non-volatile
NAND-compatible flash memory products.
The following table sets forth our revenues provided by category of activity for the periods indicated:
For the financial year ended September 30,
2004(2) 2005(2) 2006
(in (in percent (in (in percent (in (in percentmillions) of total) millions) of total) millions) of total)
DRAMs:
Standard DRAMs for PCs,
Notebooks and workstations ÏÏÏ 41,905 63% 41,435 51% 41,784 47%
DRAMs for infrastructure,
graphics, mobile and
consumer applications ÏÏÏÏÏÏ 877 29% 1,089 38% 1,928 50%
Total DRAMsÏÏÏÏÏÏÏÏÏÏÏÏÏÏÏÏÏ 2,782 92% 2,524 89% 3,712 97%
Other products and services(1)ÏÏÏÏ 226 8% 301 11% 103 3%
TotalÏÏÏÏÏÏÏÏÏÏÏÏÏÏÏÏÏÏÏÏÏÏÏÏÏ 43,008 100% 42,825 100% 43,815 100%
(1) Primarily includes embedded DRAM products, flash memory products and technology licensing revenues.
Technology licensing revenues consists of revenues from licensing our technology to third parties in
connection with manufacturing agreements that provide us with access to manufacturing capacity. See
""Ì Strategic Alliances and Agreements.''(2) At the end of our 2006 financial year, we have recategorized some of our products for legacy graphics and
peripherals applications from the standard DRAMs category to the infrastructure, graphics, mobile and
82
Global Reports LLC
consumer applications category, for consistency with developments in the markets that we target. The
information for the product categories for prior periods has been reclassified to be consistent with the
revised categories.
Brands
Most of our products are sold under our QimondaTM brand and we are working to establish a brand
identity for ourselves using the QimondaTM name. See ""Risk Factors Ì Risks related to our carve-out as a
stand-alone company and our continuing relationship with Infineon Ì We may not be successful in
establishing a brand identity.'' We have applied for protection of our QimondaTM brand as a trademark,
domain and company name, but may not gain protection in all jurisdictions. We also sell a small portion of our
products under our AENEON» brand in the emerging markets in Eastern Europe and the Middle East. This
brand addresses the so-called ""white box'' PC market and the retail upgrade market. ""White box'' refers to
PCs manufactured by hundreds of small PC manufacturers worldwide and to unbranded PCs manufactured
by larger, well-known OEMs, and ""retail upgrade'' refers to consumers adding memory to their existing
computers, typically in their homes.
Standard DRAMs for PC, Notebook and Workstation Applications
We believe we offer a complete portfolio of standard DRAM products that provide a variety of speeds,
configurations and densities suited to particular end uses. We sell the majority of our standard DRAM
products for use in PC and workstations, to desktop and notebook computer manufacturers and to distributors
who sell DRAMs on to smaller original equipment manufacturers and contract manufacturers. Our standard
modules, including Unbuffered DIMMs and SO-DIMMs, are used primarily for PCs and notebooks, while
our more specialized modules such as High-Density SO-DIMMs and Micro-DIMMs are typically used in
high-end notebook computers and sub-notebooks. We believe our engineering capabilities permit us to offer
these specialized modules and differentiate us from suppliers focused primarily on standard DRAM products.
Many of our customers that produce PCs and workstations also produce servers, networking and storage
equipment or graphics, mobile and consumer products. We believe these customers expect us to offer both
standard DRAM products and other types of DRAM products so that we can supply their entire product
ranges. We intend to invest in technology development and anticipate playing an active role in the
development of future DRAM architectures, including third-generation DDR, or DDR3.
The large size of the standard DRAM market has made possible the substantial capital investments
required to achieve ever more advanced manufacturing capabilities. Being active in the high-volume standard
DRAM market enabled us to build our current scale and develop our existing manufacturing capabilities
forming the basis to expand our production of DRAMs for advanced infrastructure applications and specialty
DRAM products.
DRAMs for Infrastructure, Graphics, Mobile and Consumer Applications
In addition to standard DRAMs, we design, manufacture and sell technologically more advanced DRAM
components and modules for use in servers, networking and storage equipment and a variety of specialty
DRAMs for use primarily in graphics, as well as in mobile and consumer applications.
Infrastructure Applications
Our current portfolio of DRAMs for use in servers, networking and storage equipment includes FB-
DIMMs, which we believe will serve as the next generation of memory used in high-end servers, and very-low-
profile-DIMMs, intended for the blade server market. DRAM consumption in blade servers is expected to
enjoy 79% CAGR (based on bits shipped) from 2005 to 2010, according to Gartner. We believe we are the
only FB-DIMM supplier who has in-house capabilities to design a key component of this module, a logic chip
called Advanced Memory Buffer, or AMB. This allows us to customize the AMB design specifically for our
memory modules, providing us better know-how transfer from chip to system level and vice versa. We also
provide customized modules to server manufacturers, in each case specifically designed to meet the individual
83
Global Reports LLC
customer's unique platform requirements. We expect the markets for servers to grow substantially in the next
few years, and we are currently engaged in the development of products we believe will address that growth.
For example, we are developing new generations of standard DRAM with 2 gigabits of capacity for use in
future IT infrastructure applications.
Graphics Applications
We offer a broad portfolio of graphics DRAMs that support applications with performance ranging from
entry level to very advanced. Due to their speed, low power consumption and limited heat generation, our
graphics DRAM components are used in game consoles, graphics cards and PC and notebook computers. In
some cases, we make customized products for use in handheld game consoles and other handheld products.
We believe that the trend towards the extensive use of sophisticated graphics applications will result in strong
growth in high performance graphics systems which we believe will in turn drive the demand for our graphics
DRAM products.
Mobile and Consumer Applications
We offer low-power specialty DRAM products, such as Mobile-RAM and CellularRAM», that are
suited for use in a variety of mobile and consumer applications, such as:
‚ mobile phones;
‚ mobile consumer products, such as digital still cameras and digital audio players; and
‚ stationary consumer products, such as digital televisions and DVD recorders.
Our Mobile-RAM is specifically designed for ultra-low power consumption that is increasingly demanded
by today's battery powered mobile communication and consumer products. We intend to focus further on
driving technological innovations in this area and we believe we were the first to produce chips with a
temperature sensor integrated onto the chip as well as the first to introduce a DDR interface for a Mobile-
RAM to further reduce power consumption or alternatively offer higher performance. We also expect that new
consumer products that combine more features will require DRAMs that consume very low power, yet operate
at adequate speeds. We believe that the trench-architecture-based products we currently offer allow for a
significantly longer battery life and reduced heat dissipation, both important features for potential customers
and their end users.
Our CellularRAM» is designed to meet the growing memory density and bandwidth demands of future
2.5G and 3G mobile phone handset designs. We are also a founding member of the CellularRAM»
specification co-development team and, together with six other industry members create common specifica-
tions for high-performance pseudo-SRAM devices, enabling us to take an active role in the development of
DRAM memory products for one of the fastest-growing technology sectors.
Both our Mobile-RAM and CellularRAM» products are offered as components and as so-called Known-
Good-Dies, or KGDs, for use in Multi-Chip-Packages, or MCPs. MCPs combine different memory chips,
usually a non-volatile flash chip, and a faster, volatile RAM, and are increasingly used in mobile communica-
tion and consumer devices due to their lower space consumption. We supply our Mobile-RAM and
CellularRAM» as KGDs on wafer level to MCP manufacturers.
We also offer standard DRAM products for consumer applications, some of which are of smaller memory
densities or older interface generations, such as SDRAM. These are often referred to as ""legacy'' DRAM
products. For example the manufacturers of printers do not require large amounts of DRAM per printer, but
do require a DRAM product that is guaranteed to be available for the printer's entire life cycle, which may be
many years. In many cases, the DRAM products used in these devices are older DRAM products that were
previously state-of-the-art but are no longer widely used. These factors cause demand for legacy DRAM
products to be relatively less volatile and prices to be relatively steadier compared to other standard DRAM
prices.
84
Global Reports LLC

Other Products and Technology Licensing
In the 2006 financial year, we offered data flash memory products, primarily in the form of cards and to a
lesser extent in component form, for use in digital still cameras, USB flash drives, digital audio players and
mobile phones. Due to the significant price decline for data flash memories since the beginning of the 2006
calendar year, we have decided to ramp down the production of our flash products during the 2007 financial
year and to convert our flash production capacities to DRAM production capacities. We have stopped the
development of NAND-compatible flash memory products based on Saifun's proprietary NROM» technol-
ogy, which we licensed from Saifun when we purchased its remaining interest in our joint venture. See
""Ì Intellectual Property Ì Amendment and Partial Termination of Our License Agreement with Saifun''.
We continue to be engaged in technology development for non-volatile memories to address a market, if
one develops, in which we can provide a competitive platform for flash systems (which are modules containing
flash memory and a controller). We conduct our non-volatile memory development activities through our
wholly-owned subsidiary Qimonda Flash at our facilities in Dresden and Munich, Germany and Padua, Italy.
We sell a relatively small volume of embedded DRAM products in the form of ""system-on-chip'' ICs
that integrate memory and logic circuitry on a single chip.
In addition, we grant technology licenses of our intellectual property to our alliance partners, including
Winbond and Nanya. These licenses are often granted as part of cross licensing arrangements. They often
enable us to gain access to manufacturing capacity at foundries through these kinds of cross licenses and
capacity reservation arrangements.
The following table presents summary information regarding our principal products.
Products Principal features Principal applications
Standard DRAMProducts
Components ÏÏÏÏÏÏÏÏÏÏÏÏÏÏÏÏ Memory components in ‚ Mainstream bandwidth ‚ Memory modulesdifferent package ‚ Organization: x4, x8, ‚ Routersconfigurations, with x16different interfaces ‚ Manufactured in(SDRAM, DDR, DDR2) 140nm, 110nm, 90nmand densities (128Mb and 75nm process256Mb, 512Mb and 1Gb) technology
Modules ÏÏÏÏÏÏÏÏÏÏÏÏÏÏÏÏÏÏÏ Unbuffered Dual Inline ‚ Mainstream ‚ Desktop computersMemory Modules bandwidths from ‚ Workstations(DIMMS) based on DDR DDR-333 toand DDR2 components, DDR2-800with densities ranging from128MB to 2GB
SO (Small Outline) ‚ Mainstream ‚ Notebook computersDIMMS based on DDR or bandwidths fromDDR2 components, with DDR-333 todensities ranging from DDR2-800128MB to 2GB
Micro-DIMMS based on ‚ Bandwidths ‚ Sub-notebooksDDR2 components, with DDR2-400; DDR2-533densities ranging from 30% smaller than256MB to 1GB standard SO-DIMMS
85
Global Reports LLC

Products Principal features Principal applications
Infrastructure, Graphics,Mobile and Consumer DRAMProducts
Infrastructure(1)ÏÏÏÏÏÏÏÏÏÏÏÏÏ Registered DIMMS and ‚ Mainstream ‚ Serverscustomized DIMMS based bandwidths from ‚ Workstationson DDR and DDR2 DDR-266 tocomponents, with densities DDR2-533ranging from 256MB to4GB
FB (Fully Buffered) ‚ Bandwidths from ‚ ""Next generation''DIMMS based on DDR2 DDR2-533 to serverscomponents, with densities DDR2-667ranging from 512Mb to 4Gb ‚ New interconnect
technology
Very-low-profile-Registered ‚ Bandwidths from ‚ Blade-serversDIMMS based on DDR2 DDR2-533 tocomponents, with densities DDR2-667ranging from 512MB to ‚ Reduced Height2GB
GraphicsÏÏÏÏÏÏÏÏÏÏÏÏÏÏÏÏÏÏÏ Graphics RAM (256Mb, ‚ Bandwidth up to ‚ Graphics cards in512Mb) based on DDR, 6.4GB per second desktop and note-DDR2 and GDDR3 ‚ Organization: x16, x32 book computersinterfaces ‚ Manufactured in 90nm ‚ Game consoles
and 110nm processtechnology
Mobile and Consumer(1) ÏÏÏÏÏ Mobile-RAM (128Mb, ‚ Ultra low power ‚ Top range mobile256Mb, 512Mb) based on ‚ FGBA-package phones (2.5G/3G)SDR and DDR interfaces; ‚ Voltages: 1.8V-3.3V ‚ PDAsalso available as ""known ‚ Low operating current ‚ Digital still camerasgood dies'' ‚ Low standby current ‚ Digital audio players
CellularRAM» (64Mb, ‚ Refresh-free operation ‚ Mid-range mobile128Mb); also available as ‚ Low power phones (2.5G/3G)""known good dies'' consumption
‚ Manufactured in110nm processtechnology
Other Products(2)
Flash Cards and USB DrivesÏÏ TwinFlash» Cards and USB ‚ Standard-compatible ‚ Mobile phonesDrives cards in 64MB, ‚ PDAs
128MB, 256MB ‚ Smart handheldconfigurations using devices170nm and 110nm ‚ Digital still camerasprocess technology ‚ Portable data storage
‚ MMC(MultiMediaCards)
‚ SD (secure digital)Cards
‚ Micro-SD andmini-SD Card formats
‚ 128MB and 256MBUSB drives
Flash Components ÏÏÏÏÏÏÏÏÏÏ TwinFlash» Components ‚ NAND-compatible ‚ Mobile phonesstand-alone ‚ Digital still camerascomponents in 512Mb ‚ Digital music playersand 1Gb configurations ‚ Handheld computersusing 170nm and ‚ Digital voice110nm process recorderstechnology
(1) We also sell our range of standard DRAM components to customers who manufacture infrastructure
equipment and consumer electronic devices including digital televisions, set-top boxes and DVD recorders.(2) We have decided to ramp down this production during the 2007 financial year.
86
Global Reports LLC

DRAM Density and Interface Development
We believe we are an industry leader in transitioning to next generation memory density and interface,
specifically as regards the 512Mb density and DDR2 interface. According to iSuppli, we were the largest
supplier of 512M DDR2 products in the first half of the 2006 calendar year based on bits shipped. The
following table sets forth the percentage of our total DRAM bit shipments (by density and interface) for the
periods indicated:
For the financial year ended September 30,
DRAM: 2004 2005 2006
(in percent)
By density:
128MbÏÏÏÏÏÏÏÏÏÏÏÏÏÏÏÏÏÏÏÏÏÏÏÏÏÏÏÏÏÏÏÏÏÏÏÏÏÏÏÏÏÏÏ 4 1 0
256MbÏÏÏÏÏÏÏÏÏÏÏÏÏÏÏÏÏÏÏÏÏÏÏÏÏÏÏÏÏÏÏÏÏÏÏÏÏÏÏÏÏÏÏ 90 51 24
512MbÏÏÏÏÏÏÏÏÏÏÏÏÏÏÏÏÏÏÏÏÏÏÏÏÏÏÏÏÏÏÏÏÏÏÏÏÏÏÏÏÏÏÏ 6 47 74
1Gb ÏÏÏÏÏÏÏÏÏÏÏÏÏÏÏÏÏÏÏÏÏÏÏÏÏÏÏÏÏÏÏÏÏÏÏÏÏÏÏÏÏÏÏÏÏ 0 1 2
By interface:
SDRAM ÏÏÏÏÏÏÏÏÏÏÏÏÏÏÏÏÏÏÏÏÏÏÏÏÏÏÏÏÏÏÏÏÏÏÏÏÏÏÏÏÏ 11 5 3
DDR ÏÏÏÏÏÏÏÏÏÏÏÏÏÏÏÏÏÏÏÏÏÏÏÏÏÏÏÏÏÏÏÏÏÏÏÏÏÏÏÏÏÏÏÏ 83 60 30
DDR2 ÏÏÏÏÏÏÏÏÏÏÏÏÏÏÏÏÏÏÏÏÏÏÏÏÏÏÏÏÏÏÏÏÏÏÏÏÏÏÏÏÏÏÏ 1 27 51
Specialty DRAMs ÏÏÏÏÏÏÏÏÏÏÏÏÏÏÏÏÏÏÏÏÏÏÏÏÏÏÏÏÏÏÏÏÏ 5 8 16
Customers, Sales and Marketing
Our customers include the world's largest suppliers of computers and electronic devices. Our current
principal customers include major computing original equipment manufacturers, or OEMs, including HP,
Dell, IBM, Sun Microsystems and Sony. To expand our customer coverage and breadth, we also sell a wide
range of products to memory module manufacturers that have diversified customer bases such as Kingston,
and to a number of distributors. More recently and in connection with the ongoing expansion of our product
portfolio, especially into graphics applications, we have added customers with a strong focus on enabling these
applications, such as nVidia, ATI and customers who are active in the game console market, such as
Microsoft. By having a close relationship with these customers we believe we can benefit in the development
of future memory generations.
We have been a primary DRAM supplier to major OEMs, including HP and Dell, in a number of recent
years. These customers generally provide relatively more stable demand for standard DRAM than is available
on the spot market, and we believe they are good partners for product development. In the infrastructure area,
we believe that we have been able to establish a strong presence based on our high performance and high
quality products, including application-specific and customized products. For example, we have received
supplier awards from Sun Microsystems in each of the last four years.
The number of customers we serve has increased over recent years from about 150 in our 2003 financial
year to about 170 in the 2006 financial year as we continued to diversify our product portfolio. In our 2006
financial year, our five largest customers accounted for 49% of our total sales. HP, our largest customer, alone
accounted for 18% of our sales and Dell, our second largest customer accounted for 16% of our sales. In our
2005 financial year, our five largest customers accounted for 52% of our sales and our 20 largest customers
accounted for nearly 76% of our sales. HP accounted for nearly 19% of our sales, Dell accounted for 14% of
our sales and three additional customers each accounted for more than 5% of our sales. In our 2004 financial
year, our five largest customers accounted for 52% of our sales and our 20 largest customers accounted for 82%
of our sales.
We sell our semiconductor memory products throughout the world, primarily in the United States,
Europe and the Asia/Pacific region. We make our sales primarily through direct sales channels and, in order
to ensure best possible customer coverage and reach, make use of distributors. We focus our principal sales
87
Global Reports LLC
and marketing efforts on the technology leaders in each of the DRAM markets we serve. We believe we have
strong customer relationships and that our customers, many of which are leaders in their respective fields,
provide us with special insights into the current state of their respective markets. We tailor our sales approach
to our customers, serving our largest customers, primarily global PC and infrastructure OEMs, via our Key
Account Centers and serving our local OEMs, module manufacturers and distributors via our regional sales
organizations. Each Key Account Center is comprised of a Key Account Center Head, the individual
responsible for developing the account strategy who serves as the customer's primary point of contact, and a
team of their engineering experts. Our engineering experts work directly with our customers to tailor our
products to each of their specific needs as well as to the needs of their quality and supply chain experts.
Because most of our sales employees are trained engineers, these teams are able to provide crucial technical
support to ensure that each of our customer's requirements are met. Each Key Account Center team is
responsible for the needs of its customers on a global basis, and we expect them to achieve or maintain a
position as a top supplier of DRAM to that customer in terms of quality and volume. We believe that our key
account approach, as the first among three focus points of our sales strategy, assists us in developing and
maintaining strong relationships with our major customers, which is particularly important for customers who
purchase primarily standard DRAMs who could easily migrate to other suppliers.
Because many of our Key Accounts in the PC and infrastructure markets also produce graphics, mobile
and consumer products, the second focus of our sales strategy is to leverage our existing relationships to
expand the applications in which we serve them. For example, we recently began to focus more effort on
marketing customer- and application-specific DRAMs for graphics, mobile and consumer applications,
because we believe the market for these applications will be attractive with respect to price, stability and
demand growth. The third key focus of our sales strategy is to continue to expand the product portfolio we
deliver to each of our customers by leveraging our strong technical skills and working directly with them to
design specific memory products for use in their end products. Our development engineering teams, composed
of trained engineers, work directly with customers, creating products specifically designed for particular
customers in a process we call ""designing in''. In some cases, several DRAM producers may attempt to design
their product into the customer's application, each vying to best meet the customer's requirements. Our
development engineering teams play a key role in this regard.
Our regional sales teams are located in Europe, North America, Asia/Pacific and Japan, and are
supported by our headquarters in Germany. These regional sales centers enable us to bring our business to our
customer base and to provide local contact and support to the Key Account Center teams in those regions.
Each of our regional sales centers is equipped to perform all key sales support, and each of our regional sales
organizations is responsible for acquiring new customers and managing the region's product mix and inventory.
We sell the majority of our products under our new brand name Qimonda. However, we also established
a second brand, AENEON», in 2004 to address the so-called ""white box'' PC markets and retail upgrade
markets. ""White box'' refers to PCs manufactured by hundreds of small PC manufacturers worldwide and to
unbranded PCs manufactured by larger, well-known OEMs, and ""retail upgrade'' refers to consumers adding
memory to their existing computers, typically in their homes. Worldwide, approximately 40% of PC and
notebook DRAM revenues were derived from the ""white box'' and retail upgrade markets according to
iSuppli. These markets exist worldwide, and we believe that emerging markets such as China and Latin
America will drive strong growth in the future. Customers in these markets typically seek the lowest cost
products that have dependable quality. We ensure the quality of our AENEON» products through testing the
compatibility with major PC and notebook platforms. This process is often shorter and more cost-efficient
than the testing required by high-end applications of our OEM customers. We sell our AENEON» products
via an extensive network of distributors and retailers worldwide, and have recently begun to offer them through
a dedicated Internet sales channel.
We generally enter into agreements with our customers specifying the terms and conditions under which
they agree to purchase our products and the terms and conditions under which we agree to supply them. The
period of time over which prices and volume are fixed depends on the application market in which the
customer operates. In general, prices and volumes are negotiated for periods ranging from a few days, for
standard DRAMs for PC, notebook and workstation products in the spot market, up to one year for customer-
88
Global Reports LLC

and application-specific DRAMs used in graphics, mobile and consumer applications. The majority of our
sales volume, however, is based on contracts in which prices and volumes are re-negotiated twice a month.
The majority of our customer agreements require our customers to provide us with a regular forecast of their
DRAM demand. Our determination of the mix of products to be manufactured is primarily based on our own
internal forecasts in combination with the forecasts our customers provide.
We categorize our sales geographically based on chosen billing location. In many cases, our customers
then choose to ship our products to locations other than the billing locations. Accordingly, we do not believe
that the geographical distribution of our sales are necessarily indicative of where our products are actually
used. The geographical distribution of our sales by percentage during the periods indicated was as follows:
Sales by Region
For the financial yearended September 30,
2004 2005 2006
(in percent)
Germany ÏÏÏÏÏÏÏÏÏÏÏÏÏÏÏÏÏÏÏÏÏÏÏÏÏÏÏÏÏÏÏÏÏÏÏÏÏÏÏÏÏÏÏÏÏÏÏÏÏÏÏÏÏÏÏÏÏ 13 8 8Other Europe ÏÏÏÏÏÏÏÏÏÏÏÏÏÏÏÏÏÏÏÏÏÏÏÏÏÏÏÏÏÏÏÏÏÏÏÏÏÏÏÏÏÏÏÏÏÏÏÏÏÏÏÏÏ 12 12 11North America ÏÏÏÏÏÏÏÏÏÏÏÏÏÏÏÏÏÏÏÏÏÏÏÏÏÏÏÏÏÏÏÏÏÏÏÏÏÏÏÏÏÏÏÏÏÏÏÏÏÏÏÏ 38 38 42Asia/PacificÏÏÏÏÏÏÏÏÏÏÏÏÏÏÏÏÏÏÏÏÏÏÏÏÏÏÏÏÏÏÏÏÏÏÏÏÏÏÏÏÏÏÏÏÏÏÏÏÏÏÏÏÏÏÏ 33 38 31Japan ÏÏÏÏÏÏÏÏÏÏÏÏÏÏÏÏÏÏÏÏÏÏÏÏÏÏÏÏÏÏÏÏÏÏÏÏÏÏÏÏÏÏÏÏÏÏÏÏÏÏÏÏÏÏÏÏÏÏÏÏ 4 4 7Other ÏÏÏÏÏÏÏÏÏÏÏÏÏÏÏÏÏÏÏÏÏÏÏÏÏÏÏÏÏÏÏÏÏÏÏÏÏÏÏÏÏÏÏÏÏÏÏÏÏÏÏÏÏÏÏÏÏÏÏÏ Ì Ì 1
100% 100% 100%
Increased sales of products for use in graphics, mobile and consumer applications, in particular to
consumer electronics and game-console manufacturers in the North America and Japan regions during the
2006 financial year resulted in a proportional increase relative to the other regions compared to the 2005
financial year.
As of September 30, 2005, we had 264 sales and marketing employees worldwide, which had increased to
320 as of September 30, 2006. In connection with our focus on expanding our customer and product portfolios,
we have added employees to our marketing teams in recent years, many of which are directly engaged with our
customers.
Our marketing teams determine the products required to meet our customers' needs and support both our
Key Account Centers and regional sales forces. Our marketing organization is divided into product marketing
groups and various regional marketing groups, and both groups work closely with our customers and with our
sales and R&D organizations. Our product marketing groups help plan our product roadmap, to enable us to
develop and manufacture products that we believe will meet our customers' changing requirements. Our
regional marketing teams collect local customer requirements, work together with the product marketing
groups and support their respective regional sales organization. Our product marketing organization is
primarily based in Germany.
Competition
We compete generally on the basis of price, product design, technical performance, production capacity,
product features, product system compatibility, quality, product reliability, and support. Production capacity
and quality, in addition to the ability to deliver products reliably and within a very short period of time, play
particularly important roles. The importance, however, of these factors varies based on the market for the
product group in question.
‚ Standard DRAMs for PC and workstation applications. We compete in this market on the basis of
price, delivery reliability and logistical support. We believe we maintain a strong reputation for delivery
reliability based on feedback from our customers.
89
Global Reports LLC

‚ DRAMs for infrastructure, graphics, mobile and consumer applications. We compete in these
markets on the basis of product quality, performance, reliability and engineering support. Logistical
support is particularly important for infrastructure applications. Our engineering teams are able to
design customer-specific products, while we believe that our trench architecture possesses physical
characteristics that we are exploiting to design DRAM products with high performance for uses such
as in graphics applications, and with relatively lower power consumption, which enables longer battery
life and lower heat generation in mobile and consumer electronics devices, key areas of concern for our
customers. We believe the Sun Microsystems (Best In Class Memory Supplier) award we earned in
2006 for the second consecutive year is an indicator of the high quality and reliability of our products
geared toward infrastructure applications.
The markets for our products, especially our standard DRAM products, are intensely competitive. Our
principal competitors include other major international DRAM producers as well as many smaller manufac-
turers that manufacture DRAM using design and manufacturing technologies licensed from the major
DRAM producers. Several of these companies license technology from us and, in some cases, we purchase a
portion of their DRAM output, while at the same time competing with them for sales. See "" Ì Strategic
Alliances and Agreements'' for a description of our manufacturing arrangements with strategic partners.
The following table sets forth the market share in percentage based on DRAM revenues in the second
quarter of calendar year 2006 of our principal competitors, according to Gartner, and the primary areas in
which we believe we compete with them:
Principal Competitor Areas of competition Market share
Samsung Electronics ÏÏÏÏÏÏÏÏÏÏÏÏÏÏÏÏÏÏÏÏ Standard, infrastructure, graphics, mobile 28%and consumer DRAMs
Hynix Semiconductor, Inc. ÏÏÏÏÏÏÏÏÏÏÏÏÏÏÏ Standard, infrastructure, graphics, mobile 16%and consumer DRAMs
Micron Technology, Inc. ÏÏÏÏÏÏÏÏÏÏÏÏÏÏÏÏ Standard, infrastructure, mobile and 12%consumer DRAMs
Elpida Memory, Inc. ÏÏÏÏÏÏÏÏÏÏÏÏÏÏÏÏÏÏÏÏ Standard, infrastructure, mobile and 10%consumer DRAMs
Nanya Technology Corporation(1) ÏÏÏÏÏÏÏÏÏ Standard DRAMs 7%
(1) Nanya Technology Corporation is our joint venture partner in Inotera Memories, Inc.
According to Gartner, we had the second largest market share based on DRAM revenue in the second
quarter of calendar year 2006, with a 16% share.
Research and Development
We believe that research and development, or R&D, will continue to be critical in developing
technologically advanced products that are sought after by our customers, as well as manufacturing processes
that improve our productivity. Our R&D efforts are intended to build upon our past successes. We believe that
we remain at the forefront of our industry in the process of converting DRAM manufacturing from 200mm
wafers to 300mm wafers and were the first to implement 193nm lithography in mass production. In the late
1990s, we were among the first to introduce the 256Mb density generation to the market, and we believe we
are among the leaders in the industry's transition to 512Mb DDR2 DRAM, which is currently underway. We
believe we were the first DRAM developer to bring DDR MobileRAM to the market in October, 2004.
Our R&D activities are broadly divided into two major steps. First we develop a manufacturing process
technology and a design platform in conjunction with a ""lead'' product. The design platform is comprised of a
technology specific design system, which includes computer aided design, libraries to assist in the development
process and a technology-specific library of reusable IP blocks. Subsequently, the rest of the product portfolio
is developed as ""follower'' products which utilize the design platform established in the first step.
90
Global Reports LLC
Product Development
Our product development activities focus on those specialized and advanced products that we believe
provide us more stable and higher selling prices than standard DRAMs. To enable this, we have increased the
number of product development engineers from around 560 at the end of the 2003 financial year to more than
1,100 worldwide at the end of the 2006 financial year. We believe these enhanced resources have resulted in
the recent successes we have had developing new products. For example, we expanded our graphic DRAM
product portfolio from a single product in 2003 to a range of six products we currently offer in different
densities, interfaces and speed for the full range of graphics applications from entry level to high-end.
We have placed particular emphasis in recent years to the expansion of our R&D resources in lower cost
locations. For example, we rapidly built up our team in Xi'an, China, in the 2005 financial year. We believe
that appropriate use of skilled R&D personnel in lower-cost locations will improve our ability to maintain our
technical position while managing costs.
We use various tools in our design process that enable us to reuse technologies and thus reduce the time
we need to develop our technology platforms:
‚ Reusable IP blocks, which are the core elements of each of our products. These are various pieces of
circuitry that can be reused for new chip designs, reducing the amount of time and effort that it takes to
develop a new chip on a given technology platform.
‚ CAD systems are crucial tools for semiconductor designers. We make use of extensive CAD systems,
some of which we have licensed from vendors such as Cadence, Mentor Graphics and Synopsis, and
some of which we have developed internally.
‚ Design libraries, or databases that contain templates and standard design elements that are common to
multiple products, allow our development teams to more efficiently design new products, reduce
development cycle times and optimize designs for higher performance and reduced power
consumption.
We use a ""core team'' approach to develop products, to enable us to effectively design our platforms and
lead products. The core team consists of a program manager who leads the team, and various sub-team
leaders, including specialists in product definition, product marketing, supply chain, finance, application
engineering, quality, front-end and back-end site, manufacturing, product test, and design. We empower the
core team to make its own decisions within the scope of the project plan.
We define our products in close cooperation with lead customers and industry partners. We actively drive
new standards and participate in standardization committees such as the Joint Electron Device Engineering
Council (JEDEC). Our worldwide operating Application Engineering teams help our customers to design in
our products into their systems. These teams provide technical support to our customers and work to qualify
our memory components and modules for inclusion in our customers' products. They also work with the
suppliers of components designed to function together with DRAMs to ensure that our products are validated
for use with their products.
Process Technologies
Process technologies have been a key focus for our R&D activities, as we seek to reduce feature sizes and
develop new processes. To maintain a competitive technology roadmap at an affordable cost level, we pursue
strategic alliances with several partner companies and consortia. Strategic development alliances, such as the
one we maintain with Nanya for DRAM technology and lead product development, allow us to share costs
and resources. In particular, our Nanya alliance finalized the process technology development of the 75nm
process technology in 2006. Since September 2005, this alliance has been developing 58nm process technology
for DRAM products, including the lead products which will use these new technologies. We also cooperate
with Advanced Micro Devices Inc. and Toppan Photomasks Inc. in the joint ventures AMTC and BAC.
AMTC is currently developing and pilot manufacturing the next generation of photomasks. BAC operates and
leases the facility in which AMTC and Toppan Photomasks Germany GmbH are located. All of our DRAM
91
Global Reports LLC

and flash technology development takes place at our DRAM and Flash technology development center in
Dresden, Germany.
We are also engaged in the research and development of various emerging memory technologies.
Primarily we focus on Phase Change Random Access Memories (PCRAM), Conductive Bridging RAM
(CBRAM) and Magnetoresistive RAM (MRAM). These emerging memories use alternative methods to
store information. Among them may be candidates to replace existing mainstream memory technologies in the
long-term.
Packaging Technology
Since 2002, we have concentrated our development activities for packaging technology in Dresden, at our
back-end pilot fab, where work focuses on both development of new packages and assembly innovation. The
development of follower packages or products is conducted at our high volume backend sites in Porto,
Portugal, Suzhou, China and Malacca, Malaysia. We also cooperate with Infineon on various aspects of
package development as well as with United Test and Assembly Center, Singapore on the development of
Multichip Packages.
Cooperation with Infineon
In connection with our carve-out, we have entered into various agreements with respect to our R&D
activities. In particular, the Framework Agreement on Research and Development Services defines the
parameters of our cooperation with Infineon with respect to certain R&D areas. See ""Related Party
Transactions and Relationships Ì With Infineon'' for more details on these parameters. Under the Frame-
work Agreement on Research and Development Services, we will continue to work together with Infineon on
various common development activities, including jointly funded R&D projects that focus on process
development and packaging technologies. We anticipate that most of these projects will be carried out in
Germany. We expect to continue to cooperate with Infineon, sharing equipment and making use of synergies
at our Reliability Lab, and failure analysis, both of which help us reduce yield loss, or manufacturing errors, in
production.
Locations
We conduct R&D activities in various locations around the world. The following table shows our major
R&D locations and their areas of competence, including the principal R&D joint ventures in which we
participate:
Principal Research and Development Locations
Location Areas of competence
Burlington, Vermont ÏÏÏÏÏÏÏÏÏÏÏÏÏÏÏÏÏÏÏÏÏÏ Low power and mobile and consumer DRAMs
Dresden, Germany(1)ÏÏÏÏÏÏÏÏÏÏÏÏÏÏÏÏÏÏÏÏÏÏ DRAM technology, flash technology, packagetechnology and photomask technologydevelopment
Munich, Germany(2) ÏÏÏÏÏÏÏÏÏÏÏÏÏÏÏÏÏÏÏÏÏÏ Computing and graphic DRAMs, as well asemerging memory research; flash productdevelopment
Padua, Italy ÏÏÏÏÏÏÏÏÏÏÏÏÏÏÏÏÏÏÏÏÏÏÏÏÏÏÏÏÏ Flash product development and design
Raleigh, North Carolina ÏÏÏÏÏÏÏÏÏÏÏÏÏÏÏÏÏÏÏ Product development for standard andspecialty DRAM
Xi'an, ChinaÏÏÏÏÏÏÏÏÏÏÏÏÏÏÏÏÏÏÏÏÏÏÏÏÏÏÏÏÏ Computing and consumer DRAMs
(1) Includes our own research and research conducted in conjunction with our development partner, Nanya as
well as our photomask related research and development conducted in conjunction with AMD and
Toppan.
(2) Includes our own research and research conducted in conjunction with our development partner, Nanya.
92
Global Reports LLC

In addition to our principal locations, we have smaller locations in San Jose, California, and Tokyo,
Japan, where we support development of specific applications or specific customers' lead products.
We conduct DRAM product and process technology development on three continents at a number of
major development centers. Our Dresden 300mm fab has an R&D center integrated directly into it, enabling
us to conduct R&D at production site, which we believe enables us to quickly transfer know-how from
development into manufacturing. Our Research and Development Center, where we conduct manufacturing
process technology development, is located at the Dresden center. The Center for Nano-Technology, operated
in cooperation with the Fraunhofer Society and Advanced Micro Devices, is also located at our Dresden
facility. The Center further strengthens our research capabilities with respect to both DRAM and non-volatile
memory process technology. Finally, the AMTC, operated together with AMD and Toppan, is located at
Dresden.
Our development center in Munich, Germany focuses on lead products for computing and graphics
applications. The design center in Raleigh, North Carolina, focuses on ""follower'' products for computing and
graphics, while our design center at Burlington, Vermont, focuses on mobile products. Our design center in
Xi'an, China focuses on computing and consumer DRAM products. In addition to DRAM products, we also
design and develop flash memory products in Padua, Italy, and Munich, Germany, and develop high speed
AMB chips in Munich, Germany. Additional customer specific product development work is done in smaller
development centers. Finally, we maintain an extensive network of cooperation arrangements with technical
institutes and universities to remain current with technological developments.
At September 30, 2006 our research and development staff consisted of 1,756 employees working in our
R&D units throughout the world, a net increase of 316 compared to 1,440 at September 30, 2005.
Strategic Alliances and Agreements
Our strategic alliances include both research and development and manufacturing alliances. We believe
that these strategic alliances confer a number of important benefits, including:
‚ worldwide access to the expertise of other industry participants, including manufacturing competence
in new locations and additional experienced R&D employees;
‚ sharing the risks inherent in the development and manufacture of new products;
‚ sharing costs, including the costs of R&D and production ramp-up; and
‚ efficiency gains, including reduced time-to-market of new generations of semiconductor devices and
greater economies of scale.
We believe that a key element of the success of our strategic alliances and foundry agreements results
from our philosophy that these alliances should be mutually beneficial. For example, our foundry agreements
provide us access to flexible manufacturing capacity, while our partners can benefit from access to our
technology and manufacturing expertise.
93
Global Reports LLC

The following table shows our principal strategic manufacturing and R&D alliances, as well as their
respective activities and locations as of September 30, 2006:
Principal Strategic Alliances
Partner Relationship Principal Activity Location
Nanya ÏÏÏÏÏÏÏÏÏÏÏÏÏ Joint venture participant DRAM manufacturing at Taoyuan, Taiwanin Inotera, in which we Inotera's new 300mmhold a 36.0% interest(1) facility
Nanya ÏÏÏÏÏÏÏÏÏÏÏÏÏ Joint R&D activities R&D in both product Dresden and Munich,and technology Germanydevelopment for 90nm,75nm and 58nm processtechnologies
CSVC ÏÏÏÏÏÏÏÏÏÏÏÏÏ Joint venture participant Back-end assembly and Suzhou, Chinain Qimonda Suzhou in test at the joint venture'swhich we hold a 72.5% new facilityeconomic interest(2)
SMIC ÏÏÏÏÏÏÏÏÏÏÏÏÏ Foundry manufacturing Manufacturing capacity Shanghai and Beijing,at SMIC's facilities China
Winbond ÏÏÏÏÏÏÏÏÏÏÏ Foundry manufacturing Manufacturing capacity Hsinchu, and Taichung,at Winbond's facilities Taiwan
(1) Nanya holds slightly more Inotera shares than we do, and the public and employees of Inotera own the
remainder.(2) We are obligated to inject additional equity of $167 million into the joint venture by the year 2008. This
would increase our ownership percentage accordingly.
In addition to these principal alliances, we also participate in a number of smaller alliances, especially in
the area of emerging memory development. These include a development alliance with IBM on Phase Change
Memories (PCRAM) and a development alliance with Altis on Conductive Bridging (CBRAM) and
Magnetoresistive RAM (MRAM). We are also cooperating with Advanced Micro Devices, Inc., or AMD,
and Toppan Photomasks (formerly DuPont Photomasks Inc.) on the development and production of
photomasks at the Advanced Mask Technology Center GmbH & Co. KG, or AMTC, in Dresden, Germany.
We maintain an equity investment in Maskhouse Building Administration GmbH & Co. KG, (BAC) a
German limited partnership company that owns the premises used by the Advanced Mask Technology Center
(AMTC) described below and Toppan Photomasks Germany. Infineon's co-venturers have not yet given the
required consent to the transfer of the AMTC and BAC interest to us, although pursuant to the AMTC and
BAC limited partnership agreements, such consent may not be unreasonably withheld. The AMTC and BAC
interest is held in trust by Infineon for our economic benefit pursuant to the contribution agreement.
We also have an equity investment in Hwa-Keng, a Taiwanese company formed for the purpose of
facilitating the distribution of Inotera shares to Inotera's employees. This company is currently undergoing
liquidation because its business purpose has been fulfilled with the completion of the initial public offering of
Inotera's shares. We and Nanya purchased half of the Inotera shares held by Hwa-Keng. After the liquidation
is complete, Hwa-Keng's assets (principally the proceeds from the sale of the shares) will be distributed to its
shareholders, Nanya and Infineon. Pursuant to the contribution agreement, Infineon will then transfer these
assets to us.
Research and Development Alliances
Infineon has entered into a number of agreements to cooperate with industry participants to conduct
R&D related to the development of new products and manufacturing process technologies. These agreements
enable us to benefit from the expertise of other industry participants and to share the costs and risks inherent
94
Global Reports LLC

in the development of new products and process technologies. Our principal R&D alliance is with Nanya
Technology Corporation, a Taiwanese company with which we also have a manufacturing collaboration
through our Inotera joint venture.
In November 2002, Infineon entered into agreements with Nanya to establish a strategic cooperation for
the development of DRAM products and to form Inotera Memories, Inc. Inotera is a joint venture the purpose
of which is to construct and operate a 300mm manufacturing facility with two manufacturing modules in
Taiwan. Under the terms of the development agreement, we are jointly developing and sharing development
costs with Nanya for advanced 90nm and 75nm process technologies. The research is being conducted in
Dresden and Munich. By June 2005, we and Nanya had qualified the 90nm DRAM technology and achieved
validation by Intel. By September 2006, we and Nanya had qualified the 75nm DRAM technology and
achieved validation by Intel.
In September 2005, Infineon entered into another agreement with Nanya to expand their joint
development cooperation on DRAM process technologies. The new agreement provides for the joint
development of advanced 58nm production technologies for 300mm wafers and the sharing of development
costs two-thirds for us and one-third by Nanya. Joint development began upon signing the agreement. We
believe the extension of the existing co-development of projects could help us expand our position in the
DRAM market and reduce our up front development costs.
The November 2002 agreement, as amended, entitles Nanya to receive from us or our then-existing
foundry partners 60% of that amount of our foundry capacity that is in excess of the foundry capacity we
receive as of December 2006. Nanya may also receive 50% of our foundry capacity for which we contract after
March 1, 2006 with new foundry partners. Our obligation to provide foundry capacity is capped at one third of
our total 90nm foundry capacity. In combination, the 2002 and 2005 agreements also entitle Nanya to receive
from us or our foundry partners one third of our 75nm foundry capacity and one third of our 58nm foundry
capacity. As of the date of this annual report, we have not contracted for foundry capacity that would require
us to cede capacity to Nanya under these agreements. We do not expect that any foundry capacity that we
may be required to provide to Nanya will have a material adverse effect on our business, financial condition or
results of operations.
Infineon was free to assign the agreements mentioned above to us and has done so in connection with the
carve-out. The 2002 development agreement remains in effect until the date of completion of the last
technical cooperation project, but may be terminated by either party upon a material breach by the other
party, insolvency or bankruptcy of the other party, or the acquisition, by a third party, of at least half of the
voting stock or control of the other party. The 2005 development agreement remains in effect at least until
December 2007, at which point, if the goals of the cooperation project have not been completed, the parties
agree to continue working for an additional six months and then discuss the extension of the timeframe for the
project. The agreement may also be terminated by either party upon a material breach by the other party,
insolvency or bankruptcy of the other party, or the acquisition, by a third party, of at least half of the voting
stock or control of the other party.
Inotera completed an initial public offering of its shares on March 17, 2006 and an offering of its global
depositary shares on May 10, 2006. Its shares are now listed on the Taiwan Stock Exchange and its global
depositary shares are listed on the Luxembourg Stock Exchange. The initial public offering of shares and the
offering of global depositary shares raised approximately $619 million which will be used to fund the second
manufacturing module.
Manufacturing Alliances
We also have a number of long-term strategic agreements with leading industry participants to
manufacture products. We intend to use these agreements to assist us in maintaining our strong technological
position and sharing start-up costs inherent in transitioning to successive generations of semiconductor
memory products. We believe these alliances allow us to reduce the capital we would have had to invest if we
were to engage in these activities alone. In addition, they provide us with access to modern manufacturing
capacity in low cost regions. Our manufacturing alliances are part of our global ""fab cluster''. This concept
95
Global Reports LLC

permits us to share engineering know-how, manufacturing and quality control best practices and common
rollouts of process improvements among all of the facilities in which our products are produced.
Inotera
As described above, in November 2002 Infineon entered into agreements with Nanya to establish a
strategic cooperation in the development of DRAM products and to form Inotera Memories, Inc., a joint
venture to construct and operate a 300mm manufacturing facility with two manufacturing modules in Taiwan.
We expect that Inotera's 300mm manufacturing facility in Taiwan will employ the production technology
developed under our separate joint development agreement with Nanya. The construction of the first Inotera
module was completed and mass production began in the 2004 financial year. The capacity ramp-up of this
first module is expected to be completed in three phases. The first two phases have been completed and
capacity reached approximately 60,000 wafer starts per month as of August 2005. The third phase, ramping up
the total capacity of the first manufacturing module up to 62,000 wafer starts per month, was completed
during our 2006 financial year. In May 2005, the groundbreaking for the second manufacturing module took
place. Construction of this manufacturing module was completed in the 2006 financial year and the move-in
of equipment has started. Under the terms of the venture, Nanya and we each purchase 50% of Inotera's
output. The joint venture agreement does not have a fixed term. It can be terminated by either party upon
material breach by the other party of the agreement, the 2002 development agreement, the product purchase
agreement or the ancillary know-how transfer agreement, upon bankruptcy or liquidation of the other party or
if the other party's share ownership in Inotera drops below 33.5%. The joint venture agreement is
automatically terminated when one of the parties transfers or sells all of its shares in Inotera.
The purchase price per DRAM wafer we pay to Inotera is calculated using a profit and loss sharing
formula set forth in the product purchase and capacity reservation agreement we have entered into with Nanya
and Inotera. The calculation is performed monthly and the purchase price is equal to the sum of:
‚ an amount representing the front-end cost per wafer Inotera incurs, plus
‚ a fixed percentage of the notional total profit (or loss) the buyers realize when they sell the wafer.
The profit (or loss) per wafer is calculated by subtracting the following items from the average selling
price per wafer the buyers realize when they sell to their customers the functional chips on the wafer:
‚ the front-end cost per wafer Inotera incurred (including its cost of goods sold and research and
development expenses,
‚ the back-end cost per wafer the buyers incurred (including the costs of back-end assembly and testing
processes); and
‚ a fixed percentage of the average selling price per wafer we realize to cover overhead costs we incur,
which is in line with other companies in the industry.
This profit and loss sharing formula, including the fixed percentages, cannot be modified without the
consent of the three parties and the approval of such change by the Board of Directors of Inotera. The product
purchase and capacity reservation agreement remains in effect for as long as the joint venture agreement is in
effect. It can also be terminated upon material breach by the other party of this agreement or by both parties
concurrently with the termination for cause of the joint venture agreement or 2002 development agreement.
The agreement governing our joint venture with Nanya allows Infineon to transfer its shares in Inotera to
us. However, under Taiwanese law, Infineon's shares in Inotera are subject to a compulsory restriction on
transfer (lock-up) as a result of Inotera's IPO in May 2006. For that reason we had established a separate
trust agreement pursuant to which Infineon agreed to hold title to the Inotera shares in trust for us until they
could be transferred. Taiwanese law generally provides that Infineon may only transfer these shares to us
gradually over the four years following Inotera's IPO. In October 2006, the Taiwanese authorities granted an
exemption to Infineon permitting it to release the shares from the restriction. We expect that the share
transfer from Infineon to us will be completed by the end of the 2006 calendar year.
96
Global Reports LLC

If Infineon were to reduce its shareholding in our company to a minority level before the earlier of the
fifth anniversary of our carve-out from Infineon and the achievement of early mass production using 58nm
process technology at our manufacturing site in Dresden, the joint venture agreement with Nanya, as
amended, could require us to transfer these Inotera shares to Infineon. We agreed with Infineon that, in this
event, we would transfer the Inotera shares back to the trust. The trust agreement provides for Infineon to
again hold the Inotera shares in trust for us until they could be transferred back to us.
CSVC
Infineon established a joint venture, Infineon Technologies Suzhou Co., Ltd. (recently renamed
Qimonda Technologies (Suzhou) Co., Ltd., and referred to herein as Qimonda Suzhou) with China-
Singapore Suzhou Industrial Park Venture Co., Ltd. (CSVC) in Suzhou, China and constructed a back-end
facility for the assembly and testing of our products. The joint venture agreement was entered into in July 2003
and has an initial term of 50 years. It can generally be terminated upon material breach by the other party, a
party's bankruptcy or insolvency and various other events relating to a party's financial condition. The facility
officially opened in September 2004 and is scheduled to have capacity of up to one billion chips per year. The
facility will be ramped up in a number of stages as dictated by growth and trends in the global semiconductor
memory market. Infineon is required to purchase the entire output of the facility. In the 2005 financial year we
invested $29 million in the venture and are contractually required to invest an additional $167 million through
2008. Infineon contributed its ownership in Qimonda Suzhou to us in the carve-out effective May 1, 2006
(45% of the venture's share capital, representing 72.5% of the voting rights in the venture). We plan to
increase our investment in Qimonda Suzhou such that we will hold approximately 72.5% of its share capital by
the end of 2008, with CSVC owning the remaining 27.5%. We have the option to acquire the remaining
CSVC stake at the nominal investment value plus accrued and unpaid return. The joint venture intends to
arrange external financing for any further investment required to purchase additional equipment. There can be
no assurance that this external financing can be obtained at favorable terms or at all. Although our ownership
is currently 45% we consolidate Qimonda Suzhou as a subsidiary due to our management and voting right
control and eliminate income or losses as minority interests.
SMIC
In December 2002, we entered into a Product Purchase and Capacity Reservation Agreement, as most
recently amended in November 2006, with Semiconductor Manufacturing International Corporation
(SMIC), a Chinese foundry. As amended, this agreement provides us access to additional DRAM
manufacturing capacity. Under the terms of this agreement, SMIC agreed to manufacture, and we have
agreed to purchase, up to 20,000 wafers per month at SMIC's 200mm production facility in Shanghai at least
until 2007 and up to 15,000 wafers per month at SMIC's 300mm production facility in Beijing at least until
2009. The agreement remains in effect until December 31, 2009 and may be extended. We have the unilateral
right to terminate this agreement in the event that one of our semiconductor competitors acquires 50% of
SMIC's voting shares. In addition, either party may terminate the agreement upon material breach by the
other party of any obligation under this or the ancillary know-how transfer agreement or upon bankruptcy or
insolvency of the other party.
Under the terms of the agreements, Infineon was free to assign the agreement to us and has done so in
connection with the carve-out.
Winbond
In May 2002, we entered into a Product Purchase and Capacity Reservation Agreement with Winbond, a
Taiwanese foundry. This agreement provides us access to additional DRAM production capacity. Under the
terms of this agreement, Winbond agreed to manufacture, and we agreed to purchase, up to 19,000 wafer
starts per month from Winbond's 200mm production facility in Hsinchu, Taiwan until 2007.
In August 2004, we entered into an extended Product Purchase and Capacity Reservation Agreement, as
most recently amended in August 2006, with Winbond. This agreement gives us access to additional DRAM
97
Global Reports LLC

production capacity of up to 15,000 wafers per month in Winbond's 300mm facility in Taiwan until 2009.
Under the terms of this agreement we agreed to transfer our 80nm DRAM trench technology to Winbond's
300mm-wafer facility and Winbond agreed to manufacture DRAMs for computing applications using this
technology exclusively for us.
Under the terms of the Product Purchase and Capacity Reservation Agreements, Infineon was free to
assign these agreements to us and has done so in connection with the carve-out. Each agreement remains in
effect until the last shipment of, and payment for, products manufactured under the agreement unless it is
earlier terminated for breach.
Facilities and Manufacturing
Manufacturing Facilities
Including our joint ventures and foundry relationships, we operate manufacturing facilities in Europe,
North America and Asia. The following table shows information with respect to our current manufacturing
facilities and our facilities that are either under construction or in the ramp up phase and the portion of the
output of the facility to which we are entitled. Output is measured in wafer starts per month, or ""wspm''.
Current and Planned Manufacturing Facilities
Year productionline came or is
expected to come Output to whichon-stream Clean room m2 we are entitled
Front-end facilities (wafer fabrication):
Our Own Facilities
300mm facility, Dresden, Germany ÏÏÏÏÏÏÏÏÏ 2001 10,177 All
200mm facility, Richmond, Virginia ÏÏÏÏÏÏÏÏ 1998 16,771 All
300mm facility, Richmond, Virginia ÏÏÏÏÏÏÏÏ 2005 12,218 All
Joint Venture Facilities
300mm Inotera Memories facility, firstmodule, Taiwan(1)ÏÏÏÏÏÏÏÏÏÏÏÏÏÏÏÏÏÏÏÏÏÏ 2004 N/A Half
300mm Inotera Memories facility, secondmodule, Taiwan(1)ÏÏÏÏÏÏÏÏÏÏÏÏÏÏÏÏÏÏÏÏÏÏ Expected N/A Half
December 2006
Foundry Capacity
200mm Infineon facility, Dresden, Germany(2) 1996 Ì Variable corridor
200mm Winbond facility, Taiwan(3)ÏÏÏÏÏÏÏÏÏ 1999 Ì up to 19,000 wspm
300mm Winbond facility, Taiwan(3)ÏÏÏÏÏÏÏÏÏ 2006 Ì up to 15,000 wspm
200mm SMIC facility, Shanghai, China(3) ÏÏÏ 2003 Ì up to 20,000 wspm
300mm SMIC facility, Beijing, China(3) ÏÏÏÏÏ 2004 Ì up to 15,000 wspm
Back-end facilities
(packaging, assembly and testing):(4)
Dresden, Germany ÏÏÏÏÏÏÏÏÏÏÏÏÏÏÏÏÏÏÏÏÏÏÏ 1996 3,211 All
Malacca, Malaysia(5) ÏÏÏÏÏÏÏÏÏÏÏÏÏÏÏÏÏÏÏÏÏ 1973 12,163 All
Porto, Portugal ÏÏÏÏÏÏÏÏÏÏÏÏÏÏÏÏÏÏÏÏÏÏÏÏÏÏ 1997 17,697 All
Suzhou, China(6) ÏÏÏÏÏÏÏÏÏÏÏÏÏÏÏÏÏÏÏÏÏÏÏÏ 2004 14,124 All
(1) Owned by Inotera Memories, Inc., our joint venture with Nanya in which we and Nanya each own
minority shares. We hold 36.0% of the shares as of September 30, 2006. Our share in the production of the
joint venture is 50%.
98
Global Reports LLC

(2) During our 2006 financial year, approximately 63% of this facility's capacity was used for the production of
our products. As described under ""Related Party Transactions and Relationships Ì With Infineon'', we
are currently in negotiations with Infineon regarding our use or acquisition, after September 30, 2007, of
capacity at Infineon's 200mm manufacturing facility in Dresden. We have already agreed in principle with
Infineon that we will share equally any potential restructuring costs arising in connection with one module.
(3) We own no equity interest in this facility but have licensed technology to the third-party owner. We are
contractually entitled to a stated amount of the facility's DRAM output, which is manufactured using our
technology. See ""Ì Strategic Alliances and Agreements'' for more detail on these arrangements.
(4) In addition, we have agreements with EEMS Italia SpA and UTAC, which provide additional back-end
subcontracting services at their facilities in Italy and China and Singapore.(5) Includes about 2,000m2 cleanroom and 10,000m2 not cleanroom classified production area.(6) We constructed this facility pursuant to our joint venture agreement with CSVC. See "" Ì Strategic
Alliances and Agreements'' for more detail on these arrangements.
In the fourth quarter of our 2006 financial year we had access to a total front-end capacity of about
160,000 wafer starts in 300mm equivalents per month (equivalent to 360,000 wafer starts in 200mm
equivalents) through our own facilities, our joint venture and our foundry agreements. The capacities provided
by our joint venture Inotera constituted 20%, the capacities sourced from our non-affiliated foundry partners
SMIC and Winbond together constituted about 22% and the capacities sourced from Infineon's 200mm
facility at Dresden constituted about 9% of these capacities.
Trench Technology
Infineon developed, first in cooperation with IBM and Toshiba and we, currently in cooperation with
Nanya, continue to develop a proprietary trench architecture for the manufacturing of our DRAM products.
We believe that our proprietary ""trench'' architecture possesses physical characteristics that we can exploit
during the current and next several technology nodes to yield advantages over the various alternative ""stack''
architectures. In particular, the larger capacitors featured in trench architecture can be used to design DRAM
products with high performance or low power consumption characteristics.
Trench and stack architectures require different process steps during manufacturing. Trench uses a
special deep trench etch process to etch the holes for the capacitors into the bare silicon wafer surface, a
process which is undertaken early in the chip manufacturing process. On the other hand, stack architecture
uses capacitors that are built on top of the transistor layer by using advanced methods of depositing materials
on the surface of the wafer, which are completed at a later stage in the overall chip manufacturing process.
The trench and stack architectures also have consequences for the properties of the cells on the chips we
are currently manufacturing and intend to manufacture in the next several technology nodes. Using trench
technology, holes can be etched into silicon with very high aspect ratios (depth divided by the diameter of the
hole). As a result, the trench capacitor has a very high surface area and therefore a high capacitance, or ability
to store electrical charges. The higher the capacitance, the higher the number of electric charges a capacitor
can store. Stack capacitors on the other hand have a more limited capacitance. We have used the higher
capacitance of the chips we have been manufacturing using our trench architecture to reduce the voltage
required to power the cell array, which has given us a power consumption advantage.
Front-End Manufacturing
In the front-end manufacturing process chips are produced on silicon wafers. Our front-end fabs generally
operate 24 hours per day, 7 days per week, not including scheduled maintenance downtime (which generally
involves only individual pieces or clusters of equipment, rather than entire facilities) and unscheduled
stoppages. We do not generally adjust our manufacturing schedule in response to changes in demand.
Maximum utilization of our facilities allows us to spread our high fixed-costs over a larger number of chips. In
addition, given the complexity involved, our manufacturing processes are more stable if operated continuously.
99
Global Reports LLC

We had no significant unplanned production stoppages at our own front-end fabs during our 2006 financial
year.
Wafer Size Roadmap
In our efforts to continue to reduce our per-unit manufacturing costs, we continue to ramp up our volume
of production on 300mm wafers. In the 2006 financial year, we continued to increase our share of DRAM
manufacturing on 300mm wafers. Our 300mm Dresden facility has started commercial production using
75nm technology. In addition, our 300mm facility at Richmond started commercial production in September
2005 and completed the first phase of its ramp-up to a capacity of approximately 25,000 wafer starts in April
2006. The maximum capacity of this facility is expected to amount to 50,000 wafer starts per month and we
plan to ramp up production based on market developments; we have just begun the first phase of this ramp-up.
The ramp-up of the first manufacturing module of Inotera, our 300mm manufacturing joint venture with
Nanya, continued during the 2005 financial year, and reached a capacity of approximately 60,000 wafer starts
per month by August 2005. The capacity of this module reached a maximum of 62,000 wafer starts per month
during the 2006 financial year. The construction of Inotera's second manufacturing module was completed in
the 2006 financial year and the move in of equipment has started. Inotera plans to ramp up the second
manufacturing module and reach a maximum capacity of 120,000 wafer starts per month by the end of the
2007 calendar year. Qimonda and Nanya each are entitled to 50% of Inotera's capacity. Our foundry and
development partner Winbond has officially opened its new 300mm facility in Taiwan end of April 2006 and
began volume production in 2006. Given the cost efficiencies of production on larger wafer sizes, we believe
that increasing the share of our 300mm production will substantially reduce our overall per-unit production
cost for memory chips.
We believe that, among our principal competitors we are one of only two that have made substantial
progress in ramping up 300mm production. With 74% of the DRAM bits we produced in the third quarter of
our 2006 financial year taking place on 300mm wafers, we believe, based on iSuppli research, that we have the
highest percentage of bit-production on 300mm wafers of the four largest DRAM suppliers. Through our early
ramp-up, we have gained expertise in 300mm manufacturing techniques and technologies. We believe that, as
we equip our remaining owned facilities with 300mm wafer technology, we will be able to gain additional cost
advantages over competitors that have not yet switched a substantial portion of their manufacturing to 300mm
technology.
Feature Size Roadmap
The increase in memory density and resulting reduction of chip feature sizes through the introduction of
advanced process technologies is one of the key factors in reducing manufacturing costs. Innovations in
process technologies and continual reductions in per-bit manufacturing costs have been driven largely by the
needs of the standard DRAM market. The dynamics of this market have caused continuous evolution of
process technologies, with an ongoing race for smaller die sizes and higher memory densities at lower prices.
During the 2006 financial year, we increased the capacity share based on 90nm DRAM technology and started
commercial production based on our 75nm DRAM technology. At the end of our 2006 financial year,
approximately 38% of our capacities used to manufacture DRAMs had been converted to our 90nm
technology. In addition, we developed and released for production in October 2006 an 80nm technology, which
contains fewer technological upgrades than previous new technologies, but which we believe will improve the
number of dies we are able to produce per wafer. According to the industry organization International
Technology Roadmap for Semiconductors (ITRS), the next technology nodes are 65nm, 57nm, and 50nm.
With our joint venture partner Nanya, we have already started development of the 58nm technology node.
We intend to leverage the advantageous physical characteristics provided by our trench technology to
create a specific range of products at this technology node that consume low power. At the same time, we
intend to develop a low-cost platform for the 75nm and 58nm technologies and we believe the ability to offer
customers either a product with lower cost or with lower power consumption will increase our flexibility and
help us improve the breadth of our customer portfolio.
100
Global Reports LLC
Back-End Manufacturing
In back-end manufacturing, chips are packaged, assembled and tested. We believe that our back-end
facilities are equipped with state-of-the-art equipment and highly automated manufacturing technology,
enabling us to perform assembly and test on a cost-efficient basis. In an effort to further enhance our back-end
manufacturing efficiency and improve our cost position, we have increased our production volumes in lower-
cost countries such as Malaysia and China. Our back-end facilities provide us with the flexibility needed to
customize products according to individual customer specifications.
To ensure the commercial viability of our products, we have completed the conversion of all Qimonda
product packages to comply with the European Directive on the restriction of use of certain hazardous
substances in electronic and electrical equipment, or RoHS Directive. In particular, the RoHS Directive sets
forth lead-free standards for many types of electronic and electrical equipment. The obligation to comply with
the RoHS Directive ultimately lies with the equipment's producer. These customers therefore require us to
supply lead-free products, and we regularly provide certificates that document our products' compliance with
the RoHS Directive's lead-free standards.
To address the needs of electronic equipment manufacturers whose products require an exemption from
the application of the RoHS Directive, typically for technical or economic reasons, exemptions are available
which permit the use of lead-containing parts for specific applications. In addition, certain manufacturers have
been individually exempted from compliance with the RoHS Directive by the relevant governmental
authorities. We continue to supply a small number of lead-containing products for these exempted
applications and manufacturers. Additionally, we have a number of customers who require delivery of lead-
containing products to non-European markets, where the RoHS Directive does not apply.
""Fab Cluster'' System
In 1998, we introduced our fab cluster system, through which we link and coordinate activities at our own
front-end and back-end sites with those sites that are operated by our alliance and foundry partners and back-
end subcontractors. We operate these facilities as a cohesive unit which enables us to align these facilities
through synchronized technical, quality and reporting guidelines. This system allows us to:
‚ implement identical technology roadmaps at all sites where the equipment permits this;
‚ synchronize manufacturing processes and quality control at all sites; and
‚ quickly move ""best practices'' developed at one facility to all operations, which helps us to maximize
quality and accelerate ramp-up times. For example, we continuously monitor yield at each of the sites
in our fab cluster. Differences in yield lead to a comparison of practices and to an identification of each
site's comparative strengths. This results in our ability to set best practices for the entire fab cluster.
When one of our fab cluster's facilities is qualified by a customer to make a specific product, qualification
of the remaining fabs in the cluster is typically easy to achieve. By qualifying the entire cluster to a customer,
we can supply that customer with products from any of our fabs, which affords us significant operational
flexibility. Further, by maintaining access to facilities around the world, we are also able to attract highly
skilled workers on a more global basis, and maintain access to lower-cost workers as required. This system
permitted our joint venture Inotera to complete its fab ramp-up to 50,000 wafer starts per month in four
quarters which we believe is the benchmark in the industry.
Currently, our fab cluster includes our own front-end facilities in Dresden and Richmond, our back-end
facilities in Dresden, Malacca, Porto and Suzhou, as well as our front-end manufacturing joint venture Inotera
and our front-end foundry partners Winbond, SMIC and Infineon (Dresden 200mm) and the back-end
facilities of EEMS Italia SpA and UTAC our back-end foundry partners.
Mask Manufacturing
High-end photomask technology is a prerequisite for achieving small feature size. Since May 2002, the
Advanced Mask Technology Center, or AMTC, Infineon's joint venture with Advanced Micro Devices and
101
Global Reports LLC

Toppan Photomasks in Dresden, Germany, has developed advanced photomasks. Since 2004 the joint venture
has developed and produced high-end photomasks at AMTC's pilot production facility. We purchase some of
our mask supply from that pilot production facility. We also purchase masks from Toppan Photomasks under
a cooperative arrangement with Infineon, and expect to continue to do so for as long as Infineon is our
majority shareholder.
ISO Qualification
We have held ISO 9001 certification since 1986 and ISO/TS 16949 certification (which includes ISO
9001) since 2004. The current certification is valid for the whole organization until June 24, 2007. Qimonda is
currently undergoing an audit which we expect will be completed by December 31, 2006 for re-certification
which, if granted, will be valid until June 2010. Annual surveillance audits are performed by our certifier and
registrar Det Norske Veritas Certification, Inc.
The ISO 9001 quality management standards are developed by the International Organization for
Standardization, the world's leading developer of international standards to specify the requirements for
state-of-the-art products, processes and managerial practices. ISO 9001 quality management certification is
an indispensable condition to enjoying sound relationships with our customers.
Intellectual Property
Our intellectual property rights include patents, copyrights, trade secrets, trademarks, utility models,
designs and maskwork rights. The subjects of our patents primarily relate to IC designs and process
technologies. We believe that our intellectual property is a valuable asset which protects our investment in
technology and supports our licensing efforts with third parties.
Allocation of Existing Patents
In connection with our carve-out, the Infineon Group transferred to us ownership of all those patents and
patent applications (which we refer to simply as patents in this section) attributable to the Memory Products
business. The ownership of all other patents remained with the Infineon Group. Qimonda's patent portfolio at
the end of September 2006 included more than 20,000 patents and patent applications (representing more
than 5,700 patent families) compared to more than 23,000 patents and patent applications remaining on the
side of Infineon.
Pursuant to the contribution agreement, the Infineon Group may continue to use any patents transferred
to us, for their lifetimes, outside of the stand-alone memory field and of embedded memories. The
contribution agreement likewise permits us to use those patents remaining with the Infineon Group in the field
of stand-alone memory, under terms corresponding to those we extended to Infineon under this agreement.
The contribution agreement generally defines stand-alone memory to include ICs and modules the primary
function of which is data storage, as well as module components and those embedded memories made using
technologies developed by or for Qimonda.
Cross-License Under Future Patents
We will own any patents that have been or will be applied for in our name after the carve-out.
As part of the contribution agreement, we agreed to the following terms with respect to patents applied
for by either party and its subsidiaries within five years of the effective date of the carve-out or as long as
Infineon owns a majority of the shares of our company, whichever period is longer.
The Infineon Group will receive royalty-free licenses, for the lifetimes of the patents or until a change of
control of Infineon occurs, to use our patents outside the stand-alone memory field. Even if a change of control
occurred, the licenses would continue if we received corresponding licenses for the memory products field
from the third party then controlling Infineon.
102
Global Reports LLC
The contribution agreement likewise permits us to use those patents applied for by Infineon in the field of
stand-alone memory, under terms equivalent to those we extended to Infineon under this agreement including
a change of control mechanism equivalent to the one described above.
Sublicense Rights
In connection with a spin-off or the creation of a joint venture, Infineon has the right to sub-license any
patents transferred to us as part of the carve-out, as well as any Qimonda patents subject to the cross-license
arrangements between Infineon and us, as described above, as long as:
‚ the patents are used outside the stand-alone memory field;
‚ we receive a respective grant-back license from the spin-off or joint venture and its majority
shareholder in the field of stand-alone memory; and
‚ such majority shareholder has no pending patent law suit with us.
In connection with a spin-off or the creation of a joint venture the contribution agreement likewise
permits us to sub-license those patents remaining with Infineon, as well as any of Infineon's patents subject to
the cross-license arrangements between Infineon and us, in the field of stand-alone memory, under terms
equivalent to those we extended to Infineon under this agreement.
As long as we are a Majority-Owned Subsidiary of Infineon
Infineon is permitted to license any patents for which we apply while Infineon is our majority shareholder
within cross- license agreements it had already concluded with third parties as of the carve-out date and which
require the licensing of patents of subsidiaries.
Furthermore, as long as Infineon holds a majority share in our company, Infineon is permitted to license
any patents created by us within cross-license agreements it concludes with third parties after the carve-out,
subject to our consent, which we may not unreasonably withhold.
Patent Licensing Negotiations with Third Parties
Under the contribution agreement, Infineon is entitled to raise claims against third parties with respect to
a small number of transferred patents that are the subject of licensing negotiations between Infineon and these
third parties. We agreed to take the steps necessary to enable Infineon to make such claims. For as long as
these negotiations have not been completed and we remain a majority-owned subsidiary of Infineon, we may
not license the relevant patents to such third parties or pursue claims against such parties without Infineon's
consent.
Cross-License Agreements with Third Parties
It is common in the semiconductor industry for companies, including competitors, to enter into patent
cross-license agreements with each other. In the event of an imbalance in the size of the respective portfolios
of two companies or other factors, such as revenue, such an agreement may also provide for a cash payment
from one party to the other. Infineon is a party to a number of patent cross-license agreements from which we
benefit as a majority-owned subsidiary of Infineon. Although we believe that our own substantial patent
portfolio will position us to conclude patent cross-license agreements on favorable terms and conditions with
other semiconductor companies, we may find that our bargaining position is substantially less than that of the
Infineon Group as a whole. In addition, if Infineon ceases to own at least a majority of our shares, we will lose
the benefit of coverage under certain of Infineon's cross-license agreements with other parties while they may
continue to be licensed under the patents Infineon has transferred to us. We are currently in patent cross-
license negotiations with several major semiconductor industry participants and expect to enter into additional
patent cross-license agreements in the future.
If Infineon ceases to own the majority of our shares, our rights to use patents under some of these cross-
licensing agreements will terminate. See ""Risk Factors Ì Risks related to our operations Ì We may not be
103
Global Reports LLC

able to protect our proprietary intellectual property or obtain rights to intellectual property of third parties
needed to operate our business'' and ""Risk Factors Ì Risks related to our carve-out as a stand-alone company
and our continuing relationship with Infineon Ì We may lose rights to intellectual property arrangements if
Infineon's ownership in our company drops below certain levels.''
Protecting Our Intellectual Property
Our success depends in part on our ability to obtain patents, licenses and other intellectual property rights
covering our products and their design and manufacturing processes. To that end, we have obtained many
patents and patent licenses and intend to continue to seek patents on our developments. The process of seeking
patent protection can be lengthy and expensive. Patents might not be issued from currently pending or future
applications or if patents are issued, they may not be of sufficient scope or strength to provide us with
meaningful protection or a commercial advantage. In addition, effective copyright and trade secret protection
may be limited in some countries or even unavailable.
Many of our competitors also seek to protect their technology by obtaining patents and asserting other
forms of intellectual property rights. Third-party technology that is protected by patents and other intellectual
property rights may be unavailable to us or available only on unfavorable terms and conditions. Third parties
may also claim that our technology infringes their patents or other intellectual property rights, and they may
bring suit against us to protect their intellectual property rights. From time to time, it may also be necessary
for us to initiate legal action to enforce our own intellectual property rights. We believe that, while as a stand-
alone company we may enjoy more flexibility to vigorously defend our intellectual property, we also will not be
able to make use in litigation of those patents that remained with the Infineon Group. Furthermore, litigation
can be very expensive and can divert financial resources and management attention from other important uses.
It is difficult or impossible to predict the outcome of most litigation matters, and an adverse outcome can
result in significant financial costs that can have a material adverse effect on the losing party. We are currently
engaged in several material disputes over intellectual property rights. Several disputes were settled in 2006, in
particular those relating to Mosaid and Tessera. For a description of these matters, see "" Ì Legal Matters''.
While it is possible that Infineon could compete with us on the basis of those patents that remained with
Infineon or on the basis of independently developed technology, we do not view this possibility as a material
threat to our business. Infineon transferred all patents to us that were attributable to the Memory Products
business and may in the future use those patents only outside of the stand-alone memory field. In addition,
since Infineon transferred to us all of the assets and development resources attributable to the Memory
Products business, it is unlikely, without very substantial investments, to re-enter memory technology
independently in order to compete with us.
Amendment and Partial Termination of Our License Agreement with Saifun
In April 2001, we established the Infineon Technologies Flash joint venture with Saifun in which we held
a 51 percent ownership interest. In the 2003 financial year, we increased our ownership interest to 70 percent
by contributing additional capital and converting existing shareholder loans to equity. The joint venture
operated through two companies, Infineon Technologies Flash GmbH & Co. KG, located in Dresden,
Germany, and Infineon Technologies Flash Ltd., located in Netanya, Israel. During December 2004, we
modified the cooperation agreement with Saifun. As a consequence, we consummated the acquisition of
Saifun's remaining 30 percent share in the joint venture in January 2005 and were granted a license for the use
of Saifun NROM» technologies, in exchange for $95 million to be paid in quarterly installments over 10 years
and additional purchase consideration primarily in the form of net liabilities assumed aggregating 47 million.
We retained the option to terminate the entire license or parts thereof at any time without penalty. During the
quarter ended June 30, 2005, we exercised our termination option and cancelled the portion of the license
encompassing NROM» Code Flash products. As a result of the partial termination, the license asset and
related liability were reduced to 428 million and 429 million, respectively, as of June 30, 2005. In light of the
weak market conditions for commodity NAND Flash memories in the fourth quarter of our 2006 financial
year, we decided to ramp down our Flash production and cease the current development of NAND-
compatible flash memory products based on Saifun's proprietary NROM» technology. We and Saifun
104
Global Reports LLC

amended the license agreement to terminate quarterly installment payments as of December 31, 2006. As a
result, we reduced our payables, goodwill and other intangible assets, and recognized an impairment charge of
49 million related to license and fixed assets which were not considered to be recoverable as of September 30,
2006.
Equipment
We purchase most of our front-end equipment from Applied Materials, ASM Lithography, Canon and
Tokyo Electron. In periods of high market demand, the lead times from order to delivery of such specialized
equipment can be as long as six to twelve months. We seek to manage this process through early reservation of
appropriate delivery slots and constant communication with our suppliers, as well as by pursuing a multiple-
vendor strategy to avoid undue dependence on a single supplier. Because we manufacture DRAMs using
trench cell technology, we require special equipment for etching the ultra deep trenches into the silicon. These
so called ""trench etchers'' are based on common etch tools that we have modified together with our equipment
suppliers to suit our special needs. We currently source our trench etch equipment from two etch equipment
suppliers.
We purchase testing equipment for front-end and back-end principally from Advantest. In addition to
specialized testing equipment, we maintain a variety of other types of equipment that are used in the testing
process.
Raw Materials
The most important raw materials in our front-end process are polished silicon wafers, chemicals,
precious and other metals, and gases. The principal suppliers for our wafers are Siltronic, SEH, MEMC, and
SUMCO. The principal raw materials used in back-end packaging, assembly and test are leadframe or
laminate substrates, gold wire and molding compound. Purchased materials and supplies in our 2005 financial
year were approximately 33% of our net sales and in our 2006 financial year were approximately 38% of our
net sales.
We generally purchase raw materials based on the non-binding forecasts provided to us by our customers.
We are not dependent on any one supplier for a substantial portion of our raw material requirements for
packaging, assembly and test. Our raw material procurement policy is to select vendors that have demon-
strated quality control and reliability with respect to delivery time. In addition, we maintain multiple sources
for each raw material so that a quality or delivery problem with any one vendor will not adversely affect our
operations. We generally enter into one-year supply agreements with raw material suppliers that offer
competitive prices. Although shortages have occurred from time to time and lead times have been extended on
occasion in the industry, we have not experienced any significant production interruption as a result of
difficulty in obtaining raw materials to date.
105
Global Reports LLC

Employees
The numbers, functions and geographic locations of our employees at the dates indicated were as follows:
As of September 30,
2004 % 2005 % 2006 %
Function:
Production ÏÏÏÏÏÏÏÏÏÏÏÏÏÏÏÏÏÏÏÏÏÏÏÏÏÏÏÏÏÏ 9,259 84% 7,686 80% 9,113 77%
Research & development ÏÏÏÏÏÏÏÏÏÏÏÏÏÏÏÏÏÏ 1,420 13% 1,440 15% 1,756 15%
Sales & marketingÏÏÏÏÏÏÏÏÏÏÏÏÏÏÏÏÏÏÏÏÏÏÏÏ 166 1% 264 3% 320 3%
Administrative ÏÏÏÏÏÏÏÏÏÏÏÏÏÏÏÏÏÏÏÏÏÏÏÏÏÏÏ 213 2% 216 2% 613 5%
Total ÏÏÏÏÏÏÏÏÏÏÏÏÏÏÏÏÏÏÏÏÏÏÏÏÏÏÏÏÏÏÏÏÏÏÏ 11,058 100% 9,606 100% 11,802 100%
Region:
GermanyÏÏÏÏÏÏÏÏÏÏÏÏÏÏÏÏÏÏÏÏÏÏÏÏÏÏÏÏÏÏÏÏ 6,284 57% 4,058 42% 4,684 40%
Other EuropeÏÏÏÏÏÏÏÏÏÏÏÏÏÏÏÏÏÏÏÏÏÏÏÏÏÏÏÏ 1,335 12% 1,405 15% 1,666 14%
North America ÏÏÏÏÏÏÏÏÏÏÏÏÏÏÏÏÏÏÏÏÏÏÏÏÏÏ 2,167 20% 2,494 26% 2,763 23%
Asia/Pacific (excl. Japan)** ÏÏÏÏÏÏÏÏÏÏÏÏÏÏÏ 1,233 11% 1,622 17% 2,651 23%
Japan**ÏÏÏÏÏÏÏÏÏÏÏÏÏÏÏÏÏÏÏÏÏÏÏÏÏÏÏÏÏÏÏÏÏ 10 * 27 * 38 *
OtherÏÏÏÏÏÏÏÏÏÏÏÏÏÏÏÏÏÏÏÏÏÏÏÏÏÏÏÏÏÏÏÏÏÏÏ 29 * Ì * Ì Ì%
Total ÏÏÏÏÏÏÏÏÏÏÏÏÏÏÏÏÏÏÏÏÏÏÏÏÏÏÏÏÏÏÏÏÏÏÏ 11,058 100% 9,606 100% 11,802 100%
* Less than 1% of total numbers.
** On the date indicated, our operations in Japan and Korea legally belonged to Infineon.
In the 2006 financial year, our headcount increased principally due to enlarged capacities especially in
Asia Pacific. The numbers presented in this table as of September 30, 2004 and 2005 represent the headcount
of the memory products business and exclude any allocation of corporate functions performed by Infineon.
The numbers presented as of September 30, 2006 include the employees now performing corporate functions
for us.
Our employees in Germany are represented by local works councils (lokale Betriebsr ate) and a Qimonda
group works council (Konzernbetriebsrat). Works councils are employee-elected bodies established at each
location in Germany and also at a company/group level (on the basis of German labor laws). Close
cooperation between management and works councils can be a strong source of stability, minimizing employee
unrest and strikes, and ensuring management the ability to execute strategy changes and/or restructuring in a
cooperative manner. Works councils have numerous rights to receive notice and participate in policy making
in matters regarding personnel, social and economic matters. Under the German Works Constitution Act
(Betriebsverfassungsgesetz), the works councils must be notified in advance of any proposed employee
termination, they must confirm hirings and relocations and similar matters, and they have a right to participate
in policy making regarding social matters such as work schedules and rules of conduct. Management considers
its relations with the works councils to be good. A separate works council exists at our subsidiary in Dresden,
Qimonda Dresden GmbH & Co. OHG. The members of the senior management of Qimonda will be
represented by a senior management committee (Sprecherausschuss).
Approximately 700 Infineon employees in Germany who were transferred to our company are covered by
the terms of collective bargaining agreements between unions and the Employers' Association (Arbei-tgeberverband) of which Infineon is a member. The agreements cover both working conditions such as hours
and holidays as well as wages (Gehaltstarifvertrag). The working conditions and similar types of agreements
applicable as of April 30, 2006 to these 700 employees will remain applicable through June 2008. The wage
agreements are typically re-negotiated each year and were completed for this year in April 2006. Sometimes
short ""warning'' work stoppages can take place during these negotiations. Although we will not be a member
106
Global Reports LLC
of the Employers' Association, and therefore not obligated by future collective bargaining agreements, the
approximately 700 employees who transferred from Infineon to Qimonda will receive wages equal to those
agreed between the unions and Employers' Association during their yearly re-negotiations through June 2008.
During the last three years we have not experienced any major labor disputes resulting in significant work
stoppages.
Backlog
The prices for portions of our standard DRAM products are generally set every two weeks, based on
market demand. Customers enter into purchase orders for supply during two-week periods. While DRAMs for
infrastructure applications and graphics, mobile and consumer products are sometimes priced like standard
DRAM, they are often sold under longer-term contracts with fixed prices. We do not consider our backlog at
any time to be a reliable indicator of future sales and do not rely on backlog to manage our business or to
evaluate performance.
Legal Matters
Infineon is the subject of a number of governmental investigations and civil lawsuits that relate to the
operations of its Memory Products business prior to our carve-out. The most significant of these matters are
described in this section. In addition, under the contribution agreement, we are required to indemnify
Infineon, in whole or in part as specified below, for any liability Infineon incurs in connection with the matters
described below.
The contribution agreement is based on the principle that all potential liabilities and risks in connection
with legal matters existing as of the carve-out date are generally to be borne by the business unit which caused
the risk or liability or where the risk or liability arose. Except to the limited extent described below for the
securities class action litigation and the settled Tessera litigation (for which we have different arrangements),
we have agreed to indemnify Infineon for all liabilities arising in connection with all legal matters specifically
described below, including court costs and legal fees. Infineon will not settle or otherwise agree to any of these
liabilities without our prior consent.
Liabilities and risks relating to the securities class action litigation, including court costs, will be equally
shared by Infineon and us, but only with respect to the amount by which the total amount payable exceeds the
amount of the corresponding accrual that Infineon transferred to us pursuant to the contribution agreement.
Infineon has agreed not to settle this lawsuit without our prior consent. Any expenses incurred in connection
with the assertion of claims against the provider of directors' and officers' (D & O) insurance covering
Infineon's two current or former officers named as defendants in the suit will also be equally shared. The
D & O insurance provider has so far refused coverage. We have agreed to indemnify Infineon for 80% of the
court costs and legal fees relating to the recently-settled litigation with Tessera.
In accordance with the general principle that all potential risks or liabilities are to be borne by the entity
which caused the risk or liability or where the risk or liability arose, the indemnification provisions of the
contribution agreement include the following specific allocation keys with respect to claims or lawsuits arising
after the carve-out date:
‚ liabilities arising in connection with intellectual property infringement claims relating to memory
products were fully allocated to us; and
‚ liabilities arising in connection with actual or alleged antitrust violations with respect to DRAM
products were fully allocated to us.
Subsequent developments in any pending matter, as well as additional claims that may arise from time to
time, including additional claims similar to those described below, could become significant to Infineon or us.
We cannot predict with certainty the outcome of any proceedings in which we are or may become
involved. An adverse decision in a lawsuit seeking damages from Infineon or us, or Infineon's or our decision
to settle certain cases, could result in monetary payments to the plaintiff and other costs and expenses.
107
Global Reports LLC

If Infineon or we lose a case in which we seek to enforce our patent rights or in which we have been accused of
infringing another company's patent rights, we will sustain a loss of future revenue if we no longer can sell the
product covered by the patent or command prices for the affected products that reflect the exclusivity
conferred by the patent. While payments and other costs and expenses we might have to bear as a result of
these actions are covered by insurance in some circumstances, other payments may not be covered by our
insurance policies in full or at all. Accordingly, each of the legal proceedings described in the following
discussion could be significant to us, and any payments, costs and expenses we may incur in addition to any
that have already been incurred or accrued could have a material adverse effect on our results of operations,
financial position or cash flows.
Antitrust Matters
U.S. Department of Justice Investigation
In September 2004, Infineon entered into a plea agreement with the Antitrust Division of the
Department of Justice (DOJ) in connection with its ongoing investigation into alleged antitrust violations in
the DRAM industry. Pursuant to this plea agreement, Infineon agreed to plead guilty to a single count of
conspiring with other unspecified DRAM manufacturers to fix the prices of DRAM products between July 1,
1999 and June 15, 2002, and to pay a fine of $160 million. The fine plus accrued interest is to be paid in equal
annual installments through 2009. On October 25, 2004, the plea agreement was accepted by the U.S. District
Court for the Northern District of California. Therefore, the matter has been fully resolved as between
Infineon and the DOJ, subject to Infineon's obligation to cooperate with the DOJ in its ongoing investigation
of other participants in the DRAM industry. The price fixing charges related to DRAM sales to six Original
Equipment Manufacturer (OEM) customers that manufacture computers and servers. Infineon has entered
into settlement agreements with five of these OEM customers and is considering the possibility of a settlement
with the remaining OEM customer, which purchased only a very small volume of DRAM products from
Infineon.
U.S. Civil Litigation
Subsequent to the commencement of the DOJ investigation, a number of putative class action lawsuits
were filed against Infineon, its principal U.S. affiliate and other DRAM suppliers.
Direct Purchaser Litigation
Sixteen cases were filed between June 21, 2002 and September 19, 2002 in the following federal district
courts: one in the Southern District of New York, five in the District of Idaho, and ten in the Northern
District of California. Each of the federal district court cases purports to be on behalf of a class of individuals
and entities who purchased DRAM directly from the various DRAM suppliers during a specified time period,
which was originally alleged to have commenced on or after October 1, 2001 (the Direct U.S. Purchaser
Class). The complaints allege price-fixing in violation of the Sherman Act and seek treble damages in
unspecified amounts, costs, attorneys' fees, and an injunction against the allegedly unlawful conduct.
In September 2002, the Judicial Panel on Multi-District Litigation ordered that the foregoing federal
cases be transferred to the U.S. District Court for the Northern District of California for coordinated or
consolidated pretrial proceedings as part of a Multi District Litigation (MDL). In October 2003 and June
2005, the plaintiffs filed amended complaints, which together allege that the unlawful conduct commenced on
approximately April 1, 1999 and continued through at least June 30, 2002.
In September 2005, Infineon and its principal U.S. subsidiary entered into a definitive settlement
agreement with counsel to the Direct U.S. Purchaser Class (subject to approval by the U.S. District Court for
the Northern District of California and to an opportunity for individual class members to opt out of the
settlement) and has secured individual settlements with eight direct customers in addition to those OEMs
identified by the DOJ. The court has scheduled the trial to begin on April 23, 2007. Under the terms of the
settlement agreement Infineon agreed to pay approximately $21 million. We recorded a corresponding charge
to other operating expense in our financial year ended September 30, 2005. In addition to this settlement
108
Global Reports LLC
payment, Infineon agreed to pay an additional amount if it is proven that sales of DRAM products to the
settlement class after opt-outs during the settlement period exceeded $208.1 million. We would also be
responsible for this payment. The additional amount payable is calculated by multiplying the amount by which
these sales exceed $208.1 million by 10.53%. We do not currently expect to pay any additional amount to the
class. The settlement was approved on November 1, 2006. The hearing on plaintiffs' motion for class
certification of the Direct U.S. Purchaser Class took place on May 17, 2006. On June 5, 2006, the court issued
an order certifying a direct purchaser class. On October 3, 2006, a number of individuals and entities gave
notice that they were opting out of the Direct U.S. Purchaser Class and settlements. However, apart from
Unisys Corporation and Honeywell International, Inc. (as described immediately below), none of the other
opt-outs has filed suit against Infineon.
On April 28, 2006, Unisys Corporation filed a complaint against Infineon and its principal
U.S. subsidiary, among other DRAM suppliers, alleging state and federal claims for price fixing and seeking
recovery as both a direct and indirect purchaser of DRAM. Unisys subsequently filed a consolidated
complaint together with Sun Microsystems, Inc. against the Infineon entities and other defendants, naming
Infineon and its U.S. subsidiary as defendants only as to the claims by Unisys, and not the claims by Sun, with
which Infineon reached a settlement agreement in the 2005 financial year. On May 5, 2006, Honeywell
International, Inc. filed a complaint against Infineon and its U.S. subsidiary, among other DRAM suppliers,
alleging a claim for price fixing under federal law, and seeking recovery as a direct purchaser of DRAM.
Infineon and its U.S. subsidiaries have agreed to accept service of the Honeywell complaint. Infineon's
U.S. subsidiary was served with the Unisys complaint on September 8, 2006. Infineon agreed to waive service
in exchange for an extended response date of December 5, 2006 for both Infineon entities. Both of these
complaints were filed in the Northern District of California, and have been related to the MDL described
above. Both Unisys and Honeywell opted out of the Direct U.S. Purchaser Class and settlement, so their
claims are not barred by Infineon's settlement with the Direct U.S. Purchaser Class.
Indirect Purchaser Litigation
Sixty-four additional cases (including a lawsuit discussed separately under ""Ì Foreign Purchaser
Litigation'' below) were filed between August 2, 2002 and October 12, 2005 in numerous federal and state
courts throughout the United States. Each of these state and federal cases (except the lawsuit discussed under
""Ì Foreign Purchaser Litigation'') purports to be on behalf of a class of individuals and entities that indirectly
purchased DRAM in the United States during specified time periods commencing in or after 1999. The
complaints variously allege violations of the Sherman Act, California's Cartwright Act, various other state
laws, unfair competition law and unjust enrichment and seek treble damages in generally unspecified amounts,
restitution, costs, attorneys' fees and injunctions against the allegedly unlawful conduct. The California state
cases were ordered transferred for coordinated and consolidated pre-trial proceedings to the San Francisco
County Superior Court.
Subsequently, twenty-three of the state and federal court cases were ordered transferred to the
U.S. District Court for the Northern District of California for coordinated and consolidated pretrial
proceedings as part of the MDL described above under ""Direct Purchaser Litigation''. After this transfer, the
plaintiffs dismissed two of the transferred state court cases. Two additional transferred state court cases were
subsequently remanded back to their relevant state courts. Nineteen of the 23 transferred cases are currently
pending in the MDL litigation. The plaintiffs in the indirect purchaser cases outside California agreed to stay
proceedings in those cases in favor of proceedings on the indirect purchaser cases pending as part of the MDL
proceedings. The defendants have filed two motions for judgment on the pleadings directed at several of the
claims; these motions are pending. After these have been decided, the indirect purchaser plaintiffs in the case
that is part of the MDL proceedings will have the opportunity to file any motion for class certification.
Infineon intends to defend itself vigorously in the indirect purchaser cases.
Foreign Purchaser Litigation
A lawsuit filed on May 5, 2005 in the Eastern District of Pennsylvania, purporting to be on behalf of a
class of foreign individuals and entities who directly purchased DRAM outside of the United States from July
109
Global Reports LLC

1999 through at least June 2002, was dismissed with prejudice and without leave to amend on March 1, 2006.
Plaintiffs in that case have filed a notice of appeal. On July 31, 2006, Plaintiffs filed their opening brief on
appeal, and defendants filed their joint opening brief on September 20, 2006. No hearing date has yet been
scheduled for the appeal. Infineon intends to defend itself vigorously if the court of appeals remands this
lawsuit.
State Investigations
On July 13, 2006, the New York state attorney general filed an action in the U.S. District Court for the
Southern District of New York against Infineon, its principal U.S. subsidiary and several other DRAM
manufacturers on behalf of New York governmental entities and New York consumers who purchased
products containing DRAM beginning in 1998. The plaintiffs allege violations of state and federal antitrust
laws arising out of the same allegations of DRAM price-fixing and artificial price inflation practices discussed
above, and seek recovery of actual and treble damages in unspecified amounts, penalties, costs (including
attorneys' fees) and injunctive and other equitable relief. On October 23, 2006, the New York case was made
part of the MDL proceeding. On July 14, 2006, the attorneys general of California, Alaska, Arizona, Arkansas,
Colorado, Delaware, Florida, Hawaii, Idaho, Illinois, Iowa, Louisiana, Maryland, Massachusetts, Michigan,
Minnesota, Mississippi, Nebraska, Nevada, New Mexico, North Dakota, Ohio, Oklahoma, Oregon, Penn-
sylvania, South Carolina, Tennessee, Texas, Utah, Vermont, Virginia, Washington, West Virginia and
Wisconsin filed a lawsuit in the U.S. District Court for the Northern District of California against Infineon, its
principal U.S. subsidiary and several other DRAM manufacturers on behalf of governmental entities,
consumers and businesses in each of those states who purchased products containing DRAM beginning in
1998. On September 8, 2006 the complaint was amended to add claims by the attorneys general of Kentucky,
Maine, New Hampshire, North Carolina, the Northern Mariana Islands and Rhode Island. This action is
based on state and federal law claims relating to the same alleged anticompetitive practices in the sale of
DRAM and plaintiffs seek recovery of actual and treble damages in unspecified amounts, penalties, costs
(including attorneys' fees) and injunctive and other relief. Infineon and its U.S. subsidiary agreed to accept
service of both of these complaints. On October 10, Infineon joined the other defendants in filing motions to
dismiss several of the claims alleged in these two actions. Infineon and its principal U.S. subsidiary intend to
vigorously defend both of these actions.
European Commission Investigation
In April 2003, Infineon received a request for information from the European Commission to enable the
Commission to assess the compatibility with the Commission's rules on competition of certain practices of
which the Commission has become aware in the European market for DRAM ICs. Infineon reassessed the
matter after its plea agreement with the DOJ and recorded an accrual during the 2004 financial year for an
amount representing the probable minimum fine to be imposed as a result of the Commission's investigation.
Any fine actually imposed by the Commission may be significantly higher than the reserve established,
although Infineon cannot more accurately estimate the amount of the actual fine. Infineon is fully cooperating
with the Commission in its investigation.
Canadian Competition Bureau Investigation
In May 2004, the Canadian Competition Bureau advised Infineon's principal U.S. subsidiary that it, its
affiliates and present and past directors, officers and employees are among the targets of a formal inquiry into
an alleged conspiracy to prevent or lessen competition unduly in the production, manufacture, sale or supply of
DRAM, contrary to the Canadian Competition Act. No compulsory process (such as subpoenas) has been
commenced. Infineon is cooperating with the Competition Bureau in its inquiry.
Canadian Civil Litigation
Between December 2004 and February 2005, two putative class proceedings were filed in the Canadian
province of Quebec and one was filed in each of Ontario and British Columbia against Infineon, its principal
U.S. subsidiary and other DRAM manufacturers on behalf of all direct and indirect purchasers resident in
110
Global Reports LLC
Canada who purchased DRAM or products containing DRAM between July 1999 and June 2002, seeking
damages, investigation and administration costs, as well as interest and legal costs. Plaintiffs primarily allege
conspiracy to unduly restrain competition and to illegally fix the price of DRAM. In the British Columbia
action, the certification motion has been scheduled for May 2007. In one Quebec class action, preliminary
motions are to be scheduled early in 2007; the other Quebec action has been stayed pending developments in
the one that is going forward. Infineon intends to defend itself vigorously against these proceedings.
Tessera
In March 2005, Tessera, Inc. (""Tessera'') filed a lawsuit against Infineon and one additional DRAM
manufacturer in the U.S. District Court for the Eastern District of Texas, alleging that some of Infineon's
products were infringing five Tessera patents. In April 2005, Tessera amended its complaint to allege that
Infineon and its co-defendant violated U.S. antitrust law, Texas unfair competition law, and Texas business
tort law by conspiring to harm the sale of Rambus's DRAM (""RDRAM'') chips, thereby injuring Tessera's
ability to license chip packaging technology for RDRAM chips. On May 10, 2006, Tessera amended its
complaint and added us as an additional named defendant. On August 1, 2006, we and Infineon entered into
settlement agreements with Tessera related to Tessera's antitrust- and patent-related claims. Pursuant to the
settlement, we entered into a six year license agreement with Tessera that provides us a world-wide, non-
exclusive, non-transferable and non-sublicensable license to use a portfolio of Tessera patents relating to
packaging for integrated circuits in our production. See ""Ì Legal Matters Ì Patent Litigation Ì Tessera''
for a more detailed description of this settlement.
Securities Class Actions
Between September 30, 2004 and November 4, 2004, seven securities class action complaints were filed
against Infineon and three of its then-current and former officers (of which one officer was subsequently
dropped, and one of which is currently the chairman of our Supervisory Board) in the U.S. District Courts for
the Northern District of California and the Southern District of New York. The plaintiffs voluntarily
dismissed the New York cases, and on June 30, 2005 filed a consolidated amended complaint in California on
behalf of a putative class of purchasers of Infineon's publicly-traded securities, who purchased them during
the period from March 13, 2000 to July 19, 2004, effectively combining all lawsuits. The consolidated
amended complaint added Infineon's principal U.S. subsidiary and four then-current or former employees of
Infineon and its affiliate as defendants. It alleges violations of the U.S. securities laws and asserts that the
defendants made materially false and misleading public statements about Infineon's historical and projected
financial results and competitive position because they did not disclose Infineon's alleged participation in
DRAM price-fixing activities and that, by fixing the price of DRAM, defendants manipulated the price of
Infineon's securities, thereby injuring its shareholders. The plaintiffs seek unspecified compensatory damages,
interest, costs and attorneys' fees. Infineon, its affiliate and the two Infineon officers filed motions to dismiss
the consolidated amended complaint. On May 22, 2006 the court denied part of the motions to dismiss this
action, but did not deny other parts of the motions. On June 21, 2006, the court agreed to permit Infineon to
move for reconsideration of the May 22, 2006 order. On September 11, 2006, the court granted Infineon's
motion for partial reconsideration and dismissed Infineon, its principal U.S. subsidiary and its current and
former officers from the complaint. On October 11, 2006 the plaintiffs filed an amended complaint.
Infineon believes these claims are without merit and is defending itself vigorously in this action. Because
this action is in its early stages, we are unable to provide an estimate of the likelihood of an unfavorable
outcome to us or of the amount or range of potential loss arising from the action. If the outcome of this action
is unfavorable or if we incur substantial legal fees in defending this action, it may have a material adverse
effect on our financial condition and results of operations. Infineon's directors' and officers' insurance carrier
has denied coverage with respect to Infineon and the two officers that were defendants in the class action.
Infineon filed suit against the carrier in December 2005. This appeal was dismissed on November 13, 2006.
Infineon intends to file an appeal against this dismissal.
111
Global Reports LLC
Patent Litigation
MOSAID
In late 2002, MOSAID Technologies Inc. (""MOSAID'') alleged that Infineon was violating several
DRAM-related U.S. patents of MOSAID. In December 2002, Infineon and Infineon Technologies North
America Inc. filed an action in the U.S. District Court for the Northern District of California seeking a
declaratory judgment that they were not violating these patents. On February 7, 2003, MOSAID filed
counterclaims seeking damages for the alleged patent infringement. On April 1, 2005, the U.S. District Court
for the District of New Jersey issued a summary judgment order that Infineon's products did not infringe most
of MOSAID's asserted claims. On February 9, 2006, MOSAID filed a notice of appeal with respect to those
patent claims on which the court had granted summary judgment of non-infringement. On April 6, 2005,
MOSAID filed an additional lawsuit in the U.S. District Court for the Eastern District of Texas alleging
infringement of additional MOSAID patents. On June 14, 2006, the parties announced that they had settled
all pending litigation and appeals. The litigation in the Eastern District of Texas was dismissed with prejudice
on June 20, 2006. As part of the global settlement, MOSAID purchased fifty patents from Infineon and
Qimonda, including patents related to a range of technologies such as DRAM memory, power management
ICs, semiconductor process technology and digital radio applications. Under the terms of the settlement
agreements, Infineon and we retain royalty-free ""lives of the patents'' licenses to use these patents in the
manufacturing and sale of any products. In addition, MOSAID granted to Infineon and us a six-year license to
use any MOSAID patents in the manufacturing and sale of semiconductor products, as well as a ""lives of the
patents'' license to those MOSAID patent families that had been in dispute. We agreed to make the related
license payments over a six-year term.
Tessera
As set forth under ""Ì Antitrust Matters'' above, Tessera filed a lawsuit against Infineon and one
additional DRAM manufacturer in the U.S. District Court for the Eastern District of Texas in March 2005,
alleging that some of Infineon's products were infringing five Tessera patents. On May 10, 2006, Tessera
amended its complaint and added us as an additional named defendant. On August 1, 2006, we and Infineon
entered into settlement agreements with Tessera, Inc. in respect of all of Tessera's patent infringement and
antitrust claim and all counterclaims and other claims Infineon and we raised against Tessera. As part of the
settlement, we have entered into a license agreement with Tessera, effective July 1, 2006, that provides us a
world-wide, non-exclusive, non-transferable and non-sublicensable license to use a portfolio of Tessera patents
relating to packaging for integrated circuits in our production. The license agreement will be effective until
May 2012, when it will automatically expire unless we notify Tessera by November 2011 that we elect to
extend the agreement for an additional five years until May 2017. Upon expiration of the extended term, if
any, our license to use the patents covered by the license will become fully paid-up and perpetual.
Under the license agreement, we paid Tessera a one-time $40 million fee in August 2006. In addition, we
will pay additional royalties over a six year period based on the volume of components we sell that are subject
to the license. These components make up approximately 80% of our current production on the basis of
products sold. We expect this royalty to amount to approximately $15 million to $25 million in our next
financial year. In the remaining years in which the royalty is payable, it will increase or decrease in proportion
with the volume of components we sell that are subject to the license. In the event we elect to extend the
agreement past its initial term, we will continue to pay royalties at 50% of the rates we will pay Tessera during
the initial term of the license agreement.
Rambus
In March 2005, Infineon reached an agreement with Rambus Inc., settling all claims between them and
licensing the Rambus patent portfolio for use in current and future Infineon products. Rambus has granted to
Infineon a worldwide license to existing and future Rambus patents and patent applications for use in Infineon
memory products. The agreement provides that the duration of the license shall continue until the last of the
licensed Rambus patents has expired. The license includes an unspecified number of patents, which expire on
112
Global Reports LLC

different dates over a period ending in 2026. Neither party may terminate the agreement for any reason prior
to its expiration. In exchange for this worldwide license, Infineon agreed to pay $50 million in quarterly
installments of $6 million between November 15, 2005 and November 15, 2007. After November 15, 2007,
and only if Rambus enters into additional specified licensing agreements with certain other DRAM
manufacturers, Infineon would be required to make additional quarterly payments which may total an
additional $100 million. Because Rambus' ability to conclude the agreements is not within our control, we are
not able to estimate whether additional payment obligations may arise. The agreement also provides Infineon
an option for acquiring certain other licenses. All licenses provide for Infineon to be treated as a ""most-favored
customer'' of Rambus. Infineon has simultaneously granted to Rambus a fully-paid perpetual license for
memory interfaces. These contingencies were assigned to us pursuant to the contribution agreement.
Accruals and the Potential Effect of these Lawsuits on Our Business
Liabilities related to legal proceedings are recorded when it is probable that a liability has been incurred
and the associated amount can be reasonably estimated. Where the estimated amount of loss is within a range
of amounts and no amount within the range is a better estimate than any other amount or the range cannot be
estimated, the minimum amount is accrued. As of September 30, 2006, we have accrued liabilities in the
amount of 4141 million related to the DOJ and European antitrust investigations and the direct and indirect
purchaser litigation and settlements described above, as well as for legal expenses relating to the other matters
described above. The accrued liabilities, other current and non-current liabilities, and other commitments and
contingencies related to legal proceedings are further reported in Notes 19, 20, 22 and 31 to our combined and
consolidated financial statements, which are attached to this annual report.
As additional information becomes available, the potential liability related to these matters will be
reassessed and the estimates revised, if necessary. These accrued liabilities would be subject to change in the
future based on new developments in each matter, or changes in circumstances, which could have a material
adverse effect on our financial condition and results of operations.
An adverse final resolution of the antitrust investigations or related civil claims or the securities class
action lawsuits described above could result in significant financial liability to, and other adverse effects on,
Infineon, and most likely us, which would have a material adverse effect on our results of operations, financial
condition and cash flows. Irrespective of the validity or the successful assertion of the claims described above,
we could incur significant costs with respect to defending against or settling such claims, which could have a
material adverse effect on our results of operations, financial condition and cash flows. Any of these results
may have a material adverse effect on our financial condition and results of operations.
Other Matters
We are subject to various other lawsuits, legal actions, claims and proceedings related to products, patents
and other matters incidental to our businesses. Infineon has accrued a liability for the estimated costs of
adjudication of various asserted and unasserted claims existing as of the balance sheet date. Based upon
information presently known to management, we do not believe that the ultimate resolution of such other
pending matters will have a material adverse effect on our financial condition, results of operations or cash
flows.
Environmental Protection, Safety and Health
Our global Environmental, Safety and Health Management System is structured and designed to
mitigate the risks associated with our manufacturing processes. These risks include the integrity of our
operations, risks relating to the health and well-being of our employees, risks relating to the environment, our
assets and third parties. All production sites worldwide and our headquarters are certified according to
EN/ISO 14001 and OSHAS 18001.
In the last few years, there has been increased media scrutiny and reports focusing on a potential link
between working in semiconductor manufacturing clean room environments and certain illnesses, primarily
different types of cancers. Regulatory agencies and industry associations have begun to study the issue to see if
113
Global Reports LLC

any actual correlation exists. We have carried out bio-monitoring programs since 1990, testing both those
employees who work in clean room environments and those who do not. Employees that do not work in clean
room environments thus serve as a control group, enabling us to determine whether clean room environment
employees have been exposed to hazardous chemicals. Our testing has consistently shown that employees who
work in our clean rooms have not been exposed to elevated levels of the relevant chemicals. Our bio-
monitoring program is a pro-active approach to employee health and safety, and we believe it exceeds the
health monitoring efforts of others in our industry. Accordingly, we do not believe that scrutiny of these
potential links will negatively affect our ability to recruit and retain employees.
Where we are not able to eliminate adverse environmental impacts entirely, we aim to minimize any such
impact. For example, in some of our manufacturing processes we use Perfluorinated Compounds, or PFCs. As
early as 1992, we began to install exhaust air filter systems to reduce PFC emissions. We have documented
our commitment to protect the environment by signing the global voluntary agreement designed by World
Semiconductor Council to reduce greenhouse gases as defined under the Kyoto Protocol. The target is to
reduce total PFC emissions of this substance group by 10% compared with the baseline emission level from
1995. After 5 years of data collection, we have determined that our reduction measures, including using
alternative chemistry, improving efficiency and installing abatement systems, were appropriate to meet this
goal. Assuming an annual production volume growth within the semiconductor industry of 15%, this would
represent an emission reduction by 2010 of approximately 90% from the 1995 level, calculated in CO2
equivalents.
Another aspect of our efforts to minimize our impact on the environment is our comprehensive ""green
product'' strategy, which refers to our efforts to eliminate lead and halogen from our products. We first
produced green products and modules in December 2002 and as of September 30, 2006, 90% of all our
products were ""green'' while 98% of our manufactured modules used ""green components''. The remaining
products that cannot be classified as ""green'' are produced with these substances due, in most cases, to
customers' specific requirements.
Due to the fact that a damage and loss of a semiconductor facility caused by a fire can be substantial, we
have installed automatic protection systems such as sprinklers into all of our production facilities. We have
also standardized the loss prevention procedures in all of our facilities. We regularly review our protection
status at all of our facilities including audits by external property protection engineers and continue to invest in
loss prevention equipment and training at our facilities.
Relevant Environmental Laws and Regulations
We are subject to a variety of laws relating to the use, disposal, cleanup of and human exposure to
hazardous materials in most of the jurisdictions we operate in. Within the past decade, the European Union
has proposed or enacted certain environmental directives that may be or are required to be enacted in each EU
member state. A brief discussion of the most important directives, in terms of their effect, or potential effect,
on our business of these follows.
The Restriction of the use of certain Hazardous Substances in electrical and electronic equipment, or the
RoHS Directive, prohibits placing products on the EU market that contain more than certain levels of lead,
cadmium, mercury and other substances. We comply with this law through implementation of our ""green
products'' strategy discussed above.
To ensure the commercial viability of our products, we have completed the conversion of all Qimonda
product packages to comply with, in particular, the RoHS Directive which sets forth lead-free standards for
many types of electronic and electrical equipment. The obligation to comply with the RoHS Directive
ultimately lies with the equipment's producer. These customers therefore require us to supply lead-free
products, and we regularly provide certificates that document our products' compliance with the RoHS
Directive's lead-free standards.
To address the needs of electronic equipment manufacturers whose products require an exemption from
the application of the RoHS Directive, typically for technical or economic reasons, exemptions are available
114
Global Reports LLC
which permit the use of lead-containing parts for specific applications. In addition, certain manufacturers have
been individually exempted from compliance with the RoHS Directive by the relevant governmental
authorities. We continue to supply a small number of lead-containing products for these exempted
applications and manufacturers. Additionally, we have a number of customers who require delivery of lead
containing products to non-European markets, where the RoHS Directive does not apply.
A similar set of rules is now under discussion in the People's Republic of China and although we believe
that this new law will largely resemble the European model, this is by no means certain. The enactment of this
new law may impose additional costs upon our business or may have an effect on our ability to timely support
customer demand of our products in China.
The Waste Electrical and Electronic Equipment, or WEEE Directive, imposes ""take back'' obligations
on electronic equipment producers for the financing of the collection, recovery and disposal of electrical and
electronic equipment. The implementation of the WEEE directive has not been completed in most EU
countries and hence the costs are not yet to be foreseen. As of September 30, 2006, we have not put any
WEEE affected products directly onto the market. Once we do, we will comply with the country specific laws.
The Registration, Evaluation and Authorization of Chemicals used in the European Union, or REACH
Regulation, is a regulatory framework that concerns the registration, evaluation and authorization of certain
chemicals. It is not yet clear which chemicals will fall under these regulations, although we believe the
regulation is targeted towards chemical companies and industries in which significant volumes of chemicals
are used. As we use very few chemicals whose volume exceeds 100 tons per year, we are classified as a ""down-
stream user category II'' under the current draft of the legislation. Further, the current draft contains a
proposal to exempt companies who meet certain standards from the authorization process. Due to these
uncertainties, we believe it is premature to estimate the potential costs this regulation could impose on us.
The Energy-using Products, or EuP Directive establishes ecologically sound development requirements
for electrical devices. This directive applies generally to consumer products such as home appliances, and does
not specifically regulate our products. However, our customers who do produce electronic or electrical
consumer devices need to be able to demonstrate to consumers that their products do conform to the directive
and so we may need to supply our customers with information that will enable them to comply with these
obligations. We believe this Directive may have a positive influence on those of our DRAM products that
consume relatively less power than comparable products of our competitors.
115
Global Reports LLC
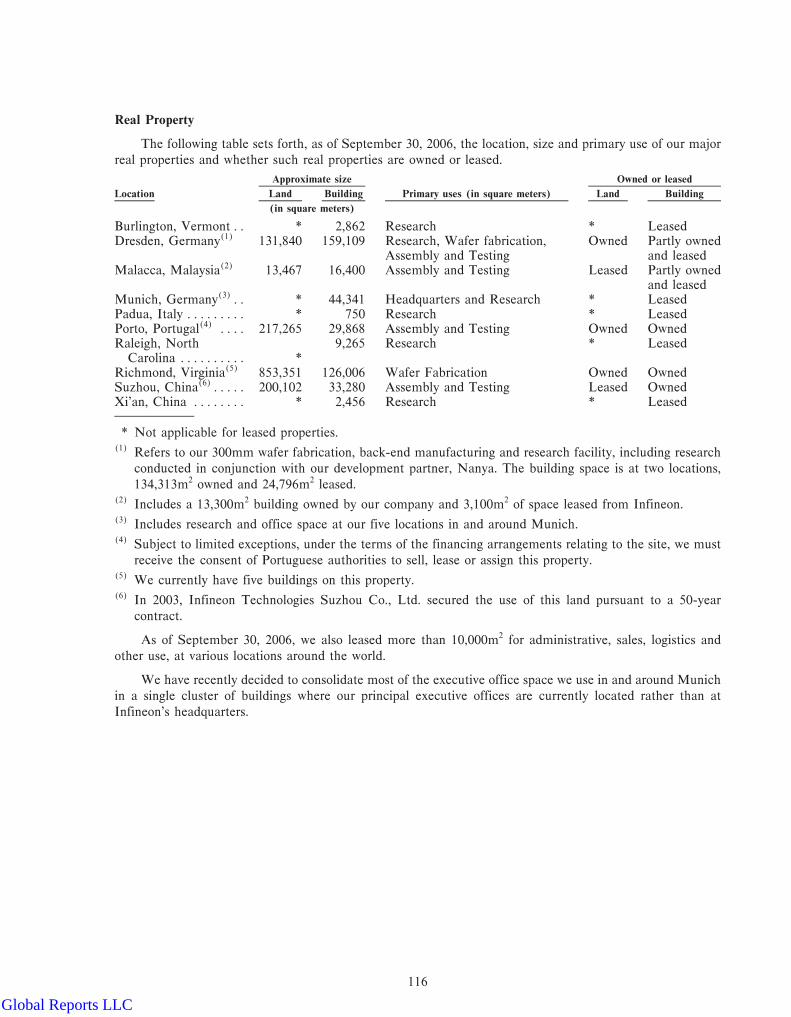
Real Property
The following table sets forth, as of September 30, 2006, the location, size and primary use of our major
real properties and whether such real properties are owned or leased.
Approximate size Owned or leased
Location Land Building Primary uses (in square meters) Land Building
(in square meters)
Burlington, Vermont ÏÏ * 2,862 Research * LeasedDresden, Germany(1) 131,840 159,109 Research, Wafer fabrication, Owned Partly owned
Assembly and Testing and leasedMalacca, Malaysia(2) 13,467 16,400 Assembly and Testing Leased Partly owned
and leasedMunich, Germany(3)ÏÏ * 44,341 Headquarters and Research * LeasedPadua, Italy ÏÏÏÏÏÏÏÏÏ * 750 Research * LeasedPorto, Portugal(4) ÏÏÏÏ 217,265 29,868 Assembly and Testing Owned OwnedRaleigh, North 9,265 Research * Leased
Carolina ÏÏÏÏÏÏÏÏÏÏ *Richmond, Virginia(5) 853,351 126,006 Wafer Fabrication Owned OwnedSuzhou, China(6)ÏÏÏÏÏ 200,102 33,280 Assembly and Testing Leased OwnedXi'an, China ÏÏÏÏÏÏÏÏ * 2,456 Research * Leased
* Not applicable for leased properties.(1) Refers to our 300mm wafer fabrication, back-end manufacturing and research facility, including research
conducted in conjunction with our development partner, Nanya. The building space is at two locations,
134,313m2 owned and 24,796m2 leased.(2) Includes a 13,300m2 building owned by our company and 3,100m2 of space leased from Infineon.(3) Includes research and office space at our five locations in and around Munich.(4) Subject to limited exceptions, under the terms of the financing arrangements relating to the site, we must
receive the consent of Portuguese authorities to sell, lease or assign this property.(5) We currently have five buildings on this property.(6) In 2003, Infineon Technologies Suzhou Co., Ltd. secured the use of this land pursuant to a 50-year
contract.
As of September 30, 2006, we also leased more than 10,000m2 for administrative, sales, logistics and
other use, at various locations around the world.
We have recently decided to consolidate most of the executive office space we use in and around Munich
in a single cluster of buildings where our principal executive offices are currently located rather than at
Infineon's headquarters.
116
Global Reports LLC

MANAGEMENT
Overview of Corporate Governance Structure
In accordance with the German Stock Corporation Act (Aktiengesetz), our company has a Supervisory
Board and a Management Board. The two boards are separate and no individual may simultaneously serve as a
member of both boards. The Management Board is responsible for managing our business in accordance with
applicable laws, the Articles of Association of our company and the rules of procedure of the Management
Board. Moreover, it represents us in our dealings with third parties. The Supervisory Board appoints and
removes the members of the Management Board and oversees the management of our company but may not
make management decisions.
In carrying out their duties, members of both the Management Board and Supervisory Board must
exercise the standard of care of a prudent and diligent businessman, and they are liable to our company for
damages if they fail to do so. Both boards are required to take into account a broad range of considerations in
their decisions, including the interests of our company and its shareholders, employees and creditors. The
Management Board is required to respect the shareholders' rights of equal treatment and equal information.
The Supervisory Board has comprehensive monitoring functions. To ensure that these functions are
carried out properly, the Management Board must, among other things, regularly report to the Supervisory
Board with regard to current business operations and future business planning. The Supervisory Board is also
entitled to request special reports at any time. The Management Board is required to ensure appropriate risk
management within our company and must establish an internal monitoring system.
Under German law, shareholders of a company, like other persons, are liable to the company for damages
if they intentionally use their influence on the company to cause a member of the Management Board, the
Supervisory Board or holders of special proxies to act in a way that is harmful to the company. If a member of
the Management Board or Supervisory Board neglects his or her duties, such member is jointly and severally
liable with the persons exercising such influence. Infineon is our controlling shareholder. Under German law, a
controlling shareholder may not cause us to act against our interests unless we are compensated by the
controlling shareholder for any resulting detriment or we have entered into a control agreement governed by
German law (Beherrschungsvertrag). Infineon and we have not entered into a control agreement. Members of
our Supervisory and Management Boards who have not acted in our interest in their dealings with a
controlling shareholder are, together with the controlling shareholder, jointly and severally liable to our
company for damages.
We must bring an action against members of the Supervisory and Management Boards for breach of duty
in our name if a majority of the shares voting at a shareholders' meeting so resolve. We may only waive our
right to damages under, or settle claims arising out of, an action like this three years after the date that the
cause of action accrued and if the shareholders approve the waiver or settlement at a meeting of the
shareholders by majority vote, as long as shareholders holding 10% or more of our share capital do not object
and have their opposition formally noted in the minutes maintained by a German notary.
Under German law, individual shareholders can sue members of the Supervisory and Management
Boards on behalf of the company in a manner analogous to a shareholder's derivative action under U.S. law
only if they hold at least 1% of the company's share capital or shares with a notional value of 4100,000 andonly with court permission. Under German law, directors may be liable for breach of duty to shareholders (as
opposed to a duty to the company itself) only where a breach of duty to the company also constitutes a breach
of a statutory provision enacted specifically for the protection of shareholders. As a practical matter,
shareholders are able to assert liability against directors for breaches of this sort only in unusual circumstances.
We adopted new Articles of Association in connection with our carve-out and amended them at the
occasion of our extraordinary shareholders' meetings on July 14, 2006 and on July 27, 2006. These, taken
together with German corporate law, provide as follows with respect to our Supervisory Board and our
Management Board.
117
Global Reports LLC

Supervisory Board
After the transfer of employees from Infineon to us in connection with our carve-out, our Management
Board determined, and publicly announced on May 4, 2006, that under the German Act on the One-Third
Participation of Employees in Supervisory Boards (Gesetz uber die Drittelbeteiligung der Arbeitnehmer imAufsichtsrat), one third of the members of our Supervisory Board must henceforth be elected by our
employees. In accordance with this announcement, we amended our Articles of Association to provide that
our Supervisory Board must consist of six members, four of whom must be elected by our shareholders in a
shareholders' meeting, and two of whom must be elected by our employees.
In general, the four shareholder representatives on the Supervisory Board are elected by a majority of the
votes cast at a shareholders' meeting. During our extraordinary shareholders' meeting held on July 14, 2006,
four new Supervisory Board members were elected.
The two employee representatives on our Supervisory Board will come from the ranks of our employees
(excluding executive employees (leitende Angestellte)). As the voting procedure with respect to the employee
representatives is time-consuming, we, together with other applicants, initiated a court proceeding in
accordance with Section 104 of the German Stock Corporation Act to have the competent court appoint two
employee representatives for a transitional period, that will continue until employee representation elections
can be held and completed. Section 104 of the German Stock Corporation Act generally provides that
application for a court appointment can be made if the actual number of Supervisory Board members is below
the number required by law or the articles of association for a period in excess of three months. On July 20,
2006, the court appointed in accordance with that application, Messrs. Johann Grundbacher and Lothar
Armbrecht to our Supervisory Board.
Our Articles of Association allow the shareholders, by a vote of three quarters of the votes cast in a
general meeting, to remove any member of the Supervisory Board they have elected. The employee
representatives may be removed by the group of employees that were entitled to elect them by a vote of three-
quarters of the votes cast. The Supervisory Board will elect a chairman and a deputy chairman from among its
members. The Supervisory Board will normally act by simple majority vote with the chairman having a casting
vote. Supervisory Board resolutions are subject to a quorum of half of the members of which the Supervisory
Board must be composed.
The Supervisory Board will meet at least twice during each half of a calendar year. Its main functions are:
‚ to appoint our Management Board;
‚ to monitor our management;
‚ to approve matters in areas that the Supervisory Board has made generally subject to its approval; and
‚ to approve matters that the Supervisory Board decides on a case by case basis to make subject to its
approval.
118
Global Reports LLC
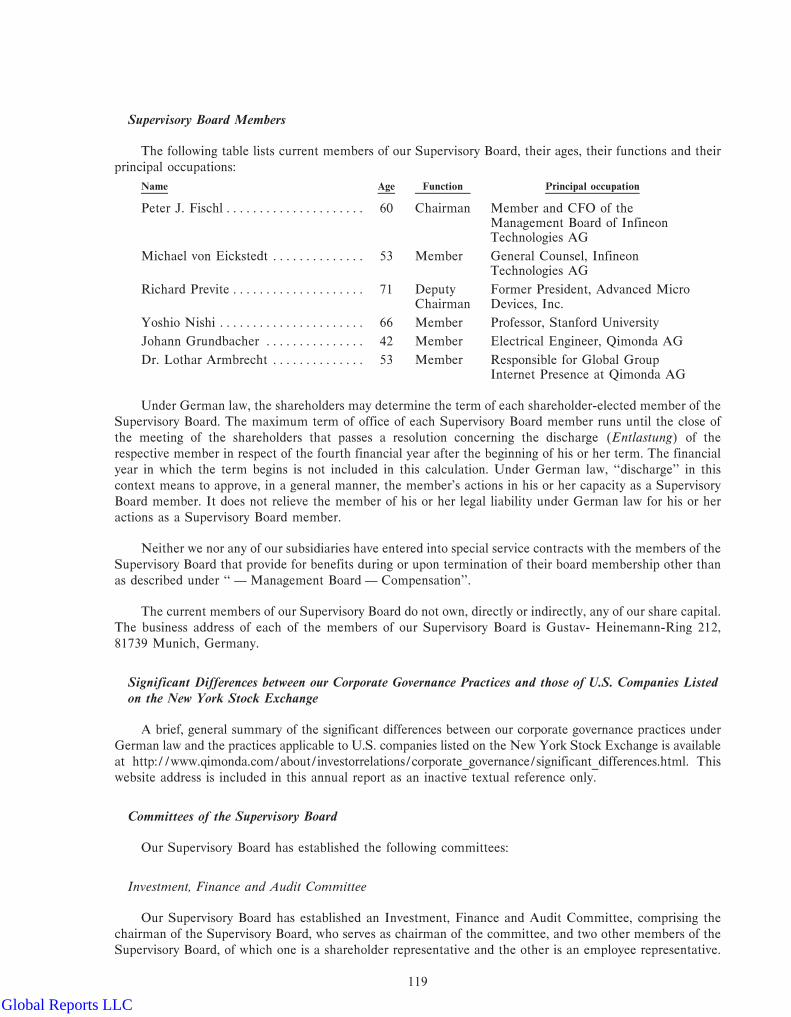
Supervisory Board Members
The following table lists current members of our Supervisory Board, their ages, their functions and their
principal occupations:
Name Age Function Principal occupation
Peter J. Fischl ÏÏÏÏÏÏÏÏÏÏÏÏÏÏÏÏÏÏÏÏÏ 60 Chairman Member and CFO of theManagement Board of InfineonTechnologies AG
Michael von Eickstedt ÏÏÏÏÏÏÏÏÏÏÏÏÏÏ 53 Member General Counsel, InfineonTechnologies AG
Richard Previte ÏÏÏÏÏÏÏÏÏÏÏÏÏÏÏÏÏÏÏÏ 71 Deputy Former President, Advanced MicroChairman Devices, Inc.
Yoshio Nishi ÏÏÏÏÏÏÏÏÏÏÏÏÏÏÏÏÏÏÏÏÏÏ 66 Member Professor, Stanford University
Johann Grundbacher ÏÏÏÏÏÏÏÏÏÏÏÏÏÏÏ 42 Member Electrical Engineer, Qimonda AG
Dr. Lothar Armbrecht ÏÏÏÏÏÏÏÏÏÏÏÏÏÏ 53 Member Responsible for Global GroupInternet Presence at Qimonda AG
Under German law, the shareholders may determine the term of each shareholder-elected member of the
Supervisory Board. The maximum term of office of each Supervisory Board member runs until the close of
the meeting of the shareholders that passes a resolution concerning the discharge (Entlastung) of the
respective member in respect of the fourth financial year after the beginning of his or her term. The financial
year in which the term begins is not included in this calculation. Under German law, ""discharge'' in this
context means to approve, in a general manner, the member's actions in his or her capacity as a Supervisory
Board member. It does not relieve the member of his or her legal liability under German law for his or her
actions as a Supervisory Board member.
Neither we nor any of our subsidiaries have entered into special service contracts with the members of the
Supervisory Board that provide for benefits during or upon termination of their board membership other than
as described under "" Ì Management Board Ì Compensation''.
The current members of our Supervisory Board do not own, directly or indirectly, any of our share capital.
The business address of each of the members of our Supervisory Board is Gustav- Heinemann-Ring 212,
81739 Munich, Germany.
Significant Differences between our Corporate Governance Practices and those of U.S. Companies Listedon the New York Stock Exchange
A brief, general summary of the significant differences between our corporate governance practices under
German law and the practices applicable to U.S. companies listed on the New York Stock Exchange is available
at http://www.qimonda.com/about/investorrelations/corporate governance/significant differences.html. This
website address is included in this annual report as an inactive textual reference only.
Committees of the Supervisory Board
Our Supervisory Board has established the following committees:
Investment, Finance and Audit Committee
Our Supervisory Board has established an Investment, Finance and Audit Committee, comprising the
chairman of the Supervisory Board, who serves as chairman of the committee, and two other members of the
Supervisory Board, of which one is a shareholder representative and the other is an employee representative.
119
Global Reports LLC

The Investment, Finance and Audit Committee carries out the functions normally carried out by the audit
committee of a U.S. company, among other duties, including:
‚ preparing the decisions of the Supervisory Board concerning approval of our company's annual
financial statements, including review of the financial statements, our annual reports, the proposed
application of earnings and the reports of our registered public accounting firm;
‚ reviewing the interim financial statements of our company that are made public or otherwise filed with
any securities regulatory authority;
‚ handling auditor independence issues, mandating our auditor to audit our consolidated and unconsoli-
dated annual financial statements (including the determination of the focus of the audit), approving
any consulting services by the auditor and supervising the auditor;
‚ approving decisions of our Management Board or one of its committees regarding increases of our
company's capital through the issuance of new shares from our authorized or conditional capital, to the
extent that we are not either issuing the shares to employees or using them for a share option plan;
‚ approving decisions of our Management Board in relation to any investment or disposition if its value
exceeds 10% of our total investment budget, in relation to securities, guarantees and loans to third
parties outside our group of companies, which exceed 5% of our share capital plus capital reserves on
the consolidated balance sheet of our group of companies, and in relation to the Management Board's
finance and investment plans (including the budget) as well as the level of indebtedness;
‚ handling risk management issues and supervising the risk management system;
‚ establishing procedures pursuant to which our employees can report to the Investment, Finance and
Audit Committee, on an anonymous and confidential basis, complaints regarding our accounting and
auditing practices, and enacting rules pursuant to which such complaints received by us from third
parties will be reported to the Investment, Finance and Audit Committee;
‚ discussing any flaws relating to our internal control systems, as reported by the Management Board to
the Investment, Finance and Audit Committee;
‚ examination of our bookkeeping, documents and assets;
‚ approval of Management Board resolutions on the utilization of the authorization granted by our
shareholders to issue convertible bonds, including, in particular, the maximum amount of the issuance
and the exclusion of shareholders' preemptive rights.
The Investment, Finance and Audit Committee also supports the Supervisory Board in its exercise of its
duty to supervise our business. It may exercise the oversight powers conferred upon the Supervisory Board by
German law for this purpose. Decisions of the Investment, Finance and Audit Committee are subject to the
quorum that all of its members are present and require a simple majority.
Messrs. Fischl, Previte and Armbrecht sit on the Investment, Finance and Audit Committee.
Technology Committee
Our Supervisory Board has established a Technology Committee. This committee advises the Manage-
ment Board on technology related issues. Messrs. Nishi, Fischl and Grundbacher sit on this committee.
Presidential Committee
Our Supervisory Board has established a Presidential Committee. Among other things, this committee
handles, and prepares resolutions of the full Supervisory Board on, all matters relating to the relationship
between us and the Management Board, including the execution, amendment and termination of the service
agreements with the Management Board members, as well as the appointment and removal of Management
Board members. In this function, the Presidential Committee carries out tasks that are normally carried out by
120
Global Reports LLC

compensation committees of U.S. public companies. Messrs. Fischl, von Eickstedt and Previte sit on this
committee.
Management Board
Our Articles of Association require our Management Board to have at least two members. Our
Supervisory Board may increase the size of the Management Board and appoints its members. Currently, our
Management Board consists of three members.
The Management Board has adopted rules of procedure for the conduct of its affairs and a plan for the
assignment of business (Gesch aftsverteilungsplan) which have been approved by the Supervisory Board. The
Management Board may substantially amend them at any time. The adoption and amendment of these rules
require the unanimous vote of the Management Board and the consent of the Supervisory Board. The
Supervisory Board may, however, decide to adopt rules of procedure for the Management Board instead.
The rules of procedure provide that the chairman of the Management Board will be required to notify the
chairman of the Supervisory Board of any pending matter that is significant. The chairman of the Supervisory
Board will be required, at the next meeting of the Supervisory Board, to notify the other members of the
Supervisory Board of such matter, and the Supervisory Board will then be able, on a case-by-case basis, to
designate such matter as one requiring Supervisory Board approval.
In general, our Management Board members are jointly responsible for all management matters and,
pursuant to the rules of procedure, will be required to decide jointly on a number of issues, including:
‚ preparation of the annual financial statements;
‚ calling shareholders meetings;
‚ matters for which the consent of the shareholders or of the Supervisory Board must be obtained; and
‚ matters involving basic organizational policy, business policy and investment and financial planning
questions for our company.
Notwithstanding the joint responsibility of all Management Board members for management matters, the
rules of procedure provide that the Management Board may, with the consent of the Supervisory Board,
establish a plan on the internal allocation of responsibilities among the Management Board members.
According to the plan we have established, Mr. Kin Wah Loh is responsible for strategy and business
development, personnel strategy, regions, law, communications, technology, innovation, patents, products,
product development, quality management, IT and procurement. Mr. Seifert is responsible for the areas
computing, graphics, consumer and mobile, AENEON», purchasing, production, supply chain and logistics,
sales and regional centers. Dr. Majerus is responsible for planning and controlling, bookkeeping, accounting
and reporting, tax, participation management, finance, internal audit and compliance, security (including data
protection and environmental matters), investor relations, export control and duties and personnel.
The rules of procedure provide that the Management Board shall, in general, pass its resolutions by
unanimous vote.
Under German law, the Supervisory Board appoints the members of the Management Board for a
maximum term of five years. They may be reappointed or have their terms extended for one or more terms of
up to five years each. The Supervisory Board may remove a member of the Management Board prior to
expiration of such member's term for ""good cause'', as defined in German law. ""Good cause'' includes a
serious breach of duty or a bona fide vote of no confidence by the shareholders. A member of the Management
Board may not deal with, or vote on, matters that relate to proposals, arrangements or contracts between that
member and our company.
121
Global Reports LLC

Management Board Members
The members of our Management Board, their ages, the year in which their current term expires and
their position and principal business activities outside our company, including principal directorships, is as
follows:
Principal businessactivities outside
Term Position company (includingName Age expires within company principal directorships)
Kin Wah Loh ÏÏÏÏÏÏÏÏÏÏÏÏ 52 2011 Chairman of the ÌManagement Board
Dr. Michael Majerus ÏÏÏÏÏÏ 45 2010 Member of the Director, Inotera Memories, Inc.;Management Board Director, Qimonda Technologies
(Suzhou) Co., Ltd.
Thomas Seifert ÏÏÏÏÏÏÏÏÏÏÏ 43 2009 Member of the Director, Inotera Memories, Inc.Management Board
Kin Wah Loh has served on Infineon's Management Board since December 2004, serving from January
to July 2005 as the Head of the Communication segment, and, since July 28, 2005, as the Executive Vice
President of the Memory Products segment. From 1999 until 2004 he served as President and Managing
Director of Infineon Technologies Asia Pacific, Singapore. Mr. Loh began his career at Siemens Components
in 1978 as a quality engineer in Malacca, Malaysia, later serving as General Manager (Production) of
Siemens Components Singapore between 1993 and 1996. In 1997, he was appointed Managing Director of
Siemens Components. He holds an honors degree in chemical engineering University of Malaysia, Kuala
Lumpur and a certified diploma in finance and accounting from ACCA UK.
Dr. Michael Majerus has served as the Chief Financial Officer of the Memory Products Group of
Infineon since December 2000. He has been a member of the Board of Directors of Inotera in Taiwan since its
founding. Previously, Dr. Majerus held various positions in finance within the Mannesmann Group, including
as the head of controlling and accounting at Mannesmann AG, which he joined in 1989. He holds a diploma
in business administration from the University of Cologne, Germany, and a doctorate in economics from the
University of Siegen, Germany, where he served as assistant at the Institute of Business Administration and
Production.
Thomas Seifert has served on the Memory Products Group Management Board since 2004. He is also a
member of the Board of Directors of Inotera in Taiwan. From 2000 to 2004, Mr. Seifert worked with the
Wireline Communications Business Group, where he served first as Chief Operating Officer and then Chief
Executive Officer. From 1996 to 2000, Mr. Seifert led the White Oak Semiconductor plant, Infineon's joint
venture with Motorola in Richmond, Virginia. Starting in 1993, he spent three years working on the
manufacturing cooperation with IBM on the Management Board in Essonnes, France. Mr. Seifert joined the
Corporate Management Group of Siemens in 1990. Mr. Seifert holds a diploma in business administration
from the University of Erlangen, Germany and a masters degree in economics from Wayne State University,
Michigan, United States of America.
These Management Board members have served in their positions since April 15, 2006.
The current members of our Management Board do not own, directly or indirectly, any of our share
capital. We do not expect that the members of our Management Board will, individually or in the aggregate,
own, directly or indirectly, more than 1% of our company's outstanding share capital. The business address of
each of the members of our Management Board is Gustav-Heinemann-Ring 212, 81739 Munich, Germany.
Compensation
Our Articles of Association provide that the annual compensation for each member of the Supervisory
Board will be $50,000. The chairman of the Supervisory Board will receive $150,000 and the deputy chairman,
as well as each chairman of a Supervisory Board committee, will receive $100,000, in each case per full
financial year. Shareholder representatives on the Supervisory Board affiliated with Infineon have waived their
122
Global Reports LLC

right to receive compensation for as long as Infineon remains a significant shareholder of the Company. Our
Articles of Association provide that each member of the Supervisory Board will receive, for each full financial
year, 5,000 ADS appreciation rights. These will be granted, and may be exercised, under the same terms and
conditions that apply under the stock option plan approved by the shareholders' meeting that will be in force in
the year of the grant of the ADS appreciation rights. See "" Ì Employee Stock Option Program''. These rights
will provide the member the cash benefit of any appreciation in our ADS price during the time the right is
held but will not entitle any member to receive ADSs or the underlying shares. That is, upon exercise of such
rights, we will pay the member the amount of cash equal to the difference between the grant price and the
average ADS price over a several day period before the exercise date. No such rights have been granted. No
compensation was paid to the members of our Supervisory Board for the 2005 financial year.
For our 2006 financial year, the individual members of the Supervisory Board received the following cash
remuneration:
Fixed remuneration
Peter J. Fischl ÏÏÏÏÏÏÏÏÏÏÏÏÏÏÏÏÏÏÏÏÏÏÏÏÏÏÏÏÏÏÏÏÏÏÏÏÏÏÏÏÏÏÏÏÏÏÏÏÏÏÏÏÏÏÏ $ 0
Richard Previte ÏÏÏÏÏÏÏÏÏÏÏÏÏÏÏÏÏÏÏÏÏÏÏÏÏÏÏÏÏÏÏÏÏÏÏÏÏÏÏÏÏÏÏÏÏÏÏÏÏÏÏÏÏÏ 20,833
Yoshio Nishi ÏÏÏÏÏÏÏÏÏÏÏÏÏÏÏÏÏÏÏÏÏÏÏÏÏÏÏÏÏÏÏÏÏÏÏÏÏÏÏÏÏÏÏÏÏÏÏÏÏÏÏÏÏÏÏÏ 20,833
Michael v. EickstedtÏÏÏÏÏÏÏÏÏÏÏÏÏÏÏÏÏÏÏÏÏÏÏÏÏÏÏÏÏÏÏÏÏÏÏÏÏÏÏÏÏÏÏÏÏÏÏÏÏÏ 0
Dr. Lothar Armbrecht ÏÏÏÏÏÏÏÏÏÏÏÏÏÏÏÏÏÏÏÏÏÏÏÏÏÏÏÏÏÏÏÏÏÏÏÏÏÏÏÏÏÏÏÏÏÏÏÏ 10,416
Johann GrundbacherÏÏÏÏÏÏÏÏÏÏÏÏÏÏÏÏÏÏÏÏÏÏÏÏÏÏÏÏÏÏÏÏÏÏÏÏÏÏÏÏÏÏÏÏÏÏÏÏÏÏ 10,416
Total ÏÏÏÏÏÏÏÏÏÏÏÏÏÏÏÏÏÏÏÏÏÏÏÏÏÏÏÏÏÏÏÏÏÏÏÏÏÏÏÏÏÏÏÏÏÏÏÏÏÏÏÏÏÏÏÏÏÏÏÏÏÏÏ $62,498
We entered into employment service contracts with each of the members of the Management Board.
Pursuant to these contracts, the members of the Management Board are entitled to receive an annual base
salary plus a regular annual bonus, the amount of which will depend upon Qimonda's return on invested
capital. We will pay a total of 42,250,000 in base salary to the members of our Management Board each year
under these contracts. We may pay between 4700,000 and 42,460,000 in total to the members of our
Management Board under their service contracts in the form of a yearly bonus dependent on company
performance as measured by return on assets (year-end EBIT divided by the sum of equity and debt). The
yearly bonus for each member may be increased in 420,000 increments for each percentage point return on
assets exceeding 12% in any given year. In addition, each member is eligible to receive a discretionary bonus in
the event the member achieves additional performance targets established by the Supervisory Board. The
Management Board may also receive other compensation, including continued remuneration in the event of
sickness, allowances for insurances, and non cash benefits for business trips, as well as company cars. Under
the service contracts, Management Board members are also entitled to receive a fixed annual pension that
increases over time depending on the number of years served on the Management Board. We will pay up to a
maximum of 4750,000 per year in pension to the members of our Management Board. In principle, Board
Members are entitled to such pension after the age of 65. Upon a board member's death, benefits may be
payable to the deceased's spouse or orphaned children. Each of the service contracts expires when the Board
member's term of office is terminated. In the absence of arrangements to the contrary, the contract expires on
the member's 65th birthday.
None of Infineon, us or our subsidiaries have extended any loans to any member of our Supervisory or
Management Boards.
123
Global Reports LLC

For our 2006 financial year, beginning on April 15, 2006, the individual members of the Management
Board were entitled to following compensation:
AdditionalOther Yearly bonus dependent performance Total
Base salary compensation on company performance targets compensation
Loh Kin Wah ÏÏÏÏÏÏÏÏÏÏÏÏ 4 481,250 4 8,845 4 425,333 4 500,000 41,415,428
Dr. Michael Majerus ÏÏÏÏÏÏ 275,000 5,714 370,333 300,000 951,047
Thomas Seifert ÏÏÏÏÏÏÏÏÏÏÏ 275,000 4,389 370,333 300,000 949,722
TotalÏÏÏÏÏÏÏÏÏÏÏÏÏÏÏÏÏÏÏÏ 41,031,250 418,948 41,165,999 41,100,000 43,316,197
Employee Stock Option Program
Our shareholders have authorized the Supervisory Board to grant to the members of the Management
Board, and the Management Board to grant to certain key executives in our group, through September 30,
2009, a total of 6,000,000 non-transferable option rights to receive ordinary shares issued by us.
The option rights may be allocated as follows: the first group, consisting of the members of our
Management Board, may receive a total of up to 1,200,000 option rights. Our Supervisory Board has allocated
400,000 options for grant in the 2007 fiscal year of which 200,000 would be for Mr. Loh, 100,000 for
Mr. Majerus and 100,000 for Mr. Seifert. These options have not yet been granted. The second group,
consisting of the members of the executive boards of our subsidiaries in Germany and abroad, may receive a
total of up to 1,000,000 option rights. The third group, consisting of further key executives who will be
nominated based on their performance to receive up to a specific number of options based on their job
classification, may receive a total of up to 3,800,000 option rights. We expect that, in total, about 6% of our
work force will be eligible to participate in the plan. During any fiscal year, not more than 40% of the total
option rights allocable to the respective group may be issued to the members of such group. No option rights
may be issued to executives of any of our group companies that are listed on a stock exchange and their
subsidiaries, if and for as long as such companies maintain their own stock option plans.
Option rights may be granted within 45 days of the publication of our results for the preceding fiscal year
or within 45 days upon publication of our results for the first or second quarter of a fiscal year, but, in each
case, no later than two weeks prior to the end of the respective quarter.
The option rights may be exercised within six years after their grant, but not before the expiration of a
vesting period that will be at least three years. The exercise of each option right is subject to the condition that
the exchange price of our ADSs on the New York Stock Exchange will, during the exercise period of the
respective option right, exceed the index ""Philadelphia Semiconductor Sector (SOX)'' on at least three
consecutive days. In order to determine whether such excess has taken place, the SOX and the strike price of
the respective option right will be set at 100 at the day on which the option right is granted.
For as long as our shares are not listed on any organized market with the European Union or the
European Economic Area, the strike price will be the average of the opening prices of our ADSs on the New
York Stock Exchange on the five trading days prior to the day of the grant (or a fraction thereof, if an ADS
does not represent exactly one of our ordinary shares). Otherwise, the strike price will be the average of the
opening prices of our shares on the respective organized market on the five trading days prior to the day of the
grant.
124
Global Reports LLC
The holders of option rights will benefit from certain anti-dilution protection provisions, particularly in
the case of certain capital measures performed by us.
Upon exercise of an option right, the holder will generally receive new ordinary shares to be issued by us.
Our Management Board (with approval by the Supervisory Board) will, however, instead be allowed to deliver
existing shares or pay a cash compensation to be calculated on the basis of the difference between the strike
price and the exchange price of our ADSs or shares on the exercise date.
The Management Board and, to the extent options to be granted to the Management Board are
concerned, the Supervisory Board are entitled to determine further details of the option plan, including, in
particular, the inclusion of the new shares granted upon exercise of the option rights into our ADS program.
Employee Share Purchase Programs
We are currently considering whether to adopt an employee share purchase program.
125
Global Reports LLC

PRINCIPAL SHAREHOLDERS
The following table shows the beneficial ownership, as of September 30, 2006, of our company's share
capital by (1) the principal shareholders (each person or entity who owns beneficially 5 percent or more of our
shares), (2) the public and (3) the members of our Management Board and Supervisory Board, each as a
group. We are not directly or indirectly owned or controlled by any foreign government.
Shares or ADSs owned
Percent Number
Infineon Technologies Investment B.V.(1) ÏÏÏÏÏÏÏÏÏÏÏÏÏÏÏÏÏÏÏÏÏÏÏÏÏÏÏ 49.0 167,686,025
Infineon Technologies AG ÏÏÏÏÏÏÏÏÏÏÏÏÏÏÏÏÏÏÏÏÏÏÏÏÏÏÏÏÏÏÏÏÏÏÏÏÏÏÏÏ 36.9 126,013,975
Public ShareholdersÏÏÏÏÏÏÏÏÏÏÏÏÏÏÏÏÏÏÏÏÏÏÏÏÏÏÏÏÏÏÏÏÏÏÏÏÏÏÏÏÏÏÏÏÏÏ 14.1 48,300,000
All the members of our Supervisory and Management Boards as a group(nine persons) ÏÏÏÏÏÏÏÏÏÏÏÏÏÏÏÏÏÏÏÏÏÏÏÏÏÏÏÏÏÏÏÏÏÏÏÏÏÏÏÏÏÏÏÏÏÏÏÏ 0 0
100% 684,000,000
(1) On July 17, 2006, Infineon Technologies Holding B.V., a wholly-owned subsidiary of Infineon Technolo-
gies AG, transferred its Qimonda shares, representing approximately 55.9% of our total share capital, to its
wholly-owned subsidiary Infineon Technologies Investment B.V., a private limited liability company under
Dutch law. In return, Infineon Technologies Investment B.V. issued 50 of its shares with a nominal value
of 41,000 each to Infineon Technologies Holding B.V. Infineon Technologies Investment B.V. has its
principal executive offices at Westblaak 32, NL-3012 KM Rotterdam, The Netherlands.
The major shareholders appearing in the table above do not have different voting rights from any of our
other shareholders.
Under German law, for so long as Infineon holds more than 25% of the shares in our company, it will be
in a position to block shareholder action on a variety of matters, such as:
‚ a resolution not to give effect to existing shareholders' preemptive rights in a capital increase;
‚ any capital decrease, merger, consolidation, spin-off, sale or other transfer of all or substantially all of
our assets;
‚ a change in the corporate form or business purpose of the company; or
‚ the dissolution of our company.
126
Global Reports LLC
RELATED PARTY TRANSACTIONS AND RELATIONSHIPS
With Infineon
We have entered into various short-term borrowing arrangements with Infineon. As of September 30,
2005, the largest amount outstanding under these arrangements during the years ended September 30, 2004
and 2005 was 4524 million as determined on a pro-forma basis for these periods only. As of September 30,
2006, our indebtedness to Infineon amounted to 4344 million, which bears interest at a weighted average rate
of 6.23%. The indebtedness is unsecured, has scheduled maturities in July and August 2007 and can not be
further drawn. Outstanding amounts may be repaid prior to the applicable scheduled maturity or may be
extended upon mutual agreement up to the second anniversary of our IPO. We use these funds for our general
investing purposes and for financing our operations.
Carve-out and Control
We were carved out as a wholly-owned subsidiary of Infineon effective May 1, 2006. Pursuant to the
contribution agreements Infineon and we entered into in connection with the carve-out, Infineon contributed
substantially all of the assets, liabilities, operations and activities, as well as the employees, of its Memory
Products segment to us. This excluded the Memory Products operations in Korea and Japan, which were
placed in trust for us by Infineon pending their contribution and transfer. The operations in Korea were
transferred into an indirect wholly-owned subsidiary of our company in October 2006. The operations in Japan
are governed by an agreement between us and Infineon under which sales and development personnel in the
region act for Qimonda. While Infineon's investment in the Inotera joint venture and Infineon's investment in
the Advanced Mask Technology Center (AMTC) and in the Maskhouse Building Administration Company
(BAC) in Dresden have been contributed to us, the legal transfer of these investments is not yet effective. In
the case of Inotera, Taiwanese legal restrictions have delayed the legal transfer, although an exemption from
these restrictions has been granted and we expect the transfer to be completed by the end of the 2006 calendar
year. In the case of Infineon's investment in the Dresden AMTC and BAC, Infineon's co-venturers have not
yet given the required consent to the transfer of the AMTC and BAC interest, although pursuant to the
AMTC and BAC limited partnership agreements, such consent may not be unreasonably withheld. The assets,
liabilities, operations and activities that have not yet been contributed or legally transferred are described in
greater detail under ""Ì Contribution Agreements Ì Arrangements relating to Inotera, Memory Products'
Japanese and Korean Operations, AMTC and BAC.''
The contribution took legal effect as of its registration in the commercial register (Handelsregister) at the
local court (Amtsgericht) of Munich. In the contribution agreement, however, Infineon had granted us an
unrestricted license to use all resources of the transferred business beginning on May 1, 2006. As of that date,
Infineon transferred direct or indirect possession to us of all of the assets that are the subject of the
contribution.
We agreed with Infineon that, if the legal transfer of specific assets or other rights was not possible as of
the effective date of the contribution, we would position ourselves in relation to each other as if the transfer of
these assets or rights had occurred as of that date. We also agreed with Infineon that, if further legal steps are
necessary to transfer the assets or other rights, both parties will take the relevant steps without delay. If third
party consent is required for the transfer of specific liabilities, or the assignment of specific contracts, offers or
permits, Infineon and we agreed to attempt to obtain that consent without delay and position ourselves in
relation to each other as if the transfer of these liabilities, or the assignment of these contracts, offers or
permits had occurred as of the effective date of the contribution.
We have entered into arrangements with Infineon with respect to various interim and ongoing
relationships between the two groups. Some of these arrangements are covered in the contribution agreement.
Others are the subject of separate agreements, the principal of which are described below. The Master Loan
agreement we have entered into with Infineon Technologies Holding B.V. is described in detail in ""Operating
and Financial Review Ì Capital Requirements Ì Credit Facilities''.
127
Global Reports LLC
Infineon is currently our largest shareholder, with a direct and indirect shareholding of 85.9% in our
company. Infineon has advised us that it does not anticipate owning a majority of our shares over the long
term. The temporary majority ownership by Infineon permits us to use the entire intellectual property
umbrella as well as other benefits from contracts between the Infineon group of companies and third parties.
Infineon has already begun to re-negotiate or establish intellectual property cross-licensing and other
contractual relationships with third parties for our benefit. For as long as Infineon, directly or indirectly, owns
a majority of our shares, it will also have the majority of votes in our shareholders' general meeting and will
therefore be in a position to elect all of the shareholder-elected members of our Supervisory Board. The
composition of the Supervisory Board as of September 30, 2006, is set forth under ""Management Ì
Supervisory Board''.
All of the agreements relating to our carve-out from Infineon, including those governing our ongoing
relationship with Infineon, were and will be concluded in the context of a parent-subsidiary relationship and in
the overall context of our carve-out from Infineon. The terms of these agreements may be less favorable to us
than had they been negotiated with unaffiliated third parties. See ""Risk Factors Ì Risks related to our carve-
out as a stand-alone company and our continuing relationship with Infineon''.
Contribution Agreements
Contribution Agreement between Infineon AG and Qimonda AG
The contribution agreement between Infineon AG and Qimonda AG contains provisions that:
‚ define the assets, liabilities and employees that were transferred to us;
‚ govern the intercompany licensing of intellectual property; and
‚ delineate the indemnification claims that Infineon will have against us in respect of legal matters and
other liabilities and contingencies.
Pursuant to the contribution agreement, Infineon contributed substantially all of the operations of its
Memory Products segment, including the assets that were used exclusively for these operations, to Qimonda
AG with economic effect as of May 1, 2006. As consideration, we granted Infineon 132,288,975 of our no-par
value ordinary registered shares (Namensaktien). In order to issue the shares to be granted to Infineon, we
increased our capital from 450,000 to 4264,627,950 on April 25, 2006.
Contributed assets and liabilities
The individual assets and liabilities contributed to us under the contribution agreement include:
‚ fixed assets and current assets attributable to the Memory Products segment (not including trade
accounts receivable for products and services provided to third parties and certain related parties,
which are netted against trade accounts payable);
‚ intellectual property, including patents (as described in more detail in ""Our Business Ì Intellectual
Property''), trade marks, know-how, software and other intellectual property;
‚ contracts and offers relating exclusively to products and services provided by the Memory Products
segment;
‚ rights and obligations arising under permits and other legal relationships with governmental entities
(including those arising under subsidies), so long as they do not relate to individual persons;
‚ liabilities attributable exclusively to the Memory Products segment, including those contained in the
carve-out balance sheet, those arising under contracts with third parties and employment relationships
(including pension liabilities), contingencies (including those arising in the future on the basis of
events that occurred prior to the carve-out date) and other liabilities attributable exclusively to the
Memory Products segment and which have arisen by the carve-out date (not including trade accounts
payable Ì see above);
128
Global Reports LLC
‚ risks and liabilities arising out of financings, credit lines, leases and guarantees, which Infineon entered
into for the benefit of the Memory Products segment; and
‚ ownership in certain equity investments, including in Inotera Memories, Inc. (legal transfer is still
pending as described below), Infineon Technologies SC 300 GmbH & Co. OHG, Maskhouse Building
Administration GmbH & Co. KG, Advanced Mask Technology Center GmbH & Co. KG (legal
transfer is still pending) and Hwa-Keng Investment Inc (in the process of being liquidated).
Infineon did not contribute any real estate to us in the carve-out other than the property held in legal
entities that it transferred to us.
Arrangements relating to Inotera, Memory Products' Japanese and Korean Operations, AMTC and BAC
Infineon's Memory Products assets in Japan and Korea were not contributed to us at the time of the
initial contribution. A contribution of our Japanese assets had, for practical reasons, to be preceded by the
rollout of new software. The contribution of the Korean assets and employees, which represent an insignificant
portion of Qimonda's total assets and employees, was also postponed for practical reasons. We entered into an
agreement with Infineon on June 27, 2006, pursuant to which Infineon agreed to hold these Japanese and
Korean assets in trust pending the contribution. The Korean assets were transferred to an indirect wholly-
owned subsidiary of our company in October 2006. We expect the Japanese assets to be contributed to us
during the three months ending on March 31, 2007. Under a separate agreement between us and Infineon,
Infineon's sales and development personnel in Japan act on Qimonda's behalf.
The agreement governing our joint venture with Nanya, named Inotera Memories, Inc. (Inotera), allows
Infineon to transfer its shares of Inotera to us. However, under Taiwanese law, Infineon's shares in Inotera are
subject to a compulsory restriction on transfer (lock-up) as a result of Inotera's IPO in May 2006. For that
reason we had established a separate trust agreement pursuant to which Infineon agreed to hold title to the
Inotera shares in trust for us and exercise shareholder rights (including board appointments and voting) at our
instructions until they could be transferred. See ""Our Business Ì Strategic Alliances and Agreements'' for a
description of these arrangements. Taiwanese law generally provides that Infineon may only transfer these
shares to us gradually over the four years following Inotera's IPO. In October 2006, the Taiwanese authorities
granted an exemption to Infineon permitting it to release the shares from the restriction. We expect that the
share transfer from Infineon to us will be completed by the end of the 2006 calendar year.
In addition, our limited partnership agreement with Advanced Micro Devices (AMD) and Toppan
Photomask relating to the Advanced Mask Technology Center (AMTC) and to the Maskhouse Building
Administration Company (BAC) in Dresden requires prior written consent from the other partners before
Infineon can assign its partnership interest to us. This consent may not be unreasonably withheld, but the
interest must be transferred back to Infineon should Infineon cease to be our majority shareholder. Infineon is
currently negotiating with AMD and Toppan with the goal of reaching an agreement that would allow us to
retain the interest even if Infineon ceases to be our majority shareholder. Infineon's investment in the AMTC
and BAC is being held by Infineon for our economic benefit pursuant to the contribution agreement.
A number of additional contracts with respect to which the economic benefits and obligations had been
assigned to Memory Products in the carve-out require third party consent before the benefits and obligations
can be assigned. As disclosed above, to the extent these consents are not received, Infineon and we agreed to
position ourselves in relation to each other as if assignment of these contracts had occurred as of May 1, 2006.
Employment Matters
The employment relationships that Infineon had with its Memory Products employees, including all
rights and obligations relating to these relationships, were automatically transferred to us to the extent
employees did not object to that transfer.
129
Global Reports LLC

Arrangement concerning the Licensing of Intellectual Property
In connection with the transfer of intellectual property to us, Infineon and we have entered into certain
cross-licensing arrangements, which are described in ""Our Business Ì Intellectual Property''.
Indemnification
The contribution agreement includes provisions pursuant to which we agreed to indemnify Infineon
against any claim (including any related expenses) arising in connection with the liabilities, contracts, offers,
incompleted transactions, continuing obligations, risks, encumbrances and other matters relating to the
Memory Products segment that were transferred to us in the carve-out. We also agreed to indemnify Infineon
against any losses it may suffer under several guarantee and financing arrangements that relate to our business
but that cannot be transferred to us for legal, technical or practical reasons. In addition, the contribution
agreement provides for indemnification of Infineon with respect to certain existing and future legal claims (as
described in ""Our Business Ì Legal Matters'') and if a scale-back in production in Module 1 of the Dresden
200mm fab is needed, 50% of any restructuring costs that may be incurred (as described in ""Ì Dresden
200mm Fab''). With the exception of the securities and certain patent infringement and antitrust claims
identified in ""Our Business Ì Legal Matters,'' for which different arrangements apply as described in that
section, we are obligated to indemnify Infineon against any liability arising in connection with the claims
described in that section. Finally, the contribution agreement in principle provides for us to bear 60% of the
total license fee payments payable by Infineon and us to which Infineon and we may agree in connection with
two cases in which negotiations relating to licensing and cross-licensing were ongoing at the time of the carve-
out, one of which is still ongoing. These payments could be substantial and could remain in effect for lengthy
periods. The contribution agreement does not limit the aggregate liability we may incur as a result of our
indemnification obligations, nor does it restrict the obligations to a certain time period after the carve-out as
long as the events giving rise to them occurred prior to the carve-out.
Costs and taxes; future tax liabilities
Infineon agreed to bear the costs and taxes in conjunction with entering into the contribution agreement,
while expenses incurred on or after May 1, 2006 are divided between Infineon and us. Infineon has agreed to
bear all tax liabilities arising in the future that relate to Memory Products businesses that were previously part
of legal entities that remain with Infineon for periods prior to the carve-out.
Contribution Agreement between Infineon Technologies Holding B.V. and Qimonda AG
Prior to our carve-out, Infineon Technologies Holding B.V. held the entire share capital of Qimonda
Holding B.V., an entity recently established to hold Infineon's equity in foreign companies that form part of
the Memory Products business. Pursuant to a separate contribution agreement we entered into with Infineon
Technologies Holding B.V., all shares in Qimonda Holding B.V. were contributed to us as of May 1, 2006. In
return for this contribution, we granted Infineon Technologies Holding B.V. 167,686,025 of our no-par value
ordinary registered shares. To issue these shares, we had previously increased our share capital from
4264,627,950 to 4600,000,000. Shares that were not either granted to Infineon or Infineon Technologies
Holding B.V. in connection with the carve-out are reflected in our capital reserves. The contribution by
Infineon Technologies Holding B.V. took legal effect as of its registration in the commercial register
(Handelsregister) at the local court (Amtsgericht) of Munich.
On July 17, 2006, Infineon Technologies Holding B.V. transferred its Qimonda shares, representing
approximately 55.9% of our total share capital, to its wholly-owned subsidiary Infineon Technologies
Investment B.V., a private limited liability company under Dutch law. In return, Infineon Technologies
Investment B.V. issued 50 of its shares with a nominal value of 41,000 each to Infineon Technologies Holding
B.V.
130
Global Reports LLC

Dresden 200mm Fab
The current production capacity for memory products of Infineon's Dresden 200mm fab is approximately
7,500 wafer starts per week, including a declining portion related to flash memory products which we plan to
phase out of production in our 2007 financial year. Infineon and we entered into an agreement for the
production of wafers in the Dresden 200mm fab. Pursuant to the agreement, Infineon has agreed to
manufacture certain specified semiconductor memory products at the Dresden 200mm fab, using our
manufacturing technologies and masks, and to sell them to us at prices specified in the agreement. We are
required under this agreement to pay for idle costs resulting from our purchasing fewer wafers from Infineon
than agreed upon, if Infineon cannot otherwise utilize the capacity. We are obliged to indemnify Infineon
against any third party claims based on or related to any products manufactured for us under this agreement.
In addition, we will have to indemnify Infineon against any intellectual property infringement claims related to
the products covered by the agreement. The agreement terminates on September 30, 2007 unless extended by
a written mutual agreement between Infineon and us.
We currently are in negotiations with Infineon regarding our use or acquisition, after September 30, 2007,
of capacity at Infineon's 200mm manufacturing facility in Dresden. Infineon and we have already agreed in
principle that we will share equally any potential restructuring costs arising in connection with one module.
The extent of these costs may include severance payments and costs relating to lower levels of production in
one module. Restructuring costs will depend on the extent of our capacity usage after September 30, 2007 and
the point in time when we stop purchasing products completely.
Ongoing Services Relationships
Prior to our carve-out, most of the administrative, financial, risk management, information technology
and other services that we required were provided centrally by Infineon. The Infineon Group will continue to
provide many of these services under services agreements described below. Infineon charged us 4119 million
for these services during the year ended September 30, 2006. The terms of these agreements may be less
favorable to us than they might have been had they been negotiated with unaffiliated third parties.
General Support Services
Framework Agreement on Standard Support Services
In connection with our carve-out, we entered into a Global Service Agreement (the ""GSA'') with
Infineon, which took effect as of our carve-out date and which serves as the framework under which we have
entered into individual standard service agreements, the most important of which are listed below. Under these
agreements, the Infineon Group and we intend to provide standard support services to one another. Certain
services in the areas of manufacturing, product supply and distribution, licensing, research and development,
accounting and information technology support, as well as comprehensive services provided to us by the
Infineon Group in specified countries, including Japan, have been covered under separate agreements.
Under the GSA, the service recipient agrees to pay the service provider a fee based on actual or estimated
total costs incurred plus a margin of 3% for the period from May 1, 2006 to September 30, 2006 and thereafter
as mutually agreed from year to year. For the 2007 financial year, Infineon and we agreed to retain the margin
of 3%. Unless otherwise agreed in individual service level agreements, the service provider may choose to
provide the services itself or through an affiliated or unaffiliated subcontractor. If the service provider chooses
to subcontract to a non-affiliate services it had previously provided itself, the service recipient must agree to
the subcontractor and the terms of the subcontract. If this agreement cannot be reached, the service level
agreement may be terminated with 90 days prior notice. Under the GSA, each service provider must perform
services using the level of care that it customarily applies in its own matters of a similar nature. Damages
under this agreement are payable only if caused by grossly negligent or malicious behavior and, in the case of
grossly negligent behavior, are subject to an annual cap represented by the total payments received by the
service provider under the relevant standard service agreement in the relevant calendar year. The GSA allows
either party to an individual standard service agreement to terminate that agreement upon 90 days written
notice, unless otherwise agreed in the individual agreement or in a subcontract between the service provider
131
Global Reports LLC

and a subcontractor, or upon 30 days written notice in case of default of the other party. The GSA will
terminate once all standard service agreements concluded under the GSA have expired or been terminated.
We generally expect the standard service agreements to terminate by the end of the 2007 financial year.
General Support Services
The general support services that Infineon has agreed to provide under the umbrella of the GSA, and
with respect to which Infineon and we have entered into individual standard service agreements include:
‚ sales support in various countries, most significantly France, Hong Kong, Ireland, Japan, Korea,
Switzerland, United Kingdom and the United States;
‚ logistics services, including call center services in Europe, logistics support services in the Asia-Pacific
region and freight forwarding services in the United States;
‚ purchasing services at locations and/or with respect to areas of expertise where we do not have
sufficient purchasing resources;
‚ human resources services, including recruiting, compensation and benefits, payroll, site health care and
training;
‚ facility management, including office and manufacturing space leasing, security, storage and transpor-
tation management;
‚ patent support, including patent administration, external support and reverse engineering;
‚ finance, accounting and treasury support, including risk management and back-office support, for as
long as we have not reached full staffing levels in this area;
‚ legal services;
‚ strategy services, including support relating to market research; and
‚ certain other services in which our staff still needs to develop expertise.
In addition we agreed to provide Infineon with purchasing services in locations where Infineon does not
have sufficient purchasing power, as well as with finance and treasury, tax, human resources and communica-
tions services under the GSA.
Other Services
Framework Agreements on Information Technology Services
We entered into two master information technology agreements with Infineon effective May 1, 2006.
Under the master information technology cost sharing agreement, Infineon and we agreed to share costs
of a variety of information technology services provided by one or both parties in the common interest and for
the common benefit of both parties. In general, the parties agreed to share the fixed costs of the services
provided (accounting for approximately 53% of total costs) roughly equally and to share variable costs in a
manner that reflects each party's contribution to those costs. The parties' respective shares of the variable
costs are subject to adjustment on an annual basis in accordance with the agreement. Any material or related
intellectual property rights created by the parties in the course of the performance of the agreement will be
jointly owned by each party, unless otherwise agreed to by the parties. Either party may terminate any
individual shared service upon 90 days written notice, unless otherwise agreed in a subcontract between the
service provider and a subcontractor. Any ramp down costs will be shared by the parties. The agreement will
terminate once all shared services provided under the agreement have expired or been terminated; neither
party can terminate a shared service for convenience prior to September 30, 2007.
Under the master information technology service agreement, Infineon and we agreed to provide
information technology services to one another. The scope of the services (generally including the designing,
building, module testing, documenting, deployment and rollout of IT projects), fees payable for the services
132
Global Reports LLC

and other service-specific provisions will be contained in individual ""statements of work'' entered into between
the Infineon and Qimonda entities providing and receiving the respective services. In general, the service
recipient pays a fee based on actual or estimated total costs incurred plus a margin of 3% for the period from
May 1, 2006 to September 30, 2006 and thereafter as mutually agreed from year to year. For the 2007
financial year, Infineon and we agreed to retain the margin of 3%. The agreement grants either party
termination rights upon 90 days written notice, unless otherwise agreed in the individual statements of work or
in a subcontract between the service provider and a subcontractor, or upon 30 days written notice in case of
default of the other party. Costs associated with an early termination by the service recipient will be borne by
the service recipient. The master information technology service agreement will terminate once all statements
of work concluded under the agreement have expired or been terminated. We generally expect the statements
of work to terminate by the end of the 2007 financial year.
Both agreements specify that, unless otherwise agreed in individual statements of work, the service
provider may choose to provide the services itself or through an affiliated or unaffiliated subcontractor. If the
service provider chooses to subcontract to a non-affiliate services it had previously provided itself, the service
recipient must agree to the subcontractor and the terms of the subcontract. If this agreement cannot be
reached, the relevant services may be terminated with 90 days prior notice. If a party chooses to terminate any
individual shared service or statement of work under either agreement, it is obligated to enter into a
termination assistance agreement with the other party, the purpose of which is to secure the operational
stability of the service during the wind down phase. Under both master agreements, each service provider must
perform services using the level of care that it customarily applies in its own matters of a similar nature.
Damages under both agreements are excluded to the extent legally permissible.
Framework Agreement on Research and Development Services
We have negotiated a global research and development services agreement with Infineon, which provides
a framework surrounding the provision of research and development services between Infineon on one hand
and Qimonda AG and its subsidiaries on the other hand. The service recipient agrees to pay the service
provider a fee based on actual or estimated total costs incurred (where total costs include depreciation on
equipment and tools as well as the cost of materials) plus a margin of 3% for the period from May 1, 2006 to
September 30, 2006 and thereafter as mutually agreed from year to year. For the 2007 financial year, Infineon
and we agreed to retain the margin of 3%. The agreement grants either party termination rights upon 90 days
notice, unless otherwise agreed in a subcontract between the service provider and a subcontractor.
Under the Global Research and Development Services Agreement, the deliverables to be developed by
the service provider are owned by the recipient of the deliverables, except as concerns background intellectual
property rights of the provider. The recipient grants the provider a non-exclusive, perpetual license to use the
deliverables and the relating intellectual property rights in its respective field of business. Expenses incurred in
research and development in connection with employee inventions are to be paid by the recipient of the
invention.
Special Services
In addition to the general services scheduled to be provided under the GSA, the information technology
services agreements and the research and development services agreement and the services provided under the
agreement for the production of wafers in the Dresden 200mm fab, Infineon intends to provide to us special
services, including manufacturing services for the supply of advanced module buffers for use in our modules.
Any other services not covered under the above agreements will be provided as mutually agreed on a
case-by-case basis.
With Management
A member of our Supervisory Board, Mr. Fischl, is a member of Infineon's Management Board and
another member of our Supervisory Board, Mr. von Eickstedt is Infineon's general counsel. See ""Manage-
ment Ì Supervisory Board Ì Supervisory Board Members.'' Two members of our Management Board,
133
Global Reports LLC

Dr. Majerus and Mr. Seifert, are members of the Board of Directors of Inotera Memories, Inc. our joint
venture with Nanya. Additionally, Dr. Majerus is a director of Infineon Technologies Suzhou Co., Ltd., our
manufacturing joint venture with CSVC. See ""Our Business Ì Strategic Alliances and Agreements'' for a
discussion of our relationship with Nanya, Inotera and CSVC.
We sometimes extend travel and moving expenses and other types of advances to our employees. As a
matter of policy, such advances are not provided to the members of our Supervisory Board and Management
Board. See Notes 14 and 27 to the combined and consolidated financial statements included elsewhere in this
annual report.
With Siemens
Until 1999, the entire business of Infineon, including the Memory Products business, formed the
Semiconductor Group of Siemens AG, a large German electronics conglomerate. In 1999, Siemens formed
Infineon as a separate legal entity, transferred its semiconductor business to Infineon, and conducted an initial
public offering of Infineon's ordinary shares with listing on the Frankfurt Stock Exchange and the New York
Stock Exchange. Siemens subsequently took a variety of steps to further reduce its ownership interest in
Infineon. On April 3, 2006 Siemens disposed of its remaining shares in Infineon. Transactions between us and
Siemens subsequent to this date are no longer reflected as related party transactions.
In the 2004 and 2005 financial years, 4% and 3% of our net sales resulted from direct sales to the
Siemens-Fujitsu joint venture, a member of the Siemens group, and in the 2006 financial year through to
Siemens' disposal of its remaining Infineon shares such sales amounted to 417 million. We believe that these
transactions are on terms no less favorable to us than we could obtain from third parties.
134
Global Reports LLC

ARTICLES OF ASSOCIATION
This section summarizes the material rights of holders of the shares of our company under German law
and the material provisions of our Articles of Association. This description is only a summary and does not
describe everything that the Articles of Association contain. Copies of the Articles of Association will be
publicly available from the Commercial Register in Munich, and an English translation is included as an
exhibit to this annual report.
Share Capital
The issued share capital of our company consists of 4684 million divided into 342 million individual
registered shares. The individual shares do not have a par value but they do have a notional value that can be
determined by dividing the share capital amount by the number of shares.
On July 27, 2006, our shareholders resolved to increase our share capital by 484 million against cash
contributions through the issuance of 42 million no-par value ordinary registered shares. The capital increase
became effective on August 8, 2006. Shareholders' preemptive rights were excluded.
Registrar Services GmbH, the transfer agent and registrar of our company in Germany, will register
record holders of shares in the share register on our behalf pursuant to a transfer agency agreement. The
transfer agent will also maintain the register of our shareholders.
Authorized Capital
Under the German Stock Corporation Act, a stock corporation's shareholders can authorize the
Management Board to issue shares in a specified aggregate nominal amount of up to 50% of the issued share
capital at the time the resolution becomes effective. The shareholders' authorization may extend for a period
of no more than five years after registration of the capital increase in the commercial register
(Handelsregister).
On July 14, 2006, our shareholders resolved to amend our Articles of Association to authorize the
Management Board to increase the share capital with the Supervisory Board's consent. The Management
Board may use this authorization until July 13, 2011 to increase the share capital by up to 430 million through
the issuance, in one or more tranches, of new ordinary registered shares with no par value against cash
contributions for the purpose of issuing shares to our and our subsidiaries' employees. Thereby, shareholders'
preemptive rights are excluded.
In addition on July 27, 2006, our shareholders resolved to amend the Articles of Association of our
company to authorize the Management Board to increase the share capital with the Supervisory Board's
consent against contributions in cash or in kind. The Management Board may use these authorizations until
July 26, 2011 to issue new shares in one or more tranches for any legal purpose:
in an aggregate amount of up to 4239.4 million in which case existing shareholders have pre-emptive
rights, which may be excluded in the following circumstances:
(i) to the extent that new shares must be granted to holders of subscription warrants or convertible
bonds that we have issued, in accordance with the terms of issuance of such warrants or
convertible bonds;
(ii) if (1) the new shares represent 10% or less of the existing share capital when the authorized
capital or issuance of the new shares is registered and (2) the issue price of the new shares is not
considerably less than the stock exchange price of the shares in our company; or
(iii) to the extent necessary to avoid balancing out fractional residual amounts;
In the case of a capital increase against contributions in kind, the Management Board may exclude the
shareholders' preemptive rights with the consent of the Supervisory Board.
Our authorized capital has become effective.
135
Global Reports LLC
Conditional Capital
Under the German Stock Corporation Act, a stock corporation's shareholders can authorize conditional
capital of up to 50% of the issued share capital at the time of the resolution. During our extraordinary
shareholders' meeting on July 14, 2006, our shareholders passed the following resolutions with regard to
conditional capital:
First, our share capital is conditionally increased by up to 412 million through the issuance of up to
6 million ordinary registered shares with no par value in connection with the employee stock option and share
purchase plans described above under ""Management Ì Employee Stock Option Program and Ì Employee
Share Purchase Programs.''
Second, our share capital is conditionally increased by up to 4240.1 million through the issuance of up to
120.05 million ordinary registered shares with no par value. This conditional capital may only be used in
connection with an issuance of a convertible bond, which our shareholders authorized by resolution of July 14,
2006.
These resolutions on conditional capital have become effective.
Preemptive Rights
Under the German Stock Corporation Act, an existing shareholder in a stock corporation has a
preferential right to subscribe for new shares to be issued by that corporation in proportion to the number of
shares he holds in the corporation's existing share capital. These rights do not apply to shares issued out of
conditional capital. Preemptive rights also apply to securities that may be converted into shares, securities with
warrants, profit-sharing certificates and securities with dividend rights. The German Stock Corporation Act
only allows the exclusion of this preferential right in limited circumstances. At least three quarters of the share
capital represented at the relevant shareholders' meeting must vote for exclusion. In addition to approval by
the shareholders, the exclusion of preemptive rights requires a justification. The justification must be based on
the principle that the interest of the company in excluding preemptive rights outweighs the shareholders'
interest in their preemptive rights.
Shareholders' Meetings and Voting Rights
A general meeting of the shareholders of our company may be called by the Management Board or, under
certain circumstances, by the Supervisory Board. Shareholders holding in the aggregate at least 5% of our
issued share capital may also require the Management Board to call a meeting. The annual general meeting
must take place within the first eight months of the financial year. The Management Board calls this meeting
upon the receipt of the Supervisory Board's report on the annual financial statements.
Under German law and the Articles of Association of our company, our company must publish
invitations to shareholders' meetings in the electronic version of the German Federal Gazette (elektronischerBundesanzeiger) at least thirty days before the last day on which the shareholders must notify our company
that they intend to attend the meeting (not counting the date of publication and the last day of notification).
A shareholder or group of shareholders holding a minimum of either 5% of the share capital of our
company or shares representing at least 4500,000 of its registered capital may require that additional items be
put on the agenda of our shareholders' general meeting.
Shareholders who are registered in the share register may participate in and vote at the shareholders'
general meeting. A notice by a shareholder of his intention to attend a shareholders' general meeting must be
given to our company at least six days (or a shorter period, if so determined by management) before the
meeting, not counting the day of notice and the day of the meeting. In certain cases, a shareholder can be
prevented from exercising his voting rights. This would be the case, for instance, for resolutions on the waiver
or assertion of a claim by our company against the shareholder.
Each share carries one vote at general meetings of the shareholders. Resolutions are generally passed with
a simple majority of the votes cast. Resolutions that require a capital majority are passed with a simple
136
Global Reports LLC

majority of the issued capital, unless statutory law or the Articles of Association of our company require
otherwise. Under the German Stock Corporation Act, a number of significant resolutions must be passed by a
majority of at least 75% of the share capital represented in connection with the vote taken on that resolution.
The majority required for some of these resolutions may be lowered by the Articles of Association. The
shareholders of our company have lowered the majority requirements to the extent permitted by law.
Although our company must notify shareholders of an ordinary or extraordinary shareholders' meeting as
described above, neither the German Stock Corporation Act nor the Articles of Association of our company
has a minimum quorum requirement. This means that holders of a minority of our shares could control the
outcome of resolutions not requiring a specified majority of the outstanding share capital of our company.
According to the Articles of Association of our company, resolutions to amend the Articles of Association
must be passed by at least a majority of the nominal capital represented at the meeting of shareholders at
which the resolution is considered. However, resolutions to amend the business purpose stated in the Articles
of Association of our company also require a majority of at least three-quarters of the share capital represented
at the meeting. The 75% majority requirement also applies to the following matters:
‚ the exclusion of preemptive rights in a capital increase;
‚ capital decreases;
‚ the creation of authorized capital or conditional capital;
‚ dissolution;
‚ a merger (Verschmelzung) with another company or another corporate transformation;
‚ a transfer of all or virtually all of the assets of our company; and
‚ the conclusion of any direct control, profit and loss pooling or similar intercompany agreements.
Dividend Rights
Shareholders participate in profit distributions in proportion to the number of shares they hold.
Under German law, our company may declare and pay dividends only from balance sheet profits as they
are shown in our company's unconsolidated annual financial statements prepared in accordance with
applicable German law. In determining the distributable balance sheet profits, the Management Board and
the Supervisory Board may allocate to profit reserves up to one half of the annual surplus remaining after
allocations to statutory reserves and losses carried forward. Under certain circumstances all or part of the
remaining half of the annual surplus may also be allocated to the statutory reserves.
The shareholders, in determining the distribution of profits, may allocate additional amounts to profit
reserves and may carry forward profits in part or in full.
Dividends approved at a shareholders' general meeting are payable on the first stock exchange trading day
after that meeting, unless otherwise decided at the shareholders' general meeting. If you hold shares that are
entitled to dividends through a clearing system, the dividends will be paid according to that clearing system's
rules. We will publish notice of dividends paid and the paying agent or agents that we have appointed in the
German Federal Gazette.
Liquidation Rights
In accordance with the German Stock Corporation Act, if we are liquidated, any liquidation proceeds
remaining after all of our liabilities have been paid off would be distributed among our shareholders in
proportion to their holdings.
137
Global Reports LLC
Repurchase of Our Own Shares
We may not acquire our own shares unless authorized by the shareholders' general meeting or in other
very limited circumstances set out in the German Stock Corporation Act. Shareholders may not grant a share
repurchase authorization lasting for more than 18 months. The rules in the German Stock Corporation Act
generally limit repurchases to 10% of our share capital and resales must be made either on a stock exchange,
in a manner that treats all shareholders equally or in accordance with the rules that apply to preemptive rights
relating to a capital increase. On July 27, 2006, our shareholders granted us such an authorization.
Corporate Purpose of Our Company
The corporate purpose of our company, described in section 2 of the Articles of Association, is direct or
indirect activity in the field of research, development, manufacture and marketing of electronic components,
electronic systems and software, as well as the performance of related services.
Registration of the Company with Commercial Register
Our company was entered into the commercial register of Munich, Germany, as a stock corporation on
May 25, 2004 under the number HRB 152545.
138
Global Reports LLC

ADDITIONAL INFORMATION
Group Structure
The following table shows information about our significant subsidiaries as of September 30, 2006:
Significant Subsidiaries
Proportion ofour
Country of ownershipCorporate Name Residence Field of activity interest
Qimonda Flash GmbHÏÏÏÏÏÏÏÏÏÏÏÏ Germany Research and Development 100%Qimonda Dresden GmbH & Co.
oHG ÏÏÏÏÏÏÏÏÏÏÏÏÏÏÏÏÏÏÏÏÏÏÏÏÏ Germany Production 100%Qimonda Holding B.V ÏÏÏÏÏÏÏÏÏÏÏÏ The Netherlands Holding 100%Qimonda Investment B.VÏÏÏÏÏÏÏÏÏÏ The Netherlands Holding 100%Qimonda Portugal S.A. ÏÏÏÏÏÏÏÏÏÏÏ Portugal Production 100%Infineon Technologies Flash Ltd. ÏÏÏ Israel Research and Development 100%Qimonda Richmond, LLCÏÏÏÏÏÏÏÏÏ United States Production 100%
United States Distribution, Sales & Marketing, 100%Qimonda North America Corp. ÏÏÏÏ Research and DevelopmentQimonda Asia Pacific Pte. Ltd. ÏÏÏÏ Singapore Distribution 100%Qimonda (Melaka) Sdn. Bhd ÏÏÏÏÏÏ Malaysia Production 100%Qimonda Module (Suzhou) Co.
Ltd. ÏÏÏÏÏÏÏÏÏÏÏÏÏÏÏÏÏÏÏÏÏÏÏÏÏ China Production 100%Qimonda Technologies (Suzhou)
Co., Ltd ÏÏÏÏÏÏÏÏÏÏÏÏÏÏÏÏÏÏÏÏÏÏ China Production 45%
Dividend Policy
We have not declared any cash dividends on our ordinary shares and have no present intention to pay
dividends on our ordinary shares in the foreseeable future. Any determination by our Supervisory and
Management Boards to pay dividends will depend on many factors, including our financial condition, results of
operations, legal requirements and other factors. We may also become subject to debt instruments or other
agreements that limit our ability to pay dividends.
Under the German Stock Corporation Act (Aktiengesetz), the amount of dividends available for
distribution to shareholders is based on the level of earnings (Bilanzgewinn) of the parent company,
Qimonda AG, as determined in accordance with the German Commercial Code. All dividends must be
approved by shareholders. No earnings are available for distribution as a dividend for the 2006 financial year,
since Qimonda AG, on a standalone basis, as the parent company, incurred a cumulative loss (Bilanzverlust)as of September 30, 2006 despite our consolidated profit for the financial year.
All of the shares currently represented by ADSs will have the same dividend rights as all of our other
outstanding shares of Qimonda AG. Any distribution of dividends jointly proposed by our Management and
Supervisory Boards requires the approval of our shareholders in a general meeting. The section ""Articles of
Association Ì Dividend Rights'' explains in more detail the procedures we must follow and the German law
provisions that determine whether we are entitled to declare a dividend.
For information regarding the German withholding tax applicable to dividends and related United States
refund procedures, see ""Taxation Ì German Taxation''.
Significant Changes
Except as discussed elsewhere in this annual report on Form 20-F, no significant change has occurred
since the date of the annual financial statements included in this annual report on Form 20-F.
139
Global Reports LLC

Market Information
General
The principal trading market for our company's ADSs, each representing one share, is the New York
Stock Exchange. The ADS trade under the symbol QI. All of our company's shares are in registered form.
The depositary for the ADSs is Citibank, N.A. We do not currently intend to list our shares or ADSs on any
stock exchange outside the United States.
Trading on the New York Stock Exchange
ADSs representing our company's shares have traded on the New York Stock Exchange since August 9,
2006. The table below sets forth, for the periods indicated, the high and low closing sales prices for the ADSs
on the New York Stock Exchange:
Price per ADS inU.S. dollars
High Low
August 2006 (beginning August 9) ÏÏÏÏÏÏÏÏÏÏÏÏÏÏÏÏÏÏÏÏÏÏÏÏÏÏÏÏÏÏÏÏÏÏÏÏÏÏÏ 16.28 13.54
September 2006 ÏÏÏÏÏÏÏÏÏÏÏÏÏÏÏÏÏÏÏÏÏÏÏÏÏÏÏÏÏÏÏÏÏÏÏÏÏÏÏÏÏÏÏÏÏÏÏÏÏÏÏÏÏÏÏ 17.91 15.90
October 2006 ÏÏÏÏÏÏÏÏÏÏÏÏÏÏÏÏÏÏÏÏÏÏÏÏÏÏÏÏÏÏÏÏÏÏÏÏÏÏÏÏÏÏÏÏÏÏÏÏÏÏÏÏÏÏÏÏÏ 17.50 13.82
November 2006 (through November 17)ÏÏÏÏÏÏÏÏÏÏÏÏÏÏÏÏÏÏÏÏÏÏÏÏÏÏÏÏÏÏÏÏÏÏ 17.58 14.00
On November 20, 2006, the closing sales price per ADS on the New York Stock Exchange was $15.85.
Exchange Rates
Fluctuations in the exchange rate between the euro and the U.S. dollar will affect the U.S. dollar
amounts received by owners of our ADSs on conversion of dividends, if any, paid in euro on the ordinary
shares and will affect the U.S. dollar price of our ADSs on the New York Stock Exchange. In addition, to
enable you to ascertain how the trends in our financial results might have appeared had they been expressed in
U.S. dollars, the table below shows the average exchange rates of U.S. dollars per euro for the periods shown.
Average rates are computed by using the noon buying rate of the Federal Reserve Bank of New York for the
euro on the last business day of each month during the period indicated.
Average exchange rates of the U.S. dollar per euro
Financial year ended September 30, Average
2002 ÏÏÏÏÏÏÏÏÏÏÏÏÏÏÏÏÏÏÏÏÏÏÏÏÏÏÏÏÏÏÏÏÏÏÏÏÏÏÏÏÏÏÏÏÏÏÏÏÏÏÏÏÏÏÏÏÏÏÏÏÏÏÏÏÏÏÏÏÏÏ 0.9192
2003 ÏÏÏÏÏÏÏÏÏÏÏÏÏÏÏÏÏÏÏÏÏÏÏÏÏÏÏÏÏÏÏÏÏÏÏÏÏÏÏÏÏÏÏÏÏÏÏÏÏÏÏÏÏÏÏÏÏÏÏÏÏÏÏÏÏÏÏÏÏÏ 1.0839
2004 ÏÏÏÏÏÏÏÏÏÏÏÏÏÏÏÏÏÏÏÏÏÏÏÏÏÏÏÏÏÏÏÏÏÏÏÏÏÏÏÏÏÏÏÏÏÏÏÏÏÏÏÏÏÏÏÏÏÏÏÏÏÏÏÏÏÏÏÏÏÏ 1.2174
2005 ÏÏÏÏÏÏÏÏÏÏÏÏÏÏÏÏÏÏÏÏÏÏÏÏÏÏÏÏÏÏÏÏÏÏÏÏÏÏÏÏÏÏÏÏÏÏÏÏÏÏÏÏÏÏÏÏÏÏÏÏÏÏÏÏÏÏÏÏÏÏ 1.2714
2006 ÏÏÏÏÏÏÏÏÏÏÏÏÏÏÏÏÏÏÏÏÏÏÏÏÏÏÏÏÏÏÏÏÏÏÏÏÏÏÏÏÏÏÏÏÏÏÏÏÏÏÏÏÏÏÏÏÏÏÏÏÏÏÏÏÏÏÏÏÏÏ 1.2316
140
Global Reports LLC

The table below shows the high and low Federal Reserve noon buying rates for euro in U.S. dollars per
euro for each month from January 2006 through November 17, 2006:
Recent high and low exchange rates of the U.S. dollar per euro
High Low
May 2006 ÏÏÏÏÏÏÏÏÏÏÏÏÏÏÏÏÏÏÏÏÏÏÏÏÏÏÏÏÏÏÏÏÏÏÏÏÏÏÏÏÏÏÏÏÏÏÏÏÏÏÏÏÏÏÏÏÏÏ 1.2888 1.2607
June 2006 ÏÏÏÏÏÏÏÏÏÏÏÏÏÏÏÏÏÏÏÏÏÏÏÏÏÏÏÏÏÏÏÏÏÏÏÏÏÏÏÏÏÏÏÏÏÏÏÏÏÏÏÏÏÏÏÏÏÏ 1.2953 1.2522
July 2006ÏÏÏÏÏÏÏÏÏÏÏÏÏÏÏÏÏÏÏÏÏÏÏÏÏÏÏÏÏÏÏÏÏÏÏÏÏÏÏÏÏÏÏÏÏÏÏÏÏÏÏÏÏÏÏÏÏÏÏ 1.2822 1.2500
August 2006 ÏÏÏÏÏÏÏÏÏÏÏÏÏÏÏÏÏÏÏÏÏÏÏÏÏÏÏÏÏÏÏÏÏÏÏÏÏÏÏÏÏÏÏÏÏÏÏÏÏÏÏÏÏÏÏÏ 1.2914 1.2735
September 2006 ÏÏÏÏÏÏÏÏÏÏÏÏÏÏÏÏÏÏÏÏÏÏÏÏÏÏÏÏÏÏÏÏÏÏÏÏÏÏÏÏÏÏÏÏÏÏÏÏÏÏÏÏÏ 1.2833 1.2648
October 2006 ÏÏÏÏÏÏÏÏÏÏÏÏÏÏÏÏÏÏÏÏÏÏÏÏÏÏÏÏÏÏÏÏÏÏÏÏÏÏÏÏÏÏÏÏÏÏÏÏÏÏÏÏÏÏÏ 1.2773 1.2502
November 2006 (through November 17)ÏÏÏÏÏÏÏÏÏÏÏÏÏÏÏÏÏÏÏÏÏÏÏÏÏÏÏÏÏÏÏÏ 1.2835 1.2705
The noon buying rate of the Federal Reserve Bank of New York for euro was 41.00 • $1.2687 on
September 29, 2006, the last currency trading day in September 2006. The noon buying rate of the Federal
Reserve Bank of New York on November 17, 2006 was 41.00 • $1.2823.
Taxation
German Taxation
The following is a summary discussion of the material German tax consequences for holders of ADSs
who are not resident in Germany for income tax purposes and who do not hold ADSs as business assets of a
permanent establishment or fixed base in Germany (""Non-German Shareholders''). The discussion does not
purport to be a comprehensive description of all the tax considerations that may be relevant to a decision to
invest in or hold our ADSs. The discussion is based on the tax laws of Germany as in effect on the date of this
annual report, which may be subject to change at short notice and, within certain limits, possibly also with
retroactive effect. You are advised to consult your tax advisors in relation to the tax consequences of the
acquisition, holding and disposition or transfer of ADSs and in relation to the procedure which needs to be
observed in the event of a possible reduction or refund of German withholding taxes. Only these advisors are in
a position to duly consider your specific tax situation.
Taxation of the Company
In principle, German corporations are subject to corporate income tax at a rate of 25%. This tax rate
applies irrespective of whether profits are distributed or retained. Solidarity surcharge of 5.5% is levied on the
assessed corporate income tax liability, so that the combined effective tax burden of corporate income tax and
solidarity surcharge is 26.375%. Certain foreign source income is exempt from corporate income tax.
Generally, any dividends received by us and capital gains realized by us on the sale of shares in other
corporations will also be exempt from corporate income tax. However, 5% of such dividends and capital gains
are considered nondeductible business expenses.
In addition, German corporations are subject to a profit-based trade tax, the exact amount of which
depends on the municipality in which the corporation conducts its business. Trade tax is a deductible item in
calculating the corporation's tax base for corporate income and trade tax purposes.
According to a minimum taxation regime applicable as of 2004, not more than 41 million plus 60% of the
amount exceeding 41 million of the income of one fiscal year may be offset against tax losses carried forward.
Taxation of Dividends
Tax must be withheld at a rate of 20% plus solidarity surcharge of 5.5% (in total 21.1%) on dividends paid
(if any).
141
Global Reports LLC

Pursuant to most German tax treaties, including the income tax treaty between Germany and the United
States (the ""Treaty'') the German withholding tax may not exceed 15% of the dividends received by Non-
German Shareholders who are eligible for treaty benefits. The difference between the withholding tax
including solidarity surcharge that was levied and the maximum rate of withholding tax permitted by an
applicable tax treaty is refunded to the shareholder by the German Federal Tax Office (Bundeszentralamt f urSteuern, An der K uppe 1, D-53225 Bonn, Germany) upon application. Forms for a refund application are
available from the German Federal Tax Office or the German embassies and consulates in the various
countries. A further reduction applies pursuant to most tax treaties if the shareholder is a corporation which
holds a stake of 25% or more, and in some cases (including under the Treaty) of 10% or more, of the
registered share capital (or according to some tax treaties of the votes) of a company. If the shareholder is a
parent company resident in the European Union as defined in Directive No. 90/435/EEC of the Council of
July 23, 1990 (the so-called Parent-Subsidiary Directive), upon application and subject to further require-
ments, no tax may have to be withheld at all.
Withholding Tax Refund for U.S. Shareholders
U.S. shareholders who are eligible for treaty benefits under the Treaty (as discussed below in
""Ì United States Taxation'') are entitled to claim a refund of the portion of the otherwise applicable 20%
German withholding tax and 5.5% solidarity surcharge on dividends that exceeds the applicable Treaty rate
(generally 15%).
For ADSs kept in custody with the Depository Trust Company in New York or one of its participating
banks, the German tax authorities have introduced a collective procedure for the refund of German dividend
withholding tax and solidarity surcharge thereon. Under this procedure, the Depository Trust Company may
submit claims for refunds payable to U.S. shareholders under the Treaty collectively to the German tax
authorities on behalf of these U.S. shareholders. The German Federal Tax Office will pay the refund amounts
on a preliminary basis to the Depository Trust Company, which will redistribute these amounts to the U.S.
shareholders according to the regulations governing the procedure. The Federal Tax Office may review
whether the refund was made in accordance with the law within four years after making the payment to the
Depository Trust Company. Details of this collective procedure are available from the Depository Trust Com-
pany. This procedure is currently permitted by German tax authorities but that permission may be revoked, or
the procedure may be amended, at any time in the future.
Individual claims for refunds may be made on a special German form, which must be filed with the
German Federal Tax Office (Bundeszentralamt f ur Steuern, An der K uppe 1, D-53225 Bonn, Germany)
within four years from the end of the calendar year in which the dividend is received. Copies of the required
forms may be obtained from the German tax authorities at the same address or from the Embassy of the
Federal Republic of Germany, 4645 Reservoir Road, NW, Washington D.C. 20007-1998. As part of the
individual refund claim, a U.S. shareholder must submit to the German tax authorities the original
withholding certificate (or a certified copy thereof) issued by the paying agent documenting the tax withheld
and an official certification of United States tax residency on IRS Form 6166. IRS Form 6166 generally may
be obtained by filing a properly completed IRS Form 8802 with the Internal Revenue Service, Philadelphia
Service Center, U.S. Residency Certification Request, P.O. Box 16347, Philadelphia, PA 19114-0447.
Requests for certification must include the U.S. shareholder's name, Social Security Number or Employer
Identification Number, the number of the form on which the tax return was filed and the tax period for which
the certification is requested. The Internal Revenue Service will send the certification on IRS Form 6166 to
the U.S. shareholder who then must submit the certification with the claim for refund.
Taxation of Capital Gains
Generally, capital gains from the disposition of ADSs realized by a Non-German shareholder are only
subject to German tax if such shareholder at any time during the five years preceding the disposition, directly
or indirectly, held an interest of 1% or more in a company's issued share capital. If the shareholder has
acquired the ADSs without consideration, the previous owner's holding period and size of shareholding will
also be taken into account.
142
Global Reports LLC

If the shareholder is an individual, one half of the capital gain will generally be taxable. If the shareholder
is a corporation, effectively 5% of the capital gain will generally be taxable. However, most German tax
treaties, including the Treaty, provide that Non-German Shareholders who are beneficiaries under the
respective treaty are generally not subject to German tax even under the circumstances described in the
preceding paragraph. See the discussion regarding shareholders that generally are eligible for benefits under
the Treaty in ""Ì United States Taxation,'' below.
Special rules may apply to certain companies of the finance or insurance sector (including pension funds)
that are not protected from German tax under a tax treaty.
Inheritance and Gift Tax
Under German domestic law, the transfer of ADSs will be subject to German inheritance or gift tax on a
transfer by reason of death or as a gift if:
(a) the donor or transferor or the heir, donee or other beneficiary is resident in Germany at the time
of the transfer, or, if a German citizen, was not continuously outside of Germany and without German
residence for more than five years; or
(b) at the time of the transfer, the ADSs are held by the decedent or donor as assets of a business
for which a permanent establishment is maintained or a permanent representative is appointed in
Germany; or
(c) the decedent or donor has held, alone or together with related persons, directly or indirectly,
10% or more of a company's registered share capital at the time of the transfer.
The few presently existing German estate tax treaties (e.g., the Estate Tax Treaty with the United
States) usually provide that German inheritance or gift tax may only be imposed in cases (a) and (b) above.
Other Taxes
There are no transfer, stamp or similar taxes which would apply to the sale or transfer of the ADSs in
Germany. Net worth tax is no longer levied in Germany.
United States Taxation
This section is a summary, under current law, of the material U.S. federal income tax considerations
relevant to an investment by a U.S. shareholder in the ADSs. This summary applies only to holders that are
eligible for benefits as U.S. residents under the Treaty in respect of their investment in the ADSs (""U.S.
shareholders''). In general, a shareholder will be eligible for such benefits if the shareholder:
(i) is:
‚ an individual U.S. citizen or resident;
‚ a U.S. corporation; or
‚ a partnership, estate, or trust to the extent the shareholder's income is subject to taxation in the
United States as the income of a resident, either in the shareholder's hands or in the hands of the
shareholder's partners or beneficiaries;
(ii) is not also a resident of Germany for German tax purposes;
(iii) is the beneficial owner of the ADSs (and the dividends paid with respect thereto);
(iv) holds the ADSs as a capital asset for tax purposes;
(v) does not hold the ADSs in connection with the conduct of business through a permanent
establishment, or the performance of personal services through a fixed base, in Germany; and
(vi) is not subject to an anti-treaty shopping provision in the Treaty that applies in limited circumstances.
143
Global Reports LLC

This summary does not purport to be a comprehensive description of all of the tax considerations that
may be relevant to any particular investor, and does not address the tax treatment of investors who are subject
to special rules, such as financial institutions and persons whose functional currency is not the U.S. dollar. It is
based upon the assumption that prospective shareholders are familiar with any special tax rules to which they
may be subject. Prospective purchasers should consult their own tax advisers concerning the U.S. federal,
state, local and other national tax consequences of purchasing, owning and disposing of the ADSs in light of
their particular circumstances.
In general, for U.S. federal income tax purposes and for purposes of the Treaty, holders of ADSs will be
treated as the owners of our shares represented by those ADSs.
Taxation of Dividends
U.S. shareholders must include the gross amount of cash dividends paid in respect of the ADSs, without
reduction for German withholding tax, in ordinary income on the date that they are treated as having received
them, translating dividends paid in euro into U.S. dollars using an exchange rate in effect on that date.
Subject to certain exceptions for short-term and hedged positions, the U.S. dollar amount of dividends
received by a non-corporate U.S. shareholder with respect to the ADSs before January 1, 2011 will be subject
to taxation at a maximum rate of 15% if the dividends are ""qualified dividends''. Dividends received with
respect to the ADSs will be qualified dividends if the company (i) is eligible for the benefits of a
comprehensive income tax treaty with the United States that the IRS has approved for the purposes of the
qualified dividend rules and (ii) was not, in the year prior to the year in which the dividend was paid, and is
not, in the year in which the dividend is paid, a passive foreign investment company (""PFIC''). The Treaty
has been approved for the purposes of the qualified dividend rules. Based on the company's audited financial
statements and relevant market and shareholder data, the company believes that it was not treated as a PFIC
for U.S. federal income tax purposes with respect to its 2005 taxable year. In addition, based on its audited
financial statements and its current expectations regarding the value and nature of its assets, the sources and
nature of its income, and relevant market and shareholder data, the company does not anticipate becoming a
PFIC for its 2006 taxable year or in the foreseeable future.
German tax withheld from dividends will be treated, up to the 15% rate provided under the Treaty, as a
foreign income tax that, subject to generally applicable limitations under U.S. tax law, is eligible for credit
against the U.S. federal income tax liability of U.S. shareholders or, if they have elected to deduct such taxes,
may be deducted in computing taxable income. As discussed in the preceding section regarding German
Taxation, German withholding tax will generally be imposed at a rate of 20% plus solidarity surcharge of 5.5%
(in total 21.1%). However, U.S. taxpayers who qualify for benefits under the Treaty as discussed above may
request a refund of German tax withheld in excess of the 15% rate provided in the treaty. Fluctuations in the
dollar-euro exchange rate between the date that U.S. shareholders receive a dividend and the date that they
receive a related refund of German withholding tax may give rise to foreign currency gain or loss, which
generally is treated as ordinary income or loss for U.S. tax purposes.
Taxation of Sales or Other Taxable Dispositions
Sales or other taxable dispositions by U.S. shareholders of ADSs generally will give rise to capital gain or
loss equal to the difference between the U.S. dollar value of the amount realized on the disposition and the
U.S. shareholder's U.S. dollar basis in the ADSs. Any such capital gain or loss will be long-term capital gain
or loss, subject to taxation at reduced rates for non-corporate taxpayers, if the ADSs were held for more than
one year. The deductibility of capital losses is subject to limitations.
Information Reporting and Backup Withholding
Dividends paid in respect of ADSs, and payments of the proceeds of a sale of ADSs, paid within the
United States or through certain U.S.-related financial intermediaries are subject to information reporting and
may be subject to backup withholding unless the holder (i) is a corporation or other exempt recipient or
(ii) provides a taxpayer identification number and certifies that no loss of exemption from backup withholding
144
Global Reports LLC

has occurred. Holders that are not U.S. persons generally are not subject to information reporting or backup
withholding. However, such a holder may be required to provide a certification to establish its non-U.S. status
in connection with payments received within the United States or through certain U.S.-related financial
intermediaries (generally an IRS Form W-8BEN). Backup withholding is not an additional tax. Amounts
withheld as backup withholding may be credited against a holder's U.S. federal income tax liability. A holder
may obtain a refund of any excess amounts withheld under the backup withholding rules by filing the
appropriate claim for a refund with the IRS and furnishing any required information.
Exchange Controls and Limitations Affecting Shareholders
Germany does not currently restrict the movement of capital between Germany and other countries
except for a strict prohibition of investments in Burma, which has been established by European Union
regulation.
For statistical purposes, with some exceptions, every corporation or individual residing in Germany must
report to the German Central Bank any payment received from or made to a non-resident corporation or
individual if the payment exceeds 412,500 (or the equivalent in a foreign currency). Additionally, corporations
and individuals residing in Germany must report to the German Central Bank any claims of a resident
corporation or individual against, or liabilities payable to, a non-resident corporation or individual exceeding an
aggregate of 41.5 million (or the equivalent in a foreign currency) at the end of any calendar month.
Neither German law nor our Articles of Association restricts the right of non-resident or foreign owners
of shares to hold or vote the shares.
Documents on Display
Our Company is subject to the informational requirements of the Securities Exchange Act of 1934 as
amended. We file reports and other information with the Securities and Exchange Commission. Such reports
and other information, including this annual report and its exhibits, can be inspected and copied at the public
reference facilities of the SEC located at the SEC's Public Reference Room at 100 F Street, N.E.,
Washington, D.C. 20549. The public may obtain information on the operation of the SEC's Public Reference
Room by calling the SEC in the United States at 1-800-SEC-0330. The SEC also maintains a web site at
http://www.sec.gov that contains reports and other information regarding registrants that file electronically
with the SEC.
Controls and Procedures
Our management, with the participation of our chief executive officer and chief financial officer,
evaluated the effectiveness of our company's disclosure controls and procedures (as defined in
Rules 13a-15(e) and 15d-15(e) under the Exchange Act) as of September 30, 2006. Based on this evaluation,
our chief executive officer and chief financial officer concluded that, as of September 30, 2006, our company's
disclosure controls and procedures were (1) designed to ensure that material information relating to Qimonda,
including its consolidated subsidiaries, is made known to our chief executive officer and chief financial officer
by others within those entities, as appropriate, to allow timely decisions regarding required disclosure and
(2) effective, in that they provide reasonable assurance that information required to be disclosed by Qimonda
in the reports that it files or submits under the Exchange Act is recorded, processed, summarized and reported
within the time periods specified in the SEC's rules and forms.
No change in our internal control over financial reporting (as defined in Rules 13a-15(f) and 15d-15(f)
under the Exchange Act) occurred during the financial year ended September 30, 2006 that has materially
affected, or is reasonably likely to materially affect, our internal control over financial reporting.
There are inherent limitations to the effectiveness of any system of disclosure and internal controls,
including the possibilities of faulty judgments in decision-making, simple error or mistake, fraud, the
circumvention of controls by individual acts or the collusion of two or more people, or management override of
controls. Accordingly, even an effective disclosure and internal control system can provide only reasonable
145
Global Reports LLC

assurance with respect to disclosures and financial statement preparation. Furthermore, because of changes in
conditions, the effectiveness of a disclosure and internal control system may vary over time.
Use of Proceeds
On August 8, 2006, a registration statement (Registration No. 333-135913) relating to our initial public
offering was declared effective by the Securities and Exchange Commission. Under this registration
statement, we registered 72,450,000 of our ordinary shares. A maximum of 42,000,000 ordinary shares
registered were to be offered by us at a proposed aggregate offering price of $756,000,000, and a maximum of
30,450,000 of the ordinary shares registered were to be offered by Infineon Technologies AG, including
9,450,000 shares subject to the underwriters' over-allotment option, at a proposed aggregate offering price of
$548,100,000. A total of 48,300,000 ordinary shares registered under the registration statement were
ultimately sold in the United States (in the form of American Depositary Shares, or ADSs). 42,000,000
ADSs were sold by us at an aggregate offering price of $546,000,000 and 6,300,000 ADSs covered by the over-
allotment option were sold by Infineon Technologies AG at an aggregate offering price of $81,900,000. The
offering was completed on August 9, 2006. The underwriters were Credit Suisse Securities (USA) LLC,
Citigroup Global Markets Inc., J.P. Morgan Securities, Inc., ABN AMRO Rothschild, Bayerische Hypo- und
Vereinsbank AG and Deutsche Bank Securities Inc.
The aggregate net proceeds to us from the offering were approximately 4415 million, net of offering costs
and net of tax benefits thereon. We paid $16.38 million in total underwriting discounts and commissions paid
to the underwriters, total underwriters' expenses of $750,000 and an estimated $9.65 million in other expenses
incurred in connection with the offering. No amount of these expenses was paid to our directors and officers,
our major shareholders or our affiliates. We intend to use the net offering proceeds of 4415 million to finance
investments in our manufacturing facilities, for research and development, some of these proceeds have
already been used in investment and R&D activities and for working capital purposes since our IPO. The
remainder is being held in cash, cash equivalents and marketable securities pending application.
Audit Committee Financial Expert
Our Supervisory Board has determined that Mr. Fischl is an ""audit committee financial expert'', as such
term is defined in item 16A(b) of Form 20-F. Mr. Fischl is exempt from the independence provided by
Rule 10A-3 of the Exchange Act. For more information, please see ""Item 16D. Exemptions from the Listing
Standards for Audit Committees''.
Principal Accountant Fees and Services
Audit Fees. KPMG, our auditors, charged us an aggregate of 43.4 million for the 2006 financial year in
connection with professional services rendered for the audit of our annual consolidated financial statements
and services normally provided by them in connection with statutory and regulatory filings or other compliance
engagements, including audit services to our initial public offering. These services consisted of quarterly
review engagements and the annual audit.
Audit-Related Fees. In addition to the amounts described above, KPMG charged us an aggregate of
three thousand euro in the 2006 financial year for compliance work on subsidies in connection with the
performance of our audit.
Tax Fees. KPMG did not charge us any amounts in the 2006 financial year for professional services
related primarily to tax compliance.
All Other Fees. KPMG did not charge us any amounts in the 2006 financial year for other professional
services.
The above services fall within the scope of audit and permitted non-audit services within the meaning of
section 201 of the Sarbanes-Oxley Act of 2002. Our Investment, Finance and Audit Committee has pre-
approved KPMG's performance of these audit and permitted non-audit services and set limits on the types of
services and the maximum cost of these services in any financial year. KPMG reports to our Investment,
146
Global Reports LLC
Finance and Audit Committee on an annual basis on the type and extent of non-audit services provided during
the period and compliance with these criteria.
Code of Ethics
We have adopted a code of ethics (as a part of our ""Business Conduct Guidelines'') that applies to all of
our employees worldwide, including our principal executive officer, principal financial officer and principal
accounting officer within the meaning of Item 16B of Form 20-F. These guidelines provide rules and conduct
guidelines aimed at ensuring high ethical standards throughout our organization. You may obtain a copy of our
code of ethics, at no cost, by writing to us at Qimonda AG, Gustav-Heinemann-Ring 123, D-81739 Munich,
Germany, Attention: Legal Department.
Exemptions from the Listing Standards for Audit Committee
We rely on the exemptions afforded by Rule 10A-3(b)(1)(iv)(B) and Rule 10A-3(b)(1)(iv)(C) under
the Securities and Exchange Act of 1943, as amended. We believe that such reliance does not materially
adversely affect the ability of our audit committee to act independently or to satisfy the other requirements of
rule 10A-3.
Material Contracts
Contracts that are material to us are described in ""Operating and Financial Review Ì Capital Require-
ments Ì Credit Facilities'', ""Our Business Ì Strategy Alliances and Agreements'' and ""Related Party
Transactions and Relationships Ì with Infineon''.
147
Global Reports LLC
GLOSSARY
ADSs ÏÏÏÏÏÏÏÏÏÏÏÏÏÏÏÏÏÏÏÏÏÏÏÏÏÏÏÏ American Depositary Shares. ADSs are securities issued by a
depositary that represent ownership interests in underlying ordinary
shares held by the depositary's custodian. ADSs may be evidenced
by American Depositary Receipts (ADRs). Each Qimonda AG
ADS represents one ordinary share.
Advanced Memory Buffer (AMB) ÏÏÏ A logic chip that enables high speed communication between the
memory controller and a fully buffered DIMM in a server system.
back-end ÏÏÏÏÏÏÏÏÏÏÏÏÏÏÏÏÏÏÏÏÏÏÏÏÏ The packaging, assembly and testing stages of the semiconductor
manufacturing process, which take place after electronic circuits
are imprinted on silicon wafers in the front-end process.
bit ÏÏÏÏÏÏÏÏÏÏÏÏÏÏÏÏÏÏÏÏÏÏÏÏÏÏÏÏÏÏÏ A unit of information; a computational quantity (binary pulse) that
can take one of two values, such as true and false or 0 and 1; also
the smallest unit of storage sufficient to hold one bit.
byteÏÏÏÏÏÏÏÏÏÏÏÏÏÏÏÏÏÏÏÏÏÏÏÏÏÏÏÏÏÏ A unit of measurement equal to eight bits.
Computer Aided Design (CAD) ÏÏÏÏÏ A designation of software tools used in the design of integrated
circuits.
capacitorÏÏÏÏÏÏÏÏÏÏÏÏÏÏÏÏÏÏÏÏÏÏÏÏÏÏ An electronic device that stores electrical charges. Capacitors are
used to store information in a DRAM chip.
cell ÏÏÏÏÏÏÏÏÏÏÏÏÏÏÏÏÏÏÏÏÏÏÏÏÏÏÏÏÏÏ A primary unit that normally repeats many times in an integrated
circuit. Cells represent individual functional design units or circuits
that may be reused as blocks in designs. For example, a memory
cell represents a storage unit in a memory array.
chipÏÏÏÏÏÏÏÏÏÏÏÏÏÏÏÏÏÏÏÏÏÏÏÏÏÏÏÏÏÏ Popular term describing a section of a wafer that contains a
discrete component or an integrated circuit. Also called a ""die''.
circuit ÏÏÏÏÏÏÏÏÏÏÏÏÏÏÏÏÏÏÏÏÏÏÏÏÏÏÏÏ A combination of electrical or electronic components, intercon-
nected to perform one or more functions.
clean roomÏÏÏÏÏÏÏÏÏÏÏÏÏÏÏÏÏÏÏÏÏÏÏÏ An area within a fab in which the wafer fabrication takes place.
The classification of a clean room relates to the maximum number
of particles of contaminants per cubic foot within that room. For
example, a class 100 clean room contains fewer than 100 particles
of contaminants per cubic foot.
DDR SDRAM ÏÏÏÏÏÏÏÏÏÏÏÏÏÏÏÏÏÏÏÏ Double Data Rate SDRAM. A form of DRAM chip that activates
output on both the rising and falling edge of the system clock
rather than on just the rising edge, potentially doubling output.
DDR2 SDRAM ÏÏÏÏÏÏÏÏÏÏÏÏÏÏÏÏÏÏÏ Double Data Rate 2 SDRAM is an enhanced form of DDR
SDRAM that offers higher data transfer rates compared to its
predecessor.
DDR3 SDRAM ÏÏÏÏÏÏÏÏÏÏÏÏÏÏÏÏÏÏÏ Double Data Rate 3 SDRAM. Successor to DDR2 SDRAM
currently in advanced stages of development.
Die ÏÏÏÏÏÏÏÏÏÏÏÏÏÏÏÏÏÏÏÏÏÏÏÏÏÏÏÏÏÏ A chip.
Dual Inline Memory Module
(DIMM) ÏÏÏÏÏÏÏÏÏÏÏÏÏÏÏÏÏÏÏÏÏÏÏÏÏ A type of printed circuit board composed of DRAM chips
mounted on a circuit board in a particular configuration.
148
Global Reports LLC
Dynamic Random Access Memory
(DRAM)ÏÏÏÏÏÏÏÏÏÏÏÏÏÏÏÏÏÏÏÏÏÏÏÏÏ The most common type of random access memory. Each bit of
information is stored as an amount of electrical charge in a storage
cell consisting of a capacitor and a transistor. The capacitor
discharges gradually due to leakage and the memory cell loses the
information stored. To preserve the information, the memory has
to be refreshed periodically and is therefore referred to as ""dy-
namic''. DRAM is the most widespread memory technology be-
cause of its high memory density and relatively low price.
fab ÏÏÏÏÏÏÏÏÏÏÏÏÏÏÏÏÏÏÏÏÏÏÏÏÏÏÏÏÏÏ A semiconductor fabrication facility, in which the front-end manu-
facturing process takes place.
feature size ÏÏÏÏÏÏÏÏÏÏÏÏÏÏÏÏÏÏÏÏÏÏÏ A measurement (generally in micron or nm) of the width of the
smallest patterned feature or circuit on a semiconductor chip.
flash memoryÏÏÏÏÏÏÏÏÏÏÏÏÏÏÏÏÏÏÏÏÏÏ A type of non-volatile memory that can be erased and
reprogrammed.
front-end ÏÏÏÏÏÏÏÏÏÏÏÏÏÏÏÏÏÏÏÏÏÏÏÏÏ The wafer processing stage of the semiconductor manufacturing
process, in which electronic circuits are imprinted onto raw silicon
wafers. This is followed by the packaging, assembly and testing
stages, which comprise the back-end process.
foundryÏÏÏÏÏÏÏÏÏÏÏÏÏÏÏÏÏÏÏÏÏÏÏÏÏÏÏ A semiconductor manufacturer that makes chips for third parties.
gigabit (Gb) ÏÏÏÏÏÏÏÏÏÏÏÏÏÏÏÏÏÏÏÏÏÏ Approximately one billion bits (1,073,741,824 bits). Generally
used to indicate the storage capacity (or density) of memory chips.
gigabyte (GB)ÏÏÏÏÏÏÏÏÏÏÏÏÏÏÏÏÏÏÏÏÏ Approximately one billion bytes (1,073,741,824 bytes). Generally
used to indicate the storage capacity (or density) of memory
modules.
Integrated Circuit (IC) ÏÏÏÏÏÏÏÏÏÏÏÏÏ An electronic circuit in which all elements of the circuit are
integrated on a single semiconductor device.
ISOÏÏÏÏÏÏÏÏÏÏÏÏÏÏÏÏÏÏÏÏÏÏÏÏÏÏÏÏÏÏ International Standards Organization. The international organiza-
tion responsible for developing and maintaining worldwide stan-
dards for manufacturing, environmental protection, computers,
data communications and many other fields.
libraryÏÏÏÏÏÏÏÏÏÏÏÏÏÏÏÏÏÏÏÏÏÏÏÏÏÏÏÏ The collection of representations required by various design tools.
The representations, such as symbol, simulation model, layout
abstract, and transistor schematic, are used by different tools in the
design system to create or analyze some portion of an IC or
otherwise aid in the design process. Creating a design library
requires inserting the fabrication technologies in the design system
in a form that allows designers to create circuits in the most
efficient manner.
logic ÏÏÏÏÏÏÏÏÏÏÏÏÏÏÏÏÏÏÏÏÏÏÏÏÏÏÏÏÏ One of the three major classes of integrated circuits (along with
processors and memory). Logic ICs are used for data manipulation
and control functions.
maskÏÏÏÏÏÏÏÏÏÏÏÏÏÏÏÏÏÏÏÏÏÏÏÏÏÏÏÏÏ A transparent glass or quartz plate covered with an array of
patterns used in the IC manufacturing process to create circuitry
patterns on a wafer. Each pattern consists of opaque and transpar-
ent areas that define the size and shape of all circuit and device
elements. The mask is used to expose selected areas, and defines
149
Global Reports LLC

the areas to be processed. Masks may use emulsion, chrome, iron
oxide, silicon or other material to produce the opaque areas.
megabit (Mb)ÏÏÏÏÏÏÏÏÏÏÏÏÏÏÏÏÏÏÏÏÏ Approximately one million bits (1,048,576 bits). Generally used to
indicate the storage capacity (or density) of memory chips.
megabyte (MB) ÏÏÏÏÏÏÏÏÏÏÏÏÏÏÏÏÏÏÏ Approximately one billion bytes (1,048,576 bytes). Generally used
to indicate the storage capacity (or density) of memory modules.
memory semiconductorsÏÏÏÏÏÏÏÏÏÏÏÏÏ Semiconductors that store data in digital form.
NAND flash ÏÏÏÏÏÏÏÏÏÏÏÏÏÏÏÏÏÏÏÏÏÏ A type of flash memory commonly used for mass storage applica-
tions such as digital audio players and digital cameras.
nanometer (nm) ÏÏÏÏÏÏÏÏÏÏÏÏÏÏÏÏÏÏÏ A metric unit of linear measure that equals one billionth of a meter
(or 1/1,000th of a micron). This unit of measurement is com-
monly used to indicate the width of the smallest patterned feature
or circuit on a semiconductor chip (the so-called feature size).
non-volatile memoryÏÏÏÏÏÏÏÏÏÏÏÏÏÏÏÏ A type of semiconductor memory that retains data even when
electrical power is shut off.
NOR flashÏÏÏÏÏÏÏÏÏÏÏÏÏÏÏÏÏÏÏÏÏÏÏÏ A type of flash memory commonly used for the storage of code
data, such as the software instructions in a mobile phone.
NROM» Flash ÏÏÏÏÏÏÏÏÏÏÏÏÏÏÏÏÏÏÏÏ Nitrided Read Only Memory. A flash technology that can store
two bits per cell. Charges are locally separated on both ends of the
memory transistor cell. This compares with other non-volatile
technologies like floating gate technology, which store one or two
bits by different charge amounts spread over the whole transistor
cell.
OEM ÏÏÏÏÏÏÏÏÏÏÏÏÏÏÏÏÏÏÏÏÏÏÏÏÏÏÏÏ Original Equipment Manufacturer. A company that acquires a
product or component and reuses or incorporates it into a new
product with its own brand name.
package ÏÏÏÏÏÏÏÏÏÏÏÏÏÏÏÏÏÏÏÏÏÏÏÏÏÏ The protective container of an electronic component or die, with
external terminals to provide electrical access to the components
inside.
photolithography ÏÏÏÏÏÏÏÏÏÏÏÏÏÏÏÏÏÏÏ A step in the front-end process of semiconductor manufacturing in
which a form of ultraviolet light is used to draw a pattern of an IC
on a silicon wafer. The sophistication of this process and the related
equipment determines the achievable feature sizes on memory
chips, and therefore is a key determinant in the ability of manufac-
turers continuously to improve the capacity (or density) of mem-
ory ICs.
process technology ÏÏÏÏÏÏÏÏÏÏÏÏÏÏÏÏÏ The procedures used in the front-end process to convert raw silicon
wafers into finished wafers containing hundreds or thousands of
chips.
Random Access Memory (RAM) ÏÏÏÏ A type of digital memory that functions as the main workspace of a
computer. The order of access to bits at different locations does not
affect the speed of access (and is therefore ""random''). This is in
contrast to, for example, a magnetic or optical disk or magnetic
tape, which are used for long-term storage of data on a computer,
but which are too slow to be used for primary workspace.
150
Global Reports LLC

photoresist ÏÏÏÏÏÏÏÏÏÏÏÏÏÏÏÏÏÏÏÏÏÏÏÏ A photoactive chemical that is used in the photolithography
process, in which the design of an integrated circuit is drawn on a
silicon wafer.
semiconductor ÏÏÏÏÏÏÏÏÏÏÏÏÏÏÏÏÏÏÏÏÏ Generic name for devices, such as transistors and integrated
circuits, that control the flow of electrical signals. More generally, a
material, typically crystalline, that can be altered to allow electrical
current to flow or not flow in a pattern. The most common
semiconductor material for use in integrated circuits is silicon.
server ÏÏÏÏÏÏÏÏÏÏÏÏÏÏÏÏÏÏÏÏÏÏÏÏÏÏÏÏ A computer that provides a service for other computers connected
to it via a network. The most common example is a file server,
which has a local disk and services requests from remote clients to
read and write files on that disk.
siliconÏÏÏÏÏÏÏÏÏÏÏÏÏÏÏÏÏÏÏÏÏÏÏÏÏÏÏÏ A type of semiconducting material used to make a wafer. Silicon is
widely used in the semiconductor industry as a base material.
Static Random Access Memory
(SRAM) ÏÏÏÏÏÏÏÏÏÏÏÏÏÏÏÏÏÏÏÏÏÏÏÏÏ A type of volatile memory product that is used in electronic
systems to store data and program instructions. Unlike the more
common DRAM, it does not need to be electronically refreshed
(and is therefore ""static'').
Synchronous DRAM (SDRAM)ÏÏÏÏÏ A generic name for various kinds of DRAM that are synchronized
with the clock speed for which the microprocessor is optimized.
This tends to increase the number of instructions that the processor
can perform in a given time.
transistor ÏÏÏÏÏÏÏÏÏÏÏÏÏÏÏÏÏÏÏÏÏÏÏÏÏ An individual circuit that can amplify or switch electric current.
This is the building block of all integrated circuits.
volatile memoryÏÏÏÏÏÏÏÏÏÏÏÏÏÏÏÏÏÏÏÏ A type of semiconductor memory that loses stored information if
the power source is removed.
waferÏÏÏÏÏÏÏÏÏÏÏÏÏÏÏÏÏÏÏÏÏÏÏÏÏÏÏÏÏ A disk made of a semiconducting material such as silicon, cur-
rently usually either 200mm or 300mm in diameter, used to form
the substrate of a chip. A finished wafer may contain several
thousand chips.
yield ÏÏÏÏÏÏÏÏÏÏÏÏÏÏÏÏÏÏÏÏÏÏÏÏÏÏÏÏÏ The percentage of usable dies produced on a silicon wafer in the
front-end process.
USB ÏÏÏÏÏÏÏÏÏÏÏÏÏÏÏÏÏÏÏÏÏÏÏÏÏÏÏÏÏ Universal Serial Bus. A protocol for transferring data to and from
digital devices.
USB drive ÏÏÏÏÏÏÏÏÏÏÏÏÏÏÏÏÏÏÏÏÏÏÏÏ A portable data storage device based on flash memory that uses
USB interface protocol.
151
Global Reports LLC

[THIS PAGE INTENTIONALLY LEFT BLANK]
Global Reports LLC

QIMONDA AG AND SUBSIDIARIES
INDEX TO COMBINED AND CONSOLIDATED FINANCIAL STATEMENTS
Page
Qimonda AG and Subsidiaries
Report of Independent Registered Public Accounting FirmÏÏÏÏÏÏÏÏÏÏÏÏÏÏÏÏÏÏÏÏÏÏÏÏÏÏÏÏÏÏÏÏÏÏÏ F-2
Combined and Consolidated Statements of Operationsfor the years ended September 30, 2004, 2005 and 2006 ÏÏÏÏÏÏÏÏÏÏÏÏÏÏÏÏÏÏÏÏÏÏÏÏÏÏÏÏÏÏÏÏÏÏÏ F-3
Combined and Consolidated Balance Sheets as of September 30, 2005 and 2006 ÏÏÏÏÏÏÏÏÏÏÏÏÏÏÏÏ F-4
Combined and Consolidated Statements of Business/Shareholders' Equityfor the years ended September 30, 2004, 2005 and 2006 ÏÏÏÏÏÏÏÏÏÏÏÏÏÏÏÏÏÏÏÏÏÏÏÏÏÏÏÏÏÏÏÏÏÏÏ F-5
Combined and Consolidated Statements of Cash Flowsfor the years ended September 30, 2004, 2005 and 2006 ÏÏÏÏÏÏÏÏÏÏÏÏÏÏÏÏÏÏÏÏÏÏÏÏÏÏÏÏÏÏÏÏÏÏÏ F-6
Notes to the Combined and Consolidated Financial Statements ÏÏÏÏÏÏÏÏÏÏÏÏÏÏÏÏÏÏÏÏÏÏÏÏÏÏÏÏÏÏÏ F-7
Inotera Memories, Inc.
Report of Independent Registered Public Accounting FirmÏÏÏÏÏÏÏÏÏÏÏÏÏÏÏÏÏÏÏÏÏÏÏÏÏÏÏÏÏÏÏÏÏÏÏ F-61
Balance Sheets as of December 31, 2004 and 2005ÏÏÏÏÏÏÏÏÏÏÏÏÏÏÏÏÏÏÏÏÏÏÏÏÏÏÏÏÏÏÏÏÏÏÏÏÏÏÏÏÏÏ F-62
Statements of Income for the years ended December 31, 2004 and 2005 ÏÏÏÏÏÏÏÏÏÏÏÏÏÏÏÏÏÏÏÏÏÏÏ F-64
Statements of Changes in Stockholders' Equity for the years ended December 31, 2004 and 2005 ÏÏ F-65
Statements of Cash Flows for the years ended December 31, 2004 and 2005 ÏÏÏÏÏÏÏÏÏÏÏÏÏÏÏÏÏÏÏÏ F-66
Notes to Financial Statements ÏÏÏÏÏÏÏÏÏÏÏÏÏÏÏÏÏÏÏÏÏÏÏÏÏÏÏÏÏÏÏÏÏÏÏÏÏÏÏÏÏÏÏÏÏÏÏÏÏÏÏÏÏÏÏÏÏÏÏ F-67
F-1
Global Reports LLC

Report of Independent Registered Public Accounting Firm
The Supervisory Board
Qimonda AG:
We have audited the accompanying combined and consolidated balance sheets of Qimonda AG and
subsidiaries (the Company) as of September 30, 2005 and 2006, and the related combined and consolidated
statements of operations, business/shareholders' equity, and cash flows for each of the years in the three-year
period ended September 30, 2006. These combined and consolidated financial statements are the responsibil-
ity of the Company's management. Our responsibility is to express an opinion on these combined and
consolidated financial statements based on our audits.
We conducted our audits in accordance with the standards of the Public Company Accounting Oversight
Board (United States). Those standards require that we plan and perform the audit to obtain reasonable
assurance about whether the financial statements are free of material misstatement. An audit includes
examining, on a test basis, evidence supporting the amounts and disclosures in the financial statements. An
audit also includes assessing the accounting principles used and significant estimates made by management, as
well as evaluating the overall financial statement presentation. We believe that our audits provide a reasonable
basis for our opinion.
In our opinion, the combined and consolidated financial statements referred to above present fairly, in all
material respects, the financial position of Qimonda AG and subsidiaries as of September 30, 2005 and 2006,
and the results of their operations and their cash flows for each of the years in the three-year period ended
September 30, 2006, in conformity with U.S. generally accepted accounting principles.
Munich, Germany
November 13, 2006
KPMG Deutsche Treuhand-Gesellschaft
Aktiengesellschaft
Wirtschaftspr ufungsgesellschaft
F-2
Global Reports LLC
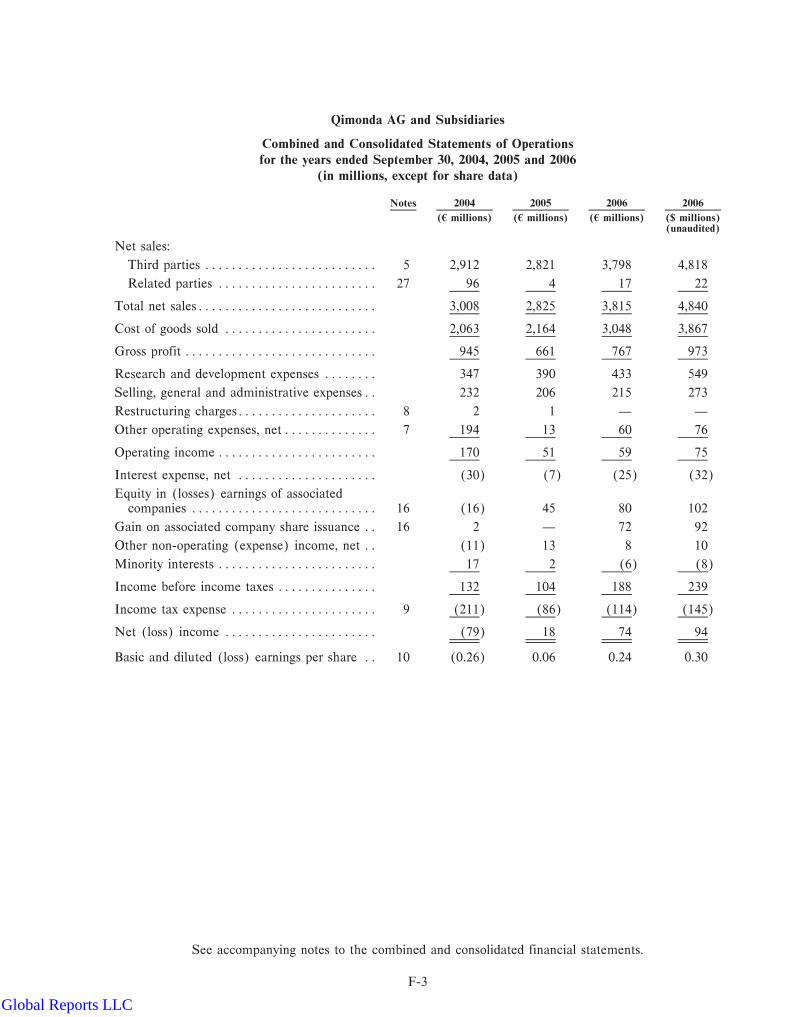
Qimonda AG and Subsidiaries
Combined and Consolidated Statements of Operations
for the years ended September 30, 2004, 2005 and 2006
(in millions, except for share data)
Notes 2004 2005 2006 2006
(5 millions) (5 millions) (5 millions) ($ millions)(unaudited)
Net sales:
Third parties ÏÏÏÏÏÏÏÏÏÏÏÏÏÏÏÏÏÏÏÏÏÏÏÏÏÏ 5 2,912 2,821 3,798 4,818
Related parties ÏÏÏÏÏÏÏÏÏÏÏÏÏÏÏÏÏÏÏÏÏÏÏÏ 27 96 4 17 22
Total net salesÏÏÏÏÏÏÏÏÏÏÏÏÏÏÏÏÏÏÏÏÏÏÏÏÏÏÏ 3,008 2,825 3,815 4,840
Cost of goods sold ÏÏÏÏÏÏÏÏÏÏÏÏÏÏÏÏÏÏÏÏÏÏÏ 2,063 2,164 3,048 3,867
Gross profit ÏÏÏÏÏÏÏÏÏÏÏÏÏÏÏÏÏÏÏÏÏÏÏÏÏÏÏÏÏ 945 661 767 973
Research and development expenses ÏÏÏÏÏÏÏÏ 347 390 433 549
Selling, general and administrative expensesÏÏ 232 206 215 273
Restructuring chargesÏÏÏÏÏÏÏÏÏÏÏÏÏÏÏÏÏÏÏÏÏ 8 2 1 Ì Ì
Other operating expenses, net ÏÏÏÏÏÏÏÏÏÏÏÏÏÏ 7 194 13 60 76
Operating income ÏÏÏÏÏÏÏÏÏÏÏÏÏÏÏÏÏÏÏÏÏÏÏÏ 170 51 59 75
Interest expense, net ÏÏÏÏÏÏÏÏÏÏÏÏÏÏÏÏÏÏÏÏÏ (30) (7) (25) (32)
Equity in (losses) earnings of associatedcompanies ÏÏÏÏÏÏÏÏÏÏÏÏÏÏÏÏÏÏÏÏÏÏÏÏÏÏÏÏ 16 (16) 45 80 102
Gain on associated company share issuance ÏÏ 16 2 Ì 72 92
Other non-operating (expense) income, net ÏÏ (11) 13 8 10
Minority interests ÏÏÏÏÏÏÏÏÏÏÏÏÏÏÏÏÏÏÏÏÏÏÏÏ 17 2 (6) (8)
Income before income taxes ÏÏÏÏÏÏÏÏÏÏÏÏÏÏÏ 132 104 188 239
Income tax expense ÏÏÏÏÏÏÏÏÏÏÏÏÏÏÏÏÏÏÏÏÏÏ 9 (211) (86) (114) (145)
Net (loss) income ÏÏÏÏÏÏÏÏÏÏÏÏÏÏÏÏÏÏÏÏÏÏÏ (79) 18 74 94
Basic and diluted (loss) earnings per share ÏÏ 10 (0.26) 0.06 0.24 0.30
See accompanying notes to the combined and consolidated financial statements.
F-3
Global Reports LLC

Qimonda AG and Subsidiaries
Combined and Consolidated Balance Sheets
September 30, 2005 and 2006
Notes 2005 2006 2006
(5 millions) (5 millions) ($ millions)(unaudited)
Assets:
Current assets:
Cash and cash equivalents ÏÏÏÏÏÏÏÏÏÏÏÏÏÏÏÏÏÏÏÏÏÏÏÏÏÏ 632 932 1,182
Marketable securities ÏÏÏÏÏÏÏÏÏÏÏÏÏÏÏÏÏÏÏÏÏÏÏÏÏÏÏÏÏÏ 11 Ì 138 175
Trade accounts receivable, netÏÏÏÏÏÏÏÏÏÏÏÏÏÏÏÏÏÏÏÏÏÏÏ 12 439 803 1,019
Inventories ÏÏÏÏÏÏÏÏÏÏÏÏÏÏÏÏÏÏÏÏÏÏÏÏÏÏÏÏÏÏÏÏÏÏÏÏÏÏÏ 13 484 622 789
Deferred income taxes ÏÏÏÏÏÏÏÏÏÏÏÏÏÏÏÏÏÏÏÏÏÏÏÏÏÏÏÏÏ 9 49 47 60
Other current assets ÏÏÏÏÏÏÏÏÏÏÏÏÏÏÏÏÏÏÏÏÏÏÏÏÏÏÏÏÏÏÏ 14 198 265 336
Total current assets ÏÏÏÏÏÏÏÏÏÏÏÏÏÏÏÏÏÏÏÏÏÏÏÏÏÏÏÏÏÏÏÏÏÏ 1,802 2,807 3,561
Property, plant and equipmentÏÏÏÏÏÏÏÏÏÏÏÏÏÏÏÏÏÏÏÏÏÏÏÏÏ 15 2,216 2,080 2,639
Long-term investments ÏÏÏÏÏÏÏÏÏÏÏÏÏÏÏÏÏÏÏÏÏÏÏÏÏÏÏÏÏÏÏ 16 544 636 807
Deferred income taxes ÏÏÏÏÏÏÏÏÏÏÏÏÏÏÏÏÏÏÏÏÏÏÏÏÏÏÏÏÏÏÏ 9 125 160 203
Other assets ÏÏÏÏÏÏÏÏÏÏÏÏÏÏÏÏÏÏÏÏÏÏÏÏÏÏÏÏÏÏÏÏÏÏÏÏÏÏÏÏ 17 174 178 226
Total assets ÏÏÏÏÏÏÏÏÏÏÏÏÏÏÏÏÏÏÏÏÏÏÏÏÏÏÏÏÏÏÏÏÏÏÏÏÏÏÏÏ 4,861 5,861 7,436
Liabilities and Business/Shareholders' Equity:
Current liabilities:
Short-term debt Ì Infineon ÏÏÏÏÏÏÏÏÏÏÏÏÏÏÏÏÏÏÏÏÏÏÏÏ 21 524 344 435
Trade accounts payable ÏÏÏÏÏÏÏÏÏÏÏÏÏÏÏÏÏÏÏÏÏÏÏÏÏÏÏÏ 18 519 712 904
Accrued liabilities ÏÏÏÏÏÏÏÏÏÏÏÏÏÏÏÏÏÏÏÏÏÏÏÏÏÏÏÏÏÏÏÏÏ 19 122 160 203
Deferred income taxes ÏÏÏÏÏÏÏÏÏÏÏÏÏÏÏÏÏÏÏÏÏÏÏÏÏÏÏÏÏ 9 Ì 18 23
Other current liabilitiesÏÏÏÏÏÏÏÏÏÏÏÏÏÏÏÏÏÏÏÏÏÏÏÏÏÏÏÏÏ 20 200 245 311
Total current liabilities ÏÏÏÏÏÏÏÏÏÏÏÏÏÏÏÏÏÏÏÏÏÏÏÏÏÏÏÏÏÏÏ 1,365 1,479 1,876
Long-term debt ÏÏÏÏÏÏÏÏÏÏÏÏÏÏÏÏÏÏÏÏÏÏÏÏÏÏÏÏÏÏÏÏÏÏÏÏÏ 21 108 151 192
Deferred income taxes ÏÏÏÏÏÏÏÏÏÏÏÏÏÏÏÏÏÏÏÏÏÏÏÏÏÏÏÏÏÏÏ 9 9 36 46
Other liabilities ÏÏÏÏÏÏÏÏÏÏÏÏÏÏÏÏÏÏÏÏÏÏÏÏÏÏÏÏÏÏÏÏÏÏÏÏÏ 22 412 324 411
Total liabilitiesÏÏÏÏÏÏÏÏÏÏÏÏÏÏÏÏÏÏÏÏÏÏÏÏÏÏÏÏÏÏÏÏÏÏÏÏÏÏ 1,894 1,990 2,525
Business/Shareholders' Equity:
Investments by and advances from Infineon ÏÏÏÏÏÏÏÏÏÏÏ 2 3,034 Ì Ì
Ordinary share capitalÏÏÏÏÏÏÏÏÏÏÏÏÏÏÏÏÏÏÏÏÏÏÏÏÏÏÏÏÏÏ 23 Ì 684 868
Additional paid-in capital ÏÏÏÏÏÏÏÏÏÏÏÏÏÏÏÏÏÏÏÏÏÏÏÏÏÏÏ Ì 3,097 3,929
Retained earnings ÏÏÏÏÏÏÏÏÏÏÏÏÏÏÏÏÏÏÏÏÏÏÏÏÏÏÏÏÏÏÏÏÏ Ì 224 284
Accumulated other comprehensive loss ÏÏÏÏÏÏÏÏÏÏÏÏÏÏÏ 25 (67) (134) (170)
Total Business/Shareholders' Equity ÏÏÏÏÏÏÏÏÏÏÏÏÏÏÏÏÏÏÏ 2,967 3,871 4,911
Total Liabilities and Business/Shareholders' EquityÏÏÏÏÏÏÏ 4,861 5,861 7,436
See accompanying notes to the combined and consolidated financial statements.
F-4
Global Reports LLC

F-5
Qim
onda A
G a
nd
Subsidia
ries
Com
bin
ed a
nd C
onso
lidate
d S
tate
men
ts o
f Busines
s/Share
hold
ers' E
quity
for
the
years
ended
Sep
tem
ber
30, 2004, 2005 a
nd 2
006
(in
millions
exce
pt fo
r sh
are
data
)
For
eign
Add
itio
nal
Add
itio
nal
Inve
stm
ents
by
curr
ency
min
imum
Unr
ealize
dIs
sued
Ord
inar
y sh
ares
Pai
d-In
Ret
aine
dan
d ad
vanc
estr
ansl
atio
npe
nsio
nga
in/(
loss
)N
otes
Shar
esAm
ount
Cap
ital
earn
ings
from
Inf
ineo
nad
just
men
tliab
ility
on s
ecurities
Tot
al
(million
s)(5 m
illion
s)(5
million
s)(5
million
s)(5
million
s)(5
million
s)(5
million
s)(5
million
s)(5
million
s)
Bal
ance
as
of O
ctober
1, 2003
ÏÏÏÏÏÏÏÏÏÏÏÏÏÏÏÏÏÏÏÏÏ
ÌÌ
ÌÌ
2,8
04
(76)
Ì8
2,7
36
Net
inve
stm
ents b
y an
d a
dva
nce
s from
Infineo
nÏÏÏÏÏÏ
ÌÌ
ÌÌ
165
ÌÌ
Ì165
Net
loss
ÏÏÏÏÏÏÏÏÏÏÏÏÏÏÏÏÏÏÏÏÏÏÏÏÏÏÏÏÏÏÏÏÏÏÏÏÏÏÏÏ
ÌÌ
ÌÌ
(79)
ÌÌ
Ì(79)
Oth
er c
om
pre
hen
sive
loss
ÏÏÏÏÏÏÏÏÏÏÏÏÏÏÏÏÏÏÏÏÏÏÏÏÏ
25
ÌÌ
ÌÌ
Ì(35)
Ì(8)
(43)
Bal
ance
as
of Sep
tem
ber
30, 2004
ÏÏÏÏÏÏÏÏÏÏÏÏÏÏÏÏÏÏ
ÌÌ
ÌÌ
2,8
90
(111)
ÌÌ
2,7
79
Tra
nsfer
of D
D200 fac
ility
to I
nfineo
nÏÏÏÏÏÏÏÏÏÏÏÏÏÏ
4Ì
ÌÌ
Ì(374)
ÌÌ
Ì(374)
Net
inve
stm
ents b
y an
d a
dva
nce
s from
Infineo
nÏÏÏÏÏÏ
ÌÌ
ÌÌ
500
ÌÌ
Ì500
Net
inco
me
ÏÏÏÏÏÏÏÏÏÏÏÏÏÏÏÏÏÏÏÏÏÏÏÏÏÏÏÏÏÏÏÏÏÏÏÏÏ
ÌÌ
ÌÌ
18
ÌÌ
Ì18
Oth
er c
om
pre
hen
sive
inco
me
(lo
ss)ÏÏÏÏÏÏÏÏÏÏÏÏÏÏÏÏÏ
25
ÌÌ
ÌÌ
Ì45
(1)
Ì44
Bal
ance
as
of Sep
tem
ber
30, 2005
ÏÏÏÏÏÏÏÏÏÏÏÏÏÏÏÏÏÏ
ÌÌ
ÌÌ
3,0
34
(66)
(1)
Ì2,9
67
Tra
nsfer
of dev
elopm
ent ce
nte
r to
Infineo
nÏÏÏÏÏÏÏÏÏÏÏ
26
ÌÌ
ÌÌ
(10)
ÌÌ
Ì(10)
Net
inve
stm
ents b
y an
d a
dva
nce
s from
Infineo
n p
rior
to M
ay 1
, 2006
ÏÏÏÏÏÏÏÏÏÏÏÏÏÏÏÏÏÏÏÏÏÏÏÏÏÏÏÏÏÏÏÏ
ÌÌ
ÌÌ
493
ÌÌ
Ì493
Net
loss
prior
to M
ay 1
, 2006ÏÏÏÏÏÏÏÏÏÏÏÏÏÏÏÏÏÏÏÏÏÏ
ÌÌ
ÌÌ
(150)
ÌÌ
Ì(150)
Contrib
ution to c
apital
and iss
uan
ce o
f sh
ares
on initia
lfo
rmat
ion a
s of M
ay 1
, 2006ÏÏÏÏÏÏÏÏÏÏÏÏÏÏÏÏÏÏÏÏÏ
1300
600
2,7
72
(3,3
72)
ÌÌ
ÌÌ
Tra
nsfer
of net
pen
sion lia
bility
from
Infineo
nÏÏÏÏÏÏÏÏ
28
ÌÌ
(9)
ÌÌ
ÌÌ
Ì(9)
Issu
ance
of sh
ares
upon initia
l public
offer
ing, net
of
offer
ing c
osts
and tax
ben
efit ther
eon
ÏÏÏÏÏÏÏÏÏÏÏÏÏ
142
84
331
ÌÌ
ÌÌ
Ì415
Sto
ck-b
ased
com
pen
sationÏÏÏÏÏÏÏÏÏÏÏÏÏÏÏÏÏÏÏÏÏÏÏÏÏ
24
ÌÌ
3Ì
58
Net
inco
me
afte
r M
ay 1
, 2006
ÏÏÏÏÏÏÏÏÏÏÏÏÏÏÏÏÏÏÏÏÏ
ÌÌ
Ì224
ÌÌ
ÌÌ
224
Oth
er c
om
pre
hen
sive
loss
ÏÏÏÏÏÏÏÏÏÏÏÏÏÏÏÏÏÏÏÏÏÏÏÏÏ
25
ÌÌ
ÌÌ
Ì(66)
(1)
Ì(67)
Bal
ance
as
of Sep
tem
ber
30, 2006
ÏÏÏÏÏÏÏÏÏÏÏÏÏÏÏÏÏÏ
342
684
3,0
97
224
Ì(132)
(2)
Ì3,8
71
See
acc
om
pan
ying n
ote
s to
the
com
bin
ed a
nd c
onso
lidat
ed fin
anci
al s
tate
men
ts.
Global Reports LLC

Qimonda AG and Subsidiaries
Combined and Consolidated Statements of Cash Flows
for the years ended September 30, 2004, 2005 and 2006
Notes 2004 2005 2006 2006
(5 millions) (5 millions) (5 millions) ($ millions)(unaudited)
Net (loss) income ÏÏÏÏÏÏÏÏÏÏÏÏÏÏÏÏÏÏÏÏÏÏÏÏÏÏÏÏÏÏÏÏ (79) 18 74 94Adjustments to reconcile net (loss) income to cash
provided by operating activities:Depreciation and amortizationÏÏÏÏÏÏÏÏÏÏÏÏÏÏÏÏÏÏÏÏÏ 15/17 752 528 703 892Provision for doubtful accounts ÏÏÏÏÏÏÏÏÏÏÏÏÏÏÏÏÏÏÏÏ 12 1 4 3 4Gain on sale of marketable securitiesÏÏÏÏÏÏÏÏÏÏÏÏÏÏÏ 11 (3) Ì Ì ÌLoss (gain) on sales of long-term assets ÏÏÏÏÏÏÏÏÏÏÏÏ 15 3 Ì (1) (1)Equity in losses (earnings) of associated companies ÏÏ 16 16 (45) (80) (101)Gain on associate company share issuance ÏÏÏÏÏÏÏÏÏÏ 16 (2) Ì (72) (92)Stock-based compensation ÏÏÏÏÏÏÏÏÏÏÏÏÏÏÏÏÏÏÏÏÏÏÏÏ 24 Ì Ì 8 10Minority interests ÏÏÏÏÏÏÏÏÏÏÏÏÏÏÏÏÏÏÏÏÏÏÏÏÏÏÏÏÏÏÏ (17) (2) 6 8Impairment charges ÏÏÏÏÏÏÏÏÏÏÏÏÏÏÏÏÏÏÏÏÏÏÏÏÏÏÏÏÏ 16 7 6 9 11Deferred income taxes ÏÏÏÏÏÏÏÏÏÏÏÏÏÏÏÏÏÏÏÏÏÏÏÏÏÏÏ 9 36 52 23 29
Due to changes in operating assets and liabilities:Trade accounts receivable ÏÏÏÏÏÏÏÏÏÏÏÏÏÏÏÏÏÏÏÏÏÏÏÏ 12 (135) 45 (378) (480)Inventories ÏÏÏÏÏÏÏÏÏÏÏÏÏÏÏÏÏÏÏÏÏÏÏÏÏÏÏÏÏÏÏÏÏÏÏÏÏ 13 73 (172) (147) (186)Other current assets ÏÏÏÏÏÏÏÏÏÏÏÏÏÏÏÏÏÏÏÏÏÏÏÏÏÏÏÏÏ 14 19 7 (75) (95)Trade accounts payable ÏÏÏÏÏÏÏÏÏÏÏÏÏÏÏÏÏÏÏÏÏÏÏÏÏÏ 18 106 47 162 206Accrued liabilities ÏÏÏÏÏÏÏÏÏÏÏÏÏÏÏÏÏÏÏÏÏÏÏÏÏÏÏÏÏÏÏ 19 66 (58) 68 86Other current liabilities ÏÏÏÏÏÏÏÏÏÏÏÏÏÏÏÏÏÏÏÏÏÏÏÏÏÏ 20 68 (35) 63 80Other assets and liabilities ÏÏÏÏÏÏÏÏÏÏÏÏÏÏÏÏÏÏÏÏÏÏÏÏ (218) 88 (69) (88)
Net cash provided by operating activitiesÏÏÏÏÏÏÏÏÏÏÏÏÏÏ 693 483 297 377
Cash flows from investing activities:Purchases of marketable securities available for sale ÏÏ Ì Ì (175) (222)Proceeds from sales of marketable securities available
for sale ÏÏÏÏÏÏÏÏÏÏÏÏÏÏÏÏÏÏÏÏÏÏÏÏÏÏÏÏÏÏÏÏÏÏÏÏÏÏ 17 1 37 46Purchases of business interests ÏÏÏÏÏÏÏÏÏÏÏÏÏÏÏÏÏÏÏÏ 16 (350) (83) (3) (4)Proceeds from disposal of business interests and
dividends ÏÏÏÏÏÏÏÏÏÏÏÏÏÏÏÏÏÏÏÏÏÏÏÏÏÏÏÏÏÏÏÏÏÏÏÏ 16 Ì 15 29 37Purchases of intangible assets ÏÏÏÏÏÏÏÏÏÏÏÏÏÏÏÏÏÏÏÏÏ 17 (5) (4) (42) (53)Purchases of property, plant and equipment ÏÏÏÏÏÏÏÏÏ 15 (770) (926) (686) (871)Proceeds from sales of long-term assetsÏÏÏÏÏÏÏÏÏÏÏÏÏ 15 60 26 68 86
Net cash used in investing activitiesÏÏÏÏÏÏÏÏÏÏÏÏÏÏÏÏÏÏ (1,048) (971) (772) (981)
Cash flows from financing activities:Increase (decrease) in short-term debt due InfineonÏÏ 21 Ì 481 (163) (207)Increase in short-term debt due third parties ÏÏÏÏÏÏÏÏ 21 13 Ì Ì ÌRepayments of short-term debt due third parties ÏÏÏÏÏ 21 Ì (18) Ì ÌDecrease (increase) in financial payables due related
partiesÏÏÏÏÏÏÏÏÏÏÏÏÏÏÏÏÏÏÏÏÏÏÏÏÏÏÏÏÏÏÏÏÏÏÏÏÏÏÏ 27 57 (7) (2) (3)Decrease in financial receivables from associated and
related parties ÏÏÏÏÏÏÏÏÏÏÏÏÏÏÏÏÏÏÏÏÏÏÏÏÏÏÏÏÏÏÏÏ 27 Ì 3 Ì ÌProceeds from issuance of long-term debt ÏÏÏÏÏÏÏÏÏÏÏ 21 170 80 44 56Principal repayments of long-term debt ÏÏÏÏÏÏÏÏÏÏÏÏÏ 21 (133) (522) Ì ÌChange in restricted cashÏÏÏÏÏÏÏÏÏÏÏÏÏÏÏÏÏÏÏÏÏÏÏÏÏ 64 Ì Ì ÌNet proceeds from issuance of common stock ÏÏÏÏÏÏÏ 1 Ì Ì 415 527Dividend payments to minority interest ÏÏÏÏÏÏÏÏÏÏÏÏÏ Ì Ì (5) (6)Proceeds from issuance of shares to minority interest 52 21 Ì ÌInvestments by and advances from Infineon ÏÏÏÏÏÏÏÏÏ 26 165 500 484 614
Net cash provided by financing activitiesÏÏÏÏÏÏÏÏÏÏÏÏÏÏ 388 538 773 981
Effect of foreign exchange rate changes on cash andcash equivalentsÏÏÏÏÏÏÏÏÏÏÏÏÏÏÏÏÏÏÏÏÏÏÏÏÏÏÏÏÏÏÏÏÏ Ì 5 2 3
Net increase in cash and cash equivalentsÏÏÏÏÏÏÏÏÏÏÏÏÏ 33 55 300 380Cash and cash equivalents at beginning of year ÏÏÏÏÏÏÏÏ 544 577 632 802
Cash and cash equivalents at end of year ÏÏÏÏÏÏÏÏÏÏÏÏÏ 577 632 932 1,182
See accompanying notes to the combined and consolidated financial statements.
F-6
Global Reports LLC

QIMONDA AG AND SUBSIDIARIES
Notes to the Combined and Consolidated Financial Statements
(euro in millions, except where otherwise stated)
1. Description of Business, Formation and Basis of Presentation
Description of Business
Qimonda AG and its subsidiaries (collectively, the ""Company'' or ""Qimonda'') is one of the world's
leading suppliers of semiconductor memory products. It designs memory technologies and develops, manufac-
tures, markets and sells a large variety of memory products on a module, component and chip level. Qimonda
has operations, investments and customers located mainly in Europe, Asia and North America. The Company
is a majority owned subsidiary of Infineon Technologies AG (""Infineon''). The financial year-end for the
Company is September 30.
Formation
On November 17, 2005, Infineon announced its intention to separate its memory products business from
the remainder of its activities and place its memory products business in a stand-alone legal structure, with the
preferred goal of conducting a public offering of the shares of the new company (the ""Offering''). Effective
May 1, 2006, substantially all the memory products-related assets and liabilities, operations and activities of
Infineon (the ""Memory Products business'') were contributed to the Company (the ""Formation''). In
conjunction with the Formation the Company entered into a contribution agreement and various other service
agreements with Infineon. In cases where physical contribution (ownership transfer) of assets and liabilities
were not feasible or cost effective, the monetary value was transferred in the form of cash or debt.
On August 9, 2006 the Company completed its IPO on the New York Stock Exchange through the
issuance of 42 million ordinary shares, which are traded as American Depositary Shares (ADSs) under the
symbol ""QI''. The Company intends to use the offering proceeds of 4415, net of offering costs of 419 and taxbenefit thereon of 49, to finance investments in its manufacturing facilities and for research and development.
In addition, Infineon sold 6.3 million shares upon exercise of the underwriters' over-allotment option. As a
result, Infineon's ownership interest As a result, Infineon's ownership interest in the Company decreased to
85.9%.
The Company's operations in Japan and Korea were transferred to separate legal entities and held in trust
for Qimonda's benefit by Infineon until the legal transfer to Qimonda takes place. The Company's Korea
operations were transferred in October 2006, and the transfer of the Japan operations is expected during the
three months ending March 31, 2007. The Company's investment in Inotera Memories Inc. (""Inotera'') is
held in trust by Infineon subject to the expiration of the lock-up provisions under Taiwan securities law (see
note 16 and note 33). The Company's investment in Advanced Mask Technology Center GmbH & Co.
(""AMTC'') and Maskhouse Building Administration GmbH & Co. KG (""BAC'') is intended to be
transferred by Infineon after approval by the other shareholders in the venture although pursuant to the
AMTC and BAC limited partnership agreement, such consent may not be unreasonably withheld.
Basis of Presentation
The accompanying combined and consolidated financial statements have been prepared in accordance
with accounting principles generally accepted in the United States of America (""U.S. GAAP'').
The accompanying combined and consolidated financial statements are presented on a combined basis
for period prior to the Formation and on a consolidated basis for all periods thereafter.
Periods prior to the Formation are presented on a ""carve-out'' basis and comprise the combined historical
financial statements of the transferred Memory Products business assuming that the Company had existed as
a separate legal entity. These combined financial statements have been derived from the consolidated financial
statements and historical accounting records of Infineon, employing the methods and assumptions set forth
F-7
Global Reports LLC

QIMONDA AG AND SUBSIDIARIES
Notes to the Combined and Consolidated Financial Statements Ì (Continued)
(euro in millions, except where otherwise stated)
below. Substantially all of the assets, liabilities, operations and activities of the Memory Products business are
those that comprised the Memory Products segment of Infineon during the financial periods presented.
Qimonda AG is incorporated in Germany. Pursuant to paragraph 291 of the German Commercial Code
(""Handelsgesetzbuch'' or ""HGB'') the Company is exempted from preparing consolidated financial state-
ments in accordance with either the HGB accounting principles and regulations (""German GAAP'') or
international financial reporting standards (""IFRS''), since its ultimate parent company, Infineon, prepares
and issues consolidated financial statements according to U.S. GAAP in compliance with the transitional
regulation of the German Bilanzrechtsreformgesetz Article 58, paragraph 3 EGHGB. Accordingly, the
Company presents the U.S. GAAP combined and consolidated financial statements contained herein.
All amounts herein are shown in millions of euro (or ""4'') except where otherwise stated. The
accompanying balance sheet as of September 30, 2006, and the statements of operations and cash flows for the
year then ended are also presented in U.S. dollars (""$''), solely for the convenience of the reader, at the rate of
41 • $1.2687 the Federal Reserve noon buying rate on September 29, 2006. The U.S. dollar convenience
translation amounts have not been audited.
Certain amounts in prior year consolidated financial statements and notes have been reclassified to
conform to the current year presentation. Results of operations have not been affected by these
reclassifications.
Statements of Operations
Through the Formation, the combined statements of operations were prepared on a carve-out basis and
reflect all revenues and expenses that are attributable to the Memory Products business. Operating expenses
or revenues of the Memory Products business specifically identified as pertaining to the Memory Products
business were charged or credited directly to it without allocation or apportionment. This is the case for all of
the revenues appearing on the combined statements of operations. Operating expenses that Infineon incurred
were allocated to the Memory Products business to the extent that they were related and indirectly
attributable to it. These expenditures, with the exception of certain corporate items, are mainly allocated from
each of a number of what Infineon refers to as ""clusters'', which are groups of functional departments for
which Infineon accounts on a cost center basis.
The costs allocated from the clusters include charges for facilities, functions and services provided by
shared Infineon facilities for the Memory Products business, expenses for certain functions and services
performed by centralized Infineon departments, a portion of Infineon's general corporate expenses and certain
research and development expenses. The allocations from each cluster were made based on allocation
methods, or allocation keys, which vary depending on the nature of the expenditures being allocated. The
allocation keys are consistent with those Infineon used to allocate expenses among its segments, although
historically Infineon did not allocate the expenses of some central activities and instead accounted for these as
corporate costs.
The following assumptions and allocation methods are used for significant allocated expenses included in
the combined statements of operations:
‚ The Infineon Central R&D cluster costs include research and development activities related to
semiconductor electronic technologies, circuits, and related systems. The allocation is based on total
sales.
‚ The Infineon Logistic cluster costs include all logistics expenses related to distribution centers
including handling, traffic and customs, packaging and freight. It also includes expenses for corporate
F-8
Global Reports LLC
QIMONDA AG AND SUBSIDIARIES
Notes to the Combined and Consolidated Financial Statements Ì (Continued)
(euro in millions, except where otherwise stated)
logistics in Europe, Asia and North America. The allocation to the Memory Products business is based
partly on unit volume and partly on sales.
‚ The Infineon Sales cluster covers all central selling expenses related to the activities of pricing
office, account management, distribution management, receivables management, export control and
commissions. The allocation to the Memory Products business is based, depending on the relevant
function, on the dedicated headcount of the business and also on sales.
‚ The Infineon IT-Services cluster costs include all expenses incurred relating to the design,
implementation and operation of IT systems and related administration. The allocation is based,
depending on the relevant function, on either the total direct cost, the total research and development cost
or the total cost of sales of the Memory Products business.
‚ The Infineon Finance and Treasury cluster costs include all financial income and expense, as well
as foreign exchange gains and losses, related to treasury market activities (foreign exchange management,
money market transactions and interest rate management). The allocation is based on the total direct
costs.
‚ The Infineon Central cluster costs include strategic and general central functions within the
Infineon headquarters or its regional organizations. The allocation is based on the total direct costs.
The combined statements of operations include depreciation expense for all property, plant and
equipment owned and operated by the Memory Products business.
Allocations from Infineon during the years ended September 30, 2004, 2005 and the seven months ended
April 30, 2006, are reflected in the combined statements of operations as follows:
Seven MonthsEnded
2004 2005 April 30, 2006
Cost of goods sold ÏÏÏÏÏÏÏÏÏÏÏÏÏÏÏÏÏÏÏÏÏÏÏÏÏÏÏÏÏÏÏÏÏÏÏÏÏÏÏÏÏÏÏ 180 168 111
Research and development expenses ÏÏÏÏÏÏÏÏÏÏÏÏÏÏÏÏÏÏÏÏÏÏÏÏÏÏÏÏ 43 27 17
Selling, general and administrative expenses ÏÏÏÏÏÏÏÏÏÏÏÏÏÏÏÏÏÏÏÏÏ 160 109 75
Other operating expenses, net ÏÏÏÏÏÏÏÏÏÏÏÏÏÏÏÏÏÏÏÏÏÏÏÏÏÏÏÏÏÏÏÏÏ 2 Ì Ì
Restructuring charges ÏÏÏÏÏÏÏÏÏÏÏÏÏÏÏÏÏÏÏÏÏÏÏÏÏÏÏÏÏÏÏÏÏÏÏÏÏÏÏÏ 2 1 Ì
387 305 203
Since the Formation, the Company entered into several service agreements with Infineon. As a result,
costs are no longer allocated after the Formation, but rather charged on the basis of the respective agreements
(see note 27).
For periods prior to the Formation, the income tax expense reflected in the accompanying combined and
consolidated financial statements has been calculated as if the Company had filed separate tax returns for
each of the years presented. The Company's future effective tax rate after the Formation may differ from
those indicated in the accompanying combined and consolidated financial statements prior to the Formation.
Balance Sheets
The assets and liabilities attributable to the Memory Products business were contributed to the Company,
in general, at their historical costs. In certain jurisdictions where tax regulations do not permit the tax-free
transfer of assets or liabilities to the Company, they were revalued for tax, but not accounting purposes. Unless
otherwise noted, all assets and liabilities specifically identifiable as pertaining to the Memory Products
F-9
Global Reports LLC

QIMONDA AG AND SUBSIDIARIES
Notes to the Combined and Consolidated Financial Statements Ì (Continued)
(euro in millions, except where otherwise stated)
business are included in the combined and consolidated financial statements. Where legal entities were wholly
allocable to the Memory Products business, the shares of these entities were transferred to the Memory
Products business. In some cases, including at the Infineon parent company level, the memory-related assets
and liabilities were identified and carved out by means of asset and liability transfer transactions.
For carve-out transfers, the assets and liabilities directly identifiable as pertaining to the Memory
Products business include inventories, long-term investments, fixed assets and accounts receivable. The
following assumptions and allocations were used for those assets and liabilities that were not specifically
identifiable to the Memory Products business:
Trade Accounts Payable
Trade accounts payable include identifiable payables from specific Memory Products business' vendors
and service suppliers as well as an allocation of payables from Infineon-specified vendors.
Other Current and Accrued Liabilities
Other current and accrued liabilities include direct payroll obligations and payroll obligations, which were
allocated based on the Memory Products business and an allocation of the Infineon employees in corporate
functions that in part supported the Memory Products business.
Pension Liabilities
Pension expenses and related liabilities were measured based on actuarial computations and are
determined, with respect to all of the employees that participate in Infineon's defined benefit pension plans,
based on the number of employees of the Memory Products business and an allocation of the Infineon
employees in corporate functions that in part supported the Memory Products business.
Investments by and Advances from Infineon
Because a direct ownership relationship did not exist among the various entities comprising the Memory
Products business prior to the Formation, Infineon's investments in and advances to the Memory Products
business represent Infineon's interest in the recorded net assets of the Memory Products business, and are
shown as business equity in lieu of shareholder's equity in the combined financial statements. Prior to the
Formation, net income (loss) of the Memory Products business forms part of business equity (investments by
and advances from Infineon). Subsequent to the Formation net income (loss) is attributed to retained
earnings since the Company exists as a separate legal entity. The effects of equity transactions prior to
Formation are included in ""Investments and advances from Infineon'' in the accompanying combined and
consolidated financial statements. All intercompany transactions, including purchases of inventory, charges
and cost allocations for facilities, functions and services performed by Infineon for the Memory Products
business are reflected in this amount.
Capital Structure
The Memory Products business historically relied on Infineon to provide the financing of its capital
requirements, as Infineon uses a centralized approach to cash management and the financing of its operations.
The historical capital structure of Qimonda was considered to be based on the following:
‚ instruments that were directly identified with the Memory Products business;
‚ cash and intercompany financial receivables reduce total short and long-term debt, so that the
Company has no net debt;
F-10
Global Reports LLC

QIMONDA AG AND SUBSIDIARIES
Notes to the Combined and Consolidated Financial Statements Ì (Continued)
(euro in millions, except where otherwise stated)
‚ a proportional share of total assets constitutes total cash, cash equivalents, marketable securities
and intercompany financial receivables;
‚ a proportional share of aggregate total debt and total business equity constitutes total short and
long-term debt.
The allocation of Infineon's cash and debt in conjunction with the historical capital structure of the
Memory Products business in the combined and consolidated financial statements is reflected through the
following:
‚ through the Formation, contribution of 4582 in cash through business equity;
‚ as of September 30, 2005 and the Formation, the reduction of inter-company financial receivables
of 4227 and 466, respectively, by inter-company debt.
At the Formation, net investments by and advances from Infineon in the amount of 43,372 were
contributed to the Company as equity, which is reflected as 4600 ordinary share capital and 42,772 asadditional paid in capital in the accompanying combined and consolidated statement of business/shareholders'
equity.
The capital structure attributed to the Memory Products business in connection with the preparation of
the combined financial statements prior to Formation, based as it is on the business equity concept and
without independent financing by the Company, may not be indicative of the capital structure that the
Memory Products business would have required had it been an independent company during the financial
periods presented.
The Company's operations have been financed largely through contributions from Infineon and, to a
lesser extent, third-party borrowings. The Company's interest expense prior to formation includes interest
charges on certain intercompany financial liabilities to the Infineon group companies and interest expense on
its external debt based on the aforementioned capital structure. Interest income includes allocations based on
the proportional share of cash and cash equivalents. The Company's capital structure after the Formation may
differ from the capital structure presented in the accompanying combined and consolidated financial
statements prior to the Formation as a result of the issuance of additional ordinary shares by Qimonda AG as
part of the Offering. Accordingly, interest expense prior to the Formation reflected in the accompanying
combined and consolidated financial statements may not necessarily be indicative of the interest expense that
Qimonda AG would have incurred as a stand-alone entity or will incur after the Formation.
Estimates
The preparation of the accompanying combined and consolidated financial statements requires manage-
ment to make estimates and assumptions that affect the reported amounts of assets and liabilities, as well as
disclosure of contingent amounts and liabilities, at the date of the financial statements and the reported
amounts of revenues and expenses during the periods presented. Actual results could differ materially from
such estimates made by management. In addition, due to the significant relationship between Infineon and the
Company, the terms of the carve-out transactions, the allocations and estimations of assets and liabilities and
of expenses and other transactions between the Memory Products business and Infineon may not be the same
as those that would have resulted from transactions among unrelated third parties. Management believes that
the assumptions underlying the combined and consolidated financial statements are reasonable. However,
these transactions, allocations and estimates may not be indicative of actual results that would have been
obtained if the Company had operated on a stand-alone basis, nor are they indicative of future transactions or
of the expenses or results of operations of the Company. In addition, the process of preparing the combined
and consolidated financial statements does not permit the revaluation of historical transactions to attempt to
F-11
Global Reports LLC
QIMONDA AG AND SUBSIDIARIES
Notes to the Combined and Consolidated Financial Statements Ì (Continued)
(euro in millions, except where otherwise stated)
introduce an arms'-length relationship where one did not exist at the time. Management believes that it is not
practicable to estimate what the actual costs of the Company would have been on a stand-alone basis if it had
operated as an unaffiliated entity. Rather than allocating the expenses that Infineon actually incurred on
behalf of the Memory Products business, management would have had to choose from a wide range of
estimates and assumptions that could have been made regarding joint overhead, joint financing, shared
processes and other matters. Any of these assumptions may have led to unreliable results and would not have
been more useful as an indicator of historical business development and performance than the methods
employed in preparing the combined and consolidated financial statements.
2. Summary of Significant Accounting Policies
The following is a summary of significant accounting policies followed in the preparation of the
accompanying combined and consolidated financial statements.
Basis of Consolidation
The accompanying combined and consolidated financial statements include the accounts of the Company
and its significant subsidiaries on a combined and consolidated basis. Investments in companies in which the
Company has an ownership interest of 20% or more and are not controlled by the Company (""Associated
Companies'') are accounted for using the equity method of accounting (see note 16). The equity in earnings
of Associated Companies with financial year ends that differ by not more than three months from the
Company's financial year are recorded on a three month lag. Other equity investments (""Related Compa-
nies''), in which the Company has an ownership interest of less than 20%, are recorded at cost. The effects of
all significant intercompany transactions are eliminated. In addition, the Company evaluates its relationships
with other entities to identify whether they are variable interest entities as defined by Financial Accounting
Standards Board (""FASB'') Interpretation No. 46 (R) ""Consolidation of Variable Interest Entities''(""FIN 46R'') and to assess whether it is the primary beneficiary of such entities. If the determination is made
that the Company is the primary beneficiary, then that entity is included in the combined and consolidated
financial statements in accordance with FIN 46R.
The Company group consists of the following numbers of entities in addition to the parent company,
Qimonda AG:
Consolidated AssociatedSubsidiaries Companies Total
September 30, 2005 ÏÏÏÏÏÏÏÏÏÏÏÏÏÏÏÏÏÏÏÏÏÏÏÏÏÏÏÏÏÏÏÏÏÏÏÏÏÏ 14 6 20
Additions in connection with Formation ÏÏÏÏÏÏÏÏÏÏÏÏÏÏÏÏÏÏÏ 10 Ì 10
Disposals ÏÏÏÏÏÏÏÏÏÏÏÏÏÏÏÏÏÏÏÏÏÏÏÏÏÏÏÏÏÏÏÏÏÏÏÏÏÏÏÏÏÏÏÏÏ (1) (1) (2)
September 30, 2006 ÏÏÏÏÏÏÏÏÏÏÏÏÏÏÏÏÏÏÏÏÏÏÏÏÏÏÏÏÏÏÏÏÏÏÏÏÏÏ 23 5 28
Reporting and Foreign Currency
The Company's reporting currency is the euro, and therefore the accompanying combined and
consolidated financial statements are presented in euro.
The assets and liabilities of foreign subsidiaries with functional currencies other than the euro are
translated using period-end exchange rates, while the revenues and expenses of such subsidiaries are translated
using average exchange rates during the period. Differences arising from the translation of assets and liabilities
in comparison with the translation of the previous periods are included in other comprehensive income (loss)
and reported as a separate component of business/shareholders' equity.
F-12
Global Reports LLC
QIMONDA AG AND SUBSIDIARIES
Notes to the Combined and Consolidated Financial Statements Ì (Continued)
(euro in millions, except where otherwise stated)
The exchange rates of the primary currencies used in the preparation of the accompanying combined and
consolidated financial statements are as follows:
Exchange Rate Annual AverageSeptember 30, Exchange Rate
Currency 2005 2006 2005 2006
euro euro euro euro
U.S. dollarÏÏÏÏÏÏÏÏÏÏÏÏÏÏÏÏÏÏÏÏÏÏÏÏÏ 1$ • 0.8290 0.7899 0.7869 0.8117
New Taiwan dollarÏÏÏÏÏÏÏÏÏÏÏÏÏÏÏÏÏÏ 100NTD • 2.4957 2.3866 2.4583 2.4823
Chinese Yuan Renminbi ÏÏÏÏÏÏÏÏÏÏÏÏÏ 100CNY • 10.2432 9.9934 9.5601 10.1172
Revenue Recognition
Sales
Revenue from products sold to customers is recognized, pursuant to U.S. Securities and Exchange
Commission (""SEC'') Staff Accounting Bulletin (""SAB'') 104, ""Revenue Recognition'', when persuasive
evidence of an arrangement exists, the price is fixed or determinable, shipment is made and collectibility is
reasonably assured. The Company records reductions to revenue for estimated product returns and allowances
for discounts, volume rebates and price protection, based on actual historical experience, at the time the
related revenue is recognized. In general, returns are permitted only for quality related reasons within the
applicable warranty period, which is typically 12 months. Distributors can, in certain cases, apply for stock
rotation or scrap allowances and price protection. Allowances for stock rotation returns are accrued based on
expected stock rotation as per the contractual agreement. Distributor scrap allowances are accrued based on
the contractual agreement and, upon authorization of the claim, reimbursed up to a certain maximum of the
average inventory value. Price protection programs allow distributors to apply for a price protection credit on
unsold inventory in the event the Company reduces the standard list price of the products included in such
inventory. In some cases, rebate programs are offered to specific distributors whereby the distributor may
apply for a rebate upon achievement of a defined sales volume. Distributors are also partially compensated for
commonly defined cooperative advertising on a case-by-case basis.
License Income
License income is recognized when earned and realizable (see note 5). Lump sum payments are
generally non-refundable and are deferred where applicable and recognized over the period in which the
Company is obliged to provide additional service. Pursuant to Emerging Issues Task Force (""EITF'')
Issue 00-21, ""Revenue Arrangements with Multiple Deliverables'', revenues from contracts with multiple
elements entered into after July 1, 2003 are recognized as each element is earned based on the relative fair
value of each element and when there are no undelivered elements that are essential to the functionality of the
delivered elements and when the amount is not contingent upon delivery of the undelivered elements.
Royalties are recognized as earned.
Grants
Grants for capital expenditures include both tax-free government grants (Investitionszulage) and taxablegrants for investments in property, plant and equipment (Investitionszusch usse). Grants receivable are
established when a legal right for the grant exists and the criteria for receiving the grant have been met. Tax-
free government grants are deferred (see note 22) and recognized over the remaining useful life of the related
asset. Taxable grants are deducted from the acquisition costs of the related asset (see note 6) and thereby
reduce depreciation expense in future periods. Other taxable grants reduce the related expense (see notes 6, 20
and 22).
F-13
Global Reports LLC

QIMONDA AG AND SUBSIDIARIES
Notes to the Combined and Consolidated Financial Statements Ì (Continued)
(euro in millions, except where otherwise stated)
Product-related Expenses
Shipping and handling costs associated with product sales are included in cost of sales. Expenditures for
advertising, sales promotion and other sales-related activities are expensed as incurred. Provisions for
estimated costs related to product warranties are generally made at the time the related sale is recorded, based
on estimated failure rates and claim history. Research and development costs are expensed as incurred.
Income Taxes
Income taxes, as presented in the accompanying combined and consolidated financial statements, are
determined on a separate return basis, although in numerous tax jurisdictions, including Germany, the
Company was included in the consolidated tax returns of Infineon prior to the Formation. Where the Memory
Products business was only a part of an Infineon entity, the tax provision has been prepared on an as-if
separate company basis except that, pursuant to the terms of the contribution agreement between the
Company and Infineon, any net operating losses generated by the Memory Products business and carried
forward are treated as a reduction of business equity, as such losses have been retained by Infineon. Infineon
evaluates its tax position and related tax strategies for its entire group as a whole, which may differ from the
tax strategies the Company would have followed as a stand-alone company.
Income taxes are accounted for under the asset and liability method pursuant to FASB Statement of
Financial Accounting Standards (""SFAS'') No. 109, ""Accounting for Income Taxes''. Deferred tax assets
and liabilities are recognized for the future tax consequences attributable to differences between the financial
statement carrying amounts of existing assets and liabilities and their respective tax bases. Deferred tax assets
and liabilities are measured using enacted tax rates expected to apply to taxable income in the years in which
those temporary differences are expected to be recovered or settled. The effect on deferred tax assets and
liabilities of a change in tax rates is recognized in income in the period that includes the enactment date.
Investment tax credits are accounted for under the flow-through method.
Stock-based Compensation
Prior to the adoption of SFAS No. 123 (revised 2004), the Company accounted for stock-based
compensation using the intrinsic value method pursuant to Accounting Principles Board (""APB'') Opin-
ion 25, ""Accounting for Stock Issued to Employees'', recognized compensation cost over the pro rata vesting
period, and applied the disclosure-only provisions of SFAS No. 123, ""Accounting for Stock-Based Compensa-tion'' as amended by SFAS No. 148 ""Accounting for Stock-Based Compensation Ì Transition and Disclo-sure, an Amendment of FASB Statement No. 123''.
Effective October 1, 2005, the Company adopted SFAS No. 123 (revised 2004) under the modified
prospective application method. Under this application, the Company records stock-based compensation
expense for all awards granted on or after the date of adoption and for the portion of previously granted awards
that remained unvested at the date of adoption. Stock-based compensation cost is measured at the grant date,
based on the fair value of the award, and is recognized as expense over the period during which the employee
is required to provide service in exchange for the award. Prior period amounts have not been restated and do
not reflect the recognition of stock-based compensation. (see note 24).
Issuance of shares by Subsidiaries or Associated Companies
Gains or losses arising from the issuances of shares by subsidiaries or Associated Companies, due to
changes in the Company's proportionate share of the value of the issuer's equity, are recognized in earnings
pursuant to SAB Topic 5:H, ""Accounting for Sales of Stock by a Subsidiary'' (see note 16).
F-14
Global Reports LLC
QIMONDA AG AND SUBSIDIARIES
Notes to the Combined and Consolidated Financial Statements Ì (Continued)
(euro in millions, except where otherwise stated)
Cash and Cash Equivalents
Cash and cash equivalents represent cash, deposits and liquid short-term investments with original
maturities of three months or less. Cash equivalents as of September 30, 2005 and 2006 were 4625 and 4895respectively, and consisted mainly of bank term deposits and fixed income securities with original maturities of
three months or less.
Marketable Securities
The Company's marketable securities are classified as available-for-sale and are stated at fair value as
determined by the most recently traded price of each security at the balance sheet date. Unrealized gains and
losses are included in accumulated other comprehensive income, net of applicable income taxes. Realized
gains or losses and declines in value, if any, judged to be other-than-temporary on available-for-sale securities,
are reported in other non-operating income or expense. For the purpose of determining realized gains and
losses, the cost of securities sold is based on specific identification.
Inventories
Inventories are valued at the lower of cost or market, cost being generally determined on the basis of an
average method. Cost consists of purchased component costs and manufacturing costs, which comprise direct
material and labor costs and applicable indirect costs.
Property, Plant and Equipment
Property, plant and equipment is valued at cost less accumulated depreciation. Spare parts, maintenance
and repairs are expensed as incurred. Depreciation expense is recognized using the straight-line method.
Construction in progress includes advance payments for construction of fixed assets. Land and construction in
progress are not depreciated. The cost of construction of certain long-term assets includes capitalized interest,
which is amortized over the estimated useful life of the related asset. During the years ended September 30,
2005 and 2006 capitalized interest was 47 and 40, respectively. The estimated useful lives of assets are as
follows:
Years
Buildings ÏÏÏÏÏÏÏÏÏÏÏÏÏÏÏÏÏÏÏÏÏÏÏÏÏÏÏÏÏÏÏÏÏÏÏÏÏÏÏÏÏÏÏÏÏÏÏÏÏÏÏÏÏÏÏÏÏÏÏÏÏÏÏÏÏÏÏ 10-25
Technical equipment and machinery ÏÏÏÏÏÏÏÏÏÏÏÏÏÏÏÏÏÏÏÏÏÏÏÏÏÏÏÏÏÏÏÏÏÏÏÏÏÏÏÏÏÏÏÏ 3-10
Other plant and office equipmentÏÏÏÏÏÏÏÏÏÏÏÏÏÏÏÏÏÏÏÏÏÏÏÏÏÏÏÏÏÏÏÏÏÏÏÏÏÏÏÏÏÏÏÏÏÏÏ 1-10
Leases
The Company is a lessee of property, plant and equipment. All leases where the Company is lessee that
meet certain specified criteria intended to represent situations where the substantive risks and rewards of
ownership have been transferred to the lessee are accounted for as capital leases pursuant to SFAS No. 13,
""Accounting for Leases'', and related interpretations. All other leases are accounted for as operating leases.
Intangible Assets
The Company accounts for business combinations using the purchase method of accounting pursuant to
SFAS No. 141, ""Business Combinations''. Intangible assets acquired in a purchase method business
combination are recognized and reported apart from goodwill, pursuant to the criteria specified by
SFAS No. 141.
F-15
Global Reports LLC

QIMONDA AG AND SUBSIDIARIES
Notes to the Combined and Consolidated Financial Statements Ì (Continued)
(euro in millions, except where otherwise stated)
Intangible assets consist primarily of purchased intangible assets, such as licenses and purchased
technology, which are recorded at acquisition cost, and goodwill resulting from business acquisitions,
representing the excess of purchase price over fair value of net assets acquired. Intangible assets other than
goodwill are amortized on a straight-line basis over the estimated useful lives of the assets ranging from 3 to
10 years. Pursuant to SFAS No. 142 ""Goodwill and Other Intangible Assets'', goodwill is not amortized, but
instead tested for impairment at least annually in accordance with the provisions of SFAS No. 142. The
Company tests goodwill annually for impairment in the fourth quarter of the financial year, whereby if the
carrying amount of a reporting unit with goodwill exceeds its fair value, the amount of impairment is
determined by the excess of recorded goodwill over the fair value of goodwill. The determination of fair value
of the reporting units and related goodwill requires considerable judgment by management.
Impairment of Long-lived Assets
The Company reviews long-lived assets, including property, plant and equipment and intangible assets
subject to amortization, for impairment whenever events or changes in circumstances indicate that the
carrying amount of an asset may not be recoverable. Recoverability of assets to be held and used is measured
by a comparison of the carrying amount of an asset to future net cash flows expected to be generated by the
asset. If such assets are considered to be impaired, the impairment to be recognized is measured by the
amount by which the carrying amount of the assets exceeds the fair value of the assets. Estimated fair value is
generally based on either appraised value or measured by discounted estimated future cash flows. Considera-
ble management judgment is necessary to estimate discounted future cash flows.
Long-term Investments
The Company assesses declines in the value of investments accounted for under the equity and cost
methods to determine whether such decline is other-than-temporary, thereby rendering the investment
impaired. This assessment is made by considering available evidence including changes in general market
conditions, specific industry and individual company data, the length of time and the extent to which the
market value has been less than cost, the financial condition and near-term prospects of the individual
company, and the Company's intent and ability to hold the investment for a period of time sufficient to allow
for any anticipated recovery in market value.
Financial Instruments
The Company operates internationally, giving rise to exposure to changes in foreign currency exchange
rates. The Company uses financial instruments, including derivatives such as foreign currency forward and
option contracts, to reduce this exposure based on the net exposure to the respective currency. The Company
applies SFAS No. 133, ""Accounting for Derivative Instruments and Hedging Activities'', as amended by
SFAS No. 137, SFAS No. 138 and SFAS No. 149, which provides guidance on accounting for derivative
instruments, including certain derivative instruments embedded in other contracts, and for hedging activities.
Derivative financial instruments are recorded at their fair value and included in other current assets or other
current liabilities. Generally the Company does not designate its derivative instruments as hedge transactions.
Changes in fair value of undesignated derivatives that relate to operations are recorded as part of cost of sales,
while undesignated derivatives relating to financing activities are recorded in other non-operating expense, net.
The fair value of derivatives and other financial instruments is discussed in note 29.
Pension Plans
The measurement of pension-benefit liabilities is based on actuarial computations using the projected-
unit-credit method in accordance with SFAS No. 87, ""Employers' Accounting for Pensions''. The assump-
F-16
Global Reports LLC
QIMONDA AG AND SUBSIDIARIES
Notes to the Combined and Consolidated Financial Statements Ì (Continued)
(euro in millions, except where otherwise stated)
tions used to calculate pension liabilities and costs are shown in Note 28. Changes in the amount of the
projected benefit obligation or plan assets resulting from experience different from that assumed and from
changes in assumptions can result in gains or losses not yet recognized in the Company's consolidated financial
statements. Amortization of an unrecognized net gain or loss is included as a component of the Company's net
periodic benefit plan cost for a year if, as of the beginning of the year, that unrecognized net gain or loss
exceeds 10% of the greater of the projected benefit obligation or the fair value of that plan's assets. In that
case, the amount of amortization recognized by the Company is the resulting excess divided by the average
remaining service period of the active employees expected to receive benefits under the plan. The Company
also records a liability for amounts payable under the provisions of its various defined contribution plans.
Recent Accounting Pronouncements
In November 2004, the FASB issued SFAS No. 151, ""Inventory Costs Ì an amendment of ARB No. 43,Chapter 4'', which clarifies the accounting for abnormal amounts of idle facility expense, freight, handling
costs, and wasted material (spoilage), requiring that such costs be recognized as current period charges and
requiring the allocation of fixed production overheads to inventory based on the normal capacity of the
production facilities. The Company adopted SFAS No. 151 with effect from October 1, 2005, which did not
have a significant impact on its consolidated financial position or results of operations.
In December 2004, the FASB issued SFAS No. 153, ""Exchanges of Nonmonetary Assets Ì anAmendment of APB Opinion No. 29'', which eliminates the exception for nonmonetary exchanges of similar
productive assets and replaces it with a general exception for exchanges of nonmonetary assets that do not
have commercial substance. The Company adopted SFAS No. 153 for nonmonetary asset exchanges
occurring on or after July 1, 2005. The adoption SFAS No. 153 did not have a significant impact on the
Company's combined and consolidated financial position or results of operations.
In March 2005, the FASB issued Interpretation No. 47, ""Accounting for Conditional Asset RetirementObligations'', which clarifies that an entity is required to recognize a liability for the fair value of a conditional
asset retirement obligation if the fair value can be reasonably estimated even though uncertainty exists about
the timing and (or) method of settlement. The Company is required to adopt Interpretation No. 47 prior to
the end of its 2006 financial year. The Company adopted Interpretation No. 47 during the 2006 financial year,
which did not have a significant impact on its consolidated financial positions or results of operations.
In May 2005, the FASB issued SFAS No. 154, ""Accounting Changes and Error Corrections''.SFAS No. 154 replaces APB Opinion No. 20, ""Accounting Changes'', and SFAS No. 3, ""ReportingAccounting Changes in Interim Financial Statements'', and changes the requirements for the accounting and
reporting of a change in accounting principle. The Company is required to adopt SFAS No. 154 for
accounting changes and error corrections that occur after September 30, 2006. The Company's results of
operations and financial condition will only be impacted following the adoption of SFAS No. 154 if it
implements changes in accounting principle that are addressed by the standard or corrects accounting errors in
future periods.
In July 2006, the FASB issued FASB Interpretation 48, ""Accounting for Income Tax Uncertainties''which defines the threshold for recognizing the benefits of tax return positions in the financial statements as
""more-likely-than-not'' to be sustained by the taxing authority. The recently issued literature also provides
guidance on the derecognition, measurement and classification of income tax uncertainties, along with any
related interest and penalties. Interpretation No. 48 also includes guidance concerning accounting for income
tax uncertainties in interim periods and increases the level of disclosures associated with any recorded income
tax uncertainties. Interpretation No. 48 is effective for fiscal years beginning after December 15, 2006. The
differences between the amounts recognized in the statements of financial position prior to the adoption of
Interpretation No. 48 and the amounts reported after adoption will be accounted for as a cumulative-effect
F-17
Global Reports LLC

QIMONDA AG AND SUBSIDIARIES
Notes to the Combined and Consolidated Financial Statements Ì (Continued)
(euro in millions, except where otherwise stated)
adjustment recorded to the beginning balance of retained earnings. The Company is in the process of
determining the impact, if any, that the adoption of Interpretation No. 48 will have on its consolidated
financial position and results of operations.
In September 2006, the FASB released SFAS No. 157, ""Fair Value Measurements'', which provides
guidance for using fair value to measure assets and liabilities. SFAS No. 157 defines fair value, establishes a
framework for measuring fair value in generally accepted accounting principles, and expands disclosures about
fair value measurements. The standard also responds to investors' requests for more information about the
extent to which companies measure assets and liabilities at fair value, the information used to measure fair
value, and the effect that fair value measurements have on earnings. SFAS No. 157 will apply whenever
another standard requires (or permits) assets or liabilities to be measured at fair value. The standard does not
expand the use of fair value to any new circumstances. SFAS No. 157 is effective for financial statements
issued for financial years beginning after November 15, 2007, and interim periods within those financial years.
SFAS No. 157 is effective for the Company for financial years beginning after October 1, 2008, and interim
periods within those financial years. The Company is in the process of evaluating the impact that the adoption
of SFAS No. 157 will have on its consolidated financial position and results of operations.
In September 2006, the FASB issued SFAS No. 158 ""Employers' Accounting for Defined BenefitPension and Other Postretirement Plans Ì an amendment of FASB Statements No. 87, 88, 106, and 132(R),''which requires an employer to recognize the overfunded or underfunded status of a defined benefit
postretirement plan (other than a multiemployer plan) as an asset or liability in its statement of financial
position and to recognize changes in that funded status in the year in which the changes occur through
comprehensive income of a business entity or changes in unrestricted net assets of a not-for-profit organization
(""Recognition Provision''). SFAS No. 158 also requires an employer to measure the funded status of a plan as
of the date of its year-end statement of financial position, with limited exceptions (""Measurement Date
Provision''). The Company currently measures the funded status of its plan annually on June 30. The
Recognition Provision of SFAS No. 158 is effective for the Company as of the end of the fiscal year ending
September 30, 2007, and the Measurement Date Provision is effective for the Company as of the end of the
fiscal year ending September 30, 2009. The Company does not expect the change in the annual measurement
date to September 30 to have a significant impact on its results of operations or financial position. As of
September 30, 2006 the application of the Recognition Provision of SFAS No. 158 would have resulted in an
increase in other long-term liabilities of 47, an increase in non-current deferred tax assets of 43 and an increasein accumulated other comprehensive loss of 44.
In September 2006, the SEC issued Staff Accounting Bulletin No. 108, ""Considering the Effects of PriorYear Misstatements when Quantifying Misstatements in Current Year Financial Statements''. SAB No. 108
provides interpretive guidance on how the effects of prior-year uncorrected misstatements should be
considered when quantifying misstatements in the current year financial statements. SAB No. 108 requires
registrants to quantify misstatements using both an income statement (""rollover'') and balance sheet (""iron
curtain'') approach and evaluate whether either approach results in a misstatement that, when all relevant
quantitative and qualitative factors are considered, is material. If prior year errors that had been previously
considered immaterial now are considered material based on either approach, no restatement is required so
long as management properly applied its previous approach and all relevant facts and circumstances were
considered. If prior years are not restated, the cumulative effect adjustment is recorded in opening
accumulated earnings (deficit) as of the beginning of the year of adoption. SAB No. 108 is effective for fiscal
years ending on or after November 15, 2006, with earlier adoption encouraged. The Company does not expect
that the adoption of SAB No. 108 will have a significant impact on its consolidated financial position and
results of operations.
F-18
Global Reports LLC
QIMONDA AG AND SUBSIDIARIES
Notes to the Combined and Consolidated Financial Statements Ì (Continued)
(euro in millions, except where otherwise stated)
3. Acquisitions
During December 2004, Saifun Semiconductors Ltd. (""Saifun'') and the Company modified their
existing flash cooperation agreement. As a consequence, the Company consummated the acquisition of
Saifun's remaining 30% share in the Infineon Technologies Flash joint venture in January 2005 and was
granted a license for the use of Saifun NROM» technologies, in exchange for $95 million (subsequently
reduced to $48 million) to be paid in quarterly installments over 10 years and additional purchase
consideration primarily in the form of net liabilities assumed aggregating to 47 (see note 17). The assets
acquired and liabilities assumed were recorded in the accompanying combined and consolidated balance sheet
based upon their estimated fair values as of the date of the acquisition (see note 21). The excess of the
purchase price over the estimated fair values of the underlying assets acquired and liabilities assumed
amounted to 47 and was allocated to goodwill. The Company has sole ownership and responsibility for the
business and started to account for its entire financial results in the three months ended March 31, 2005. In
light of the weak market conditions for commodity NAND Flash memories in the three months ended
September 30, 2006, Qimonda decided to ramp down its Flash production and stop the current development
of NAND-compatible flash memory products based on Saifun's proprietary NROM» technology. Qimonda
and Saifun amended the above license agreement to terminate the payment of quarterly installments as of
December 31, 2006. As a result of the above, Qimonda reduced payables, goodwill and other intangible assets,
and recognized an impairment charge of 49 (see note 7) related to the license (47) and fixed assets (42) that
were not considered to be recoverable as of September 30, 2006.
The Company had no acquisitions during the year ended September 30, 2006. The following table
summarizes the net assets acquired as a result of the Company's acquisition during the year ended
September 30, 2005:
2005
Acquisition Date ÏÏÏÏÏÏÏÏÏÏÏÏÏÏÏÏÏÏÏÏÏÏÏÏÏÏÏÏÏÏÏÏÏÏÏÏÏÏÏÏÏÏÏÏÏÏÏÏÏÏÏÏÏÏ January 2005
Cash ÏÏÏÏÏÏÏÏÏÏÏÏÏÏÏÏÏÏÏÏÏÏÏÏÏÏÏÏÏÏÏÏÏÏÏÏÏÏÏÏÏÏÏÏÏÏÏÏÏÏÏÏÏÏÏÏÏÏÏÏÏÏÏÏ 1
Other current assets ÏÏÏÏÏÏÏÏÏÏÏÏÏÏÏÏÏÏÏÏÏÏÏÏÏÏÏÏÏÏÏÏÏÏÏÏÏÏÏÏÏÏÏÏÏÏÏÏÏÏÏ 16
Property, plant and equipmentÏÏÏÏÏÏÏÏÏÏÏÏÏÏÏÏÏÏÏÏÏÏÏÏÏÏÏÏÏÏÏÏÏÏÏÏÏÏÏÏÏÏÏ 4
Intangible assets Ì core technology ÏÏÏÏÏÏÏÏÏÏÏÏÏÏÏÏÏÏÏÏÏÏÏÏÏÏÏÏÏÏÏÏÏÏÏÏÏÏ 58
Goodwill ÏÏÏÏÏÏÏÏÏÏÏÏÏÏÏÏÏÏÏÏÏÏÏÏÏÏÏÏÏÏÏÏÏÏÏÏÏÏÏÏÏÏÏÏÏÏÏÏÏÏÏÏÏÏÏÏÏÏÏÏÏ 7
Other non-current assetsÏÏÏÏÏÏÏÏÏÏÏÏÏÏÏÏÏÏÏÏÏÏÏÏÏÏÏÏÏÏÏÏÏÏÏÏÏÏÏÏÏÏÏÏÏÏÏÏ 3
Total assets acquiredÏÏÏÏÏÏÏÏÏÏÏÏÏÏÏÏÏÏÏÏÏÏÏÏÏÏÏÏÏÏÏÏÏÏÏÏÏÏÏÏÏÏÏÏÏÏÏÏÏÏÏ 89
Current liabilitiesÏÏÏÏÏÏÏÏÏÏÏÏÏÏÏÏÏÏÏÏÏÏÏÏÏÏÏÏÏÏÏÏÏÏÏÏÏÏÏÏÏÏÏÏÏÏÏÏÏÏÏÏÏÏ (45)
Non-current liabilities (including debt) ÏÏÏÏÏÏÏÏÏÏÏÏÏÏÏÏÏÏÏÏÏÏÏÏÏÏÏÏÏÏÏÏÏÏÏ (2)
Total liabilities assumed ÏÏÏÏÏÏÏÏÏÏÏÏÏÏÏÏÏÏÏÏÏÏÏÏÏÏÏÏÏÏÏÏÏÏÏÏÏÏÏÏÏÏÏÏÏÏÏÏ (47)
Net assets acquired ÏÏÏÏÏÏÏÏÏÏÏÏÏÏÏÏÏÏÏÏÏÏÏÏÏÏÏÏÏÏÏÏÏÏÏÏÏÏÏÏÏÏÏÏÏÏÏÏÏÏÏÏ 42
Cash paid (Purchase consideration) ÏÏÏÏÏÏÏÏÏÏÏÏÏÏÏÏÏÏÏÏÏÏÏÏÏÏÏÏÏÏÏÏÏÏÏÏÏÏ Ì
The above acquisition has been accounted for by the purchase method of accounting and, accordingly,
the combined and consolidated statements of operations include the results of the acquired company from its
acquisition date. For each significant acquisition the Company engages an independent third party to assist in
the valuation of net assets acquired. Pro forma financial information relating to this acquisition is not material
either individually or in the aggregate to the results of operations and financial position of the Company and
has been omitted.
F-19
Global Reports LLC

QIMONDA AG AND SUBSIDIARIES
Notes to the Combined and Consolidated Financial Statements Ì (Continued)
(euro in millions, except where otherwise stated)
4. Divestitures
Effective October 1, 2004 Infineon transferred the 200mm front-end manufacturing facility located in
Dresden, Germany (""DD200'') from the Memory Products business to the Logic business of Infineon, since
the facility would be used to manufacture logic products in the future. Accordingly, the Infineon Logic
business took over the management responsibility for this operation from the transfer date.
Through September 30, 2004 the DD200 balance sheet and income statement is included in the
Company's historical combined financial statements because the business was owned and operated as part of
the Memory Products business. Since the transfer was between entities under common control, the transfer
was effected at historical book value as a non-cash reduction of business equity (note 26).
Until the facility is fully converted to logic production, the Company is charged for the capacity utilized
to manufacture the products it purchases from Infineon. In April 2006, the Company entered into a product
purchase agreement with Infineon through the end of the 2007 financial year related to the DD200 facility
based on Infineon's cost plus a margin. Qimonda is currently in negotiations with Infineon regarding the
Company's use or acquisition, after September 30, 2007, of capacity at Infineon's 200mm manufacturing
facility in Dresden. Infineon and the Company have agreed in principle that they will share equally any
potential restructuring costs arising in connection with one module. Restructuring cost will depend on the
extent of our capacity usage after September 30, 2007.
The following table summarizes the results of the transferred DD200 facility for the year ended
September 30, 2004:
2004
Sales
Third partiesÏÏÏÏÏÏÏÏÏÏÏÏÏÏÏÏÏÏÏÏÏÏÏÏÏÏÏÏÏÏÏÏÏÏÏÏÏÏÏÏÏÏÏÏÏÏÏÏÏÏÏÏÏÏÏÏÏÏÏÏÏÏÏÏ 1
Related parties ÏÏÏÏÏÏÏÏÏÏÏÏÏÏÏÏÏÏÏÏÏÏÏÏÏÏÏÏÏÏÏÏÏÏÏÏÏÏÏÏÏÏÏÏÏÏÏÏÏÏÏÏÏÏÏÏÏÏÏÏÏÏ 83
Net salesÏÏÏÏÏÏÏÏÏÏÏÏÏÏÏÏÏÏÏÏÏÏÏÏÏÏÏÏÏÏÏÏÏÏÏÏÏÏÏÏÏÏÏÏÏÏÏÏÏÏÏÏÏÏÏÏÏÏÏÏÏÏÏÏÏÏÏÏÏ 84
Loss before taxÏÏÏÏÏÏÏÏÏÏÏÏÏÏÏÏÏÏÏÏÏÏÏÏÏÏÏÏÏÏÏÏÏÏÏÏÏÏÏÏÏÏÏÏÏÏÏÏÏÏÏÏÏÏÏÏÏÏÏÏÏÏÏÏ (5)
Income tax benefit ÏÏÏÏÏÏÏÏÏÏÏÏÏÏÏÏÏÏÏÏÏÏÏÏÏÏÏÏÏÏÏÏÏÏÏÏÏÏÏÏÏÏÏÏÏÏÏÏÏÏÏÏÏÏÏÏÏÏÏÏ Ì
Net lossÏÏÏÏÏÏÏÏÏÏÏÏÏÏÏÏÏÏÏÏÏÏÏÏÏÏÏÏÏÏÏÏÏÏÏÏÏÏÏÏÏÏÏÏÏÏÏÏÏÏÏÏÏÏÏÏÏÏÏÏÏÏÏÏÏÏÏÏÏÏ (5)
Effective October 1, 2005 Infineon transferred the development facility Infineon Technologies MP
Development Center France S.A.S, France located in Corbeil Essonnes, France (""IFMDF'') from the
Memory Products business to the Logic business of Infineon, due to the revised scope of its future
development activities. Accordingly, the Infineon Logic business took over the management responsibility for
this operation from the transfer date. Through September 30, 2005 the IFMDF balance sheet and income
statement is included in the Company's historical combined financial statements because the business was
owned and operated as part of the Memory Products business. The results of the transferred facility's
operations during the year ended September 30, 2005 are not material. The net book value of 410 was
reflected as a non-cash reduction to business/shareholders' equity as of October 1, 2005. (note 26).
5. License Income
During the years ended September 30, 2004, 2005 and 2006, the Company recognized revenues related to
license and technology transfer fees of 461, 4160 and 47, respectively, which are included in net sales in the
accompanying statements of operations. Included in these amounts are previously deferred license fees of 448,433 and 42, which were recognized as revenue pursuant to SAB 104, for the years ended September 30, 2004,
F-20
Global Reports LLC

QIMONDA AG AND SUBSIDIARIES
Notes to the Combined and Consolidated Financial Statements Ì (Continued)
(euro in millions, except where otherwise stated)
2005 and 2006, respectively, since the Company had fulfilled all of its obligations and all such amounts were
realized.
On November 10, 2004, the Company and ProMOS Technologies Inc. (""ProMOS'') reached an
agreement regarding ProMOS' license of the Company's previously transferred technologies, pursuant to
which ProMOS may continue to produce and sell products using those technologies and to develop its own
processes and products. The Company has no continuing future involvement with the licensing of these
products to ProMOS. As full consideration, ProMOS agreed to pay the Company $156 million in four
installments through April 30, 2006, against which the Company's accrued payable for DRAM products from
ProMOS of $36 million was offset. The parties agreed to withdraw their respective claims, including
arbitration. The present value of the settlement amounted to 4118 and was recognized as license income
during the first quarter of the 2005 financial year.
In connection with its joint technology development with Nanya Technology Corporation (""Nanya''), in
2003, the Company granted Nanya a license to use its 110nm technology in Nanya's existing operations. In
September 29, 2005, the Company and Nanya signed an agreement to expand their development cooperation
with respect to the joint development of advanced 58nm production technologies for 300mm wafers (see
note 16). License income related to the technology is recognized over the estimated life of the technology.
In connection with the extension of a capacity reservation agreement with Winbond Electronics Corp.,
Hsinchu, Taiwan (""Winbond'') in August 2004, the Company granted Winbond a license to use its 110nm
technology in Winbond's production process for the manufacturing of products for the Company. On
August 29, 2006, the Company signed agreements with Winbond to expand their existing cooperation and
capacity reservation. Under the terms of the agreements, the Company will transfer its 80nm DRAM trench
technology to Winbond's 300mm-wafer facility. In return, Winbond will manufacture DRAMs for computing
applications using this technology exclusively for the Company. The license income was deferred and is being
recognized over the life of the capacity reservation agreements.
6. Grants
The Company has received economic development funding from various governmental entities, including
grants for the construction of manufacturing facilities, as well as grants to subsidize research and development
activities and employee training. Grants and subsidies included in the accompanying combined and
consolidated financial statements during the years ended September 30, 2004, 2005 and 2006, are as follows:
2004 2005 2006
Included in the combined and consolidated statements of operations:
Research and development ÏÏÏÏÏÏÏÏÏÏÏÏÏÏÏÏÏÏÏÏÏÏÏÏÏÏÏÏÏÏÏÏÏÏÏÏÏÏÏÏ 25 16 17
Cost of sales ÏÏÏÏÏÏÏÏÏÏÏÏÏÏÏÏÏÏÏÏÏÏÏÏÏÏÏÏÏÏÏÏÏÏÏÏÏÏÏÏÏÏÏÏÏÏÏÏÏÏÏÏ 86 94 95
111 110 112
Construction grants deducted from the cost of fixed assets (note 26)ÏÏÏÏÏÏÏ 49 Ì 49
Deferred government grants at September 30 (notes 20 and 22)ÏÏÏÏÏÏÏÏÏÏÏ 208 179
Grants receivable at September 30 (note 14 and 17) ÏÏÏÏÏÏÏÏÏÏÏÏÏÏÏÏÏÏÏÏ 78 118
F-21
Global Reports LLC

QIMONDA AG AND SUBSIDIARIES
Notes to the Combined and Consolidated Financial Statements Ì (Continued)
(euro in millions, except where otherwise stated)
7. Other Operating Expense, net
Other operating expense, net for the years ended September 30, 2004, 2005 and 2006, is as follows:
2004 2005 2006
Litigation settlement charges (note 31)ÏÏÏÏÏÏÏÏÏÏÏÏÏÏÏÏÏÏÏÏÏÏÏÏÏÏÏÏÏÏÏÏ 194 20 54
Impairment charges (note 3) ÏÏÏÏÏÏÏÏÏÏÏÏÏÏÏÏÏÏÏÏÏÏÏÏÏÏÏÏÏÏÏÏÏÏÏÏÏÏÏÏ Ì Ì 9
Other, net ÏÏÏÏÏÏÏÏÏÏÏÏÏÏÏÏÏÏÏÏÏÏÏÏÏÏÏÏÏÏÏÏÏÏÏÏÏÏÏÏÏÏÏÏÏÏÏÏÏÏÏÏÏÏÏÏ Ì (7) (3)
194 13 60
Litigation settlement charges refer to the settlement of an antitrust investigation by the U.S. Department
of Justice and related settlements with customers (see note 19), as well as, during the year ended
September 30, 2006, the settlement of the Tessera litigation (see note 17).
8. Restructuring
In 2004, Infineon announced restructuring measures aimed at reducing costs. As part of the restructuring,
the Memory Products business terminated 31 employees, primarily as a result of relocating the Company's
Maskhouse operations from Munich to Dresden. This plan was completed in the 2005 financial year although
lease termination costs related to the U.S. operations remained accrued at September 30, 2005 and were
settled during the year ended September 30, 2006.
During the years ended September 30, 2004, 2005 and 2006, charges of 42, 41 and 40, respectively, were
recognized as a result of these restructuring initiatives. As of September 30, 2005 and 2006, restructuring
liabilities were 42 and 40, respectively (see note 20).
9. Income Taxes
Income before income taxes and minority interests is attributable to the following geographic locations
for the years ended September 30, 2004, 2005 and 2006:2004 2005 2006
Germany ÏÏÏÏÏÏÏÏÏÏÏÏÏÏÏÏÏÏÏÏÏÏÏÏÏÏÏÏÏÏÏÏÏÏÏÏÏÏÏÏÏÏÏÏÏÏÏÏÏÏÏÏÏÏÏÏÏ 76 41 22
ForeignÏÏÏÏÏÏÏÏÏÏÏÏÏÏÏÏÏÏÏÏÏÏÏÏÏÏÏÏÏÏÏÏÏÏÏÏÏÏÏÏÏÏÏÏÏÏÏÏÏÏÏÏÏÏÏÏÏÏÏ 39 61 172
TotalÏÏÏÏÏÏÏÏÏÏÏÏÏÏÏÏÏÏÏÏÏÏÏÏÏÏÏÏÏÏÏÏÏÏÏÏÏÏÏÏÏÏÏÏÏÏÏÏÏÏÏÏÏÏÏÏÏÏÏÏÏ 115 102 194
Income tax expense (benefit) for the years ended September 30, 2004, 2005 and 2006 is as follows:
2004 2005 2006
Current taxes:
Germany ÏÏÏÏÏÏÏÏÏÏÏÏÏÏÏÏÏÏÏÏÏÏÏÏÏÏÏÏÏÏÏÏÏÏÏÏÏÏÏÏÏÏÏÏÏÏÏÏÏÏÏÏÏÏÏ 42 27 63
ForeignÏÏÏÏÏÏÏÏÏÏÏÏÏÏÏÏÏÏÏÏÏÏÏÏÏÏÏÏÏÏÏÏÏÏÏÏÏÏÏÏÏÏÏÏÏÏÏÏÏÏÏÏÏÏÏÏÏ 35 6 28
77 33 91
Deferred taxes:
Germany ÏÏÏÏÏÏÏÏÏÏÏÏÏÏÏÏÏÏÏÏÏÏÏÏÏÏÏÏÏÏÏÏÏÏÏÏÏÏÏÏÏÏÏÏÏÏÏÏÏÏÏÏÏÏÏ 171 46 21
ForeignÏÏÏÏÏÏÏÏÏÏÏÏÏÏÏÏÏÏÏÏÏÏÏÏÏÏÏÏÏÏÏÏÏÏÏÏÏÏÏÏÏÏÏÏÏÏÏÏÏÏÏÏÏÏÏÏÏ (37) 7 2
134 53 23
Income tax expense ÏÏÏÏÏÏÏÏÏÏÏÏÏÏÏÏÏÏÏÏÏÏÏÏÏÏÏÏÏÏÏÏÏÏÏÏÏÏÏÏÏÏÏÏÏÏÏÏ 211 86 114
F-22
Global Reports LLC

QIMONDA AG AND SUBSIDIARIES
Notes to the Combined and Consolidated Financial Statements Ì (Continued)
(euro in millions, except where otherwise stated)
The Company's statutory tax rate in Germany is 25%. Additionally, a solidarity surcharge of 5.5% and
trade tax of 13% is levied, for a combined statutory tax rate of 39%.
A reconciliation of income taxes for the years ended September 30, 2004, 2005 and 2006, determined
using the German corporate tax rate plus trade taxes, net of federal benefit, for a combined statutory rate of
39% for 2004, 2005 and 2006 is as follows:
2004 2005 2006
Expected expense for income taxes ÏÏÏÏÏÏÏÏÏÏÏÏÏÏÏÏÏÏÏÏÏÏÏÏÏÏÏÏÏÏÏÏÏÏÏ 44 40 75
Decrease (increase) in available tax credits ÏÏÏÏÏÏÏÏÏÏÏÏÏÏÏÏÏÏÏÏÏÏÏÏÏÏÏÏ (5) 11 2
Non-taxable investment (income) loss ÏÏÏÏÏÏÏÏÏÏÏÏÏÏÏÏÏÏÏÏÏÏÏÏÏÏÏÏÏÏÏÏ 6 (21) (50)
Foreign tax rate differential ÏÏÏÏÏÏÏÏÏÏÏÏÏÏÏÏÏÏÏÏÏÏÏÏÏÏÏÏÏÏÏÏÏÏÏÏÏÏÏÏÏÏ (13) (8) (38)
Non deductible expenses and other provisions ÏÏÏÏÏÏÏÏÏÏÏÏÏÏÏÏÏÏÏÏÏÏÏÏÏÏ 51 3 5
Increase in valuation allowanceÏÏÏÏÏÏÏÏÏÏÏÏÏÏÏÏÏÏÏÏÏÏÏÏÏÏÏÏÏÏÏÏÏÏÏÏÏÏÏ 27 14 11
Losses not available to Qimonda due to Formation ÏÏÏÏÏÏÏÏÏÏÏÏÏÏÏÏÏÏÏÏÏÏ 98 43 114
Other ÏÏÏÏÏÏÏÏÏÏÏÏÏÏÏÏÏÏÏÏÏÏÏÏÏÏÏÏÏÏÏÏÏÏÏÏÏÏÏÏÏÏÏÏÏÏÏÏÏÏÏÏÏÏÏÏÏÏÏÏ 3 4 (5)
Actual expense for income taxesÏÏÏÏÏÏÏÏÏÏÏÏÏÏÏÏÏÏÏÏÏÏÏÏÏÏÏÏÏÏÏÏÏÏÏÏÏÏ 211 86 114
The current tax expense resulting from the Formation was 46 for the year ended September 30, 2006. The
deferred tax expense for the year ended September 30, 2006 resulting from the Formation was 413 due to
reduced deferred tax benefits available to the Company and 4101 due to net operating losses which are to be
utilized by Infineon.
The Company has set up operations in a jurisdiction which grants a tax holiday from the 2005 financial
year onwards, which has a remaining term of three years. Compared to ordinary taxation in the country of
residence this results in tax savings of 40 and 416 for the years ending September 30, 2005 and 2006,
respectively, which are reflected in the foreign tax rate differential.
F-23
Global Reports LLC

QIMONDA AG AND SUBSIDIARIES
Notes to the Combined and Consolidated Financial Statements Ì (Continued)
(euro in millions, except where otherwise stated)
Deferred income tax assets and liabilities as of September 30, 2005 and 2006 relate to the following:
2005 2006
Deferred tax assets:
Intangible assets ÏÏÏÏÏÏÏÏÏÏÏÏÏÏÏÏÏÏÏÏÏÏÏÏÏÏÏÏÏÏÏÏÏÏÏÏÏÏÏÏÏÏÏÏÏÏÏÏÏÏÏÏÏÏÏ 23 79
Property, plant and equipmentÏÏÏÏÏÏÏÏÏÏÏÏÏÏÏÏÏÏÏÏÏÏÏÏÏÏÏÏÏÏÏÏÏÏÏÏÏÏÏÏÏÏÏÏ 45 71
Other ÏÏÏÏÏÏÏÏÏÏÏÏÏÏÏÏÏÏÏÏÏÏÏÏÏÏÏÏÏÏÏÏÏÏÏÏÏÏÏÏÏÏÏÏÏÏÏÏÏÏÏÏÏÏÏÏÏÏÏÏÏÏÏÏ 16 7
Trade accounts receivable ÏÏÏÏÏÏÏÏÏÏÏÏÏÏÏÏÏÏÏÏÏÏÏÏÏÏÏÏÏÏÏÏÏÏÏÏÏÏÏÏÏÏÏÏÏÏÏ 10 16
Accrued liabilities ÏÏÏÏÏÏÏÏÏÏÏÏÏÏÏÏÏÏÏÏÏÏÏÏÏÏÏÏÏÏÏÏÏÏÏÏÏÏÏÏÏÏÏÏÏÏÏÏÏÏÏÏÏÏ 16 31
Liabilities ÏÏÏÏÏÏÏÏÏÏÏÏÏÏÏÏÏÏÏÏÏÏÏÏÏÏÏÏÏÏÏÏÏÏÏÏÏÏÏÏÏÏÏÏÏÏÏÏÏÏÏÏÏÏÏÏÏÏÏÏÏ 14 15
Deferred income ÏÏÏÏÏÏÏÏÏÏÏÏÏÏÏÏÏÏÏÏÏÏÏÏÏÏÏÏÏÏÏÏÏÏÏÏÏÏÏÏÏÏÏÏÏÏÏÏÏÏÏÏÏÏÏ 69 65
Net operating loss and tax credit carry-forwardsÏÏÏÏÏÏÏÏÏÏÏÏÏÏÏÏÏÏÏÏÏÏÏÏÏÏÏÏÏ 87 32
Gross deferred tax assets ÏÏÏÏÏÏÏÏÏÏÏÏÏÏÏÏÏÏÏÏÏÏÏÏÏÏÏÏÏÏÏÏÏÏÏÏÏÏÏÏÏÏÏÏÏÏÏÏÏÏ 280 316
Valuation allowance ÏÏÏÏÏÏÏÏÏÏÏÏÏÏÏÏÏÏÏÏÏÏÏÏÏÏÏÏÏÏÏÏÏÏÏÏÏÏÏÏÏÏÏÏÏÏÏÏÏÏÏÏÏÏ (59) (70)
Deferred tax assets ÏÏÏÏÏÏÏÏÏÏÏÏÏÏÏÏÏÏÏÏÏÏÏÏÏÏÏÏÏÏÏÏÏÏÏÏÏÏÏÏÏÏÏÏÏÏÏÏÏÏÏÏÏÏÏ 221 246
Deferred tax liabilities:
Property, plant and equipmentÏÏÏÏÏÏÏÏÏÏÏÏÏÏÏÏÏÏÏÏÏÏÏÏÏÏÏÏÏÏÏÏÏÏÏÏÏÏÏÏÏÏÏÏ (27) (44)
Investments ÏÏÏÏÏÏÏÏÏÏÏÏÏÏÏÏÏÏÏÏÏÏÏÏÏÏÏÏÏÏÏÏÏÏÏÏÏÏÏÏÏÏÏÏÏÏÏÏÏÏÏÏÏÏÏÏÏÏÏ Ì (3)
Inventories ÏÏÏÏÏÏÏÏÏÏÏÏÏÏÏÏÏÏÏÏÏÏÏÏÏÏÏÏÏÏÏÏÏÏÏÏÏÏÏÏÏÏÏÏÏÏÏÏÏÏÏÏÏÏÏÏÏÏÏÏ (2) (3)
Trade accounts receivable ÏÏÏÏÏÏÏÏÏÏÏÏÏÏÏÏÏÏÏÏÏÏÏÏÏÏÏÏÏÏÏÏÏÏÏÏÏÏÏÏÏÏÏÏÏÏÏ (6) (12)
Accrued liabilities ÏÏÏÏÏÏÏÏÏÏÏÏÏÏÏÏÏÏÏÏÏÏÏÏÏÏÏÏÏÏÏÏÏÏÏÏÏÏÏÏÏÏÏÏÏÏÏÏÏÏÏÏÏÏ (12) (15)
Liabilities ÏÏÏÏÏÏÏÏÏÏÏÏÏÏÏÏÏÏÏÏÏÏÏÏÏÏÏÏÏÏÏÏÏÏÏÏÏÏÏÏÏÏÏÏÏÏÏÏÏÏÏÏÏÏÏÏÏÏÏÏÏ (3) (14)
Other items ÏÏÏÏÏÏÏÏÏÏÏÏÏÏÏÏÏÏÏÏÏÏÏÏÏÏÏÏÏÏÏÏÏÏÏÏÏÏÏÏÏÏÏÏÏÏÏÏÏÏÏÏÏÏÏÏÏÏÏ (6) (2)
Deferred tax liabilities ÏÏÏÏÏÏÏÏÏÏÏÏÏÏÏÏÏÏÏÏÏÏÏÏÏÏÏÏÏÏÏÏÏÏÏÏÏÏÏÏÏÏÏÏÏÏÏÏÏÏÏÏ (56) (93)
Deferred tax assets, net ÏÏÏÏÏÏÏÏÏÏÏÏÏÏÏÏÏÏÏÏÏÏÏÏÏÏÏÏÏÏÏÏÏÏÏÏÏÏÏÏÏÏÏÏÏÏÏÏÏÏÏ 165 153
Net deferred income tax assets and liabilities are presented in the accompanying combined and
consolidated balance sheets as of September 30, 2005 and 2006 as follows:
2005 2006
Deferred tax assets:
Current ÏÏÏÏÏÏÏÏÏÏÏÏÏÏÏÏÏÏÏÏÏÏÏÏÏÏÏÏÏÏÏÏÏÏÏÏÏÏÏÏÏÏÏÏÏÏÏÏÏÏÏÏÏÏÏÏÏÏÏÏÏÏÏ 49 47
Non-current ÏÏÏÏÏÏÏÏÏÏÏÏÏÏÏÏÏÏÏÏÏÏÏÏÏÏÏÏÏÏÏÏÏÏÏÏÏÏÏÏÏÏÏÏÏÏÏÏÏÏÏÏÏÏÏÏÏÏÏ 125 160
Deferred tax liabilities:
Current ÏÏÏÏÏÏÏÏÏÏÏÏÏÏÏÏÏÏÏÏÏÏÏÏÏÏÏÏÏÏÏÏÏÏÏÏÏÏÏÏÏÏÏÏÏÏÏÏÏÏÏÏÏÏÏÏÏÏÏÏÏÏÏ Ì (18)
Non-current ÏÏÏÏÏÏÏÏÏÏÏÏÏÏÏÏÏÏÏÏÏÏÏÏÏÏÏÏÏÏÏÏÏÏÏÏÏÏÏÏÏÏÏÏÏÏÏÏÏÏÏÏÏÏÏÏÏÏÏ (9) (36)
Deferred tax assets, net ÏÏÏÏÏÏÏÏÏÏÏÏÏÏÏÏÏÏÏÏÏÏÏÏÏÏÏÏÏÏÏÏÏÏÏÏÏÏÏÏÏÏÏÏÏÏÏÏÏÏÏ 165 153
Information regarding net tax loss carry-forwards that will be retained by Infineon and not transferred to
the Company at Formation has not been provided as the Company does not believe that such information is
meaningful. Pursuant to the terms of the contribution agreement between the Company and Infineon,
substantially all net operating losses generated and not utilized by the Company have been transferred to and
retained by Infineon. As such, net deferred tax assets, reflecting valuation allowances calculated on a separate
F-24
Global Reports LLC

QIMONDA AG AND SUBSIDIARIES
Notes to the Combined and Consolidated Financial Statements Ì (Continued)
(euro in millions, except where otherwise stated)
return basis by the Company for losses it could not utilize, of 459, 46 and 40 for the years ended September 30,
2004, 2005 and 2006, respectively, have been accounted for as equity transactions with Infineon.
As of September 30, 2005 and 2006, the Company had tax-effected credit carry-forwards of 428 and 432,respectively, that will be retained by the Company. Such tax credit-carry-forwards are generally limited to be
used by the particular entity that generated the loss or credit and do not expire under current law. The benefit
for tax credits is accounted for on the flow-through method when the individual entity is entitled to the claim.
Pursuant to SFAS No. 109, the Company has assessed its deferred tax asset and the need for a valuation
allowance. Such an assessment considers whether it is more likely than not that some portion or all of the
deferred tax assets may not be realized. The assessment requires considerable judgment on the part of
management, with respect to, among other factors, benefits that could be realized from available tax strategies
and future taxable income, as well as other positive and negative factors. The ultimate realization of deferred
tax assets is dependent upon the Company's ability to generate the appropriate character of future taxable
income sufficient to utilize loss carry-forwards or tax credits before their expiration. The assessment was based
on the benefits that could be realized from available tax strategies, forecasted future taxable income and the
reversal of temporary differences in future periods. As a result of this assessment, the Company has increased
its deferred tax asset valuation allowance in those tax jurisdictions as of September 30, 2005 and 2006 to
reduce the deferred tax asset to an amount that is more likely than not expected to be realized in future.
Included in the valuation allowance for the years ended September 30, 2005 and 2006 is an amount of 49and 40, respectively, which will be utilized against goodwill and other intangible assets in the event of a future
recovery of fully provided tax assets from acquisitions.
The changes in valuation allowance for deferred tax assets during the years ended September 30, 2005
and 2006 were as follows:
2005 2006
Balance, beginning of the yearÏÏÏÏÏÏÏÏÏÏÏÏÏÏÏÏÏÏÏÏÏÏÏÏÏÏÏÏÏÏÏÏÏÏÏÏÏÏÏÏÏÏÏÏÏÏ 45 59
Applicable to continuing operations ÏÏÏÏÏÏÏÏÏÏÏÏÏÏÏÏÏÏÏÏÏÏÏÏÏÏÏÏÏÏÏÏÏÏÏÏÏÏÏÏÏ 14 11
Balance, end of the yearÏÏÏÏÏÏÏÏÏÏÏÏÏÏÏÏÏÏÏÏÏÏÏÏÏÏÏÏÏÏÏÏÏÏÏÏÏÏÏÏÏÏÏÏÏÏÏÏÏÏÏ 59 70
The Company did not provide for income taxes or foreign withholding taxes on cumulative earnings of
foreign subsidiaries as of September 30, 2005 and 2006, because these earnings are intended to be indefinitely
reinvested in those operations. It is not practicable to estimate the amount of unrecognized deferred tax
liabilities for these undistributed foreign earnings.
The income tax (benefit) expense for the years ended September 30, 2004, 2005 and 2006 was allocated
to continuing operations and accumulated other comprehensive income. The aggregate amounts allocated to
equity, for unrealized gains (losses) on securities and minimum pension liabilities, were 40, 41 and 41 for the
years ended September 30, 2004, 2005 and 2006, respectively.
10. Earnings (Loss) Per Share
Basic earnings (loss) per share (""EPS'') is calculated by dividing net income (loss) by the weighted
average number of ordinary shares outstanding during the year.
In connection with the Formation, the ordinary shares outstanding were increased to 300,000,000 owned
by Infineon (see note 23). Accordingly, all applicable references to the number of ordinary shares and per
share information for periods prior to the Formation have been restated to reflect the 300,000,000 ordinary
F-25
Global Reports LLC

QIMONDA AG AND SUBSIDIARIES
Notes to the Combined and Consolidated Financial Statements Ì (Continued)
(euro in millions, except where otherwise stated)
shares outstanding. On August 9, 2006 the Company completed its IPO on the New York Stock Exchange
through the issuance of 42 million ordinary shares, which are traded as American Depositary Shares (ADSs).
The Company did not have any potentially dilutive instruments outstanding for the years ended
September 30, 2004, 2005 and 2006 (see note 24).
The computation of basic and diluted EPS for the years ended September 30, 2004, 2005 and 2006 is as
follows:
2004 2005 2006
Numerator Ì
Income (loss) available to ordinary shareholders (79) 18 74
Denominator Ì
Weighted-average shares outstandingÏÏÏÏÏÏÏÏÏÏÏ 300,000,000 300,000,000 305,983,562
Earnings (loss) per share (in euro):
Basic and diluted ÏÏÏÏÏÏÏÏÏÏÏÏÏÏÏÏÏÏÏÏÏÏÏÏÏÏÏÏÏ (0.26) 0.06 0.24
11. Marketable Securities
Marketable securities at September 30, 2005 and 2006 consist of the following:
2005 2006
Fair Unrealized Unrealized Fair Unrealized UnrealizedCost Value Gain Loss Cost Value Gain Loss
Foreign governmentsecurities ÏÏÏÏÏÏÏÏÏÏÏÏÏ Ì Ì Ì Ì 1 1 Ì Ì
Debt securities ÏÏÏÏÏÏÏÏÏÏ Ì Ì Ì Ì 2 3 1
Total debt securitiesÏÏÏÏÏÏ Ì Ì Ì Ì 3 4 1 Ì
Equity securitiesÏÏÏÏÏÏÏÏÏ 1 1 Ì Ì Ì Ì Ì Ì
Fixed Term deposits ÏÏÏÏÏ Ì Ì Ì Ì 139 138 Ì (1)
Total marketable securities 1 1 Ì Ì 142 142 1 (1)
Reflected as follows
Current assetsÏÏÏÏÏÏÏÏÏÏÏ Ì Ì Ì Ì 139 138 Ì (1)
Non-current assets(note 17) ÏÏÏÏÏÏÏÏÏÏÏÏ 1 1 Ì Ì 3 4 1 Ì
Total marketable securities 1 1 Ì Ì 142 142 1 (1)
Unrealized losses as of September 30, 2006 related to securities held for less than 12 months.
Realized gains (losses), net are reflected as other non-operating income (expense), net and were as
follows for the years ended September 30:
2004 2005 2006
Realized gains ÏÏÏÏÏÏÏÏÏÏÏÏÏÏÏÏÏÏÏÏÏÏÏÏÏÏÏÏÏÏÏÏÏÏÏÏÏÏÏÏÏÏÏÏÏÏÏÏÏÏÏÏÏ 4 Ì Ì
Realized losses ÏÏÏÏÏÏÏÏÏÏÏÏÏÏÏÏÏÏÏÏÏÏÏÏÏÏÏÏÏÏÏÏÏÏÏÏÏÏÏÏÏÏÏÏÏÏÏÏÏÏÏÏ (1) Ì Ì
Realized gains, net ÏÏÏÏÏÏÏÏÏÏÏÏÏÏÏÏÏÏÏÏÏÏÏÏÏÏÏÏÏÏÏÏÏÏÏÏÏÏÏÏÏÏÏÏÏÏÏÏÏ 3 Ì Ì
F-26
Global Reports LLC

QIMONDA AG AND SUBSIDIARIES
Notes to the Combined and Consolidated Financial Statements Ì (Continued)
(euro in millions, except where otherwise stated)
12. Trade Accounts Receivable, net
Trade accounts receivable at September 30, 2005 and 2006 consist of the following:
2005 2006
Third party Ì trade ÏÏÏÏÏÏÏÏÏÏÏÏÏÏÏÏÏÏÏÏÏÏÏÏÏÏÏÏÏÏÏÏÏÏÏÏÏÏÏÏÏÏÏÏÏÏÏÏÏÏÏÏÏÏ 445 764
Infineon group Ì trade (note 27)ÏÏÏÏÏÏÏÏÏÏÏÏÏÏÏÏÏÏÏÏÏÏÏÏÏÏÏÏÏÏÏÏÏÏÏÏÏÏÏÏÏÏÏ 8 61
Associated and Related Companies Ì trade (note 27) ÏÏÏÏÏÏÏÏÏÏÏÏÏÏÏÏÏÏÏÏÏÏÏÏÏ 4 Ì
Siemens group Ì trade (note 27)ÏÏÏÏÏÏÏÏÏÏÏÏÏÏÏÏÏÏÏÏÏÏÏÏÏÏÏÏÏÏÏÏÏÏÏÏÏÏÏÏÏÏÏ 1 Ì
Trade accounts receivable, gross ÏÏÏÏÏÏÏÏÏÏÏÏÏÏÏÏÏÏÏÏÏÏÏÏÏÏÏÏÏÏÏÏÏÏÏÏÏÏÏÏÏÏÏÏ 458 825
Allowance for doubtful accounts ÏÏÏÏÏÏÏÏÏÏÏÏÏÏÏÏÏÏÏÏÏÏÏÏÏÏÏÏÏÏÏÏÏÏÏÏÏÏÏÏÏÏÏÏ (19) (22)
Trade accounts receivable, netÏÏÏÏÏÏÏÏÏÏÏÏÏÏÏÏÏÏÏÏÏÏÏÏÏÏÏÏÏÏÏÏÏÏÏÏÏÏÏÏÏÏÏÏÏÏ 439 803
Activity in the allowance for doubtful accounts for the years ended September 30, 2005 and 2006 is as
follows:
2005 2006
Allowance for doubtful accounts, beginning of year ÏÏÏÏÏÏÏÏÏÏÏÏÏÏÏÏÏÏÏÏÏÏÏÏÏÏÏÏ 15 19
Provision for bad debt, net of recoveries ÏÏÏÏÏÏÏÏÏÏÏÏÏÏÏÏÏÏÏÏÏÏÏÏÏÏÏÏÏÏÏÏÏÏÏÏÏ 4 3
Allowance for doubtful accounts, end of year ÏÏÏÏÏÏÏÏÏÏÏÏÏÏÏÏÏÏÏÏÏÏÏÏÏÏÏÏÏÏÏÏÏ 19 22
13. Inventories
Inventories at September 30, 2005 and 2006 consist of the following:
2005 2006
Raw materials and supplies ÏÏÏÏÏÏÏÏÏÏÏÏÏÏÏÏÏÏÏÏÏÏÏÏÏÏÏÏÏÏÏÏÏÏÏÏÏÏÏÏÏÏÏÏÏÏÏÏ 31 54
Work-in-process ÏÏÏÏÏÏÏÏÏÏÏÏÏÏÏÏÏÏÏÏÏÏÏÏÏÏÏÏÏÏÏÏÏÏÏÏÏÏÏÏÏÏÏÏÏÏÏÏÏÏÏÏÏÏÏÏÏ 261 432
Finished goodsÏÏÏÏÏÏÏÏÏÏÏÏÏÏÏÏÏÏÏÏÏÏÏÏÏÏÏÏÏÏÏÏÏÏÏÏÏÏÏÏÏÏÏÏÏÏÏÏÏÏÏÏÏÏÏÏÏÏÏ 192 136
Total inventories ÏÏÏÏÏÏÏÏÏÏÏÏÏÏÏÏÏÏÏÏÏÏÏÏÏÏÏÏÏÏÏÏÏÏÏÏÏÏÏÏÏÏÏÏÏÏÏÏÏÏÏÏÏÏÏÏÏ 484 622
14. Other Current Assets
Other current assets at September 30, 2005 and 2006 consist of the following:
2005 2006
Grants receivableÏÏÏÏÏÏÏÏÏÏÏÏÏÏÏÏÏÏÏÏÏÏÏÏÏÏÏÏÏÏÏÏÏÏÏÏÏÏÏÏÏÏÏÏÏÏÏÏÏÏÏÏÏÏÏÏÏ 78 105
VAT and other tax receivables ÏÏÏÏÏÏÏÏÏÏÏÏÏÏÏÏÏÏÏÏÏÏÏÏÏÏÏÏÏÏÏÏÏÏÏÏÏÏÏÏÏÏÏÏÏ 34 97
Third party Ì financial and other receivables ÏÏÏÏÏÏÏÏÏÏÏÏÏÏÏÏÏÏÏÏÏÏÏÏÏÏÏÏÏÏÏÏÏ 35 24
License fees receivable ÏÏÏÏÏÏÏÏÏÏÏÏÏÏÏÏÏÏÏÏÏÏÏÏÏÏÏÏÏÏÏÏÏÏÏÏÏÏÏÏÏÏÏÏÏÏÏÏÏÏÏÏ 19 14
Prepaid expenses ÏÏÏÏÏÏÏÏÏÏÏÏÏÏÏÏÏÏÏÏÏÏÏÏÏÏÏÏÏÏÏÏÏÏÏÏÏÏÏÏÏÏÏÏÏÏÏÏÏÏÏÏÏÏÏÏÏ 10 14
Financial instruments (note 29) ÏÏÏÏÏÏÏÏÏÏÏÏÏÏÏÏÏÏÏÏÏÏÏÏÏÏÏÏÏÏÏÏÏÏÏÏÏÏÏÏÏÏÏÏ 7 6
Employee receivables (note 27) ÏÏÏÏÏÏÏÏÏÏÏÏÏÏÏÏÏÏÏÏÏÏÏÏÏÏÏÏÏÏÏÏÏÏÏÏÏÏÏÏÏÏÏÏ 3 2
Associated and Related Companies Ì financial and other receivables (note 27)ÏÏÏÏ 1 Ì
Other ÏÏÏÏÏÏÏÏÏÏÏÏÏÏÏÏÏÏÏÏÏÏÏÏÏÏÏÏÏÏÏÏÏÏÏÏÏÏÏÏÏÏÏÏÏÏÏÏÏÏÏÏÏÏÏÏÏÏÏÏÏÏÏÏÏÏ 11 3
Total other current assetsÏÏÏÏÏÏÏÏÏÏÏÏÏÏÏÏÏÏÏÏÏÏÏÏÏÏÏÏÏÏÏÏÏÏÏÏÏÏÏÏÏÏÏÏÏÏÏÏÏÏ 198 265
F-27
Global Reports LLC

QIMONDA AG AND SUBSIDIARIES
Notes to the Combined and Consolidated Financial Statements Ì (Continued)
(euro in millions, except where otherwise stated)
15. Property, Plant and Equipment, net
A summary of activity for property, plant and equipment for the year ended September 30, 2006 is as
follows:
Technical Other PlantLand and Equipment and Office ConstructionBuildings and Machinery Equipment in Progress Total
Cost
September 30, 2005 ÏÏÏÏÏÏÏÏÏÏÏÏÏÏÏÏÏÏÏÏÏÏ 820 3,389 766 91 5,066
Additions ÏÏÏÏÏÏÏÏÏÏÏÏÏÏÏÏÏÏÏÏÏÏÏÏÏÏÏÏÏ 1 217 32 352 602
Impairment charges (note 7) ÏÏÏÏÏÏÏÏÏÏÏÏ Ì (2) Ì Ì (2)
DisposalsÏÏÏÏÏÏÏÏÏÏÏÏÏÏÏÏÏÏÏÏÏÏÏÏÏÏÏÏÏÏ Ì (53) (32) (2) (87)
Reclassifications ÏÏÏÏÏÏÏÏÏÏÏÏÏÏÏÏÏÏÏÏÏÏÏ 7 338 9 (354) Ì
Transfers from (to) Infineon, net ÏÏÏÏÏÏÏÏÏ 1 (11) 52 (3) 39
Foreign currency effects ÏÏÏÏÏÏÏÏÏÏÏÏÏÏÏÏÏ (24) (83) (6) (2) (115)
September 30, 2006 ÏÏÏÏÏÏÏÏÏÏÏÏÏÏÏÏÏÏÏÏÏÏ 805 3,795 821 82 5,503
Accumulated depreciation
September 30, 2005 ÏÏÏÏÏÏÏÏÏÏÏÏÏÏÏÏÏÏÏÏÏÏ (209) (2,003) (638) Ì (2,850)
DepreciationÏÏÏÏÏÏÏÏÏÏÏÏÏÏÏÏÏÏÏÏÏÏÏÏÏÏÏ (70) (540) (81) Ì (691)
DisposalsÏÏÏÏÏÏÏÏÏÏÏÏÏÏÏÏÏÏÏÏÏÏÏÏÏÏÏÏÏÏ Ì 53 30 Ì 83
Reclassifications ÏÏÏÏÏÏÏÏÏÏÏÏÏÏÏÏÏÏÏÏÏÏÏ Ì (1) 1 Ì Ì
Transfers to (from) Infineon, net ÏÏÏÏÏÏÏÏÏ Ì 11 (35) Ì (24)
Foreign currency effects ÏÏÏÏÏÏÏÏÏÏÏÏÏÏÏÏÏ 5 50 4 Ì 59
September 30, 2006 ÏÏÏÏÏÏÏÏÏÏÏÏÏÏÏÏÏÏÏÏÏÏÏÏ (274) (2,430) (719) Ì (3,423)
Book value
September 30, 2005 ÏÏÏÏÏÏÏÏÏÏÏÏÏÏÏÏÏÏÏÏÏÏ 611 1,386 128 91 2,216
Book value
September 30, 2006 ÏÏÏÏÏÏÏÏÏÏÏÏÏÏÏÏÏÏÏÏÏÏ 531 1,365 102 82 2,080
F-28
Global Reports LLC

QIMONDA AG AND SUBSIDIARIES
Notes to the Combined and Consolidated Financial Statements Ì (Continued)
(euro in millions, except where otherwise stated)
16. Long-term Investments
A summary of activity for long-term investments for the year ended September 30, 2005 and 2006,
respectively is as follows:
Investment in Investment inAssociated RelatedCompanies Companies Total
Balance at October 1, 2004 ÏÏÏÏÏÏÏÏÏÏÏÏÏÏÏÏÏÏÏÏÏÏÏÏÏÏÏÏÏ 381 16 397
Additions ÏÏÏÏÏÏÏÏÏÏÏÏÏÏÏÏÏÏÏÏÏÏÏÏÏÏÏÏÏÏÏÏÏÏÏÏÏÏÏÏÏÏ 83 Ì 83
DisposalsÏÏÏÏÏÏÏÏÏÏÏÏÏÏÏÏÏÏÏÏÏÏÏÏÏÏÏÏÏÏÏÏÏÏÏÏÏÏÏÏÏÏÏ Ì (15) (15)
Dividend payments ÏÏÏÏÏÏÏÏÏÏÏÏÏÏÏÏÏÏÏÏÏÏÏÏÏÏÏÏÏÏÏÏÏÏ (1) Ì (1)
Capitalized interest amortization ÏÏÏÏÏÏÏÏÏÏÏÏÏÏÏÏÏÏÏÏÏÏÏ (1) Ì (1)
Impairments ÏÏÏÏÏÏÏÏÏÏÏÏÏÏÏÏÏÏÏÏÏÏÏÏÏÏÏÏÏÏÏÏÏÏÏÏÏÏÏÏ (6) Ì (6)
Equity in earnings ÏÏÏÏÏÏÏÏÏÏÏÏÏÏÏÏÏÏÏÏÏÏÏÏÏÏÏÏÏÏÏÏÏÏÏ 45 Ì 45
Reclassification ÏÏÏÏÏÏÏÏÏÏÏÏÏÏÏÏÏÏÏÏÏÏÏÏÏÏÏÏÏÏÏÏÏÏÏÏÏ 2 Ì 2
Foreign currency effects ÏÏÏÏÏÏÏÏÏÏÏÏÏÏÏÏÏÏÏÏÏÏÏÏÏÏÏÏÏÏ 40 Ì 40
Balance at September 30, 2005 ÏÏÏÏÏÏÏÏÏÏÏÏÏÏÏÏÏÏÏÏÏÏÏÏÏÏ 543 1 544
Additions ÏÏÏÏÏÏÏÏÏÏÏÏÏÏÏÏÏÏÏÏÏÏÏÏÏÏÏÏÏÏÏÏÏÏÏÏÏÏÏÏÏÏ 3 Ì 3
Dividends receivedÏÏÏÏÏÏÏÏÏÏÏÏÏÏÏÏÏÏÏÏÏÏÏÏÏÏÏÏÏÏÏÏÏÏÏ (29) Ì (29)
Capitalized interest amortization ÏÏÏÏÏÏÏÏÏÏÏÏÏÏÏÏÏÏÏÏÏÏÏ (1) Ì (1)
Equity in earnings of associated companies ÏÏÏÏÏÏÏÏÏÏÏÏÏÏ 80 Ì 80
Gain on associated company share issuanceÏÏÏÏÏÏÏÏÏÏÏÏÏÏ 72 Ì 72
Reclassification ÏÏÏÏÏÏÏÏÏÏÏÏÏÏÏÏÏÏÏÏÏÏÏÏÏÏÏÏÏÏÏÏÏÏÏÏÏ 9 Ì 9
Foreign currency effects ÏÏÏÏÏÏÏÏÏÏÏÏÏÏÏÏÏÏÏÏÏÏÏÏÏÏÏÏÏÏ (42) Ì (42)
Balance at September 30, 2006 ÏÏÏÏÏÏÏÏÏÏÏÏÏÏÏÏÏÏÏÏÏÏÏÏÏÏ 635 1 636
Investments in Related Companies principally relate to investment activities aimed at strengthening the
Company's future intellectual property potential.
The following Associated Companies as of September 30, 2006 are accounted for using the equity
method of accounting due to the lack of unilateral control (see note 2):
Direct andIndirect
Name of the Associated Company Ownership
Hwa-Keng Investment Inc., Taipei, Taiwan (""Hwa-Keng'')ÏÏÏÏÏÏÏÏÏÏÏÏÏÏÏÏÏÏÏÏÏÏ 50.0%
Inotera Memories Inc., Taoyuan, Taiwan (""Inotera'') ÏÏÏÏÏÏÏÏÏÏÏÏÏÏÏÏÏÏÏÏÏÏÏÏÏÏÏ 36.0%
Advanced Mask Technology Center GmbH & Co. KG, Dresden, Germany(""AMTC'') ÏÏÏÏÏÏÏÏÏÏÏÏÏÏÏÏÏÏÏÏÏÏÏÏÏÏÏÏÏÏÏÏÏÏÏÏÏÏÏÏÏÏÏÏÏÏÏÏÏÏÏÏÏÏÏÏÏÏÏÏ 33.3%
Maskhouse Building Administration GmbH & Co. KG, Dresden, Germany (""BAC'') 33.3%
Ramtron International Corp., Colorado, USA (""Ramtron'')ÏÏÏÏÏÏÏÏÏÏÏÏÏÏÏÏÏÏÏÏÏÏ 18.0%
On November 13, 2002, the Company entered into agreements with Nanya relating to a strategic
cooperation in the development of DRAM products and the foundation of a joint venture called Inotera
Memories Inc., a 300mm manufacturing facility in Taiwan to employ production technology developed under
the Companies' joint development agreements with Nanya. Pursuant to the agreements, the Company and
Nanya developed advanced 90nm and 75nm technology. On September 29, 2005, the Company and Nanya
signed an agreement to expand their development cooperation with respect to the joint development of
F-29
Global Reports LLC

QIMONDA AG AND SUBSIDIARIES
Notes to the Combined and Consolidated Financial Statements Ì (Continued)
(euro in millions, except where otherwise stated)
advanced 58nm production technologies for 300mm wafers. The cooperation is expected to help each partner
expand its position in the DRAM market while sharing development costs two-thirds by the Company and
one-third by Nanya. The 2002 and 2005 cooperative agreements will remain in force until the product and
process technologies developed pursuant to the agreements have achieved required qualifications.
During the year ended September 30, 2004 Inotera completed the construction and started mass
production in its first manufacturing module. The final stage of the capacity was completed during the year
ended September 30, 2006. In May 2005 the groundbreaking for the second manufacturing module took place.
The capacity expansion for the second manufacturing module is expected to take place through the 2007
calendar year. The second module is financed by Inotera. The joint venture partners are obliged to each
purchase one-half of Inotera's production based, in part, on market prices.
The November 2002 agreement, as amended, entitles Nanya to receive from the Company or its then-
existing foundry partners 60% of that amount of its foundry capacity that is in excess of the foundry capacity
the Company receives as of December 2006.
Nanya may also receive 50% of the Company's foundry capacity for which it contracts after March 1,
2006 with new foundry partners. The Company's obligation to provide foundry capacity is capped at one third
of its total 90nm foundry capacity. In combination, the 2002 and 2005 agreements also entitle Nanya to
receive from the Company or its foundry partners one third of its 75nm foundry capacity and one third of its
58nm foundry capacity. As of September 30, 2006 the Company has not contracted for foundry capacity that
would require it to cede capacity to Nanya under these agreements. The Company does not expect that any
foundry capacity that it may be required to provide to Nanya will have a material adverse effect on its
business, financial condition or results of operations.
In connection with the Formation, Infineon and Qimonda entered into a trust agreement under which
Infineon holds the Inotera shares in trust for the Company until the shares can be transferred. This trust
agreement provides for Infineon to transfer the shares to the Company as and when the transfer restrictions
expire or the Company receives the exemption from the lock-up (see note 33).
If Infineon were to reduce its shareholding in the Company to a minority level before the earlier of the
fifth anniversary of its Formation from Infineon and the achievement of early mass production using 58nm
process technology at its manufacturing site in Dresden, the joint venture agreement with Nanya, as amended,
could require Qimonda to transfer these Inotera shares to Infineon. The Company agreed with Infineon that,
in this event, it would retransfer the Inotera shares back to the trust. The trust agreement provides for Infineon
to again hold the Inotera shares in trust for Qimonda until they could be retransferred back to the Company.
On March 17, 2006 Inotera successfully completed an initial public offering (""IPO'') on the Taiwanese
stock exchange of 200 million ordinary shares, representing 7.97% of its outstanding share capital before IPO,
for an issuance price of NT$33 per ordinary share. As a result, the Company's ownership interest was diluted
to 41.4% while its proportional share of Inotera's equity increased by approximately 430, which gain the
Company recognized as part of non-operating income during the year ended September 30, 2006.
On May 10, 2006, Inotera successfully completed a public offering on the Luxembourg Stock Exchange
of 40 million global depositary shares (representing 400,000,000 common shares) which are traded on the
Euro MTF market and represent 14.8% of its outstanding share capital before the offering, for an issuance
price of NT$33 per ordinary share. As a result, the Company's ownership interest was diluted to 36.0% while
its proportional share of Inotera's equity increased by 442, which gain the Company reflected as part of non-
operating income during the year ended September 30, 2006.
F-30
Global Reports LLC
QIMONDA AG AND SUBSIDIARIES
Notes to the Combined and Consolidated Financial Statements Ì (Continued)
(euro in millions, except where otherwise stated)
On May 16, 2002, Infineon entered into the AMTC and BAC joint venture with its partners Advanced
Micro Devices, Inc., USA (""AMD''), and Toppan Photomasks, Inc., USA (formerly DuPont Photomasks
Inc.) (""Toppan''), with the purpose of developing and manufacturing advanced photomasks.
The Company also maintains equity investments in BAC, a German company that owns the premises
used by AMTC and Toppan Photomasks Germany. The purpose of BAC is acquisition, administration, and
letting of real estate and corresponding facilities for the production of photo masks.
The limited partnership agreement relating to AMTC and BAC requires prior written consent from the
other partners before Infineon can assign its partnership interest. In the case of a transfer to an affiliate, such
as Qimonda, the consent may not be unreasonably withheld, but the interest must be transferred back to
Infineon should Infineon cease to be the majority shareholder. Infineon is currently in the process of
negotiating with AMD and Toppan with the goal of reaching an agreement that would allow the Company to
retain the interest even if Infineon ceases to be the majority shareholder.
Hwa-Keng, a Taiwanese company was formed for the purpose of facilitating the distribution of Inotera
shares to Inotera's employees. As a result of the Inotera IPO, Hwa-Keng's business purpose has been fulfilled
and therefore is in the process of being dissolved. The dissolution is not expected to have any financial impact
for the Company.
Ramtron develops specialty semiconductor memory products, and is based in Colorado Springs,
Colorado. Since the acquisition in 2001 the investment in Ramtron has been accounted for under the equity
method of accounting. The Company has two representatives on the board of directors of Ramtron and the
ability to exercise significant influence over operating and financial policies of Ramtron (see note 33).
The Company recognized impairment charges related to certain investments for which the carrying value
exceeded the fair value on an other-than-temporary basis, of 47, 46 and 40 for the years ended September 30,
2004, 2005 and 2006, respectively, which are reflected as other non-operating expense.
Goodwill of 40 and 42 is included in the amount of long-term investments at September 30, 2005 and
2006, respectively.
For the Associated Companies as of September 30, 2006, the aggregate summarized financial informa-
tion for the years ended September 30, 2004, 2005 and 2006, respectively, is as follows:
2004 2005 2006
Sales ÏÏÏÏÏÏÏÏÏÏÏÏÏÏÏÏÏÏÏÏÏÏÏÏÏÏÏÏÏÏÏÏÏÏÏÏÏÏÏÏÏÏÏÏÏÏÏÏÏÏÏÏÏÏÏÏÏ 54 475 909
Gross (loss) profit ÏÏÏÏÏÏÏÏÏÏÏÏÏÏÏÏÏÏÏÏÏÏÏÏÏÏÏÏÏÏÏÏÏÏÏÏÏÏÏÏÏÏÏÏÏ (6) 154 320
Net (loss) income ÏÏÏÏÏÏÏÏÏÏÏÏÏÏÏÏÏÏÏÏÏÏÏÏÏÏÏÏÏÏÏÏÏÏÏÏÏÏÏÏÏÏÏÏÏ (45) 90 224
2004 2005 2006
Current assets ÏÏÏÏÏÏÏÏÏÏÏÏÏÏÏÏÏÏÏÏÏÏÏÏÏÏÏÏÏÏÏÏÏÏÏÏÏÏÏÏÏÏÏÏÏÏÏÏÏ 227 525 1,123
Non-current assets ÏÏÏÏÏÏÏÏÏÏÏÏÏÏÏÏÏÏÏÏÏÏÏÏÏÏÏÏÏÏÏÏÏÏÏÏÏÏÏÏÏÏÏÏÏ 1,012 1,923 1,823
Current liabilities ÏÏÏÏÏÏÏÏÏÏÏÏÏÏÏÏÏÏÏÏÏÏÏÏÏÏÏÏÏÏÏÏÏÏÏÏÏÏÏÏÏÏÏÏÏÏ (205) (329) (518)
Non-current liabilitiesÏÏÏÏÏÏÏÏÏÏÏÏÏÏÏÏÏÏÏÏÏÏÏÏÏÏÏÏÏÏÏÏÏÏÏÏÏÏÏÏÏÏÏ (328) (898) (645)
Shareholders' equity ÏÏÏÏÏÏÏÏÏÏÏÏÏÏÏÏÏÏÏÏÏÏÏÏÏÏÏÏÏÏÏÏÏÏÏÏÏÏÏÏÏÏÏÏ 706 1,221 1,783
F-31
Global Reports LLC
QIMONDA AG AND SUBSIDIARIES
Notes to the Combined and Consolidated Financial Statements Ì (Continued)
(euro in millions, except where otherwise stated)
17. Other Assets
Other non-current assets at September 30, 2005 and 2006 consist of the following:
2005 2006
Intangible assets, netÏÏÏÏÏÏÏÏÏÏÏÏÏÏÏÏÏÏÏÏÏÏÏÏÏÏÏÏÏÏÏÏÏÏÏÏÏÏÏÏÏÏÏÏÏÏÏÏÏÏÏÏÏÏ 157 143
Employee deferred compensation asset (note 27)ÏÏÏÏÏÏÏÏÏÏÏÏÏÏÏÏÏÏÏÏÏÏÏÏÏÏÏÏÏÏ 10 5
Prepaid expenses ÏÏÏÏÏÏÏÏÏÏÏÏÏÏÏÏÏÏÏÏÏÏÏÏÏÏÏÏÏÏÏÏÏÏÏÏÏÏÏÏÏÏÏÏÏÏÏÏÏÏÏÏÏÏÏÏÏ 4 1
Marketable securities (note 11) ÏÏÏÏÏÏÏÏÏÏÏÏÏÏÏÏÏÏÏÏÏÏÏÏÏÏÏÏÏÏÏÏÏÏÏÏÏÏÏÏÏÏÏÏ 1 4
Grants receivableÏÏÏÏÏÏÏÏÏÏÏÏÏÏÏÏÏÏÏÏÏÏÏÏÏÏÏÏÏÏÏÏÏÏÏÏÏÏÏÏÏÏÏÏÏÏÏÏÏÏÏÏÏÏÏÏÏ Ì 13
License fees receivable ÏÏÏÏÏÏÏÏÏÏÏÏÏÏÏÏÏÏÏÏÏÏÏÏÏÏÏÏÏÏÏÏÏÏÏÏÏÏÏÏÏÏÏÏÏÏÏÏÏÏÏÏ Ì 11
Other ÏÏÏÏÏÏÏÏÏÏÏÏÏÏÏÏÏÏÏÏÏÏÏÏÏÏÏÏÏÏÏÏÏÏÏÏÏÏÏÏÏÏÏÏÏÏÏÏÏÏÏÏÏÏÏÏÏÏÏÏÏÏÏÏÏÏ 2 1
Total ÏÏÏÏÏÏÏÏÏÏÏÏÏÏÏÏÏÏÏÏÏÏÏÏÏÏÏÏÏÏÏÏÏÏÏÏÏÏÏÏÏÏÏÏÏÏÏÏÏÏÏÏÏÏÏÏÏÏÏÏÏÏÏÏÏÏÏ 174 178
A summary of activity for intangible assets for the years ended September 30, 2005 and 2006 is as
follows:Other
Goodwill Intangibles Total
Cost
September 30, 2004 ÏÏÏÏÏÏÏÏÏÏÏÏÏÏÏÏÏÏÏÏÏÏÏÏÏÏÏÏÏÏÏÏÏÏÏÏÏÏ 93 12 105
Additions ÏÏÏÏÏÏÏÏÏÏÏÏÏÏÏÏÏÏÏÏÏÏÏÏÏÏÏÏÏÏÏÏÏÏÏÏÏÏÏÏÏÏÏÏÏ Ì 41 41
DisposalsÏÏÏÏÏÏÏÏÏÏÏÏÏÏÏÏÏÏÏÏÏÏÏÏÏÏÏÏÏÏÏÏÏÏÏÏÏÏÏÏÏÏÏÏÏÏ Ì (34) (34)
Acquisitions (note 3) ÏÏÏÏÏÏÏÏÏÏÏÏÏÏÏÏÏÏÏÏÏÏÏÏÏÏÏÏÏÏÏÏÏÏÏ 7 58 65
Foreign currency effects ÏÏÏÏÏÏÏÏÏÏÏÏÏÏÏÏÏÏÏÏÏÏÏÏÏÏÏÏÏÏÏÏÏ 1 Ì 1
September 30, 2005 ÏÏÏÏÏÏÏÏÏÏÏÏÏÏÏÏÏÏÏÏÏÏÏÏÏÏÏÏÏÏÏÏÏÏÏÏÏÏ 101 77 178
Additions ÏÏÏÏÏÏÏÏÏÏÏÏÏÏÏÏÏÏÏÏÏÏÏÏÏÏÏÏÏÏÏÏÏÏÏÏÏÏÏÏÏÏÏÏÏ Ì 45 45
Impairment charges (note 7) ÏÏÏÏÏÏÏÏÏÏÏÏÏÏÏÏÏÏÏÏÏÏÏÏÏÏÏÏ Ì (7) (7)
Disposals and reductions ÏÏÏÏÏÏÏÏÏÏÏÏÏÏÏÏÏÏÏÏÏÏÏÏÏÏÏÏÏÏÏÏ (11) (26) (37)
Foreign currency effects ÏÏÏÏÏÏÏÏÏÏÏÏÏÏÏÏÏÏÏÏÏÏÏÏÏÏÏÏÏÏÏÏÏ (6) Ì (6)
September 30, 2006 ÏÏÏÏÏÏÏÏÏÏÏÏÏÏÏÏÏÏÏÏÏÏÏÏÏÏÏÏÏÏÏÏÏÏÏÏÏÏ 84 89 173
Accumulated amortization
September 30, 2004 ÏÏÏÏÏÏÏÏÏÏÏÏÏÏÏÏÏÏÏÏÏÏÏÏÏÏÏÏÏÏÏÏÏÏÏÏÏÏ (13) (6) (19)
Amortization ÏÏÏÏÏÏÏÏÏÏÏÏÏÏÏÏÏÏÏÏÏÏÏÏÏÏÏÏÏÏÏÏÏÏÏÏÏÏÏÏÏÏ Ì (5) (5)
DisposalsÏÏÏÏÏÏÏÏÏÏÏÏÏÏÏÏÏÏÏÏÏÏÏÏÏÏÏÏÏÏÏÏÏÏÏÏÏÏÏÏÏÏÏÏÏÏ Ì 3 3
September 30, 2005 ÏÏÏÏÏÏÏÏÏÏÏÏÏÏÏÏÏÏÏÏÏÏÏÏÏÏÏÏÏÏÏÏÏÏÏÏÏÏ (13) (8) (21)
Amortization ÏÏÏÏÏÏÏÏÏÏÏÏÏÏÏÏÏÏÏÏÏÏÏÏÏÏÏÏÏÏÏÏÏÏÏÏÏÏÏÏÏÏ Ì (12) (12)
Disposals and reductions ÏÏÏÏÏÏÏÏÏÏÏÏÏÏÏÏÏÏÏÏÏÏÏÏÏÏÏÏÏÏÏÏ Ì 5 5
Foreign currency effects ÏÏÏÏÏÏÏÏÏÏÏÏÏÏÏÏÏÏÏÏÏÏÏÏÏÏÏÏÏÏÏÏÏ 1 (3) (2)
September 30, 2006 ÏÏÏÏÏÏÏÏÏÏÏÏÏÏÏÏÏÏÏÏÏÏÏÏÏÏÏÏÏÏÏÏÏÏÏÏÏÏ (12) (18) (30)
Intangible assets, net as of September 30, 2005 ÏÏÏÏÏÏÏÏÏÏÏÏÏÏÏÏÏ 88 69 157
Intangible assets, net as of September 30, 2006 ÏÏÏÏÏÏÏÏÏÏÏÏÏÏÏÏÏ 72 71 143
F-32
Global Reports LLC

QIMONDA AG AND SUBSIDIARIES
Notes to the Combined and Consolidated Financial Statements Ì (Continued)
(euro in millions, except where otherwise stated)
The estimated aggregate amortization expense relating to other intangible assets for each of the five
succeeding financial years is as follows: 2007 415; 2008 412; 2009 49; 2010 49; 2011 49.
In connection with the acquisition of Saifun's remaining 30% share in Infineon Technologies Flash during
January 2005, the Company was granted a license for the use of Saifun NROM» technologies (see note 3).
During the three months ended March 31, 2005 the Company recorded the license of 458 and a correspondingliability in the amount of 458, representing the estimated fair value of the license and minimum future license
payments, respectively. The Company retained the option to terminate the entire license, or parts thereof, at
any time without penalty. During the three months ended June 30, 2005, the Company exercised its
termination option and cancelled the portion of the license encompassing NROM» Code Flash products. As a
result of the partial termination, the license asset and related liability were reduced to 428 as of September 30,
2005. Effective September 30, 2006, the Company and Saifun amended its license agreement (see note 3). As
a result of the amendment, the Company reduced payables, goodwill and other intangible assets, and
recognized an impairment charge of 49 (see note 7) related to the license (47) and fixed assets (42) that were
not considered to be recoverable as of September 30, 2006.
On March 18, 2005, the Company and Rambus reached an agreement settling all claims between them
and licensing the Rambus patent portfolio for use in current and future Company products. Rambus granted to
the Company a worldwide license to existing and future Rambus patents and patent applications for use in the
Company's memory products. In exchange for this worldwide license, the Company agreed to pay $50 million
in quarterly installments of $6 million between November 15, 2005 and November 15, 2007. As of March 31,
2005 the Company recorded a license and corresponding liability in the amount of 437, representing the
estimated present value of the minimum future license payments. After November 15, 2007, and only if
Rambus enters into additional specified licensing agreements with certain other DRAM manufacturers, the
Company would make additional quarterly payments which may accumulate up to a maximum of an
additional $100 million. Because Rambus' ability to conclude the agreements is not within the Company's
control, the Company is not able to estimate whether additional payment obligations may arise. The
agreement also provides the Company an option for acquiring certain other licenses. All licenses provide for
the Company to be treated as a ""most-favored customer'' of Rambus. The Company simultaneously granted
to Rambus a fully-paid perpetual license for memory interfaces. In addition to the licenses, the two companies
agreed to the immediate dismissal of all pending litigation and released each other from all existing legal
claims. The license of 437 is being amortized over the expected useful life of the related technologies of ten
years.
In June 2006, the Company and Infineon reached an agreement with MOSAID Technologies Inc.
(""MOSAID'') settling all claims between them and licensing the MOSAID patent portfolio for use in current
and future Company products. MOSAID granted to Infineon a six year license to use any MOSAID patents
in the manufacturing and sale of semiconductor products, as well as a ''lives of the patents'' license to certain
MOSAID patent families. In exchange for these licenses, the Company agreed to make license payments
commencing on July 1, 2006 over a six-year term. The license of 432 is being amortized over the expected
useful life of the related technologies of six years.
On August 1, 2006, Infineon and the Company entered into settlement agreements with Tessera Inc. in
respect of all of Tessera's patent infringement and antitrust claim and all counterclaims and other claims
Infineon and the Company raised against Tessera. As part of the settlement, Infineon and the Company
entered into license agreements with Tessera, effective July 1, 2006, that provide the Infineon and the
Company world-wide, nonexclusive, non-transferable and non-sublicensable license to use a portfolio of
Tessera patents relating to packaging for integrated circuits in Infineon's and the Company's production. The
license agreements have a six-year term and can be extended. Under the license agreement, the Company
agreed to pay Tessera an initial upfront fee and additional royalty payments over a six year period based on the
F-33
Global Reports LLC

QIMONDA AG AND SUBSIDIARIES
Notes to the Combined and Consolidated Financial Statements Ì (Continued)
(euro in millions, except where otherwise stated)
volume of components it sells that are subject to the license. The Company recognized the litigation
settlement portion of 431 as other operating expense (see note 7) during the year ended September 30, 2006.
The remaining license portion is amortized over the term of the agreement and the royalty payments are
recognized as the related sales are made.
18. Trade Accounts Payable
Trade accounts payable at September 30, 2005 and 2006 consist of the following:
2005 2006
Third party Ì trade ÏÏÏÏÏÏÏÏÏÏÏÏÏÏÏÏÏÏÏÏÏÏÏÏÏÏÏÏÏÏÏÏÏÏÏÏÏÏÏÏÏÏÏÏÏÏÏÏÏÏÏÏÏÏ 422 565
Infineon group Ì trade (note 27)ÏÏÏÏÏÏÏÏÏÏÏÏÏÏÏÏÏÏÏÏÏÏÏÏÏÏÏÏÏÏÏÏÏÏÏÏÏÏÏÏÏÏÏ 31 71
Associated and Related Companies Ì trade (note 27) ÏÏÏÏÏÏÏÏÏÏÏÏÏÏÏÏÏÏÏÏÏÏÏÏÏ 64 76
Siemens group Ì trade (note 27)ÏÏÏÏÏÏÏÏÏÏÏÏÏÏÏÏÏÏÏÏÏÏÏÏÏÏÏÏÏÏÏÏÏÏÏÏÏÏÏÏÏÏÏ 2 Ì
Total ÏÏÏÏÏÏÏÏÏÏÏÏÏÏÏÏÏÏÏÏÏÏÏÏÏÏÏÏÏÏÏÏÏÏÏÏÏÏÏÏÏÏÏÏÏÏÏÏÏÏÏÏÏÏÏÏÏÏÏÏÏÏÏÏÏÏÏ 519 712
19. Accrued Liabilities
Accrued liabilities at September 30, 2005 and 2006 consist of the following:
2005 2006
Personnel costs ÏÏÏÏÏÏÏÏÏÏÏÏÏÏÏÏÏÏÏÏÏÏÏÏÏÏÏÏÏÏÏÏÏÏÏÏÏÏÏÏÏÏÏÏÏÏÏÏÏÏÏÏÏÏÏÏÏÏ 69 95
Settlement for antitrust related matters (note 31) ÏÏÏÏÏÏÏÏÏÏÏÏÏÏÏÏÏÏÏÏÏÏÏÏÏÏÏÏÏ 31 53
Warranties and licenses ÏÏÏÏÏÏÏÏÏÏÏÏÏÏÏÏÏÏÏÏÏÏÏÏÏÏÏÏÏÏÏÏÏÏÏÏÏÏÏÏÏÏÏÏÏÏÏÏÏÏÏ 3 2
Other ÏÏÏÏÏÏÏÏÏÏÏÏÏÏÏÏÏÏÏÏÏÏÏÏÏÏÏÏÏÏÏÏÏÏÏÏÏÏÏÏÏÏÏÏÏÏÏÏÏÏÏÏÏÏÏÏÏÏÏÏÏÏÏÏÏÏ 19 10
Total ÏÏÏÏÏÏÏÏÏÏÏÏÏÏÏÏÏÏÏÏÏÏÏÏÏÏÏÏÏÏÏÏÏÏÏÏÏÏÏÏÏÏÏÏÏÏÏÏÏÏÏÏÏÏÏÏÏÏÏÏÏÏÏÏÏÏÏ 122 160
On September 15, 2004 the Company entered into a plea agreement with the United States Department
of Justice in connection with its antitrust investigation (see note 31) and agreed to pay a fine aggregating
$160 million over a five-year period. The amount due within one year as of the balance sheet date is included
in accrued and other current liabilities (see note 20), and the remaining long-term portion is reflected as other
non-current liabilities (see note 22). As a result of this agreement and other anti-trust related investigations
and customer settlements (see note 31), the Company charged other operating expenses with an aggregate of
4194, 420 and 423 during the years ended September 30, 2004, 2005 and 2006, respectively (see note 7).
F-34
Global Reports LLC
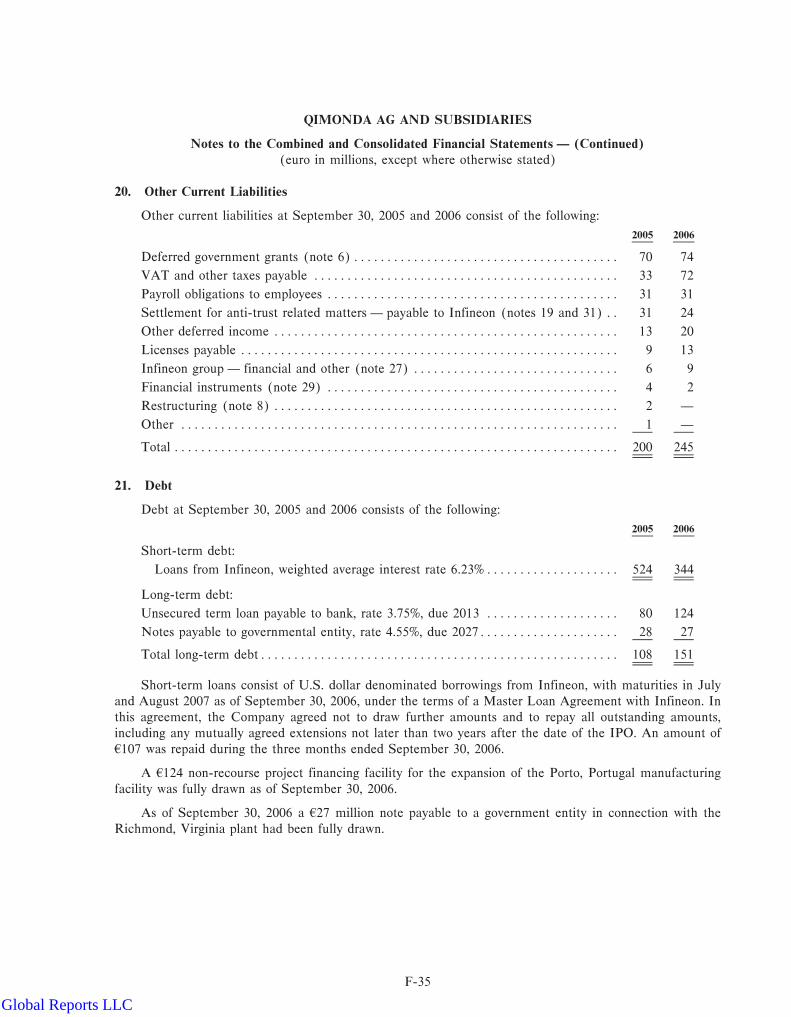
QIMONDA AG AND SUBSIDIARIES
Notes to the Combined and Consolidated Financial Statements Ì (Continued)
(euro in millions, except where otherwise stated)
20. Other Current Liabilities
Other current liabilities at September 30, 2005 and 2006 consist of the following:
2005 2006
Deferred government grants (note 6)ÏÏÏÏÏÏÏÏÏÏÏÏÏÏÏÏÏÏÏÏÏÏÏÏÏÏÏÏÏÏÏÏÏÏÏÏÏÏÏÏ 70 74
VAT and other taxes payable ÏÏÏÏÏÏÏÏÏÏÏÏÏÏÏÏÏÏÏÏÏÏÏÏÏÏÏÏÏÏÏÏÏÏÏÏÏÏÏÏÏÏÏÏÏÏ 33 72
Payroll obligations to employees ÏÏÏÏÏÏÏÏÏÏÏÏÏÏÏÏÏÏÏÏÏÏÏÏÏÏÏÏÏÏÏÏÏÏÏÏÏÏÏÏÏÏÏÏ 31 31
Settlement for anti-trust related matters Ì payable to Infineon (notes 19 and 31) ÏÏ 31 24
Other deferred income ÏÏÏÏÏÏÏÏÏÏÏÏÏÏÏÏÏÏÏÏÏÏÏÏÏÏÏÏÏÏÏÏÏÏÏÏÏÏÏÏÏÏÏÏÏÏÏÏÏÏÏÏ 13 20
Licenses payable ÏÏÏÏÏÏÏÏÏÏÏÏÏÏÏÏÏÏÏÏÏÏÏÏÏÏÏÏÏÏÏÏÏÏÏÏÏÏÏÏÏÏÏÏÏÏÏÏÏÏÏÏÏÏÏÏÏ 9 13
Infineon group Ì financial and other (note 27) ÏÏÏÏÏÏÏÏÏÏÏÏÏÏÏÏÏÏÏÏÏÏÏÏÏÏÏÏÏÏÏ 6 9
Financial instruments (note 29) ÏÏÏÏÏÏÏÏÏÏÏÏÏÏÏÏÏÏÏÏÏÏÏÏÏÏÏÏÏÏÏÏÏÏÏÏÏÏÏÏÏÏÏÏ 4 2
Restructuring (note 8) ÏÏÏÏÏÏÏÏÏÏÏÏÏÏÏÏÏÏÏÏÏÏÏÏÏÏÏÏÏÏÏÏÏÏÏÏÏÏÏÏÏÏÏÏÏÏÏÏÏÏÏÏ 2 Ì
Other ÏÏÏÏÏÏÏÏÏÏÏÏÏÏÏÏÏÏÏÏÏÏÏÏÏÏÏÏÏÏÏÏÏÏÏÏÏÏÏÏÏÏÏÏÏÏÏÏÏÏÏÏÏÏÏÏÏÏÏÏÏÏÏÏÏÏ 1 Ì
Total ÏÏÏÏÏÏÏÏÏÏÏÏÏÏÏÏÏÏÏÏÏÏÏÏÏÏÏÏÏÏÏÏÏÏÏÏÏÏÏÏÏÏÏÏÏÏÏÏÏÏÏÏÏÏÏÏÏÏÏÏÏÏÏÏÏÏÏ 200 245
21. Debt
Debt at September 30, 2005 and 2006 consists of the following:
2005 2006
Short-term debt:
Loans from Infineon, weighted average interest rate 6.23%ÏÏÏÏÏÏÏÏÏÏÏÏÏÏÏÏÏÏÏÏ 524 344
Long-term debt:
Unsecured term loan payable to bank, rate 3.75%, due 2013 ÏÏÏÏÏÏÏÏÏÏÏÏÏÏÏÏÏÏÏÏ 80 124
Notes payable to governmental entity, rate 4.55%, due 2027ÏÏÏÏÏÏÏÏÏÏÏÏÏÏÏÏÏÏÏÏÏ 28 27
Total long-term debtÏÏÏÏÏÏÏÏÏÏÏÏÏÏÏÏÏÏÏÏÏÏÏÏÏÏÏÏÏÏÏÏÏÏÏÏÏÏÏÏÏÏÏÏÏÏÏÏÏÏÏÏÏÏ 108 151
Short-term loans consist of U.S. dollar denominated borrowings from Infineon, with maturities in July
and August 2007 as of September 30, 2006, under the terms of a Master Loan Agreement with Infineon. In
this agreement, the Company agreed not to draw further amounts and to repay all outstanding amounts,
including any mutually agreed extensions not later than two years after the date of the IPO. An amount of
4107 was repaid during the three months ended September 30, 2006.
A 4124 non-recourse project financing facility for the expansion of the Porto, Portugal manufacturing
facility was fully drawn as of September 30, 2006.
As of September 30, 2006 a 427 million note payable to a government entity in connection with the
Richmond, Virginia plant had been fully drawn.
F-35
Global Reports LLC

QIMONDA AG AND SUBSIDIARIES
Notes to the Combined and Consolidated Financial Statements Ì (Continued)
(euro in millions, except where otherwise stated)
Aggregate amounts of debt maturing subsequent to September 30, 2006 are as follows:
Year Ending September 30, Amount
2007 ÏÏÏÏÏÏÏÏÏÏÏÏÏÏÏÏÏÏÏÏÏÏÏÏÏÏÏÏÏÏÏÏÏÏÏÏÏÏÏÏÏÏÏÏÏÏÏÏÏÏÏÏÏÏÏÏÏÏÏÏÏÏÏÏÏÏÏÏÏÏ 344
2008 ÏÏÏÏÏÏÏÏÏÏÏÏÏÏÏÏÏÏÏÏÏÏÏÏÏÏÏÏÏÏÏÏÏÏÏÏÏÏÏÏÏÏÏÏÏÏÏÏÏÏÏÏÏÏÏÏÏÏÏÏÏÏÏÏÏÏÏÏÏÏ 21
2009 ÏÏÏÏÏÏÏÏÏÏÏÏÏÏÏÏÏÏÏÏÏÏÏÏÏÏÏÏÏÏÏÏÏÏÏÏÏÏÏÏÏÏÏÏÏÏÏÏÏÏÏÏÏÏÏÏÏÏÏÏÏÏÏÏÏÏÏÏÏÏ 21
2010 ÏÏÏÏÏÏÏÏÏÏÏÏÏÏÏÏÏÏÏÏÏÏÏÏÏÏÏÏÏÏÏÏÏÏÏÏÏÏÏÏÏÏÏÏÏÏÏÏÏÏÏÏÏÏÏÏÏÏÏÏÏÏÏÏÏÏÏÏÏÏ 21
2011 ÏÏÏÏÏÏÏÏÏÏÏÏÏÏÏÏÏÏÏÏÏÏÏÏÏÏÏÏÏÏÏÏÏÏÏÏÏÏÏÏÏÏÏÏÏÏÏÏÏÏÏÏÏÏÏÏÏÏÏÏÏÏÏÏÏÏÏÏÏÏ 21
ThereafterÏÏÏÏÏÏÏÏÏÏÏÏÏÏÏÏÏÏÏÏÏÏÏÏÏÏÏÏÏÏÏÏÏÏÏÏÏÏÏÏÏÏÏÏÏÏÏÏÏÏÏÏÏÏÏÏÏÏÏÏÏÏÏÏÏÏ 67
Total debtÏÏÏÏÏÏÏÏÏÏÏÏÏÏÏÏÏÏÏÏÏÏÏÏÏÏÏÏÏÏÏÏÏÏÏÏÏÏÏÏÏÏÏÏÏÏÏÏÏÏÏÏÏÏÏÏÏÏÏÏÏÏÏÏÏÏ 495
In August 2006, the Company entered into a multicurrency revolving loan facility in an aggregate
principal amount of 4250 million. The facility matures three years from the date of the Company's initial
public offering, and may be extended for one additional year at the option of the lenders at the end of the
facility's first year of operation. The Company entered into this facility primarily as a source of backup
liquidity. Loans made under the facility, which may be used for working capital requirements and/or general
corporate purposes, may have various maturities, ranging from one to twelve months, or longer as agreed by
the parties. The facility contains several covenants, agreements and financial ratios customary for such
transactions including negative pledge, limitation on indebtedness, restriction on asset dispositions; limitations
on mergers and reorganizations, required maintenance of minimum liquidity levels and financial ratios; and
limitation on dividend payments. The Company was in compliance with these covenants as of September 30,
2006.
Funds drawn under the facility shall not be used to repay indebtedness to Infineon and the agreement
contains restrictions on the Company's ability to repay indebtedness to Infineon other than from capital
market issuances, unless the Company's liquidity exceeds certain levels. The facility is subject to a provision
permitting lenders to terminate their advances if a person or group of persons, acting in concert, other than
Infineon, gains either 35 percent of the Company's voting power or other indices of control or share ownership
exceeding 35 percent of the Company's issued share capital. As of September 30, 2006, no amounts were
outstanding under this facility.
The Company can also draw, for short term purposes, on the working capital lines it maintains in several
locations in an aggregate amount of 4177 million; there were no amounts outstanding under these facilities as
of September 30, 2006.
F-36
Global Reports LLC

QIMONDA AG AND SUBSIDIARIES
Notes to the Combined and Consolidated Financial Statements Ì (Continued)
(euro in millions, except where otherwise stated)
22. Other Liabilities
Other non-current liabilities at September 30, 2005 and 2006 consist of the following:
2005 2006
Deferred government grants (note 6)ÏÏÏÏÏÏÏÏÏÏÏÏÏÏÏÏÏÏÏÏÏÏÏÏÏÏÏÏÏÏÏÏÏÏÏÏÏÏÏÏ 138 105
Minority interest ÏÏÏÏÏÏÏÏÏÏÏÏÏÏÏÏÏÏÏÏÏÏÏÏÏÏÏÏÏÏÏÏÏÏÏÏÏÏÏÏÏÏÏÏÏÏÏÏÏÏÏÏÏÏÏÏÏ 81 79
Settlement for antitrust related matters Ì payable to Infineon (notes 19 and 31)ÏÏÏ 88 64
Pension liabilities (note 28)ÏÏÏÏÏÏÏÏÏÏÏÏÏÏÏÏÏÏÏÏÏÏÏÏÏÏÏÏÏÏÏÏÏÏÏÏÏÏÏÏÏÏÏÏÏÏÏÏ 29 26
Licenses payable ÏÏÏÏÏÏÏÏÏÏÏÏÏÏÏÏÏÏÏÏÏÏÏÏÏÏÏÏÏÏÏÏÏÏÏÏÏÏÏÏÏÏÏÏÏÏÏÏÏÏÏÏÏÏÏÏÏ 48 37
Deferred income ÏÏÏÏÏÏÏÏÏÏÏÏÏÏÏÏÏÏÏÏÏÏÏÏÏÏÏÏÏÏÏÏÏÏÏÏÏÏÏÏÏÏÏÏÏÏÏÏÏÏÏÏÏÏÏÏÏ 22 9
Other ÏÏÏÏÏÏÏÏÏÏÏÏÏÏÏÏÏÏÏÏÏÏÏÏÏÏÏÏÏÏÏÏÏÏÏÏÏÏÏÏÏÏÏÏÏÏÏÏÏÏÏÏÏÏÏÏÏÏÏÏÏÏÏÏÏÏ 6 4
Total ÏÏÏÏÏÏÏÏÏÏÏÏÏÏÏÏÏÏÏÏÏÏÏÏÏÏÏÏÏÏÏÏÏÏÏÏÏÏÏÏÏÏÏÏÏÏÏÏÏÏÏÏÏÏÏÏÏÏÏÏÏÏÏÏÏÏÏ 412 324
On July 28, 2003, the Company entered into a joint venture agreement with China-Singapore Suzhou
Industrial Park Venture Company (""CSVC'') for the construction of a back-end manufacturing facility in the
People's Republic of China. The capital invested by CSVC earns an annual return and has a liquidation
preference. All accumulated earnings and dividend rights accrue to the benefit of the Company. Accordingly,
the Company has consolidated 100% of the results of operations of the joint venture from inception, although
the capital invested and annual return of the minority investor is reflected as minority interest.
23. Ordinary Share Capital
On April 25, 2006 the initial 50,000 registered shares of euro 1.00 notional value were combined to 25,000
registered shares of 42.00 notional value.
Pursuant to the contribution agreement, in exchange for the Infineon contributions as part of the
Formation, the Company issued 132,288,975 ordinary registered shares to Infineon, which increased the
Company's share capital from 40.05 to 4264.6 on April 25, 2006 (Capital Increase I), and 167,686,025
ordinary registered shares to Infineon Technologies Holding B.V., which increased the Company's share
capital from 4264.6 to 4600 (Capital Increase II).
On July 27, 2006, the Company's shareholders resolved to increase the share capital to 4684 against cashcontributions through the issuance of 42,000,000 ordinary registered shares, that exclude subscription rights of
existing shareholders, and became effective on August 8, 2006 (Capital Increase III).
As of September 30, 2006 the Company had a total of 342,000,000 no-par value ordinary registered
shares (Namensaktien) shares of 42.00 notional value per share outstanding.
Authorized and Conditional Share Capital
Under the German Stock Corporation Act (Aktiengesetz), a stock corporation's shareholder can
authorize the management board to issue shares in a specified aggregate nominal amount up to 50% of the
issued share capital at the time the resolution is passed. The shareholders' authorization may extend for a
period of no more than five years.
On July 14, 2006, the Company's shareholders resolved to amend the Company's Articles of Association
to authorize the Management Board to increase the share capital with the Supervisory Board's consent. The
Management Board may use this authorization until July 13, 2011 to increase the share capital by up to 430through the issuance, in one or more tranches, of new ordinary registered shares with no par value, that
F-37
Global Reports LLC

QIMONDA AG AND SUBSIDIARIES
Notes to the Combined and Consolidated Financial Statements Ì (Continued)
(euro in millions, except where otherwise stated)
exclude subscription rights of existing shareholders, in exchange for cash contributions for the purpose of
issuing shares to the Company's and the subsidiaries' employees.
In addition on July 27, 2006, the Company's shareholders resolved to amend the Company's Articles of
Association to authorize the Management Board to increase the share capital with the Supervisory Board's
consent against contributions in cash or in kind. The Management Board may use these authorizations until
July 26, 2011 to issue new shares in one or more tranches for any legal purpose in an aggregate amount of up
to 4239.4 million in which case existing shareholders have pre-emptive rights, which may be excluded in
specified circumstances.
During the Company's extraordinary shareholders' meeting on July 14, 2006, its shareholders passed the
following resolutions with regard to conditional capital:
‚ First, the Company's share capital is conditionally increased by up to 412 million through the
issuance of up to 6 million ordinary registered shares with no par value in connection with the employee
stock option and share purchase plans described in note 24.
‚ Second, the Company's share capital is conditionally increased by up to 4240.1 through the
issuance of up to 120.05 ordinary registered shares with no par value. This conditional capital may only be
used in connection with an issuance of a convertible bond, which the shareholders authorized by
resolution of July 14, 2006.
Dividends
Under the German Stock Corporation Act (Aktiengesetz), the amount of dividends available for
distribution to shareholders is based on the level of earnings (Bilanzgewinn) of the parent company, Qimonda
AG, as determined in accordance with the HGB. All dividends must be approved by shareholders. No
earnings are available for distribution as a dividend for the 2006 financial year, since Qimonda AG on a stand-
alone basis, as the parent company, incurred a cumulative loss (Bilanzverlust) as of September 30, 2006.
24. Stock-based Compensation
Infineon Stock Option Plans
In periods prior to the Formation, certain of the Company's employees were granted Infineon stock
options as Infineon employees pursuant to Infineon's stock option plans. The aggregate number of such
options outstanding were 11.6 million and 11.4 million (of which 5.6 million and 6.6 million were exercisable)
as of September 30, 2005 and 2006, respectively. If such options are exercised, the employees are to be given
Infineon shares in exchange for payment of the exercise price to Infineon. Accordingly, such options do not
represent potential dilutive instruments to the Company.
Qimonda Employee Stock Option Plan
During an extraordinary shareholders' meeting held on July 14, 2006, the shareholders authorized the
Supervisory Board to grant to the members of the Management Board, and the Management Board to grant to
certain key executives in the group, through September 30, 2009, a total of 6,000,000 non-transferable option
rights to receive ordinary shares issued by the Company. The shareholders' meeting resolved on the following
key features of such stock option plan:
The option rights may be allocated as follows: the first group, consisting of the members of the
Management Board, may receive a total of up to 1,200,000 option rights. The second group, consisting of the
members of the executive boards of the subsidiaries in Germany and abroad, may receive a total of up to
1,000,000 option rights. The third group, consisting of further key executives who will be nominated based on
F-38
Global Reports LLC

QIMONDA AG AND SUBSIDIARIES
Notes to the Combined and Consolidated Financial Statements Ì (Continued)
(euro in millions, except where otherwise stated)
their performance to receive up to a specific number of options based on their job classification, may receive a
total of up to 3,800,000 option rights. The Company expects that, in total, about 6% of the work force will be
eligible to participate in the plan. During any fiscal year, not more than 40% of the total option rights allocable
to the respective group may be issued to the members of such group. No option rights may be issued to
executives of any of the group companies that are listed on a stock exchange and their subsidiaries, if and for
as long as such companies maintain their own stock option plans.
Option rights may be granted within 45 days upon the publication of the results for the preceding fiscal
year or within 45 days upon publication of the results for the first or second quarter of a fiscal year, but, in each
case, no later than two weeks prior to the end of the respective quarter.
The option rights may be exercised within six years after their grant, but not before the expiration of a
vesting period that will be at least three years. The exercise of each option right is subject to the condition that
the exchange price of the ADSs on the New York Stock Exchange will, during the exercise period of the
respective option right, exceed the index ""Philadelphia Semiconductor Sector (SOX)'' on at least three
consecutive days. In order to determine whether such excess has taken place, the SOX and the strike price of
the respective option right will be set at 100 at the day on which the option right is granted.
For as long as the Company's shares are not listed on any organized market with the European Union or
the European Economic Area, the strike price will be the average of the opening prices of the ADSs on the
New York Stock Exchange on the five trading days prior to the day of the grant (or a fraction thereof, if an
ADS does not represent exactly one of the ordinary shares). Otherwise, the strike price will be the average of
the opening prices of the shares on the respective organized market on the five trading days prior to the day of
the grant.
The holders of option rights will benefit from certain anti-dilution protection provisions, particularly in
the case of certain capital measures performed by the Company.
Upon exercise of an option right, the holder will generally receive new ordinary shares to be issued by the
company. The Management Board (with approval by the Supervisory Board) will, however, instead be
allowed to deliver existing shares or pay a cash compensation to be calculated on the basis of the difference
between the strike price and the exchange price of the ADSs or shares on the exercise date.
The Management Board and, to the extent options to be granted to the Management Board are
concerned, the Supervisory Board are entitled to determine further details of the option plan, including, in
particular, the inclusion of the new shares granted upon exercise of the option rights into the ADS program.
As of September 30, 2006 no options have been granted under this plan. No options were granted as part
of the Company's IPO. The Supervisory Board has allocated 400,000 options for grant to the Management
Board in the 2007 financial year.
Fair value disclosures of Infineon Stock Option Plans
Effective October 1, 2005, the Company adopted SFAS No. 123 (revised 2004) under the modified
prospective application method, and accounts for stock option grants to its employees under the Infineon stock
option plans according to the fair value method of SFAS No. 123 (revised 2004) from that date.
The fair value of each option grant is estimated on the grant date using the Black-Scholes option-pricing
model. Prior to the adoption of SFAS No. 123 (revised 2004), the Company relied on historical volatility
measures when estimating the fair value of stock options granted to employees. Following the implementation
of SFAS No. 123 (revised 2004), Infineon uses a combination of implied volatilities from traded options on
Infineon's stock and historical volatility when estimating the fair value of stock options granted to employees,
as it believes that this methodology better reflects the expected future volatility of its stock. The expected life
F-39
Global Reports LLC
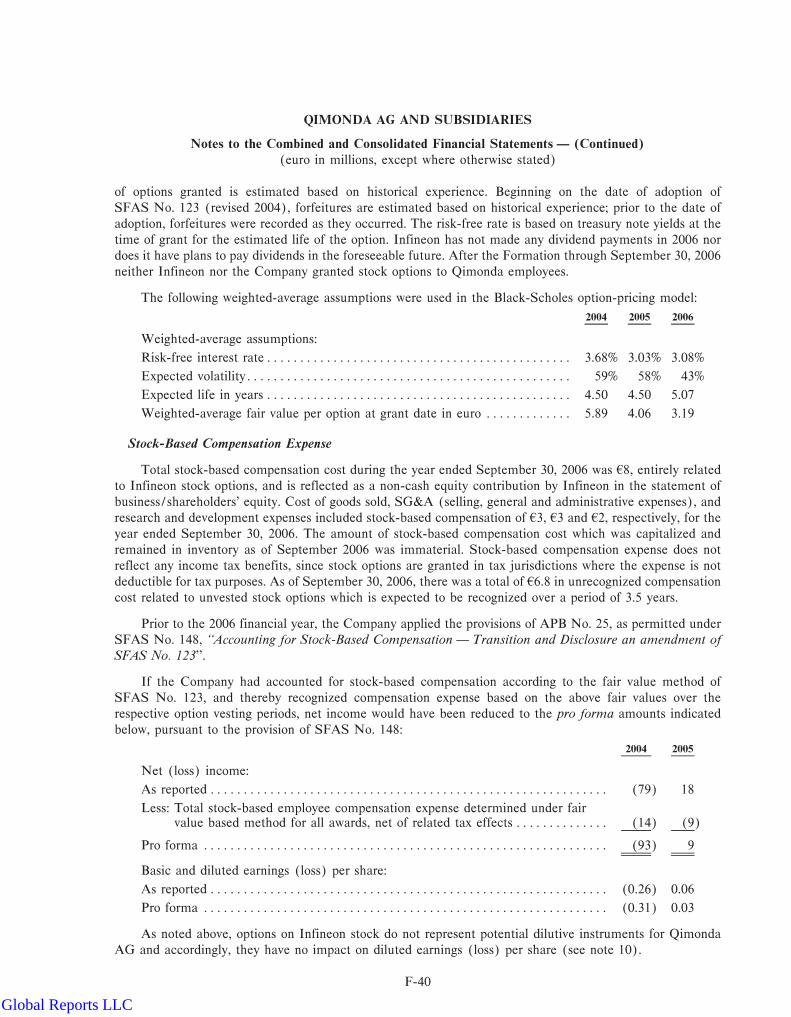
QIMONDA AG AND SUBSIDIARIES
Notes to the Combined and Consolidated Financial Statements Ì (Continued)
(euro in millions, except where otherwise stated)
of options granted is estimated based on historical experience. Beginning on the date of adoption of
SFAS No. 123 (revised 2004), forfeitures are estimated based on historical experience; prior to the date of
adoption, forfeitures were recorded as they occurred. The risk-free rate is based on treasury note yields at the
time of grant for the estimated life of the option. Infineon has not made any dividend payments in 2006 nor
does it have plans to pay dividends in the foreseeable future. After the Formation through September 30, 2006
neither Infineon nor the Company granted stock options to Qimonda employees.
The following weighted-average assumptions were used in the Black-Scholes option-pricing model:
2004 2005 2006
Weighted-average assumptions:
Risk-free interest rateÏÏÏÏÏÏÏÏÏÏÏÏÏÏÏÏÏÏÏÏÏÏÏÏÏÏÏÏÏÏÏÏÏÏÏÏÏÏÏÏÏÏÏÏÏÏ 3.68% 3.03% 3.08%
Expected volatilityÏÏÏÏÏÏÏÏÏÏÏÏÏÏÏÏÏÏÏÏÏÏÏÏÏÏÏÏÏÏÏÏÏÏÏÏÏÏÏÏÏÏÏÏÏÏÏÏÏ 59% 58% 43%
Expected life in years ÏÏÏÏÏÏÏÏÏÏÏÏÏÏÏÏÏÏÏÏÏÏÏÏÏÏÏÏÏÏÏÏÏÏÏÏÏÏÏÏÏÏÏÏÏÏ 4.50 4.50 5.07
Weighted-average fair value per option at grant date in euro ÏÏÏÏÏÏÏÏÏÏÏÏÏ 5.89 4.06 3.19
Stock-Based Compensation Expense
Total stock-based compensation cost during the year ended September 30, 2006 was 48, entirely relatedto Infineon stock options, and is reflected as a non-cash equity contribution by Infineon in the statement of
business/shareholders' equity. Cost of goods sold, SG&A (selling, general and administrative expenses), and
research and development expenses included stock-based compensation of 43, 43 and 42, respectively, for the
year ended September 30, 2006. The amount of stock-based compensation cost which was capitalized and
remained in inventory as of September 2006 was immaterial. Stock-based compensation expense does not
reflect any income tax benefits, since stock options are granted in tax jurisdictions where the expense is not
deductible for tax purposes. As of September 30, 2006, there was a total of 46.8 in unrecognized compensation
cost related to unvested stock options which is expected to be recognized over a period of 3.5 years.
Prior to the 2006 financial year, the Company applied the provisions of APB No. 25, as permitted under
SFAS No. 148, ""Accounting for Stock-Based Compensation Ì Transition and Disclosure an amendment ofSFAS No. 123''.
If the Company had accounted for stock-based compensation according to the fair value method of
SFAS No. 123, and thereby recognized compensation expense based on the above fair values over the
respective option vesting periods, net income would have been reduced to the pro forma amounts indicated
below, pursuant to the provision of SFAS No. 148:
2004 2005
Net (loss) income:
As reported ÏÏÏÏÏÏÏÏÏÏÏÏÏÏÏÏÏÏÏÏÏÏÏÏÏÏÏÏÏÏÏÏÏÏÏÏÏÏÏÏÏÏÏÏÏÏÏÏÏÏÏÏÏÏÏÏÏÏÏÏ (79) 18
Less: Total stock-based employee compensation expense determined under fairvalue based method for all awards, net of related tax effects ÏÏÏÏÏÏÏÏÏÏÏÏÏÏ (14) (9)
Pro forma ÏÏÏÏÏÏÏÏÏÏÏÏÏÏÏÏÏÏÏÏÏÏÏÏÏÏÏÏÏÏÏÏÏÏÏÏÏÏÏÏÏÏÏÏÏÏÏÏÏÏÏÏÏÏÏÏÏÏÏÏÏ (93) 9
Basic and diluted earnings (loss) per share:
As reported ÏÏÏÏÏÏÏÏÏÏÏÏÏÏÏÏÏÏÏÏÏÏÏÏÏÏÏÏÏÏÏÏÏÏÏÏÏÏÏÏÏÏÏÏÏÏÏÏÏÏÏÏÏÏÏÏÏÏÏÏ (0.26) 0.06
Pro forma ÏÏÏÏÏÏÏÏÏÏÏÏÏÏÏÏÏÏÏÏÏÏÏÏÏÏÏÏÏÏÏÏÏÏÏÏÏÏÏÏÏÏÏÏÏÏÏÏÏÏÏÏÏÏÏÏÏÏÏÏÏ (0.31) 0.03
As noted above, options on Infineon stock do not represent potential dilutive instruments for Qimonda
AG and accordingly, they have no impact on diluted earnings (loss) per share (see note 10).
F-40
Global Reports LLC
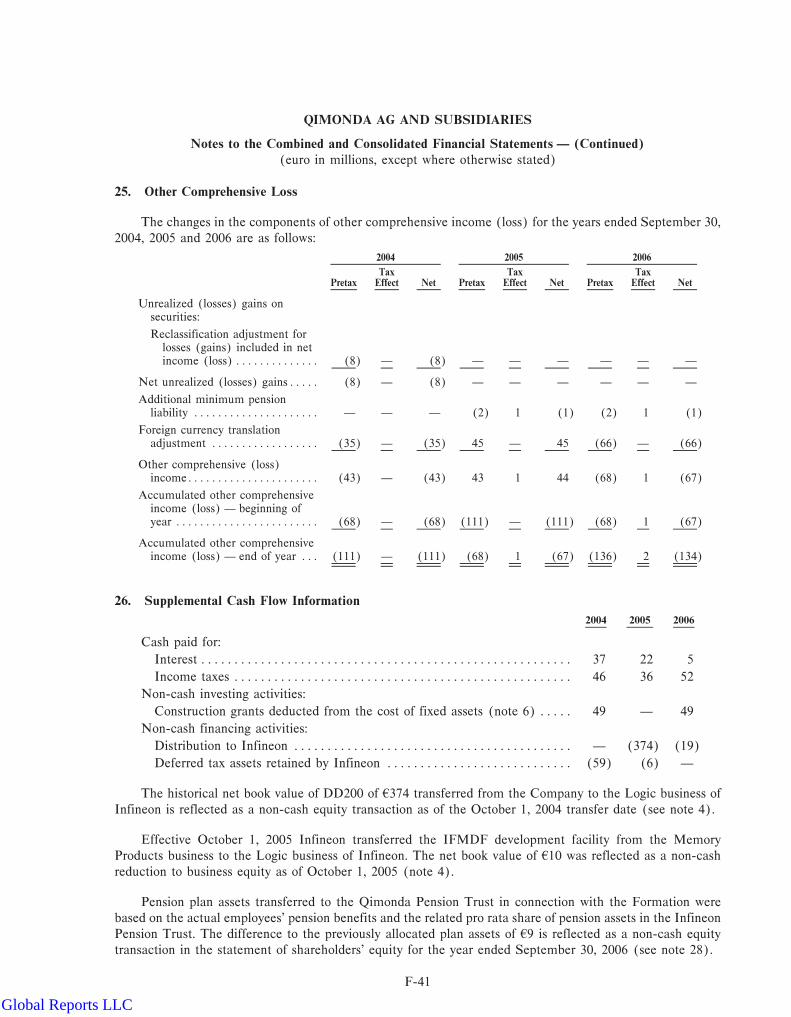
QIMONDA AG AND SUBSIDIARIES
Notes to the Combined and Consolidated Financial Statements Ì (Continued)
(euro in millions, except where otherwise stated)
25. Other Comprehensive Loss
The changes in the components of other comprehensive income (loss) for the years ended September 30,
2004, 2005 and 2006 are as follows:
2004 2005 2006
Tax Tax TaxPretax Effect Net Pretax Effect Net Pretax Effect Net
Unrealized (losses) gains onsecurities:
Reclassification adjustment forlosses (gains) included in netincome (loss) ÏÏÏÏÏÏÏÏÏÏÏÏÏÏ (8) Ì (8) Ì Ì Ì Ì Ì Ì
Net unrealized (losses) gainsÏÏÏÏÏ (8) Ì (8) Ì Ì Ì Ì Ì Ì
Additional minimum pensionliability ÏÏÏÏÏÏÏÏÏÏÏÏÏÏÏÏÏÏÏÏÏ Ì Ì Ì (2) 1 (1) (2) 1 (1)
Foreign currency translationadjustment ÏÏÏÏÏÏÏÏÏÏÏÏÏÏÏÏÏÏ (35) Ì (35) 45 Ì 45 (66) Ì (66)
Other comprehensive (loss)incomeÏÏÏÏÏÏÏÏÏÏÏÏÏÏÏÏÏÏÏÏÏÏ (43) Ì (43) 43 1 44 (68) 1 (67)
Accumulated other comprehensiveincome (loss) Ì beginning ofyear ÏÏÏÏÏÏÏÏÏÏÏÏÏÏÏÏÏÏÏÏÏÏÏÏ (68) Ì (68) (111) Ì (111) (68) 1 (67)
Accumulated other comprehensiveincome (loss) Ì end of year ÏÏÏ (111) Ì (111) (68) 1 (67) (136) 2 (134)
26. Supplemental Cash Flow Information
2004 2005 2006
Cash paid for:
Interest ÏÏÏÏÏÏÏÏÏÏÏÏÏÏÏÏÏÏÏÏÏÏÏÏÏÏÏÏÏÏÏÏÏÏÏÏÏÏÏÏÏÏÏÏÏÏÏÏÏÏÏÏÏÏÏÏ 37 22 5
Income taxes ÏÏÏÏÏÏÏÏÏÏÏÏÏÏÏÏÏÏÏÏÏÏÏÏÏÏÏÏÏÏÏÏÏÏÏÏÏÏÏÏÏÏÏÏÏÏÏÏÏÏÏ 46 36 52
Non-cash investing activities:
Construction grants deducted from the cost of fixed assets (note 6) ÏÏÏÏÏ 49 Ì 49
Non-cash financing activities:
Distribution to Infineon ÏÏÏÏÏÏÏÏÏÏÏÏÏÏÏÏÏÏÏÏÏÏÏÏÏÏÏÏÏÏÏÏÏÏÏÏÏÏÏÏÏÏ Ì (374) (19)
Deferred tax assets retained by Infineon ÏÏÏÏÏÏÏÏÏÏÏÏÏÏÏÏÏÏÏÏÏÏÏÏÏÏÏÏ (59) (6) Ì
The historical net book value of DD200 of 4374 transferred from the Company to the Logic business of
Infineon is reflected as a non-cash equity transaction as of the October 1, 2004 transfer date (see note 4).
Effective October 1, 2005 Infineon transferred the IFMDF development facility from the Memory
Products business to the Logic business of Infineon. The net book value of 410 was reflected as a non-cash
reduction to business equity as of October 1, 2005 (note 4).
Pension plan assets transferred to the Qimonda Pension Trust in connection with the Formation were
based on the actual employees' pension benefits and the related pro rata share of pension assets in the Infineon
Pension Trust. The difference to the previously allocated plan assets of 49 is reflected as a non-cash equity
transaction in the statement of shareholders' equity for the year ended September 30, 2006 (see note 28).
F-41
Global Reports LLC

QIMONDA AG AND SUBSIDIARIES
Notes to the Combined and Consolidated Financial Statements Ì (Continued)
(euro in millions, except where otherwise stated)
Deferred tax assets related to tax loss carry-forwards, net of valuation allowance, or tax credits that will be
retained by Infineon and not transferred to the Company at the Formation of 459, 46 and 40 as of
September 30, 2004, 2005 and 2006 are reflected as non-cash decreases to business/shareholders' equity in the
accompanying combined and consolidated financial statements.
27. Related Parties
The Company has transactions in the normal course of business with Infineon group companies, Siemens
group companies and with Related and Associated Companies (together, ""Related Parties''). The Company
purchases certain of its raw materials, especially chipsets, from, and sells certain of its products to, Related
Parties. Purchases and sales to Related Parties are generally based on market prices or manufacturing cost
plus a mark-up. Contributions by Infineon in connection with the Formation and allocations by Infineon prior
to that date are explained in note 1.
On April 3, 2006, Siemens disposed of its remaining shareholding in Infineon. Transactions between
Qimonda and Siemens subsequent to this date are no longer reflected as Related Party transactions.
Related Party receivables at September 30, 2005 and 2006 consist of the following:
2005 2006
Current:
Infineon group Ì trade (note 12)ÏÏÏÏÏÏÏÏÏÏÏÏÏÏÏÏÏÏÏÏÏÏÏÏÏÏÏÏÏÏÏÏÏÏÏÏÏÏÏÏÏ 8 61
Associated and Related Companies Ì trade (note 12) ÏÏÏÏÏÏÏÏÏÏÏÏÏÏÏÏÏÏÏÏÏÏÏ 4 Ì
Siemens group Ì trade (note 12)ÏÏÏÏÏÏÏÏÏÏÏÏÏÏÏÏÏÏÏÏÏÏÏÏÏÏÏÏÏÏÏÏÏÏÏÏÏÏÏÏÏ 1 Ì
Associated and Related Companies Ì financial and other (note 14)ÏÏÏÏÏÏÏÏÏÏÏÏ 1 Ì
Employee receivables (note 14) ÏÏÏÏÏÏÏÏÏÏÏÏÏÏÏÏÏÏÏÏÏÏÏÏÏÏÏÏÏÏÏÏÏÏÏÏÏÏÏÏÏÏ 3 2
Total Related Party receivablesÏÏÏÏÏÏÏÏÏÏÏÏÏÏÏÏÏÏÏÏÏÏÏÏÏÏÏÏÏÏÏÏÏÏÏÏÏÏÏÏÏÏÏÏÏ 17 63
Receivables from Infineon mainly represent amounts due to the Company's operations in Japan which is
expected to be transferred from Infineon during the three months ending March 31, 2007.
Related Party payables at September 30, 2005 and 2006 consist of the following:
2005 2006
Current:
Infineon group Ì trade (note 18)ÏÏÏÏÏÏÏÏÏÏÏÏÏÏÏÏÏÏÏÏÏÏÏÏÏÏÏÏÏÏÏÏÏÏÏÏÏÏÏÏÏ 31 71
Associated and Related Companies Ì trade (note 18) ÏÏÏÏÏÏÏÏÏÏÏÏÏÏÏÏÏÏÏÏÏÏÏ 64 76
Siemens group Ì trade (note 18)ÏÏÏÏÏÏÏÏÏÏÏÏÏÏÏÏÏÏÏÏÏÏÏÏÏÏÏÏÏÏÏÏÏÏÏÏÏÏÏÏÏ 2 Ì
Infineon group Ì financial and other (note 20) ÏÏÏÏÏÏÏÏÏÏÏÏÏÏÏÏÏÏÏÏÏÏÏÏÏÏÏÏÏ 6 9
Associated and Related Companies Ì financial and other (note 20)ÏÏÏÏÏÏÏÏÏÏÏÏ Ì Ì
Total Related Party payables ÏÏÏÏÏÏÏÏÏÏÏÏÏÏÏÏÏÏÏÏÏÏÏÏÏÏÏÏÏÏÏÏÏÏÏÏÏÏÏÏÏÏÏÏÏÏÏ 103 156
Related Party receivables and payables have been segregated first between amounts owed by or to
Infineon group companies, Siemens group companies and companies in which the Company has an ownership
interest, and second based on the underlying nature of the transactions. Trade receivables and payables include
amounts for the purchase and sale of products and services. Financial and other receivables and payables
represent amounts owed relating to loans and advances and accrued interest at interbank rates.
F-42
Global Reports LLC

QIMONDA AG AND SUBSIDIARIES
Notes to the Combined and Consolidated Financial Statements Ì (Continued)
(euro in millions, except where otherwise stated)
Related Party debt at September 30, 2005 and 2006 consists of the following:
2005 2006
Short-term debt:
Loans from Infineon (note 21) ÏÏÏÏÏÏÏÏÏÏÏÏÏÏÏÏÏÏÏÏÏÏÏÏÏÏÏÏÏÏÏÏÏÏÏÏÏÏÏÏÏÏÏ 524 344
Total Related Party debt ÏÏÏÏÏÏÏÏÏÏÏÏÏÏÏÏÏÏÏÏÏÏÏÏÏÏÏÏÏÏÏÏÏÏÏÏÏÏÏÏÏÏÏÏÏÏÏÏÏÏ 524 344
Transactions with Related Parties during the years ended September 30, 2004, 2005 and 2006, include
the following:
2004 2005 2006
Sales to Related Parties:
Siemens group companies ÏÏÏÏÏÏÏÏÏÏÏÏÏÏÏÏÏÏÏÏÏÏÏÏÏÏÏÏÏÏÏÏÏÏÏÏÏÏÏÏÏ 9 3 17
Infineon group companies ÏÏÏÏÏÏÏÏÏÏÏÏÏÏÏÏÏÏÏÏÏÏÏÏÏÏÏÏÏÏÏÏÏÏÏÏÏÏÏÏÏ 83 Ì Ì
Associated and Related Companies ÏÏÏÏÏÏÏÏÏÏÏÏÏÏÏÏÏÏÏÏÏÏÏÏÏÏÏÏÏÏÏÏÏ 4 1 Ì
96 4 17
Purchases from Related Parties:
Siemens group companies ÏÏÏÏÏÏÏÏÏÏÏÏÏÏÏÏÏÏÏÏÏÏÏÏÏÏÏÏÏÏÏÏÏÏÏÏÏÏÏÏÏ 22 13 4
Infineon group companies ÏÏÏÏÏÏÏÏÏÏÏÏÏÏÏÏÏÏÏÏÏÏÏÏÏÏÏÏÏÏÏÏÏÏÏÏÏÏÏÏÏ Ì 265 403
Associated and Related Companies ÏÏÏÏÏÏÏÏÏÏÏÏÏÏÏÏÏÏÏÏÏÏÏÏÏÏÏÏÏÏÏÏÏ 23 247 438
45 525 845
Sales to Infineon during the year ended September 30, 2004 are related to the DD200 facility which was
transferred to Infineon effective October 1, 2004 (see note 4). Purchases from Infineon during the years ended
September 30, 2005 and 2006 are principally related to products purchased from the DD200 facility and are
based on Infineon's cost plus a margin. Purchases from Siemens group companies primarily include purchases
of fixed assets and rent payments.
2004 2005 2006
Interest income from (expense to) Infineon group companies:
Interest income from Infineon group companiesÏÏÏÏÏÏÏÏÏÏÏÏÏÏÏÏÏÏÏÏÏÏÏ 21 40 15
Interest expense to Infineon group companies ÏÏÏÏÏÏÏÏÏÏÏÏÏÏÏÏÏÏÏÏÏÏÏÏ (21) (34) (38)
Ì 6 (23)
Since the Formation, the Company entered into several service agreements with Infineon. These include
general support services (including sales support, logistics services, purchasing services, human resources
services, facility management services, patent support, finance, accounting and treasury support, legal services
F-43
Global Reports LLC

QIMONDA AG AND SUBSIDIARIES
Notes to the Combined and Consolidated Financial Statements Ì (Continued)
(euro in millions, except where otherwise stated)
and strategy services), R&D services and IT services. Transactions under these agreements during the five
months ended September 30, 2006 are reflected in the consolidated statements of operations as follows:
Five months endedSeptember 30, 2006
Cost of goods soldÏÏÏÏÏÏÏÏÏÏÏÏÏÏÏÏÏÏÏÏÏÏÏÏÏÏÏÏÏÏÏÏÏÏÏÏÏÏÏÏÏÏÏÏÏÏÏÏÏÏÏ 95
Research and development expenses ÏÏÏÏÏÏÏÏÏÏÏÏÏÏÏÏÏÏÏÏÏÏÏÏÏÏÏÏÏÏÏÏÏÏÏ 10
Selling, general and administrative expenses ÏÏÏÏÏÏÏÏÏÏÏÏÏÏÏÏÏÏÏÏÏÏÏÏÏÏÏÏÏ 14
119
In connection with the Formation, the Company entered into a global service agreement with Infineon,
whereby the parties intend to provide standard support services to one another based on actual costs plus a
margin of 3 percent. The Company and Infineon have also entered into a research and development services
agreement for the provision of research and development services between the parties based on actual cost plus
a margin of 3 percent.
Under the master information technology cost sharing agreement, Infineon and the Company generally
agree to share costs of a variety of information technology services provided by one or both parties in the
common interest and for the common benefit of both parties. In general, the parties agree to share the fixed
costs of the services provided (accounting for approximately 53% of total costs) roughly equally and to share
variable costs in a manner that reflects each party's contribution to those costs. Under the master information
technology service agreement, Infineon and the Company agree to provide information technology services to
one another. In general, under all of these agreements, the service recipient pays a fee based on actual or
estimated total costs incurred plus a margin of 3% for the period from May 1, 2006 to September 30, 2006 and
thereafter as mutually agreed from year to year.
Dresden 200mm Fab
In April 2006, Infineon and Qimonda entered into an agreement for the production of wafers in the
Dresden 200mm fab. Pursuant to the agreement, Infineon has agreed to manufacture certain specified
semiconductor memory products at the Dresden 200mm fab, using the Company's manufacturing technolo-
gies and masks, and to sell them to the Company at prices specified in the agreement. The Company is
required under this agreement to pay for idle costs resulting from its purchasing fewer wafers from Infineon
than agreed upon, if Infineon cannot otherwise utilize the capacity. The Company is obliged to indemnify
Infineon against any third party claims based on or related to any products manufactured for the Company
under this agreement. In addition, the Company has to indemnify Infineon against any intellectual property
infringement claims related to the products covered by the agreement. The agreement terminates on
September 30, 2007 unless extended by a written mutual agreement between Infineon and the Company.
Qimonda is currently in negotiations with Infineon regarding the Company's use or acquisition, after
September 30, 2007, of capacity at Infineon's 200mm manufacturing facility in Dresden. In addition, the
contribution agreement provides for indemnification of Infineon with respect to certain existing and future
legal claims and potential restructuring costs incurred in connection with the rampdown of production in one
module of the 200 mm facility. Restructuring costs may include severance payments, costs relating to lower
levels of production in that module and higher production costs in another module.
28. Pension Plans
The Company's employees participate in the pension plans of Infineon. Infineon has defined benefit
pension plans in Germany (""Domestic Plans'') and in other countries (""Foreign Plans''). The pension costs
F-44
Global Reports LLC

QIMONDA AG AND SUBSIDIARIES
Notes to the Combined and Consolidated Financial Statements Ì (Continued)
(euro in millions, except where otherwise stated)
and liabilities included in the accompanying combined and consolidated financial statements and presented
below represent the portion of the Infineon pension costs and liabilities that relate to the Company's
employees participating in the respective Infineon pension plans.
Infineon's pension plans are partially funded by pension plan assets contributed by Infineon. Since
Infineon's pension plan assets fund the total pension liability as a whole and not individual pension claims, a
pro-rata portion of the Infineon pension assets in relation to the Infineon projected benefit obligation were
allocated as plan assets for purposes of the accompanying combined and consolidated financial statements.
The Company's employees continue to participate in the Infineon plans until such time as separate Qimonda
pension plans are established.
Infineon's plan benefits are principally based upon years of service. Certain pension plans are based on
salary earned in the last year or last five years of employment, while others are fixed plans depending on
ranking (both salary level and position). The measurement date for the Company's pension plans is June 30.
Information with respect to Infineon's pension plans, which relate to the Company's employees for the
years ended September 30, 2004, 2005 and 2006 is presented for German (""Domestic'') plans and non-
German (""Foreign'') plans:
2004 2005 2006
Domestic Foreign Domestic Foreign Domestic ForeignPlans Plans Plans Plans Plans Plans
Accumulated benefit obligations endof year ÏÏÏÏÏÏÏÏÏÏÏÏÏÏÏÏÏÏÏÏÏÏÏ (31) (3) (49) (4) (41) (3)
Change in projected benefitobligationProjected benefit obligations
beginning of year ÏÏÏÏÏÏÏÏÏÏÏÏ (31) (7) (39) (5) (59) (6)Service costÏÏÏÏÏÏÏÏÏÏÏÏÏÏÏÏÏÏÏ (3) (1) (3) (1) (6) ÌInterest cost ÏÏÏÏÏÏÏÏÏÏÏÏÏÏÏÏÏÏ (2) Ì (2) Ì (3) ÌActuarial (losses) gainsÏÏÏÏÏÏÏÏÏ (1) Ì (4) Ì (2) 2Disposal of plan ÏÏÏÏÏÏÏÏÏÏÏÏÏÏÏ Ì 4 7 Ì Ì ÌPlan transfer ÏÏÏÏÏÏÏÏÏÏÏÏÏÏÏÏÏÏ (2) (1) (14) Ì 17 ÌPlan amendments ÏÏÏÏÏÏÏÏÏÏÏÏÏÏ Ì Ì (4) Ì Ì ÌCurtailment gainÏÏÏÏÏÏÏÏÏÏÏÏÏÏÏ Ì Ì Ì Ì Ì 1
Projected benefit obligations endof year ÏÏÏÏÏÏÏÏÏÏÏÏÏÏÏÏÏÏÏÏÏ (39) (5) (59) (6) (53) (3)
Change in fair value of plan assets:Fair value at beginning of year ÏÏÏ 16 4 22 3 31 3Contributions and transfers ÏÏÏÏÏÏ 4 (1) 6 Ì Ì ÌActual return on plan assets ÏÏÏÏÏ 2 Ì 3 Ì 2 ÌPlan transfer ÏÏÏÏÏÏÏÏÏÏÏÏÏÏÏÏÏÏ Ì Ì Ì Ì (8) (1)
Fair value at end of year ÏÏÏÏÏÏÏÏ 22 3 31 3 25 2
Funded status ÏÏÏÏÏÏÏÏÏÏÏÏÏÏÏÏÏÏÏ (17) (2) (28) (3) (28) (1)Unrecognized actuarial lossÏÏÏÏÏÏÏÏ 2 Ì 4 Ì 8 (1)
Net liability recognized ÏÏÏÏÏÏÏÏÏÏÏ (15) (2) (24) (3) (20) (2)
On January 1, 2006 the Company converted the existing defined benefit plan in the US into a defined
contribution plan, which resulted in a curtailment gain of 41.
F-45
Global Reports LLC
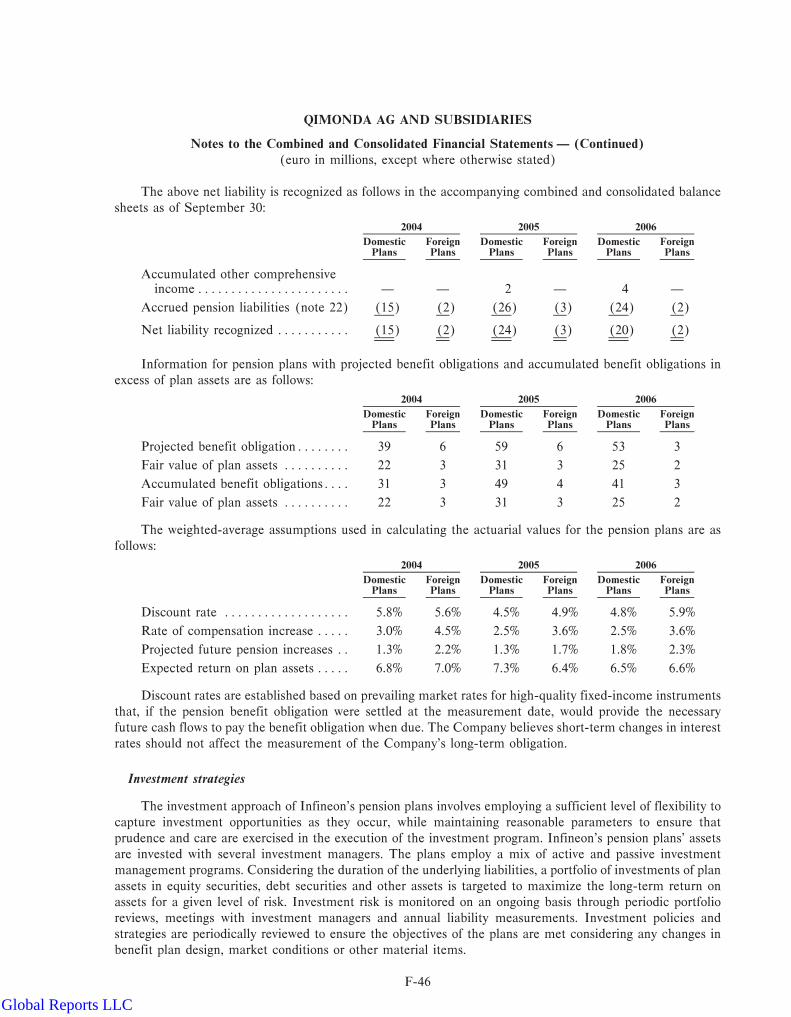
QIMONDA AG AND SUBSIDIARIES
Notes to the Combined and Consolidated Financial Statements Ì (Continued)
(euro in millions, except where otherwise stated)
The above net liability is recognized as follows in the accompanying combined and consolidated balance
sheets as of September 30:
2004 2005 2006
Domestic Foreign Domestic Foreign Domestic ForeignPlans Plans Plans Plans Plans Plans
Accumulated other comprehensiveincomeÏÏÏÏÏÏÏÏÏÏÏÏÏÏÏÏÏÏÏÏÏÏÏ Ì Ì 2 Ì 4 Ì
Accrued pension liabilities (note 22) (15) (2) (26) (3) (24) (2)
Net liability recognized ÏÏÏÏÏÏÏÏÏÏÏ (15) (2) (24) (3) (20) (2)
Information for pension plans with projected benefit obligations and accumulated benefit obligations in
excess of plan assets are as follows:
2004 2005 2006
Domestic Foreign Domestic Foreign Domestic ForeignPlans Plans Plans Plans Plans Plans
Projected benefit obligationÏÏÏÏÏÏÏÏ 39 6 59 6 53 3
Fair value of plan assets ÏÏÏÏÏÏÏÏÏÏ 22 3 31 3 25 2
Accumulated benefit obligationsÏÏÏÏ 31 3 49 4 41 3
Fair value of plan assets ÏÏÏÏÏÏÏÏÏÏ 22 3 31 3 25 2
The weighted-average assumptions used in calculating the actuarial values for the pension plans are as
follows:
2004 2005 2006
Domestic Foreign Domestic Foreign Domestic ForeignPlans Plans Plans Plans Plans Plans
Discount rate ÏÏÏÏÏÏÏÏÏÏÏÏÏÏÏÏÏÏÏ 5.8% 5.6% 4.5% 4.9% 4.8% 5.9%
Rate of compensation increase ÏÏÏÏÏ 3.0% 4.5% 2.5% 3.6% 2.5% 3.6%
Projected future pension increases ÏÏ 1.3% 2.2% 1.3% 1.7% 1.8% 2.3%
Expected return on plan assets ÏÏÏÏÏ 6.8% 7.0% 7.3% 6.4% 6.5% 6.6%
Discount rates are established based on prevailing market rates for high-quality fixed-income instruments
that, if the pension benefit obligation were settled at the measurement date, would provide the necessary
future cash flows to pay the benefit obligation when due. The Company believes short-term changes in interest
rates should not affect the measurement of the Company's long-term obligation.
Investment strategies
The investment approach of Infineon's pension plans involves employing a sufficient level of flexibility to
capture investment opportunities as they occur, while maintaining reasonable parameters to ensure that
prudence and care are exercised in the execution of the investment program. Infineon's pension plans' assets
are invested with several investment managers. The plans employ a mix of active and passive investment
management programs. Considering the duration of the underlying liabilities, a portfolio of investments of plan
assets in equity securities, debt securities and other assets is targeted to maximize the long-term return on
assets for a given level of risk. Investment risk is monitored on an ongoing basis through periodic portfolio
reviews, meetings with investment managers and annual liability measurements. Investment policies and
strategies are periodically reviewed to ensure the objectives of the plans are met considering any changes in
benefit plan design, market conditions or other material items.
F-46
Global Reports LLC

QIMONDA AG AND SUBSIDIARIES
Notes to the Combined and Consolidated Financial Statements Ì (Continued)
(euro in millions, except where otherwise stated)
Expected long-term rate of return on plan assets
Establishing the expected rate of return on pension assets requires judgment. Infineon's approach in
determining the long-term rate of return for plan assets is based upon historical financial market relationships
that have existed over time, the types of investment classes in which pension plan assets are invested, long-
term investment strategies, as well as the expected compounded return Infineon can reasonably expect the
portfolio to earn over appropriate time periods.
Infineon reviews the expected long-term rate of return annually and revises it as appropriate. Also,
Infineon periodically commissions detailed asset/liability studies to be performed by third-party professional
investment advisors and actuaries.
Plan asset allocation
For periods prior to Formation a portion of the Infineon pension plan assets have been allocated to the
Company based on the proportion of the Company's projected benefit obligation to the total Infineon
projected benefit obligation.
As of September 30, 2005 and 2006 the percentage of plan assets invested and the targeted allocation in
major asset categories are as follows:
2005 2006 Targeted Allocation
Domestic Foreign Domestic Foreign Domestic ForeignPlans Plans Plans Plans Plans Plans
Equity securities ÏÏÏÏÏÏÏÏÏÏÏÏÏÏÏÏÏ 44% 51% Ì 61% 45% 60%
Debt securities ÏÏÏÏÏÏÏÏÏÏÏÏÏÏÏÏÏÏ 51% 35% Ì 39% 52% 40%
CashÏÏÏÏÏÏÏÏÏÏÏÏÏÏÏÏÏÏÏÏÏÏÏÏÏÏÏ Ì Ì 100% Ì 3% Ì
Other ÏÏÏÏÏÏÏÏÏÏÏÏÏÏÏÏÏÏÏÏÏÏÏÏÏÏ 5% 14% Ì Ì Ì Ì
Total ÏÏÏÏÏÏÏÏÏÏÏÏÏÏÏÏÏÏÏÏÏÏÏÏÏÏ 100% 100% 100% 100% 100% 100%
In 2000, Infineon established the Infineon Technologies Pension Trust e.V. (the ""Infineon Pension
Trust'') for the purpose of funding future pension benefit payments for employees in Germany in order to
reduce its exposure to certain risks associated with defined benefit plans. Infineon contributed 4155 of cashand marketable debt and equity securities, which qualify as plan assets under SFAS No. 87 ""Employers'Accounting for Pensions'', to the Pension Trust for use in funding these pension benefit obligations, thereby
reducing accrued pension liabilities. In the accompanying combined and consolidated financial statements for
periods prior to the Formation, these plan assets have been allocated to the Memory Products business on a
pro rata basis according to the projected benefit obligation in each respective year.
In September 2006 the Company established the Qimonda Pension Trust. The Infineon Pension Trust
transferred 426 in cash to the Qimonda Pension Trust, representing the pro rata portion of the Infineon Plan
Assets related to the actual Qimonda employees at the Formation. The Qimonda Pension Trust is to invest
these funds according to the targeted investment allocation. The difference between the actually transferred
assets and the previously allocated plan assets of 49 is reflected as a non-cash equity transaction in the
statement of business/shareholders' equity for the year ended September 30, 2006 (see note 26).
The Company's asset allocation targets for its pension plan assets are based on its assessment of business
and financial conditions, demographic and actuarial data, funding characteristics, related risk factors, market
sensitivity analysis and other relevant factors. The overall allocation is expected to help protect the plans'
funded status while generating sufficiently stable real returns (i.e. net of inflation) to meet current and future
benefit payment needs. Due to active portfolio management, the asset allocation may differ from the target
F-47
Global Reports LLC

QIMONDA AG AND SUBSIDIARIES
Notes to the Combined and Consolidated Financial Statements Ì (Continued)
(euro in millions, except where otherwise stated)
allocation up to certain limits for different classes. As a matter of policy, the Company's pension plans do not
invest in the Company's and Infineon's shares.
The components of net periodic pension cost for the years ended September 30, 2005 and 2006 are as
follows:
2004 2005 2006
Domestic Foreign Domestic Foreign Domestic ForeignPlans Plans Plans Plans Plans Plans
Service costÏÏÏÏÏÏÏÏÏÏÏÏÏÏÏÏÏÏÏÏÏ (3) (1) (3) (1) (6) Ì
Interest cost ÏÏÏÏÏÏÏÏÏÏÏÏÏÏÏÏÏÏÏÏ (2) Ì (2) Ì (3) Ì
Expected return on plan assets ÏÏÏÏÏ 1 Ì 2 Ì 2 Ì
Curtailment gain recognized ÏÏÏÏÏÏÏ Ì Ì Ì Ì Ì 1
Net periodic pension cost ÏÏÏÏÏÏÏÏÏ (4) (1) (3) (1) (7) 1
The prior service costs relating to the pension plans are amortized in equal amounts over the expected
years of future service of each active employee who is expected to receive benefits from the pension plans.
Unrecognized gains or losses are included in the net pension cost for the years if, as of the beginning of
the year, the unrecognized net gains or losses exceed 10% of the greater of the projected benefit obligation or
the market value of the plan assets. The amortization is the excess divided by the average remaining service
period of active employees expected to receive benefits under the plan.
Actuarial losses amounted to 41, 44 and 40 for the years ended September 30, 2004, 2005, and 2006
respectively.
The future benefit payments, which reflect future service, as appropriate, that are expected to be paid
from the Company's pension plan for the next five financial years and thereafter are as follows:
Domestic ForeignYears Ending September 30, Plans Plans
2007 ÏÏÏÏÏÏÏÏÏÏÏÏÏÏÏÏÏÏÏÏÏÏÏÏÏÏÏÏÏÏÏÏÏÏÏÏÏÏÏÏÏÏÏÏÏÏÏÏÏÏÏÏÏÏÏÏÏÏÏÏÏÏ Ì Ì
2008 ÏÏÏÏÏÏÏÏÏÏÏÏÏÏÏÏÏÏÏÏÏÏÏÏÏÏÏÏÏÏÏÏÏÏÏÏÏÏÏÏÏÏÏÏÏÏÏÏÏÏÏÏÏÏÏÏÏÏÏÏÏÏ 1 Ì
2009 ÏÏÏÏÏÏÏÏÏÏÏÏÏÏÏÏÏÏÏÏÏÏÏÏÏÏÏÏÏÏÏÏÏÏÏÏÏÏÏÏÏÏÏÏÏÏÏÏÏÏÏÏÏÏÏÏÏÏÏÏÏÏ 1 Ì
2010 ÏÏÏÏÏÏÏÏÏÏÏÏÏÏÏÏÏÏÏÏÏÏÏÏÏÏÏÏÏÏÏÏÏÏÏÏÏÏÏÏÏÏÏÏÏÏÏÏÏÏÏÏÏÏÏÏÏÏÏÏÏÏ 1 Ì
2011 ÏÏÏÏÏÏÏÏÏÏÏÏÏÏÏÏÏÏÏÏÏÏÏÏÏÏÏÏÏÏÏÏÏÏÏÏÏÏÏÏÏÏÏÏÏÏÏÏÏÏÏÏÏÏÏÏÏÏÏÏÏÏ 1 Ì
2012-2016 ÏÏÏÏÏÏÏÏÏÏÏÏÏÏÏÏÏÏÏÏÏÏÏÏÏÏÏÏÏÏÏÏÏÏÏÏÏÏÏÏÏÏÏÏÏÏÏÏÏÏÏÏÏÏÏÏÏ 7 1
The Company has a deferred savings plan for its employees in Germany, whereby a portion of the
employee's salary is invested for a lump sum benefit payment including interest upon retirement. The liability
for such future payments of 42 and 42 as of September 30, 2005 and 2006, respectively, is actuarially
determined and accounted for on the same basis as the Company's other pension plans.
The Company provides post-retirement health care benefits to eligible employees in the United States.
The Company recognized net periodic benefit cost of less than 41 for each of the years ended September 30,
2004, 2005 and 2006. The net liability recognized in the accompanying balance sheet was 41 and 41 as ofSeptember 30, 2005 and 2006, respectively.
F-48
Global Reports LLC
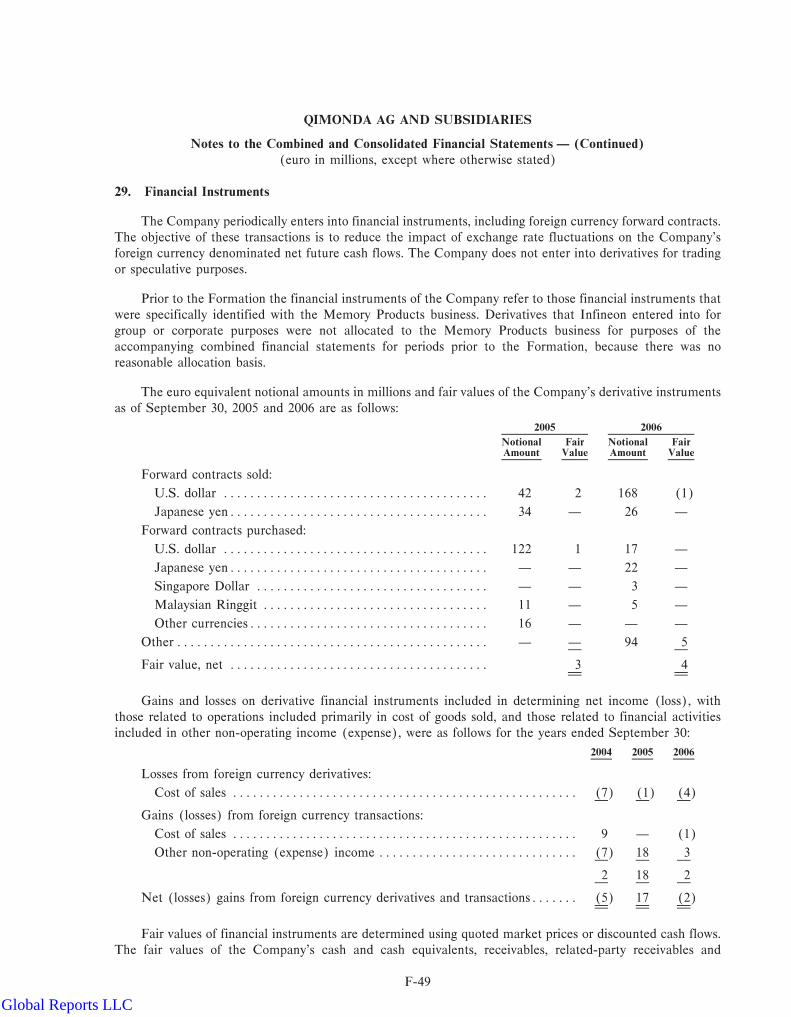
QIMONDA AG AND SUBSIDIARIES
Notes to the Combined and Consolidated Financial Statements Ì (Continued)
(euro in millions, except where otherwise stated)
29. Financial Instruments
The Company periodically enters into financial instruments, including foreign currency forward contracts.
The objective of these transactions is to reduce the impact of exchange rate fluctuations on the Company's
foreign currency denominated net future cash flows. The Company does not enter into derivatives for trading
or speculative purposes.
Prior to the Formation the financial instruments of the Company refer to those financial instruments that
were specifically identified with the Memory Products business. Derivatives that Infineon entered into for
group or corporate purposes were not allocated to the Memory Products business for purposes of the
accompanying combined financial statements for periods prior to the Formation, because there was no
reasonable allocation basis.
The euro equivalent notional amounts in millions and fair values of the Company's derivative instruments
as of September 30, 2005 and 2006 are as follows:
2005 2006
Notional Fair Notional FairAmount Value Amount Value
Forward contracts sold:
U.S. dollar ÏÏÏÏÏÏÏÏÏÏÏÏÏÏÏÏÏÏÏÏÏÏÏÏÏÏÏÏÏÏÏÏÏÏÏÏÏÏÏÏ 42 2 168 (1)
Japanese yenÏÏÏÏÏÏÏÏÏÏÏÏÏÏÏÏÏÏÏÏÏÏÏÏÏÏÏÏÏÏÏÏÏÏÏÏÏÏÏ 34 Ì 26 Ì
Forward contracts purchased:
U.S. dollar ÏÏÏÏÏÏÏÏÏÏÏÏÏÏÏÏÏÏÏÏÏÏÏÏÏÏÏÏÏÏÏÏÏÏÏÏÏÏÏÏ 122 1 17 Ì
Japanese yenÏÏÏÏÏÏÏÏÏÏÏÏÏÏÏÏÏÏÏÏÏÏÏÏÏÏÏÏÏÏÏÏÏÏÏÏÏÏÏ Ì Ì 22 Ì
Singapore Dollar ÏÏÏÏÏÏÏÏÏÏÏÏÏÏÏÏÏÏÏÏÏÏÏÏÏÏÏÏÏÏÏÏÏÏÏ Ì Ì 3 Ì
Malaysian Ringgit ÏÏÏÏÏÏÏÏÏÏÏÏÏÏÏÏÏÏÏÏÏÏÏÏÏÏÏÏÏÏÏÏÏÏ 11 Ì 5 Ì
Other currenciesÏÏÏÏÏÏÏÏÏÏÏÏÏÏÏÏÏÏÏÏÏÏÏÏÏÏÏÏÏÏÏÏÏÏÏÏ 16 Ì Ì Ì
Other ÏÏÏÏÏÏÏÏÏÏÏÏÏÏÏÏÏÏÏÏÏÏÏÏÏÏÏÏÏÏÏÏÏÏÏÏÏÏÏÏÏÏÏÏÏÏÏ Ì Ì 94 5
Fair value, net ÏÏÏÏÏÏÏÏÏÏÏÏÏÏÏÏÏÏÏÏÏÏÏÏÏÏÏÏÏÏÏÏÏÏÏÏÏÏÏ 3 4
Gains and losses on derivative financial instruments included in determining net income (loss), with
those related to operations included primarily in cost of goods sold, and those related to financial activities
included in other non-operating income (expense), were as follows for the years ended September 30:
2004 2005 2006
Losses from foreign currency derivatives:
Cost of sales ÏÏÏÏÏÏÏÏÏÏÏÏÏÏÏÏÏÏÏÏÏÏÏÏÏÏÏÏÏÏÏÏÏÏÏÏÏÏÏÏÏÏÏÏÏÏÏÏÏÏÏÏ (7) (1) (4)
Gains (losses) from foreign currency transactions:
Cost of sales ÏÏÏÏÏÏÏÏÏÏÏÏÏÏÏÏÏÏÏÏÏÏÏÏÏÏÏÏÏÏÏÏÏÏÏÏÏÏÏÏÏÏÏÏÏÏÏÏÏÏÏÏ 9 Ì (1)
Other non-operating (expense) income ÏÏÏÏÏÏÏÏÏÏÏÏÏÏÏÏÏÏÏÏÏÏÏÏÏÏÏÏÏÏ (7) 18 3
2 18 2
Net (losses) gains from foreign currency derivatives and transactionsÏÏÏÏÏÏÏ (5) 17 (2)
Fair values of financial instruments are determined using quoted market prices or discounted cash flows.
The fair values of the Company's cash and cash equivalents, receivables, related-party receivables and
F-49
Global Reports LLC
QIMONDA AG AND SUBSIDIARIES
Notes to the Combined and Consolidated Financial Statements Ì (Continued)
(euro in millions, except where otherwise stated)
payables and other financial instruments approximated their carrying values due to their short-term nature.
Marketable securities are recorded at fair value (see note 11).
30. Risks
Financial instruments that expose the Company to credit risk consist primarily of trade receivables, cash
equivalents, marketable securities and financial derivatives. Concentrations of credit risks with respect to trade
receivables are limited by the large number of geographically diverse customers that make up the Company's
customer base. The Company controls of credit risk through credit approvals, credit limits and monitoring
procedures, as well as comprehensive credit evaluations for all customers. The credit risk with respect to cash
equivalents, marketable securities and financial derivatives is limited by transactions with a number of large
international financial institutions, with pre-established limits. The Company does not believe that there is
significant risk of non-performance by these counterparties because the Company monitors their credit risk
and limits the financial exposure and the amounts of agreements entered into with any one financial
institution.
In order to remain competitive, the Company must continue to make substantial investments in process
technology and research and development. Portions of these investments might not be recoverable if these
research and development efforts fail to gain market acceptance or if markets significantly deteriorate.
Due to the high-technology nature of the Company's operations, intellectual property is an integral part of
the Company's business. The Company has intellectual property which it has self-developed, purchased or
licensed from third parties. The Company is exposed to infringements by others on such intellectual property
rights. Conversely, the Company is exposed to assertions by others of infringement by the Company of their
intellectual property rights.
The Company, through its use of third-party foundry and joint venture arrangements, uses a significant
portion of manufacturing capacity that is outside of its direct control. As a result, the Company is reliant upon
such other parties for the timely and uninterrupted supply of products and is exposed, to a certain extent, to
fluctuations in product procurement cost.
As a subsidiary of Infineon, the Company benefits under a number of patent cross-licenses, technology
licenses and purchasing agreements. The benefits of such agreements would be lost if Infineon's ownership
were to fall below 50%. The Company is in the process of negotiating certain replacement contracts with third
parties related to such patents. There is no assurance that the Company will be able to successfully negotiate
such replacement contracts at all or on similar terms. If the Company is unable to do so, it could have a
material adverse impact on its business and results of operations.
As part of the Formation, certain agreements, including licensing, purchasing and shareholding, and
investments of Infineon relating to the Company's business may not be transferable to the Company or
restrictions may exist that prolong the ownership transfer which may adversely affect our business or operating
results. For example, Infineon must obtain the prior written consent of the other investors in AMTC and BAC
before its ownership interest can be transferred to the Company.
The Company has established policies and procedures which serve as business conduct guidelines for its
employees. Should these guidelines not be adhered to, the Company could be exposed to risks relating to
wrongful actions by its employees.
After the Formation, the Company is not legally bound to collective bargaining agreements of the
employer association to which Infineon belongs. The terms and conditions of those agreements remain valid
for those employees who were employed by the Company as of the Formation, until new agreements are
negotiated.
F-50
Global Reports LLC

QIMONDA AG AND SUBSIDIARIES
Notes to the Combined and Consolidated Financial Statements Ì (Continued)
(euro in millions, except where otherwise stated)
However, as part of an agreement with the workers' council, the Company agreed to apply the same
conditions to its employees as those to which Infineon is bound through wage agreements entered until
July 30, 2008. Approximately 700 of the Company's employees are covered by these regulations.
The Company intends to negotiate a new agreement with the workers' council. There is no assurance that
the Company will be able to successfully negotiate such replacement contracts at all or on similar terms. If the
Company is unable to do so, work stoppages are possible which could have a material adverse impact on its
business and results of operations.
During the year ended September 30, 2004 the Company had one customer with 21% who accounted for
more than 10% of net sales. During the year ended September 30, 2005 the Company had that customer with
19% and one other customer with 14% which individually accounted for more than 10% of the Company's net
sales. During the year ended September 30, 2006 the Company had that customer with 18% and one other
customer with 16% which individually accounted for more than 10% of the Company's net sales.
31. Commitments and Contingencies
Contribution from Infineon
These contingencies described below were assigned to the Company pursuant to the contribution
agreement entered into between Infineon and the Company in connection with the Formation.
Under the contribution agreement, the Company is required to indemnify Infineon, in whole or in part as
specified below, for any claim (including any related expenses) arising in connection with the liabilities,
contracts, offers, uncompleted transactions, continuing obligations, risks, encumbrances and other liabilities
Infineon incurs in connection with the matters described below.
The contribution agreement is based on the principle that all potential liabilities and risks in connection
with legal matters existing as of the Formation date are generally to be borne by the business unit which
caused the risk or liability or where the risk or liability arose. Except to the limited extent described below for
the securities class action litigation and the settled Tessera litigation (for which the Company has different
arrangements), the Company has agreed to indemnify Infineon for all liabilities arising in connection with all
legal matters specifically described below, including court costs and legal fees. Infineon will not settle or
otherwise agree to any of these liabilities without the Company's prior consent. Liabilities and risks relating to
the securities class action litigation, including court costs, will be equally shared by Infineon and the
Company, but only with respect to the amount by which the total amount payable exceeds the amount of the
corresponding accrual that Infineon transferred to the Company at the formation. Infineon has agreed not to
settle this lawsuit without the Company's prior consent. Any expenses incurred in connection with the
assertion of claims against the provider of directors' and officers' (D & O) insurance covering Infineon's two
current or former officers named as defendants in the suit will also be equally shared. The D & O insurance
provider has so far refused coverage. The Company has agreed to indemnify Infineon for 80% of the court
costs and legal fees relating to the recently settled litigation with Tessera (see note 17).
The Company has further agreed to pay 60% of the total license fees payable by Infineon and the
Company to which Infineon and the Company may agree in connection with two cases in which negotiations
relating to licensing and cross-licensing were ongoing at the time of the Formation, one of which is still
ongoing.
In accordance with the general principle that all potential risks or liabilities are to be borne by the entity
which caused the risk or liability or where the risk or liability arose, the indemnification provisions of the
F-51
Global Reports LLC

QIMONDA AG AND SUBSIDIARIES
Notes to the Combined and Consolidated Financial Statements Ì (Continued)
(euro in millions, except where otherwise stated)
contribution agreement include the following specific allocation keys with respect to claims or lawsuits arising
after the Formation:
‚ liabilities arising in connection with intellectual property infringement claims relating to memory
products were fully allocated to the Company.
‚ liabilities arising in connection with actual or alleged antitrust violations with respect to DRAM
products were fully allocated to the Company.
Litigation
In September 2004, Infineon entered into a plea agreement with the Antitrust Division of the
U.S. Department of Justice (""DOJ'') in connection with its ongoing investigation of alleged antitrust
violations in the DRAM industry. Pursuant to this plea agreement, Infineon agreed to plead guilty to a single
count related to the pricing of DRAM between July 1, 1999 and June 15, 2002, and to pay a fine of
$160 million. The fine plus accrued interest is to be paid in equal annual installments through 2009. On
October 25, 2004, the plea agreement was accepted by the U.S. District Court for the Northern District of
California. Therefore, the matter has been fully resolved as between Infineon and the DOJ, subject to
Infineon's obligation to cooperate with the DOJ in its ongoing investigation of other participants in the
DRAM industry. The charges by the DOJ related to DRAM-product sales to six Original Equipment
Manufacturer (""OEM'') customers that manufacture computers and servers. Infineon has entered into
settlement agreements with five of these OEM customers and is considering the possibility of a settlement
with the remaining OEM customer, which purchased only a very small volume of DRAM from Infineon.
Subsequent to the commencement of the DOJ investigation, a number of purported class action lawsuits
were filed against Infineon, its principal U.S. subsidiary and other DRAM suppliers.
Sixteen cases were filed between June 21, 2002 and September 19, 2002 in the following U.S. federal
district courts: one in the Southern District of New York, five in the District of Idaho, and ten in the Northern
District of California. Each of the federal district court cases purports to be on behalf of a class of individuals
and entities who purchased DRAM directly from various DRAM suppliers in the United States of America
during a specified time period, which was originally alleged to have commenced on or after October 1, 2001
(""Direct U.S. Purchaser Class''). The complaints allege price-fixing in violation of the Sherman Act and seek
treble damages in unspecified amounts, costs, attorneys' fees, and an injunction against the allegedly unlawful
conduct.
In September 2002, the Judicial Panel on Multi-District Litigation ordered that the foregoing federal
cases be transferred to the U.S. District Court for the Northern District of California for coordinated or
consolidated pre-trial proceedings as part of a Multi-District Litigation (""MDL''). In October 2003 and June
2005, the plaintiffs filed amended complaints, which together allege that the unlawful conduct commenced on
approximately April 1, 1999 and continued through at least June 30, 2002.
In September 2005, Infineon and its principal U.S. subsidiary entered into a definitive settlement
agreement with counsel to the Direct U.S. Purchaser Class (subject to approval by the U.S. District Court for
the Northern District of California and to an opportunity for individual class members to opt out of the
settlement) and has secured individual settlements with eight direct customers in addition to those OEMs
identified by the DOJ. The court has scheduled the trial in the Direct U.S. Purchaser Class cases to begin on
April 23, 2007. Under the terms of the settlement agreement Infineon agreed to pay approximately
$21 million. The Company recorded a corresponding charge to other operating expense during the year ended
September 30, 2005. In addition to this settlement payment, Infineon agreed to pay an additional amount if it
is proven that sales of DRAM products to the settlement class after opt-outs during the settlement period
exceeded $208.1 million. The Company would also be responsible for this payment. The additional amount
F-52
Global Reports LLC

QIMONDA AG AND SUBSIDIARIES
Notes to the Combined and Consolidated Financial Statements Ì (Continued)
(euro in millions, except where otherwise stated)
payable is calculated by multiplying the amount by which these sales exceed $208.1 million by 10.53%. The
Company does not currently expect to pay any additional amount to the class. The settlement was
provisionally approved on May 10, 2006, and the final hearing for approval of the settlement is scheduled for
November 1, 2006 (see note 33). The hearing on plaintiffs' motion for class certification of the Direct
U.S. Purchaser Class took place on May 17, 2006. On June 5, 2006, the Court issued an order certifying a
direct purchaser class. As of September 30, 2006, the deadline for any objections to the settlements and for
any individual class members to elect to opt-out of the class and settlements was October 3, 2006.
On April 28, 2006, Unisys Corporation filed a complaint against Infineon and its principal
U.S. subsidiary, among other DRAM suppliers, alleging state and federal claims for price fixing and seeking
recovery as both a direct and indirect purchaser of DRAM. Unisys subsequently filed a consolidated
complaint with another plaintiff Sun Microsystems, Inc., naming Infineon and its U.S. subsidiary as
defendants only as to the claims by Unisys, and not the claims by Sun, with which Infineon reached a
settlement agreement in the financial year 2004/2005. On May 5, 2006, Honeywell International, Inc. filed a
complaint against Infineon and its U.S. subsidiary, among other DRAM suppliers, alleging a claim for price
fixing under federal law, and seeking recovery as a direct purchaser of DRAM. Infineon and its principal
U.S. subsidiary have agreed to accept service of the Honeywell complaint. Infineon's principal U.S. subsidiary
was served with the Unisys complaint on September 8, 2006. Infineon agreed to waive service in exchange for
an extended response date of December 5, 2006 for both Infineon entities. Both of these complaints were filed
in the Northern District of California, and have been related to the MDL described above. Both Unisys and
Honey well opted out of the Direct U.S. Purchaser Class and settlement, so their claims are not barred by
Infineon's settlement with the Direct U.S. Purchaser Class.
Sixty-four additional cases were filed between August 2, 2002 and October 12, 2005 in numerous federal
and state courts throughout the United States of America. Each of these state and federal cases (except a case
filed in the U.S. District Court for the Eastern District of Pennsylvania in May 2005 on behalf of foreign
purchasers) purports to be on behalf of a class of individuals and entities who indirectly purchased DRAM in
the United States of America during specified time periods commencing in or after 1999. The Eastern District
of Pennsylvania case purporting to be on behalf of a class of foreign individuals and entities who directly
purchased DRAM outside of the United States of America from July 1999 through at least June 2002, was
dismissed with prejudice and without leave to amend on March 1, 2006. Plaintiffs in that case have filed a
notice of appeal. On July 31, 2006, Plaintiffs filed their opening brief on appeal, and defendants filed their
joint opening brief on September 20. No hearing date has yet been scheduled for the appeal. Infineon intends
to defend itself vigorously if the court of appeals remands this lawsuit, The complaints variously allege
violations of the Sherman Act, California's Cartwright Act, various other state laws, unfair competition law
and unjust enrichment and seek treble damages in generally unspecified amounts, restitution, costs, attorneys'
fees and an injunction against the allegedly unlawful conduct. The California state cases were ordered
transferred for coordinated and consolidated pre-trial proceedings to the San Francisco County Superior
Court.
Subsequently, twenty-three of the state (outside California) and federal court cases and the U.S. District
Court for the Eastern District of Pennsylvania case were ordered transferred to the U.S. District Court for the
Northern District of California for coordinated and consolidated pre-trial proceedings as part of the MDL
described above. After this transfer, the plaintiffs dismissed two of the transferred cases. Two additional
transferred cases were subsequently remanded back to their relevant state courts. Nineteen of the twenty-three
transferred cases are currently pending in the MDL. Further, the plaintiffs in the indirect purchaser cases
originated outside California which have not been transferred to the MDL have agreed to stay proceedings in
those cases pending resolution of the MDL-proceedings. The defendants have filed two motions for judgment
on the pleadings directed at several of the claims; these motions are pending. After these have been decided
F-53
Global Reports LLC

QIMONDA AG AND SUBSIDIARIES
Notes to the Combined and Consolidated Financial Statements Ì (Continued)
(euro in millions, except where otherwise stated)
the indirect purchaser plaintiffs in the case that is part of the MDL proceedings will have the opportunity to
file any motion for class certification. Infineon is defending against all of these actions vigorously.
On July 13, 2006, the New York state attorney general filed an action in the U.S. District Court for the
Southern District of New York against Infineon, its principal U.S. subsidiary and several other DRAM
manufacturers on behalf of New York governmental entities and New York consumers who purchased
products containing DRAM beginning in 1998. The plaintiffs allege violations of state and federal antitrust
laws arising out of the same allegations of DRAM price-fixing and artificial price inflation practices discussed
above, and seek recovery of actual and treble damages in unspecified amounts, penalties, costs (including
attorneys' fees) and injunctive and other equitable relief. On July 14, 2006, the attorneys general of California,
Alaska, Arizona, Arkansas, Colorado, Delaware, Florida, Hawaii, Idaho, Illinois, Iowa, Louisiana, Maryland,
Massachusetts, Michigan, Minnesota, Mississippi, Nebraska, Nevada, New Mexico, North Dakota, Ohio,
Oklahoma, Oregon, Pennsylvania, South Carolina, Tennessee, Texas, Utah, Vermont, Virginia, Washington,
West Virginia and Wisconsin filed a lawsuit in the U.S. District Court for the Northern District of California
against Infineon, its principal U.S. subsidiary and several other DRAM manufacturers on behalf of
governmental entities, consumers and businesses in each of those states who purchased products containing
DRAM beginning in 1998. On September 8, 2006, the complaint was amended to add claims by the attorneys
general of Kentucky, Maine, New Hampshire, North Carolina, the Northern Mariana Islands and Rhode
Island. This action is based on state and federal law claims relating to the same alleged anticompetitive
practices in the sale of DRAM and plaintiffs seek recovery of actual and treble damages in unspecified
amounts, penalties, costs (including attorneys' fees) and injunctive and other relief. Infineon and its
U.S. subsidiary agreed to accept service of both of these complaints, and, as of September 30, 2006, their
responses were due on October 10, 2006. Infineon and its principal U.S. subsidiary intend to vigorously defend
both of these actions.
In April 2003, Infineon received a request for information from the European Commission (the
""Commission'') to enable the Commission to assess the compatibility with the Commission's rules on
competition of certain practices of which the Commission has become aware in the European market for
DRAM products. Infineon has reassessed the matter after its plea agreement with the DOJ and made an
accrual during the 2004 financial year for a probable minimum fine that may be imposed as a result of the
Commission's investigation. Any fine actually imposed by the Commission may be significantly higher than
the reserve established, although Infineon cannot more accurately estimate the amount of such actual fine.
Infineon is fully cooperating with the Commission in its investigation.
In May 2004, the Canadian Competition Bureau advised Infineon's principal U.S. subsidiary that it and
its affiliated companies are among the targets of a formal inquiry into alleged violations of the Canadian
Competition Act. No compulsory process (such as subpoenas) has been commenced. Infineon is cooperating
with the Competition Bureau in its inquiry.
Between December 2004 and February 2005, two putative class proceedings were filed in the Canadian
province of Quebec and one was filed in each of Ontario and British Columbia against Infineon, its principal
U.S. subsidiary and other DRAM manufacturers on behalf of all direct and indirect purchasers resident in
Canada who purchased DRAM or products containing DRAM between July 1999 and June 2002, seeking
damages, investigation and administration costs, as well as interest and legal costs. Plaintiffs primarily allege
conspiracy to unduly restrain competition and to illegally fix the price of DRAM. In the British Columbia
action, the certification motion has been scheduled for May 2007. In one Quebec class action, preliminary
motions are to be scheduled early in 2007; the other Quebec action has been stayed pending developments in
the one that is going forward. Infineon intends to defend itself vigorously against these proceedings.
Between September 30, 2004 and November 4, 2004, seven securities class action complaints were filed
against Infineon and three of its current or former officers (of which one officer was subsequently dropped as a
F-54
Global Reports LLC
QIMONDA AG AND SUBSIDIARIES
Notes to the Combined and Consolidated Financial Statements Ì (Continued)
(euro in millions, except where otherwise stated)
defendant) in the U.S. District Courts for the Northern District of California and the Southern District of
New York. The plaintiffs voluntarily dismissed the New York cases, and on June 30, 2005 filed a consolidated
amended complaint in California on behalf of a putative class of purchasers of Infineon's publicly-traded
securities, who purchased them during the period from March 13, 2000 to July 19, 2004, effectively combining
all lawsuits. The consolidated amended complaint added Infineon's principal U.S. subsidiary and four then-
current or former employees of Infineon and its affiliate as defendants. It alleges violations of the
U.S. securities laws and asserts that the defendants made materially false and misleading public statements
about Infineon's historical and projected financial results and competitive position because they did not
disclose Infineon's alleged participation in DRAM price-fixing activities and that, by fixing the price of
DRAM, defendants manipulated the price of Infineon's securities, thereby injuring its shareholders. The
plaintiffs seek unspecified compensatory damages, interest, costs and attorneys' fees. Infineon, its subsidiary
and the current and former Infineon officers filed motions to dismiss the consolidated amended complaint. On
May 22, 2006 the court partially denied and partially granted the motions to dismiss. On June 21, 2006, the
court agreed to permit the Company to move for reconsideration of the May 22, 2006 order. On September 11,
2006, the court granted Infineon's motion for partial reconsideration and dismissed Infineon, its principal
U.S. subsidiary and its current and former officers from the complaint. Infineon believes these claims are
without merit and is vigorously defending itself in this action. Because this action is in its early stages, Infineon
is unable to provide an estimate of the likelihood of an unfavorable outcome to Infineon or of the amount or
range of potential loss arising from the action. If the outcome of this action is unfavorable or if Infineon incurs
substantial legal fees in defending this action, it may have a material adverse effect on the Company's
financial condition and results of operations. Infineon's directors' and officers' insurance carrier has denied
coverage in the class action and Infineon filed suit against the carrier in December 2005 (see note 33).
Liabilities related to legal proceedings are recorded when it is probable that a liability has been incurred
and the associated amount can be reasonably estimated. Where the estimated amount of loss is within a range
of amounts and no amount within the range is a better estimate than any other amount or the range cannot be
estimated, the minimum amount is accrued. As of September 30, 2006, the Company had accrued liabilities
in the amount of 4141 related to the DOJ and European anti-trust investigations and the direct and indirect
purchaser litigation and settlements described above, as well as for legal expenses relating to the other matters
described above. As additional information becomes available, the potential liability related to these matters
will be reassessed and the estimates revised, if necessary. These accrued liabilities would be subject to change
in the future based on new developments in each matter, or changes in circumstances, which could have a
material adverse effect on the Company's results of operations and financial position.
An adverse final resolution of the antitrust investigations or related civil claims or the securities class
action lawsuits described above could result in substantial financial liability to, and other adverse effects upon
the Company, which would have a material adverse effect on its business, results of operations and financial
condition. Irrespective of the validity or the successful assertion of the above referenced claims, the Company
could incur significant costs with respect to defending against or settling such claims, which could have a
material adverse effect on its results of operations and financial position.
The Company is subject to various other lawsuits, legal actions, claims and proceedings related to
products, patents and other matters incidental to its businesses. The Company has accrued a liability for the
estimated costs of adjudication of various asserted and unasserted claims existing as of the balance sheet date.
Based upon information presently known to management, the Company does not believe that the ultimate
resolution of such other pending matters will have a material adverse effect on the Company's financial
position, although the final resolution of such matters could have a material adverse effect on the Company's
results of operations or cash flows in the year of settlement.
F-55
Global Reports LLC
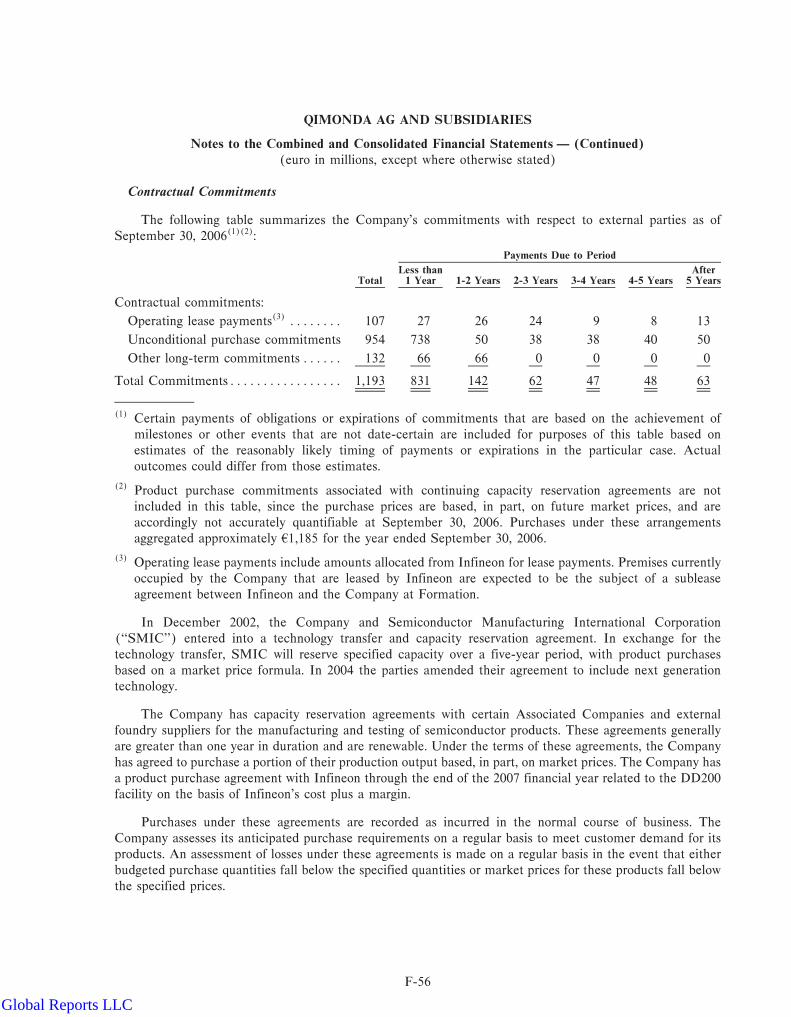
QIMONDA AG AND SUBSIDIARIES
Notes to the Combined and Consolidated Financial Statements Ì (Continued)
(euro in millions, except where otherwise stated)
Contractual Commitments
The following table summarizes the Company's commitments with respect to external parties as of
September 30, 2006(1)(2):
Payments Due to Period
Less than AfterTotal 1 Year 1-2 Years 2-3 Years 3-4 Years 4-5 Years 5 Years
Contractual commitments:
Operating lease payments(3) ÏÏÏÏÏÏÏÏ 107 27 26 24 9 8 13
Unconditional purchase commitments 954 738 50 38 38 40 50
Other long-term commitments ÏÏÏÏÏÏ 132 66 66 0 0 0 0
Total CommitmentsÏÏÏÏÏÏÏÏÏÏÏÏÏÏÏÏÏ 1,193 831 142 62 47 48 63
(1) Certain payments of obligations or expirations of commitments that are based on the achievement of
milestones or other events that are not date-certain are included for purposes of this table based on
estimates of the reasonably likely timing of payments or expirations in the particular case. Actual
outcomes could differ from those estimates.
(2) Product purchase commitments associated with continuing capacity reservation agreements are not
included in this table, since the purchase prices are based, in part, on future market prices, and are
accordingly not accurately quantifiable at September 30, 2006. Purchases under these arrangements
aggregated approximately 41,185 for the year ended September 30, 2006.
(3) Operating lease payments include amounts allocated from Infineon for lease payments. Premises currently
occupied by the Company that are leased by Infineon are expected to be the subject of a sublease
agreement between Infineon and the Company at Formation.
In December 2002, the Company and Semiconductor Manufacturing International Corporation
(""SMIC'') entered into a technology transfer and capacity reservation agreement. In exchange for the
technology transfer, SMIC will reserve specified capacity over a five-year period, with product purchases
based on a market price formula. In 2004 the parties amended their agreement to include next generation
technology.
The Company has capacity reservation agreements with certain Associated Companies and external
foundry suppliers for the manufacturing and testing of semiconductor products. These agreements generally
are greater than one year in duration and are renewable. Under the terms of these agreements, the Company
has agreed to purchase a portion of their production output based, in part, on market prices. The Company has
a product purchase agreement with Infineon through the end of the 2007 financial year related to the DD200
facility on the basis of Infineon's cost plus a margin.
Purchases under these agreements are recorded as incurred in the normal course of business. The
Company assesses its anticipated purchase requirements on a regular basis to meet customer demand for its
products. An assessment of losses under these agreements is made on a regular basis in the event that either
budgeted purchase quantities fall below the specified quantities or market prices for these products fall below
the specified prices.
F-56
Global Reports LLC

QIMONDA AG AND SUBSIDIARIES
Notes to the Combined and Consolidated Financial Statements Ì (Continued)
(euro in millions, except where otherwise stated)
Other Contingencies
The following table summarizes the Company's contingencies with respect to external parties, other than
those related to litigation, as of September 30, 2006(1):
Expirations by Period
Less than AfterTotal 1 Year 1-2 Years 2-3 Years 3-4 Years 4-5 Years 5 Years
Maximum potential future payments:
Guarantees(2) ÏÏÏÏÏÏÏÏÏÏÏÏÏÏÏÏÏÏÏÏÏ 71 Ì 2 7 Ì 9 53
Contingent government grants(3) ÏÏÏÏÏ 452 113 111 18 43 22 145
Total contingencies ÏÏÏÏÏÏÏÏÏÏÏÏÏÏÏÏÏÏ 523 113 113 25 43 31 198
(1) Certain expirations of contingencies that are based on the achievement of milestones or other events that
are not date-certain are included for purposes of this table based on estimates of the reasonably likely
timing of expirations in the particular case. Actual outcomes could differ from those estimates.(2) Guarantees are mainly issued by the parent company for the payment of import duties, rentals of buildings,
contingent obligations related to government grants received. Such guarantees which relate to Qimonda
AG were transferred to the Company as part of the Formation.(3) Contingent government grants refer to amounts previously received, related to the construction and
financing of certain production facilities, which are not otherwise guaranteed and could be refundable if
the total project requirements are not met.
Infineon subsidiaries that were transferred to the Company as part of the Formation have received
government grants and subsidies related to the construction and financing of certain of its production facilities.
These amounts are recognized upon the attainment of specified criteria. Certain of these grants have been
received contingent upon the Company maintaining compliance with certain project-related requirements for
a specified period after receipt. The Company is committed to maintaining these requirements. Nevertheless,
should such requirements not be met, as of September 30, 2006, a maximum of 4452 of these subsidies could
be refundable.
The Company, through certain of its sales and other agreements may, in the normal course of business,
be obligated to indemnify its counterparties under certain conditions for warranties, patent infringement or
other matters. The maximum amount of potential future payments under these types of agreements is not
predictable with any degree of certainty, since the potential obligation is contingent on conditions that may or
may not occur in future, and depends on specific facts and circumstances related to each agreement.
Historically, payments made by the Company under these types of agreements have not had a material
adverse effect on the Company's business, results of operations or financial condition.
The Company has guarantees outstanding to external parties of 471 as of September 30, 2006, that expire
through 2013. Guarantees are mainly issued by Infineon for the payment of import duties, rentals of buildings,
contingent obligations related to government grants received and the consolidated debt of subsidiaries. Such
guarantees which relate to Qimonda AG were transferred to the Company as part of the Formation. The
Company also agreed to indemnify Infineon against any losses it may suffer under several guarantee and
financing arrangements that relate to its business but that cannot be transferred to it for legal, technical or
practical reasons.
F-57
Global Reports LLC

QIMONDA AG AND SUBSIDIARIES
Notes to the Combined and Consolidated Financial Statements Ì (Continued)
(euro in millions, except where otherwise stated)
A tabular reconciliation of the changes in the aggregate product warranty liability for the year ended
September 30, 2006 is as follows:
2006
Balance as of October 1, 2005 ÏÏÏÏÏÏÏÏÏÏÏÏÏÏÏÏÏÏÏÏÏÏÏÏÏÏÏÏÏÏÏÏÏÏÏÏÏÏÏÏÏÏÏÏÏÏÏÏÏÏÏ 1
Accrued during the year, net ÏÏÏÏÏÏÏÏÏÏÏÏÏÏÏÏÏÏÏÏÏÏÏÏÏÏÏÏÏÏÏÏÏÏÏÏÏÏÏÏÏÏÏÏÏÏÏÏÏÏÏÏ 3
Settled during the year ÏÏÏÏÏÏÏÏÏÏÏÏÏÏÏÏÏÏÏÏÏÏÏÏÏÏÏÏÏÏÏÏÏÏÏÏÏÏÏÏÏÏÏÏÏÏÏÏÏÏÏÏÏÏÏÏÏ (3)
Balance as of September 30, 2006ÏÏÏÏÏÏÏÏÏÏÏÏÏÏÏÏÏÏÏÏÏÏÏÏÏÏÏÏÏÏÏÏÏÏÏÏÏÏÏÏÏÏÏÏÏÏÏÏ 1
32. Operating Segment and Geographic Information
The Company has reported its operating segment and geographic information in accordance with
SFAS No. 131, ""Disclosure about Segments of an Enterprise and Related Information''. The accounting
policies applied for segment reporting are substantially the same as described in the summary of significant
accounting policies (see note 2).
The Company's Management Board, consisting of its Chief Executive Officer, Chief Operating Officer
and Chief Financial Officer, has been collectively identified as the Chief Operating Decision Maker
(""CODM''). The CODM makes decisions about resources to be allocated to the business and assesses the
Company's performance on a functional and project basis. Only combined operating results of the Company
are regularly presented to the CODM to make such decisions. Furthermore, the CODM does not evaluate
performance or review asset information by product line on a regular basis, except that the CODM is provided
information regarding certain inventories on a product basis. Accordingly, the Company has one operating
segment, Memory Products, which is also its reportable segment, consistent with the manner in which
financial information is internally reported and used by the CODM for purposes of evaluating business
performance and allocating resources.
The Memory Products segment derives revenue principally from the sale of integrated circuits that have
the capacity to store digital information (memory) which the Company manufactures using its patented
technology.
Prior to the Formation, the Company operated as a segment of Infineon. Following the Formation, the
Company continues to be reported as an operating segment of Infineon, although its operations are contained
in a stand-alone legal entity. Segment information is shown for all periods presented, including periods prior to
the Formation, consistent with the current organization structure.
The following is a summary of net sales and of property, plant and equipment by geographic area for the
years ended September 30:
2004 2005 2006
Net sales:
Germany ÏÏÏÏÏÏÏÏÏÏÏÏÏÏÏÏÏÏÏÏÏÏÏÏÏÏÏÏÏÏÏÏÏÏÏÏÏÏÏÏÏÏÏÏÏÏÏÏÏÏÏ 398 232 316
Other EuropeÏÏÏÏÏÏÏÏÏÏÏÏÏÏÏÏÏÏÏÏÏÏÏÏÏÏÏÏÏÏÏÏÏÏÏÏÏÏÏÏÏÏÏÏÏÏÏÏ 342 332 428
North America ÏÏÏÏÏÏÏÏÏÏÏÏÏÏÏÏÏÏÏÏÏÏÏÏÏÏÏÏÏÏÏÏÏÏÏÏÏÏÏÏÏÏÏÏÏÏ 1,135 1,067 1,591
Asia/PacificÏÏÏÏÏÏÏÏÏÏÏÏÏÏÏÏÏÏÏÏÏÏÏÏÏÏÏÏÏÏÏÏÏÏÏÏÏÏÏÏÏÏÏÏÏÏÏÏÏ 1,001 1,091 1,174
Japan ÏÏÏÏÏÏÏÏÏÏÏÏÏÏÏÏÏÏÏÏÏÏÏÏÏÏÏÏÏÏÏÏÏÏÏÏÏÏÏÏÏÏÏÏÏÏÏÏÏÏÏÏÏÏ 131 102 252
Other ÏÏÏÏÏÏÏÏÏÏÏÏÏÏÏÏÏÏÏÏÏÏÏÏÏÏÏÏÏÏÏÏÏÏÏÏÏÏÏÏÏÏÏÏÏÏÏÏÏÏÏÏÏÏ 1 1 54
Total ÏÏÏÏÏÏÏÏÏÏÏÏÏÏÏÏÏÏÏÏÏÏÏÏÏÏÏÏÏÏÏÏÏÏÏÏÏÏÏÏÏÏÏÏÏÏÏÏÏÏÏÏÏÏÏÏÏ 3,008 2,825 3,815
F-58
Global Reports LLC

QIMONDA AG AND SUBSIDIARIES
Notes to the Combined and Consolidated Financial Statements Ì (Continued)
(euro in millions, except where otherwise stated)
2005 2006
Property, plant and equipment:
Germany ÏÏÏÏÏÏÏÏÏÏÏÏÏÏÏÏÏÏÏÏÏÏÏÏÏÏÏÏÏÏÏÏÏÏÏÏÏÏÏÏÏÏÏÏÏÏÏÏÏÏÏÏÏÏÏÏÏÏÏ 804 654
Other Europe ÏÏÏÏÏÏÏÏÏÏÏÏÏÏÏÏÏÏÏÏÏÏÏÏÏÏÏÏÏÏÏÏÏÏÏÏÏÏÏÏÏÏÏÏÏÏÏÏÏÏÏÏÏÏÏ 175 144
North AmericaÏÏÏÏÏÏÏÏÏÏÏÏÏÏÏÏÏÏÏÏÏÏÏÏÏÏÏÏÏÏÏÏÏÏÏÏÏÏÏÏÏÏÏÏÏÏÏÏÏÏÏÏÏÏ 1,082 1,100
Asia/Pacific ÏÏÏÏÏÏÏÏÏÏÏÏÏÏÏÏÏÏÏÏÏÏÏÏÏÏÏÏÏÏÏÏÏÏÏÏÏÏÏÏÏÏÏÏÏÏÏÏÏÏÏÏÏÏÏÏ 155 182
Total ÏÏÏÏÏÏÏÏÏÏÏÏÏÏÏÏÏÏÏÏÏÏÏÏÏÏÏÏÏÏÏÏÏÏÏÏÏÏÏÏÏÏÏÏÏÏÏÏÏÏÏÏÏÏÏÏÏÏÏÏÏÏÏÏ 2,216 2,080
Revenues from external customers are based on the customers' billing location.
The Company defines EBIT as earnings (loss) before interest and taxes. The Company's management
uses EBIT, among other measures, to establish budgets and operational goals, to manage the combined and
consolidated Company's business and to evaluate and report performance as part of the Infineon Group.
Because many operating decisions, such as allocations of resources to individual projects, are made on a basis
for which the effects of financing the overall business and of taxation are of marginal relevance, management
finds a metric that excludes the effects of interest on financing and tax expense useful. In addition, in
measuring operating performance, particularly for the purpose of making internal decisions, such as those
relating to personnel matters, it is useful for management to consider a measure that excludes items over
which the individuals being evaluated have minimal control, such as enterprise-level taxation and financing.
The Company reports EBIT information because it believes that it provides investors with meaningful
information about the operating performance of the Company in a manner similar to that which management
uses to assess and direct the business. EBIT is not a substitute for net income, however, because the exclusion
of interest and tax expense is not appropriate when reviewing the overall profitability of the Company.
EBIT is determined as follows from the combined and consolidated statements of operations, without
adjustment to the U.S. GAAP amounts presented:
2004 2005 2006
Net (loss) income ÏÏÏÏÏÏÏÏÏÏÏÏÏÏÏÏÏÏÏÏÏÏÏÏÏÏÏÏÏÏÏÏÏÏÏÏÏÏÏÏÏÏÏÏÏÏÏÏÏ (79) 18 74
Adjust: Income tax expenseÏÏÏÏÏÏÏÏÏÏÏÏÏÏÏÏÏÏÏÏÏÏÏÏÏÏÏÏÏÏÏÏÏÏÏÏÏÏÏÏ 211 86 114
Interest expense, net ÏÏÏÏÏÏÏÏÏÏÏÏÏÏÏÏÏÏÏÏÏÏÏÏÏÏÏÏÏÏÏÏÏÏÏÏÏÏÏ 30 7 25
EBIT ÏÏÏÏÏÏÏÏÏÏÏÏÏÏÏÏÏÏÏÏÏÏÏÏÏÏÏÏÏÏÏÏÏÏÏÏÏÏÏÏÏÏÏÏÏÏÏÏÏÏÏÏÏÏÏÏÏÏÏÏ 162 111 213
The above EBIT results differ from the Memory Products segment results previously reported by
Infineon, primarily due to allocations of Infineon corporate expenses (reported by Infineon as part of its
Corporate and Reconciliation segment), since they arise from corporate directed decisions not within the
direct control of segment management, which have been reallocated to the Company for purposes of preparing
the accompanying combined and consolidated financial statements on a stand-alone basis.
33. Subsequent Events
On October 10, 2006 Infineon joined the other defendants in fling motions to dismiss several of the
claims alleged in the two actions filed by the state attorneys general. On October 23, 2006 the New York case
was made part of the MDL proceedings.
On October 11, 2006 the plaintiffs in the securities class action filed an amended complaint within the
period set by the court.
F-59
Global Reports LLC
QIMONDA AG AND SUBSIDIARIES
Notes to the Combined and Consolidated Financial Statements Ì (Continued)
(euro in millions, except where otherwise stated)
On October 3, 2006 a number of individuals and entities gave notice that they were opting out of the
Direct U.S. Purchaser Class and settlements. However, apart from Unisys Corporation and Honeywell
International, Inc., none of the other opt-outs has filed suit against Infineon. On November 1, 2006 the
District Court for the Northern District of California approved the settlement with the Direct U.S. Purchaser
Class.
During October 2006, the Taiwanese authorities granted an exemption to Infineon to transfer the shares,
which is expected to be finalized during the three months ending December 31, 2006.
On November 13, 2006 the Company sold its investment in Ramtron through a private placement. As a
result of the sale, the company expects to record a gain of 43 during the three months ending December 31,
2006.
On November 13, 2006, Infineon's lawsuit against the insurance carrier of its directors' and officers'
insurance, which has denied coverage in the securities class action, was dismissed. Infineon intends to file an
appeal against this dismissal.
F-60
Global Reports LLC

/s/ KPMG Certified Public Accountants
F-61
Global Reports LLC

F-62
INO
TER
A M
EM
OR
IES, IN
C.
Bala
nce
Shee
ts
Dec
ember
31, 2004 a
nd 2
005
(Expre
ssed
in thousa
nds
of N
ew T
aiw
an D
ollars
and U
.S. D
ollars
)
2004
2005
NTD
NTD
USD
Ass
ets
Curr
ent ass
ets:
Cas
h a
nd c
ash e
quiv
alen
ts (
note
5)ÏÏÏÏÏÏÏÏÏÏÏÏÏÏÏÏÏÏÏÏÏÏÏÏÏÏÏÏÏÏÏÏÏÏÏÏÏÏÏÏÏÏÏÏÏÏÏÏÏÏÏÏÏÏÏÏÏÏÏÏÏÏÏÏÏÏÏÏÏÏÏÏÏ
$9,9
80,1
89
9,8
22,5
68
299,4
69
Acc
ounts r
ecei
vable
rel
ated
par
ties
(note
17)
ÏÏÏÏÏÏÏÏÏÏÏÏÏÏÏÏÏÏÏÏÏÏÏÏÏÏÏÏÏÏÏÏÏÏÏÏÏÏÏÏÏÏÏÏÏÏÏÏÏÏÏÏÏÏÏÏÏÏÏÏÏÏÏÏ
2,5
89,5
03
5,0
50,2
77
153,9
72
Oth
er r
ecei
vable
s (note
7 a
nd 1
6)ÏÏÏÏÏÏÏÏÏÏÏÏÏÏÏÏÏÏÏÏÏÏÏÏÏÏÏÏÏÏÏÏÏÏÏÏÏÏÏÏÏÏÏÏÏÏÏÏÏÏÏÏÏÏÏÏÏÏÏÏÏÏÏÏÏÏÏÏÏÏÏÏÏÏ
160,2
83
1,3
22,1
21
40,3
09
Inve
nto
ries
, net
(note
6)ÏÏÏÏÏÏÏÏÏÏÏÏÏÏÏÏÏÏÏÏÏÏÏÏÏÏÏÏÏÏÏÏÏÏÏÏÏÏÏÏÏÏÏÏÏÏÏÏÏÏÏÏÏÏÏÏÏÏÏÏÏÏÏÏÏÏÏÏÏÏÏÏÏÏÏÏÏÏÏÏÏÏ
2,1
27,5
30
3,4
85,5
85
106,2
68
Curr
ent portio
n o
f le
ase
rece
ivab
les
(note
7)ÏÏÏÏÏÏÏÏÏÏÏÏÏÏÏÏÏÏÏÏÏÏÏÏÏÏÏÏÏÏÏÏÏÏÏÏÏÏÏÏÏÏÏÏÏÏÏÏÏÏÏÏÏÏÏÏÏÏÏÏÏÏÏÏÏ
Ì6,6
90
204
Pre
pay
men
ts a
nd o
ther
curren
t as
sets
ÏÏÏÏÏÏÏÏÏÏÏÏÏÏÏÏÏÏÏÏÏÏÏÏÏÏÏÏÏÏÏÏÏÏÏÏÏÏÏÏÏÏÏÏÏÏÏÏÏÏÏÏÏÏÏÏÏÏÏÏÏÏÏÏÏÏÏÏÏÏÏ
1,0
11,7
42
616,6
93
18,8
02
Def
erre
d inco
me
tax a
sset
sÌ
curren
t, n
et (
note
13)
ÏÏÏÏÏÏÏÏÏÏÏÏÏÏÏÏÏÏÏÏÏÏÏÏÏÏÏÏÏÏÏÏÏÏÏÏÏÏÏÏÏÏÏÏÏÏÏÏÏÏÏÏÏÏÏÏÏÏ
12,1
63
36,4
05
1,1
10
Tota
l cu
rren
t ass
etsÏÏÏÏÏÏÏÏÏÏÏÏÏÏÏÏÏÏÏÏÏÏÏÏÏÏÏÏÏÏÏÏÏÏÏÏÏÏÏÏÏÏÏÏÏÏÏÏÏÏÏÏÏÏÏÏÏÏÏÏÏÏÏÏÏÏÏÏÏÏÏÏÏÏÏÏÏÏÏÏ
15,8
81,4
10
20,3
40,3
39
620,1
34
Pro
per
ty, pla
nt and e
quip
men
t (note
s 7, 8, 9, 11 a
nd 1
7)
Lan
dÏÏÏÏÏÏÏÏÏÏÏÏÏÏÏÏÏÏÏÏÏÏÏÏÏÏÏÏÏÏÏÏÏÏÏÏÏÏÏÏÏÏÏÏÏÏÏÏÏÏÏÏÏÏÏÏÏÏÏÏÏÏÏÏÏÏÏÏÏÏÏÏÏÏÏÏÏÏÏÏÏÏÏÏÏÏÏÏÏÏÏÏÏÏÏÏÏÏ
1,2
25,4
59
2,8
01,4
67
85,4
11
Buildin
gs
and s
truct
ure
sÏÏÏÏÏÏÏÏÏÏÏÏÏÏÏÏÏÏÏÏÏÏÏÏÏÏÏÏÏÏÏÏÏÏÏÏÏÏÏÏÏÏÏÏÏÏÏÏÏÏÏÏÏÏÏÏÏÏÏÏÏÏÏÏÏÏÏÏÏÏÏÏÏÏÏÏÏÏÏÏÏÏ
2,3
74,7
83
2,4
24,5
71
73,9
20
Mac
hin
ery
and e
quip
men
tÏÏÏÏÏÏÏÏÏÏÏÏÏÏÏÏÏÏÏÏÏÏÏÏÏÏÏÏÏÏÏÏÏÏÏÏÏÏÏÏÏÏÏÏÏÏÏÏÏÏÏÏÏÏÏÏÏÏÏÏÏÏÏÏÏÏÏÏÏÏÏÏÏÏÏÏÏÏÏÏÏ
26,5
46,4
87
59,6
69,4
47
1,8
19,1
90
Veh
icle
sÏÏÏÏÏÏÏÏÏÏÏÏÏÏÏÏÏÏÏÏÏÏÏÏÏÏÏÏÏÏÏÏÏÏÏÏÏÏÏÏÏÏÏÏÏÏÏÏÏÏÏÏÏÏÏÏÏÏÏÏÏÏÏÏÏÏÏÏÏÏÏÏÏÏÏÏÏÏÏÏÏÏÏÏÏÏÏÏÏÏÏÏÏÏÏÏ
2,9
13
2,9
13
89
Lea
sed a
sset
sÏÏÏÏÏÏÏÏÏÏÏÏÏÏÏÏÏÏÏÏÏÏÏÏÏÏÏÏÏÏÏÏÏÏÏÏÏÏÏÏÏÏÏÏÏÏÏÏÏÏÏÏÏÏÏÏÏÏÏÏÏÏÏÏÏÏÏÏÏÏÏÏÏÏÏÏÏÏÏÏÏÏÏÏÏÏÏÏÏÏÏ
Ì135,9
96
4,1
46
Misce
llan
eous
equip
men
tÏÏÏÏÏÏÏÏÏÏÏÏÏÏÏÏÏÏÏÏÏÏÏÏÏÏÏÏÏÏÏÏÏÏÏÏÏÏÏÏÏÏÏÏÏÏÏÏÏÏÏÏÏÏÏÏÏÏÏÏÏÏÏÏÏÏÏÏÏÏÏÏÏÏÏÏÏÏÏÏÏ
5,0
87,0
28
6,4
65,6
76
197,1
24
35,2
36,6
70
71,5
00,0
70
2,1
79,8
80
Les
s: a
ccum
ula
ted d
epre
ciat
ion
ÏÏÏÏÏÏÏÏÏÏÏÏÏÏÏÏÏÏÏÏÏÏÏÏÏÏÏÏÏÏÏÏÏÏÏÏÏÏÏÏÏÏÏÏÏÏÏÏÏÏÏÏÏÏÏÏÏÏÏÏÏÏÏÏÏÏÏÏÏÏÏÏÏÏÏÏ
(2,0
42,5
36)
(10,1
30,6
31)
(308,8
61)
Constru
ctio
n in p
rogre
ssÏÏÏÏÏÏÏÏÏÏÏÏÏÏÏÏÏÏÏÏÏÏÏÏÏÏÏÏÏÏÏÏÏÏÏÏÏÏÏÏÏÏÏÏÏÏÏÏÏÏÏÏÏÏÏÏÏÏÏÏÏÏÏÏÏÏÏÏÏÏÏÏÏÏÏÏÏÏÏÏÏÏ
18,3
49,4
18
4,7
70,6
03
145,4
45
Pre
pay
men
t on lan
d p
urc
has
eÏÏÏÏÏÏÏÏÏÏÏÏÏÏÏÏÏÏÏÏÏÏÏÏÏÏÏÏÏÏÏÏÏÏÏÏÏÏÏÏÏÏÏÏÏÏÏÏÏÏÏÏÏÏÏÏÏÏÏÏÏÏÏÏÏÏÏÏÏÏÏÏÏÏÏÏÏÏ
Ì22,7
72
694
Net
pro
per
ty, pla
nt and e
quip
men
tÏÏÏÏÏÏÏÏÏÏÏÏÏÏÏÏÏÏÏÏÏÏÏÏÏÏÏÏÏÏÏÏÏÏÏÏÏÏÏÏÏÏÏÏÏÏÏÏÏÏÏÏÏÏÏÏÏÏÏÏÏÏÏÏÏÏÏ
51,5
43,5
52
66,1
62,8
14
2,0
17,1
58
Oth
er a
sset
s:
Ref
undab
le d
eposits
ÏÏÏÏÏÏÏÏÏÏÏÏÏÏÏÏÏÏÏÏÏÏÏÏÏÏÏÏÏÏÏÏÏÏÏÏÏÏÏÏÏÏÏÏÏÏÏÏÏÏÏÏÏÏÏÏÏÏÏÏÏÏÏÏÏÏÏÏÏÏÏÏÏÏÏÏÏÏÏÏÏÏÏÏÏÏ
46,6
61
28,5
44
870
Def
erre
d c
har
ges
ÏÏÏÏÏÏÏÏÏÏÏÏÏÏÏÏÏÏÏÏÏÏÏÏÏÏÏÏÏÏÏÏÏÏÏÏÏÏÏÏÏÏÏÏÏÏÏÏÏÏÏÏÏÏÏÏÏÏÏÏÏÏÏÏÏÏÏÏÏÏÏÏÏÏÏÏÏÏÏÏÏÏÏÏÏÏÏÏ
118,2
83
134,8
46
4,1
11
Lea
se r
ecei
vable
s lo
ng-ter
m (
note
7)
ÏÏÏÏÏÏÏÏÏÏÏÏÏÏÏÏÏÏÏÏÏÏÏÏÏÏÏÏÏÏÏÏÏÏÏÏÏÏÏÏÏÏÏÏÏÏÏÏÏÏÏÏÏÏÏÏÏÏÏÏÏÏÏÏÏÏÏÏÏÏÏ
Ì338,7
88
10,3
29
Def
erre
d inco
me
tax a
sset
sÌ
non-c
urren
t, n
et (
note
13)
ÏÏÏÏÏÏÏÏÏÏÏÏÏÏÏÏÏÏÏÏÏÏÏÏÏÏÏÏÏÏÏÏÏÏÏÏÏÏÏÏÏÏÏÏÏÏÏÏÏÏÏÏÏÏ
562,1
98
352,7
58
10,7
55
Tota
l oth
er a
sset
sÏÏÏÏÏÏÏÏÏÏÏÏÏÏÏÏÏÏÏÏÏÏÏÏÏÏÏÏÏÏÏÏÏÏÏÏÏÏÏÏÏÏÏÏÏÏÏÏÏÏÏÏÏÏÏÏÏÏÏÏÏÏÏÏÏÏÏÏÏÏÏÏÏÏÏÏÏÏÏÏÏ
727,1
42
854,9
36
26,0
65
Tota
l ass
etsÏ
ÏÏÏÏÏÏÏÏÏÏÏÏÏÏÏÏÏÏÏÏÏÏÏÏÏÏÏÏÏÏÏÏÏÏÏÏÏÏÏÏÏÏÏÏÏÏÏÏÏÏÏÏÏÏÏÏÏÏÏÏÏÏÏÏÏÏÏÏÏÏÏÏÏÏÏÏÏÏÏÏÏÏÏÏÏÏÏÏÏÏÏÏÏÏ
$68,1
52,1
04
87,3
58,0
89
2,6
63,3
57
Global Reports LLC

F-63
INO
TER
A M
EM
OR
IES, IN
C.
Bala
nce
Shee
tsÌ
(C
ontinued
)
Dec
ember
31, 2004 a
nd 2
005
(Expre
ssed
in thousa
nds
of N
ew T
aiw
an D
ollars
and U
.S. D
ollars
)
2004
2005
NTD
NTD
USD
Lia
bilitie
s and S
tock
hold
ers' E
quity
Curr
ent liabilitie
s:Short-ter
m loan
s (note
10)ÏÏÏÏÏÏÏÏÏÏÏÏÏÏÏÏÏÏÏÏÏÏÏÏÏÏÏÏÏÏÏÏÏÏÏÏÏÏÏÏÏÏÏÏÏÏÏÏÏÏÏÏÏÏÏÏÏÏÏÏÏÏÏÏÏÏÏÏÏÏÏÏÏÏÏÏÏÏÏÏ
$2,4
81,5
00
2,3
23,3
00
70,8
32
Acc
ounts p
ayab
leÏÏÏÏÏÏÏÏÏÏÏÏÏÏÏÏÏÏÏÏÏÏÏÏÏÏÏÏÏÏÏÏÏÏÏÏÏÏÏÏÏÏÏÏÏÏÏÏÏÏÏÏÏÏÏÏÏÏÏÏÏÏÏÏÏÏÏÏÏÏÏÏÏÏÏÏÏÏÏÏÏÏÏÏÏÏÏÏ
8,6
40,1
25
4,0
10,0
66
122,2
58
Acc
ounts p
ayab
leÌ
rela
ted p
arties
(note
17)
ÏÏÏÏÏÏÏÏÏÏÏÏÏÏÏÏÏÏÏÏÏÏÏÏÏÏÏÏÏÏÏÏÏÏÏÏÏÏÏÏÏÏÏÏÏÏÏÏÏÏÏÏÏÏÏÏÏÏÏÏÏÏÏÏ
131,0
39
55,2
12
1,6
83
Inco
me
tax p
ayab
leÏÏÏÏÏÏÏÏÏÏÏÏÏÏÏÏÏÏÏÏÏÏÏÏÏÏÏÏÏÏÏÏÏÏÏÏÏÏÏÏÏÏÏÏÏÏÏÏÏÏÏÏÏÏÏÏÏÏÏÏÏÏÏÏÏÏÏÏÏÏÏÏÏÏÏÏÏÏÏÏÏÏÏÏÏÏ
Ì124,3
02
3,7
90
Acc
rued
expen
ses
(note
s 12 a
nd 1
6)ÏÏÏÏÏÏÏÏÏÏÏÏÏÏÏÏÏÏÏÏÏÏÏÏÏÏÏÏÏÏÏÏÏÏÏÏÏÏÏÏÏÏÏÏÏÏÏÏÏÏÏÏÏÏÏÏÏÏÏÏÏÏÏÏÏÏÏÏÏÏÏÏ
450,8
56
855,8
16
26,0
92
Oth
er p
ayab
lesÌ
rela
ted p
arties
(note
17)
ÏÏÏÏÏÏÏÏÏÏÏÏÏÏÏÏÏÏÏÏÏÏÏÏÏÏÏÏÏÏÏÏÏÏÏÏÏÏÏÏÏÏÏÏÏÏÏÏÏÏÏÏÏÏÏÏÏÏÏÏÏÏÏÏÏÏ
284,5
21
86,2
53
2,6
30
Curr
ent portio
n o
f lo
ng-ter
m loan
s (note
11)ÏÏÏÏÏÏÏÏÏÏÏÏÏÏÏÏÏÏÏÏÏÏÏÏÏÏÏÏÏÏÏÏÏÏÏÏÏÏÏÏÏÏÏÏÏÏÏÏÏÏÏÏÏÏÏÏÏÏÏÏÏÏÏÏÏ
Ì6,4
31,6
36
196,0
86
Curr
ent portio
n o
f le
ase
pay
able
s (note
9)ÏÏÏÏÏÏÏÏÏÏÏÏÏÏÏÏÏÏÏÏÏÏÏÏÏÏÏÏÏÏÏÏÏÏÏÏÏÏÏÏÏÏÏÏÏÏÏÏÏÏÏÏÏÏÏÏÏÏÏÏÏÏÏÏÏÏÏ
Ì3,3
90
103
Oth
er c
urr
ent liab
ilitie
sÏÏÏÏÏÏÏÏÏÏÏÏÏÏÏÏÏÏÏÏÏÏÏÏÏÏÏÏÏÏÏÏÏÏÏÏÏÏÏÏÏÏÏÏÏÏÏÏÏÏÏÏÏÏÏÏÏÏÏÏÏÏÏÏÏÏÏÏÏÏÏÏÏÏÏÏÏÏÏÏÏÏÏ
8,7
59
14,0
14
427
Tota
l cu
rren
t liabilitie
sÏÏÏÏÏÏÏÏÏÏÏÏÏÏÏÏÏÏÏÏÏÏÏÏÏÏÏÏÏÏÏÏÏÏÏÏÏÏÏÏÏÏÏÏÏÏÏÏÏÏÏÏÏÏÏÏÏÏÏÏÏÏÏÏÏÏÏÏÏÏÏÏÏÏÏÏÏ
11,9
96,8
00
13,9
03,9
89
423,9
01
Long-t
erm
lia
bilitie
s:Long-ter
m loan
s (note
11)
ÏÏÏÏÏÏÏÏÏÏÏÏÏÏÏÏÏÏÏÏÏÏÏÏÏÏÏÏÏÏÏÏÏÏÏÏÏÏÏÏÏÏÏÏÏÏÏÏÏÏÏÏÏÏÏÏÏÏÏÏÏÏÏÏÏÏÏÏÏÏÏÏÏÏÏÏÏÏÏÏ
14,6
81,8
20
26,0
34,5
64
793,7
37
Lea
se p
ayab
lesÌ
long-ter
m (
note
9)
ÏÏÏÏÏÏÏÏÏÏÏÏÏÏÏÏÏÏÏÏÏÏÏÏÏÏÏÏÏÏÏÏÏÏÏÏÏÏÏÏÏÏÏÏÏÏÏÏÏÏÏÏÏÏÏÏÏÏÏÏÏÏÏÏÏÏÏÏÏÏÏ
Ì130,9
67
3,9
93
Tota
l lo
ng-t
erm
lia
bilitie
sÏÏÏÏÏÏÏÏÏÏÏÏÏÏÏÏÏÏÏÏÏÏÏÏÏÏÏÏÏÏÏÏÏÏÏÏÏÏÏÏÏÏÏÏÏÏÏÏÏÏÏÏÏÏÏÏÏÏÏÏÏÏÏÏÏÏÏÏÏÏÏÏÏÏÏ
14,6
81,8
20
26,1
65,5
31
797,7
30
Oth
er lia
bilitie
s:A
ccru
ed p
ension lia
bilitie
s (note
12)ÏÏÏÏÏÏÏÏÏÏÏÏÏÏÏÏÏÏÏÏÏÏÏÏÏÏÏÏÏÏÏÏÏÏÏÏÏÏÏÏÏÏÏÏÏÏÏÏÏÏÏÏÏÏÏÏÏÏÏÏÏÏÏÏÏÏÏÏÏÏÏÏ
30,7
55
50,5
94
1,5
43
Guar
ante
e dep
osits
ÏÏÏÏÏÏÏÏÏÏÏÏÏÏÏÏÏÏÏÏÏÏÏÏÏÏÏÏÏÏÏÏÏÏÏÏÏÏÏÏÏÏÏÏÏÏÏÏÏÏÏÏÏÏÏÏÏÏÏÏÏÏÏÏÏÏÏÏÏÏÏÏÏÏÏÏÏÏÏÏÏÏÏÏÏÏÏ
577
1,6
91
52
Tota
l oth
er lia
bilitie
sÏÏÏÏÏÏÏÏÏÏÏÏÏÏÏÏÏÏÏÏÏÏÏÏÏÏÏÏÏÏÏÏÏÏÏÏÏÏÏÏÏÏÏÏÏÏÏÏÏÏÏÏÏÏÏÏÏÏÏÏÏÏÏÏÏÏÏÏÏÏÏÏÏÏÏÏÏÏ
31,3
32
52,2
85
1,5
95
Tota
l liabilitie
sÏÏÏÏÏÏÏÏÏÏÏÏÏÏÏÏÏÏÏÏÏÏÏÏÏÏÏÏÏÏÏÏÏÏÏÏÏÏÏÏÏÏÏÏÏÏÏÏÏÏÏÏÏÏÏÏÏÏÏÏÏÏÏÏÏÏÏÏÏÏÏÏÏÏÏÏÏÏÏÏÏÏÏÏ
26,7
09,9
52
40,1
21,8
05
1,2
23,2
26
Sto
ckhold
ers' e
quity
(note
14):
Com
mon s
tock
ÏÏÏÏÏÏÏÏÏÏÏÏÏÏÏÏÏÏÏÏÏÏÏÏÏÏÏÏÏÏÏÏÏÏÏÏÏÏÏÏÏÏÏÏÏÏÏÏÏÏÏÏÏÏÏÏÏÏÏÏÏÏÏÏÏÏÏÏÏÏÏÏÏÏÏÏÏÏÏÏÏÏÏÏÏÏÏÏÏÏ
24,9
76,6
00
25,1
09,5
40
765,5
35
Cap
ital
surp
lus
ÏÏÏÏÏÏÏÏÏÏÏÏÏÏÏÏÏÏÏÏÏÏÏÏÏÏÏÏÏÏÏÏÏÏÏÏÏÏÏÏÏÏÏÏÏÏÏÏÏÏÏÏÏÏÏÏÏÏÏÏÏÏÏÏÏÏÏÏÏÏÏÏÏÏÏÏÏÏÏÏÏÏÏÏÏÏÏÏÏÏ
15,5
48,6
60
15,5
48,6
60
474,0
45
Leg
al r
eser
veÏÏÏÏÏÏÏÏÏÏÏÏÏÏÏÏÏÏÏÏÏÏÏÏÏÏÏÏÏÏÏÏÏÏÏÏÏÏÏÏÏÏÏÏÏÏÏÏÏÏÏÏÏÏÏÏÏÏÏÏÏÏÏÏÏÏÏÏÏÏÏÏÏÏÏÏÏÏÏÏÏÏÏÏÏÏÏÏÏÏÏÏ
1,5
59
91,6
89
2,7
95
Spec
ial re
serv
eÏÏÏÏÏÏÏÏÏÏÏÏÏÏÏÏÏÏÏÏÏÏÏÏÏÏÏÏÏÏÏÏÏÏÏÏÏÏÏÏÏÏÏÏÏÏÏÏÏÏÏÏÏÏÏÏÏÏÏÏÏÏÏÏÏÏÏÏÏÏÏÏÏÏÏÏÏÏÏÏÏÏÏÏÏÏÏÏÏÏ
Ì542,6
05
16,5
43
Ret
ained
ear
nin
gsÏÏÏÏÏÏÏÏÏÏÏÏÏÏÏÏÏÏÏÏÏÏÏÏÏÏÏÏÏÏÏÏÏÏÏÏÏÏÏÏÏÏÏÏÏÏÏÏÏÏÏÏÏÏÏÏÏÏÏÏÏÏÏÏÏÏÏÏÏÏÏÏÏÏÏÏÏÏÏÏÏÏÏÏÏÏÏÏ
915,3
33
5,9
43,7
90
181,2
13
Tota
l st
ock
hold
ers' e
quity
ÏÏÏÏÏÏÏÏÏÏÏÏÏÏÏÏÏÏÏÏÏÏÏÏÏÏÏÏÏÏÏÏÏÏÏÏÏÏÏÏÏÏÏÏÏÏÏÏÏÏÏÏÏÏÏÏÏÏÏÏÏÏÏÏÏÏÏÏÏÏÏÏÏÏ
41,4
42,1
52
47,2
36,2
84
1,4
40,1
31
Com
mitm
ents
and c
ontingen
cies
(note
19)
Tota
l liabilitie
s and s
tock
hold
ers' e
quity
ÏÏÏÏÏÏÏÏÏÏÏÏÏÏÏÏÏÏÏÏÏÏÏÏÏÏÏÏÏÏÏÏÏÏÏÏÏÏÏÏÏÏÏÏÏÏÏÏÏÏÏÏÏÏÏÏÏÏÏÏÏÏÏÏÏÏÏÏÏÏ
$68,1
52,1
04
87,3
58,0
89
2,6
63,3
57
See
acc
om
pan
ying n
ote
s to
fin
anci
al s
tate
men
ts.
Global Reports LLC

INOTERA MEMORIES, INC.
Statements of Income
For the years ended December 31, 2004 and 2005
(Expressed in thousands of New Taiwan Dollars and U.S. Dollars except for earnings per share)
2004 2005
NTD NTD USD
Operating revenues (note 17)
Sales revenueÏÏÏÏÏÏÏÏÏÏÏÏÏÏÏÏÏÏÏÏÏÏÏÏÏÏÏÏÏÏÏÏÏÏÏÏÏÏÏÏÏÏ $ 5,961,954 23,044,929 702,589
Sales returns ÏÏÏÏÏÏÏÏÏÏÏÏÏÏÏÏÏÏÏÏÏÏÏÏÏÏÏÏÏÏÏÏÏÏÏÏÏÏÏÏÏÏ (161) (3,133) (96)
Sales allowances ÏÏÏÏÏÏÏÏÏÏÏÏÏÏÏÏÏÏÏÏÏÏÏÏÏÏÏÏÏÏÏÏÏÏÏÏÏÏÏ (963) (9,593) (292)
Net operating revenuesÏÏÏÏÏÏÏÏÏÏÏÏÏÏÏÏÏÏÏÏÏÏÏÏÏÏÏÏÏÏÏÏ 5,960,830 23,032,203 702,201
Cost of goods sold (notes 17 and 22)ÏÏÏÏÏÏÏÏÏÏÏÏÏÏÏÏÏÏÏÏÏÏÏ (3,912,658) (16,350,746) (498,498)
Gross profit ÏÏÏÏÏÏÏÏÏÏÏÏÏÏÏÏÏÏÏÏÏÏÏÏÏÏÏÏÏÏÏÏÏÏÏÏÏÏÏÏÏÏÏÏÏ 2,048,172 6,681,457 203,703
Operating expenses (notes 17 and 22):
Administrative and general expenses ÏÏÏÏÏÏÏÏÏÏÏÏÏÏÏÏÏÏÏÏÏÏ (1,395,577) (283,853) (8,654)
Research and development expenses ÏÏÏÏÏÏÏÏÏÏÏÏÏÏÏÏÏÏÏÏÏÏ (322,185) (658,134) (20,065)
Total operating expenses ÏÏÏÏÏÏÏÏÏÏÏÏÏÏÏÏÏÏÏÏÏÏÏÏÏÏÏÏÏÏ (1,717,762) (941,987) (28,719)
Operating income ÏÏÏÏÏÏÏÏÏÏÏÏÏÏÏÏÏÏÏÏÏÏÏÏÏÏÏÏÏÏÏÏÏÏÏÏ 330,410 5,739,470 174,984
Non-operating income:
Interest income (note 7) ÏÏÏÏÏÏÏÏÏÏÏÏÏÏÏÏÏÏÏÏÏÏÏÏÏÏÏÏÏÏÏÏ 24,110 309,821 9,446
Gain on disposal of investments ÏÏÏÏÏÏÏÏÏÏÏÏÏÏÏÏÏÏÏÏÏÏÏÏÏÏ 85,648 4,532 138
Foreign exchange gain, net ÏÏÏÏÏÏÏÏÏÏÏÏÏÏÏÏÏÏÏÏÏÏÏÏÏÏÏÏÏÏ 551,248 676,797 20,634
Others (note 16)ÏÏÏÏÏÏÏÏÏÏÏÏÏÏÏÏÏÏÏÏÏÏÏÏÏÏÏÏÏÏÏÏÏÏÏÏÏÏÏ 12,966 306,754 9,352
Total non-operating income and gains ÏÏÏÏÏÏÏÏÏÏÏÏÏÏÏÏÏÏ 673,972 1,297,904 39,570
Non-operating expenses:
Interest expenses (excluding capitalized interest ofNT$151,686 and NT$395,501 for 2004 and 2005,respectively) (note 16) ÏÏÏÏÏÏÏÏÏÏÏÏÏÏÏÏÏÏÏÏÏÏÏÏÏÏÏÏÏÏÏ (91,322) (760,618) (23,190)
Others (note 16)ÏÏÏÏÏÏÏÏÏÏÏÏÏÏÏÏÏÏÏÏÏÏÏÏÏÏÏÏÏÏÏÏÏÏÏÏÏÏÏ (11,713) (9,637) (294)
Total non-operating expenses and losses ÏÏÏÏÏÏÏÏÏÏÏÏÏÏÏÏ (103,035) (770,255) (23,484)
Income before income tax ÏÏÏÏÏÏÏÏÏÏÏÏÏÏÏÏÏÏÏÏÏÏÏÏÏÏÏÏÏÏÏÏÏ 901,347 6,267,119 191,070
Income tax expense (note 13) ÏÏÏÏÏÏÏÏÏÏÏÏÏÏÏÏÏÏÏÏÏÏÏÏÏÏÏÏÏ (46) (337,361) (10,285)
Net income ÏÏÏÏÏÏÏÏÏÏÏÏÏÏÏÏÏÏÏÏÏÏÏÏÏÏÏÏÏÏÏÏÏÏÏÏÏÏÏÏÏÏÏÏÏ $ 901,301 5,929,758 180,785
Basic earnings per share (note 15)
Before tax ÏÏÏÏÏÏÏÏÏÏÏÏÏÏÏÏÏÏÏÏÏÏÏÏÏÏÏÏÏÏÏÏÏÏÏÏÏÏÏÏÏÏÏÏ $ 0.51 2.50 0.08
After taxÏÏÏÏÏÏÏÏÏÏÏÏÏÏÏÏÏÏÏÏÏÏÏÏÏÏÏÏÏÏÏÏÏÏÏÏÏÏÏÏÏÏÏÏÏÏ $ 0.51 2.36 0.07
See accompanying notes to financial statements.
F-64
Global Reports LLC

F-65
INO
TER
A M
EM
OR
IES, IN
C.
Sta
tem
ents
of C
hanges
in S
tock
hold
ers' E
quity
For
the
years
ended
Dec
ember
31, 2004 a
nd 2
005
(Expre
ssed
in thousa
nds
of N
ew T
aiw
an D
ollars
and U
.S. D
ollars
) Ret
aine
d ea
rnin
gs
Acc
um
ula
ted
loss
during
the
deve
lopm
ent
Acc
um
ula
ted
Com
mon
sto
ckC
apital
surp
lus
Leg
al r
eser
veSpe
cial
res
erve
stag
eea
rnin
gsTot
al
Bala
nce
as
of January
1, 2004
ÏÏÏÏÏÏÏÏÏÏÏÏÏÏÏÏÏÏÏÏÏÏÏÏÏÏÏ
NTD
8,5
91,7
00
3,3
33,3
50
ÌÌ
15,5
91
Ì11,9
40,6
41
Appro
priat
ion a
nd d
istrib
ution:
Appro
priat
ion for
legal
res
erve
ÏÏÏÏÏÏÏÏÏÏÏÏÏÏÏÏÏÏÏÏÏÏÏÏÏÏÏ
ÌÌ
1,5
59
Ì(1,5
59)
ÌÌ
Issu
ance
of co
mm
on s
tock
ÏÏÏÏÏÏÏÏÏÏÏÏÏÏÏÏÏÏÏÏÏÏÏÏÏÏÏÏÏÏÏ
16,3
84,9
00
12,2
15,3
10
ÌÌ
ÌÌ
28,6
00,2
10
Cum
ula
tive
net
loss
fro
m J
anuar
y 1 to M
ay 3
1, 2004
ÏÏÏÏÏÏÏÏ
ÌÌ
ÌÌ
(237,5
97)
Ì(237,5
97)
Acc
um
ula
ted loss
ÏÏÏÏÏÏÏÏÏÏÏÏÏÏÏÏÏÏÏÏÏÏÏÏÏÏÏÏÏÏÏÏÏÏÏÏÏÏ
ÌÌ
ÌÌ
223,5
65
(223,5
65)
ÌN
et inco
me
from
June
1, 2004 to D
ecem
ber
31, 2004
ÏÏÏÏÏÏÏ
ÌÌ
ÌÌ
Ì1,1
38,8
98
1,1
38,8
98
Bala
nce
as
of D
ecem
ber
31, 2004ÏÏÏÏÏÏÏÏÏÏÏÏÏÏÏÏÏÏÏÏÏÏÏÏÏ
NTD
24,9
76,6
00
15,5
48,6
60
1,5
59
ÌÌ
915,3
33
41,4
42,1
52
Appro
priat
ion a
nd d
istrib
ution:
Appro
priat
ion for
legal
res
erve
ÏÏÏÏÏÏÏÏÏÏÏÏÏÏÏÏÏÏÏÏÏÏÏÏÏÏÏ
ÌÌ
90,1
30
ÌÌ
(90,1
30)
ÌA
ppro
priat
ion for
spec
ial re
serv
eÏÏÏÏÏÏÏÏÏÏÏÏÏÏÏÏÏÏÏÏÏÏÏÏÏÏ
ÌÌ
Ì542,6
05
Ì(542,6
05)
ÌR
emuner
atio
n for
direc
tors
and s
uper
viso
rsÏÏÏÏÏÏÏÏÏÏÏÏÏÏÏÏÏ
ÌÌ
ÌÌ
Ì(2,6
86)
(2,6
86)
Bonus
for
emplo
yees
ÏÏÏÏÏÏÏÏÏÏÏÏÏÏÏÏÏÏÏÏÏÏÏÏÏÏÏÏÏÏÏÏÏÏÏÏ
8,0
57
ÌÌ
ÌÌ
(16,1
14)
(8,0
57)
Bonus
for
stock
hold
ersÏÏÏÏÏÏÏÏÏÏÏÏÏÏÏÏÏÏÏÏÏÏÏÏÏÏÏÏÏÏÏÏÏÏ
124,8
83
ÌÌ
ÌÌ
(249,7
66)
(124,8
83)
Net
inco
me
for
the
year
ended
Dec
ember
31, 2005ÏÏÏÏÏÏÏÏÏÏ
ÌÌ
ÌÌ
Ì5,9
29,7
58
5,9
29,7
58
Bala
nce
as
of D
ecem
ber
31, 2005ÏÏÏÏÏÏÏÏÏÏÏÏÏÏÏÏÏÏÏÏÏÏÏÏÏ
NTD
25,1
09,5
40
15,5
48,6
60
91,6
89
542,6
05
Ì5,9
43,7
90
47,2
36,2
84
Bala
nce
as
of D
ecem
ber
31, 2004ÏÏÏÏÏÏÏÏÏÏÏÏÏÏÏÏÏÏÏÏÏÏÏÏÏ
USD
761,4
82
474,0
45
48
ÌÌ
27,9
06
1,2
63,4
81
Appro
priat
ion a
nd d
istrib
ution:
Appro
priat
ion for
legal
res
erve
ÏÏÏÏÏÏÏÏÏÏÏÏÏÏÏÏÏÏÏÏÏÏÏÏÏÏÏ
ÌÌ
2,7
47
ÌÌ
(2,7
47)
ÌA
ppro
priat
ion for
spec
ial re
serv
eÏÏÏÏÏÏÏÏÏÏÏÏÏÏÏÏÏÏÏÏÏÏÏÏÏÏ
ÌÌ
Ì16,5
43
Ì(16,5
43)
ÌR
emuner
atio
n for
direc
tors
and s
uper
viso
rsÏÏÏÏÏÏÏÏÏÏÏÏÏÏÏÏÏ
ÌÌ
ÌÌ
Ì(82)
(82)
Bonus
for
emplo
yees
ÏÏÏÏÏÏÏÏÏÏÏÏÏÏÏÏÏÏÏÏÏÏÏÏÏÏÏÏÏÏÏÏÏÏÏÏ
246
ÌÌ
ÌÌ
(491)
(245)
Bonus
for
stock
hold
ersÏÏÏÏÏÏÏÏÏÏÏÏÏÏÏÏÏÏÏÏÏÏÏÏÏÏÏÏÏÏÏÏÏÏ
3,8
07
ÌÌ
ÌÌ
(7,6
15)
(3,8
08)
Net
inco
me
for
the
year
ended
Dec
ember
31, 2005ÏÏÏÏÏÏÏÏÏÏ
ÌÌ
ÌÌ
Ì180,7
85
180,7
85
Bala
nce
as
of D
ecem
ber
31, 2005ÏÏÏÏÏÏÏÏÏÏÏÏÏÏÏÏÏÏÏÏÏÏÏÏÏ
USD
765,5
35
474,0
45
2,7
95
16,5
43
Ì181,2
13
1,4
40,1
31
See
acc
om
pan
ying n
ote
s to
fin
anci
al s
tate
men
ts.
Global Reports LLC
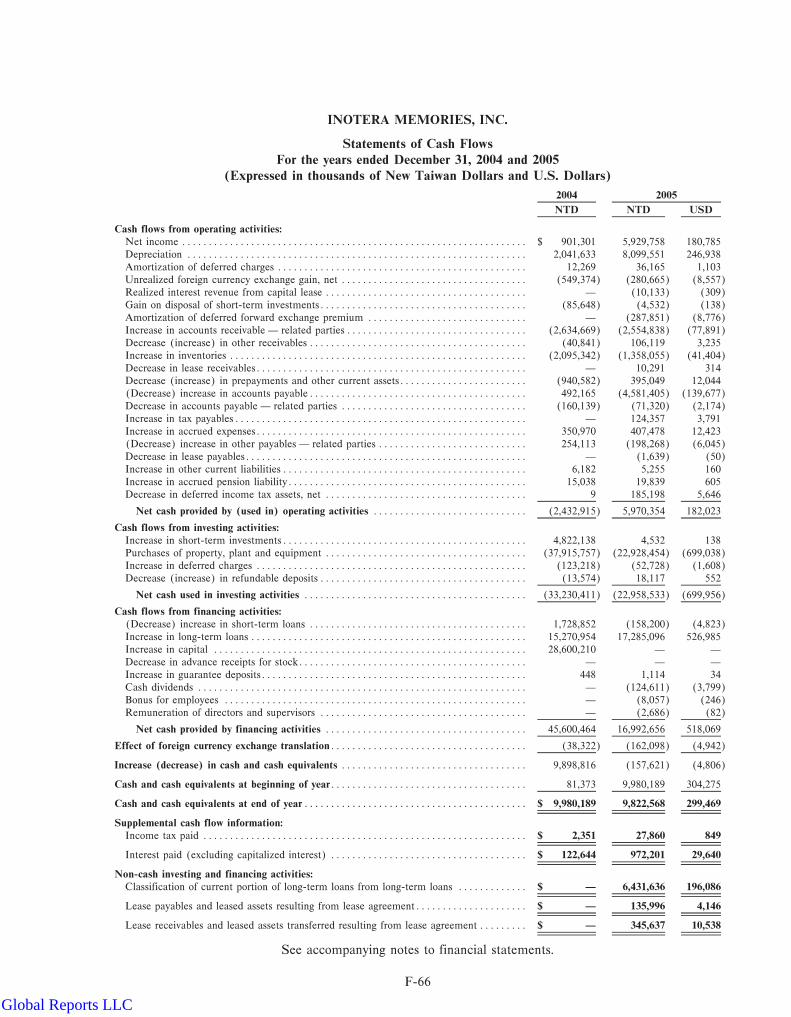
INOTERA MEMORIES, INC.
Statements of Cash Flows
For the years ended December 31, 2004 and 2005
(Expressed in thousands of New Taiwan Dollars and U.S. Dollars)
2004 2005
NTD NTD USD
Cash flows from operating activities:
Net income ÏÏÏÏÏÏÏÏÏÏÏÏÏÏÏÏÏÏÏÏÏÏÏÏÏÏÏÏÏÏÏÏÏÏÏÏÏÏÏÏÏÏÏÏÏÏÏÏÏÏÏÏÏÏÏÏÏÏÏÏÏÏÏÏÏ $ 901,301 5,929,758 180,785
Depreciation ÏÏÏÏÏÏÏÏÏÏÏÏÏÏÏÏÏÏÏÏÏÏÏÏÏÏÏÏÏÏÏÏÏÏÏÏÏÏÏÏÏÏÏÏÏÏÏÏÏÏÏÏÏÏÏÏÏÏÏÏÏÏÏÏ 2,041,633 8,099,551 246,938
Amortization of deferred charges ÏÏÏÏÏÏÏÏÏÏÏÏÏÏÏÏÏÏÏÏÏÏÏÏÏÏÏÏÏÏÏÏÏÏÏÏÏÏÏÏÏÏÏÏÏÏÏ 12,269 36,165 1,103
Unrealized foreign currency exchange gain, net ÏÏÏÏÏÏÏÏÏÏÏÏÏÏÏÏÏÏÏÏÏÏÏÏÏÏÏÏÏÏÏÏÏÏÏ (549,374) (280,665) (8,557)
Realized interest revenue from capital lease ÏÏÏÏÏÏÏÏÏÏÏÏÏÏÏÏÏÏÏÏÏÏÏÏÏÏÏÏÏÏÏÏÏÏÏÏÏÏ Ì (10,133) (309)
Gain on disposal of short-term investmentsÏÏÏÏÏÏÏÏÏÏÏÏÏÏÏÏÏÏÏÏÏÏÏÏÏÏÏÏÏÏÏÏÏÏÏÏÏÏÏ (85,648) (4,532) (138)
Amortization of deferred forward exchange premium ÏÏÏÏÏÏÏÏÏÏÏÏÏÏÏÏÏÏÏÏÏÏÏÏÏÏÏÏÏÏ Ì (287,851) (8,776)
Increase in accounts receivable Ì related partiesÏÏÏÏÏÏÏÏÏÏÏÏÏÏÏÏÏÏÏÏÏÏÏÏÏÏÏÏÏÏÏÏÏÏ (2,634,669) (2,554,838) (77,891)
Decrease (increase) in other receivables ÏÏÏÏÏÏÏÏÏÏÏÏÏÏÏÏÏÏÏÏÏÏÏÏÏÏÏÏÏÏÏÏÏÏÏÏÏÏÏÏÏ (40,841) 106,119 3,235
Increase in inventories ÏÏÏÏÏÏÏÏÏÏÏÏÏÏÏÏÏÏÏÏÏÏÏÏÏÏÏÏÏÏÏÏÏÏÏÏÏÏÏÏÏÏÏÏÏÏÏÏÏÏÏÏÏÏÏÏ (2,095,342) (1,358,055) (41,404)
Decrease in lease receivablesÏÏÏÏÏÏÏÏÏÏÏÏÏÏÏÏÏÏÏÏÏÏÏÏÏÏÏÏÏÏÏÏÏÏÏÏÏÏÏÏÏÏÏÏÏÏÏÏÏÏÏ Ì 10,291 314
Decrease (increase) in prepayments and other current assetsÏÏÏÏÏÏÏÏÏÏÏÏÏÏÏÏÏÏÏÏÏÏÏÏ (940,582) 395,049 12,044
(Decrease) increase in accounts payableÏÏÏÏÏÏÏÏÏÏÏÏÏÏÏÏÏÏÏÏÏÏÏÏÏÏÏÏÏÏÏÏÏÏÏÏÏÏÏÏÏ 492,165 (4,581,405) (139,677)
Decrease in accounts payable Ì related parties ÏÏÏÏÏÏÏÏÏÏÏÏÏÏÏÏÏÏÏÏÏÏÏÏÏÏÏÏÏÏÏÏÏÏÏ (160,139) (71,320) (2,174)
Increase in tax payablesÏÏÏÏÏÏÏÏÏÏÏÏÏÏÏÏÏÏÏÏÏÏÏÏÏÏÏÏÏÏÏÏÏÏÏÏÏÏÏÏÏÏÏÏÏÏÏÏÏÏÏÏÏÏÏ Ì 124,357 3,791
Increase in accrued expensesÏÏÏÏÏÏÏÏÏÏÏÏÏÏÏÏÏÏÏÏÏÏÏÏÏÏÏÏÏÏÏÏÏÏÏÏÏÏÏÏÏÏÏÏÏÏÏÏÏÏÏ 350,970 407,478 12,423
(Decrease) increase in other payables Ì related parties ÏÏÏÏÏÏÏÏÏÏÏÏÏÏÏÏÏÏÏÏÏÏÏÏÏÏÏÏ 254,113 (198,268) (6,045)
Decrease in lease payablesÏÏÏÏÏÏÏÏÏÏÏÏÏÏÏÏÏÏÏÏÏÏÏÏÏÏÏÏÏÏÏÏÏÏÏÏÏÏÏÏÏÏÏÏÏÏÏÏÏÏÏÏÏ Ì (1,639) (50)
Increase in other current liabilitiesÏÏÏÏÏÏÏÏÏÏÏÏÏÏÏÏÏÏÏÏÏÏÏÏÏÏÏÏÏÏÏÏÏÏÏÏÏÏÏÏÏÏÏÏÏÏ 6,182 5,255 160
Increase in accrued pension liabilityÏÏÏÏÏÏÏÏÏÏÏÏÏÏÏÏÏÏÏÏÏÏÏÏÏÏÏÏÏÏÏÏÏÏÏÏÏÏÏÏÏÏÏÏÏ 15,038 19,839 605
Decrease in deferred income tax assets, net ÏÏÏÏÏÏÏÏÏÏÏÏÏÏÏÏÏÏÏÏÏÏÏÏÏÏÏÏÏÏÏÏÏÏÏÏÏÏ 9 185,198 5,646
Net cash provided by (used in) operating activities ÏÏÏÏÏÏÏÏÏÏÏÏÏÏÏÏÏÏÏÏÏÏÏÏÏÏÏÏÏ (2,432,915) 5,970,354 182,023
Cash flows from investing activities:
Increase in short-term investmentsÏÏÏÏÏÏÏÏÏÏÏÏÏÏÏÏÏÏÏÏÏÏÏÏÏÏÏÏÏÏÏÏÏÏÏÏÏÏÏÏÏÏÏÏÏÏ 4,822,138 4,532 138
Purchases of property, plant and equipment ÏÏÏÏÏÏÏÏÏÏÏÏÏÏÏÏÏÏÏÏÏÏÏÏÏÏÏÏÏÏÏÏÏÏÏÏÏÏ (37,915,757) (22,928,454) (699,038)
Increase in deferred charges ÏÏÏÏÏÏÏÏÏÏÏÏÏÏÏÏÏÏÏÏÏÏÏÏÏÏÏÏÏÏÏÏÏÏÏÏÏÏÏÏÏÏÏÏÏÏÏÏÏÏÏ (123,218) (52,728) (1,608)
Decrease (increase) in refundable deposits ÏÏÏÏÏÏÏÏÏÏÏÏÏÏÏÏÏÏÏÏÏÏÏÏÏÏÏÏÏÏÏÏÏÏÏÏÏÏÏ (13,574) 18,117 552
Net cash used in investing activities ÏÏÏÏÏÏÏÏÏÏÏÏÏÏÏÏÏÏÏÏÏÏÏÏÏÏÏÏÏÏÏÏÏÏÏÏÏÏÏÏÏÏ (33,230,411) (22,958,533) (699,956)
Cash flows from financing activities:
(Decrease) increase in short-term loans ÏÏÏÏÏÏÏÏÏÏÏÏÏÏÏÏÏÏÏÏÏÏÏÏÏÏÏÏÏÏÏÏÏÏÏÏÏÏÏÏÏ 1,728,852 (158,200) (4,823)
Increase in long-term loans ÏÏÏÏÏÏÏÏÏÏÏÏÏÏÏÏÏÏÏÏÏÏÏÏÏÏÏÏÏÏÏÏÏÏÏÏÏÏÏÏÏÏÏÏÏÏÏÏÏÏÏÏ 15,270,954 17,285,096 526,985
Increase in capital ÏÏÏÏÏÏÏÏÏÏÏÏÏÏÏÏÏÏÏÏÏÏÏÏÏÏÏÏÏÏÏÏÏÏÏÏÏÏÏÏÏÏÏÏÏÏÏÏÏÏÏÏÏÏÏÏÏÏÏ 28,600,210 Ì Ì
Decrease in advance receipts for stockÏÏÏÏÏÏÏÏÏÏÏÏÏÏÏÏÏÏÏÏÏÏÏÏÏÏÏÏÏÏÏÏÏÏÏÏÏÏÏÏÏÏÏ Ì Ì Ì
Increase in guarantee depositsÏÏÏÏÏÏÏÏÏÏÏÏÏÏÏÏÏÏÏÏÏÏÏÏÏÏÏÏÏÏÏÏÏÏÏÏÏÏÏÏÏÏÏÏÏÏÏÏÏÏ 448 1,114 34
Cash dividends ÏÏÏÏÏÏÏÏÏÏÏÏÏÏÏÏÏÏÏÏÏÏÏÏÏÏÏÏÏÏÏÏÏÏÏÏÏÏÏÏÏÏÏÏÏÏÏÏÏÏÏÏÏÏÏÏÏÏÏÏÏÏ Ì (124,611) (3,799)
Bonus for employees ÏÏÏÏÏÏÏÏÏÏÏÏÏÏÏÏÏÏÏÏÏÏÏÏÏÏÏÏÏÏÏÏÏÏÏÏÏÏÏÏÏÏÏÏÏÏÏÏÏÏÏÏÏÏÏÏÏ Ì (8,057) (246)
Remuneration of directors and supervisors ÏÏÏÏÏÏÏÏÏÏÏÏÏÏÏÏÏÏÏÏÏÏÏÏÏÏÏÏÏÏÏÏÏÏÏÏÏÏÏ Ì (2,686) (82)
Net cash provided by financing activities ÏÏÏÏÏÏÏÏÏÏÏÏÏÏÏÏÏÏÏÏÏÏÏÏÏÏÏÏÏÏÏÏÏÏÏÏÏÏ 45,600,464 16,992,656 518,069
Effect of foreign currency exchange translationÏÏÏÏÏÏÏÏÏÏÏÏÏÏÏÏÏÏÏÏÏÏÏÏÏÏÏÏÏÏÏÏÏÏÏÏÏ (38,322) (162,098) (4,942)
Increase (decrease) in cash and cash equivalents ÏÏÏÏÏÏÏÏÏÏÏÏÏÏÏÏÏÏÏÏÏÏÏÏÏÏÏÏÏÏÏÏÏÏÏ 9,898,816 (157,621) (4,806)
Cash and cash equivalents at beginning of yearÏÏÏÏÏÏÏÏÏÏÏÏÏÏÏÏÏÏÏÏÏÏÏÏÏÏÏÏÏÏÏÏÏÏÏÏÏ 81,373 9,980,189 304,275
Cash and cash equivalents at end of yearÏÏÏÏÏÏÏÏÏÏÏÏÏÏÏÏÏÏÏÏÏÏÏÏÏÏÏÏÏÏÏÏÏÏÏÏÏÏÏÏÏÏ $ 9,980,189 9,822,568 299,469
Supplemental cash flow information:
Income tax paid ÏÏÏÏÏÏÏÏÏÏÏÏÏÏÏÏÏÏÏÏÏÏÏÏÏÏÏÏÏÏÏÏÏÏÏÏÏÏÏÏÏÏÏÏÏÏÏÏÏÏÏÏÏÏÏÏÏÏÏÏÏ $ 2,351 27,860 849
Interest paid (excluding capitalized interest) ÏÏÏÏÏÏÏÏÏÏÏÏÏÏÏÏÏÏÏÏÏÏÏÏÏÏÏÏÏÏÏÏÏÏÏÏÏ $ 122,644 972,201 29,640
Non-cash investing and financing activities:
Classification of current portion of long-term loans from long-term loans ÏÏÏÏÏÏÏÏÏÏÏÏÏ $ Ì 6,431,636 196,086
Lease payables and leased assets resulting from lease agreementÏÏÏÏÏÏÏÏÏÏÏÏÏÏÏÏÏÏÏÏÏ $ Ì 135,996 4,146
Lease receivables and leased assets transferred resulting from lease agreement ÏÏÏÏÏÏÏÏÏ $ Ì 345,637 10,538
See accompanying notes to financial statements.
F-66
Global Reports LLC

INOTERA MEMORIES, INC.
Notes to Financial Statements
December 31, 2004 and 2005
(All amounts expressed in thousands of New Taiwan Dollars
and U.S. Dollars except per share information or unless otherwise specified)
(1) Organization and Principal Activities
Inotera Memories, Inc. (the ""Company'') commenced as a development stage enterprise on Decem-
ber 17, 2002, and was legally established on January 23, 2003, however, it did not commence commercial
operating activities until June 1, 2004.
The Company's main operating activities are to produce and to sell semiconductor products. In the
development stage, the Company's activities included financial planning, raising funds, employee hiring, and
plant construction.
As of December 31, 2004 and 2005, the Company had 1,408 and 1,824 employees, respectively.
(2) Summary of Significant Accounting Policies
The accompanying financial statements are prepared in accordance with accounting principles generally
accepted in the Republic of China (ROC). The financial statements are not intended to present the financial
position of the Company and the related results of operations and cash flow in accordance with accounting
principles and practices generally accepted in countries and jurisdictions other than the ROC. The significant
accounting policies followed by the Company are as follows:
(a) Foreign currency transactions and translation
The Company's reporting currency is the New Taiwan Dollar. Foreign currency transactions during
the year are translated at the exchange rates on the transaction dates. Foreign currency-denominated
assets and liabilities are translated into New Taiwan Dollar at the exchange rate prevailing on the balance
sheet date, and the resulting realized and unrealized gains or losses are recognized as non-operating
income or expenses.
(b) Convenience translation into U.S. dollars
The financial statements are stated in New Taiwan Dollars. Translation of the 2005 New Taiwan
Dollar amounts into U.S. dollar amounts is included solely for the convenience of the readers, using the
Federal Reserve exchange rate on December 30, 2005, of NT$32.8 to US$1 uniformly for all the
financial statements' accounts. The convenience translations should not be construed as representations
that the New Taiwan Dollar amounts have been, could have been, or could in the future be, converted
into U.S. dollars at this rate or any other rate of exchange.
(c) Cash equivalents
Cash and cash equivalents consist of cash on hand, cash in banks, time deposits, negotiable time
deposits and other cash equivalents. Other cash equivalents represent highly liquid debt instruments with
a maturity period of less than three months, such as commercial paper, repurchased government bond
and other highly liquid investments which do not have a significant level of market or credit risk from
potential interest rate changes.
(d) Short-term investments
Short-term investments consist mainly of bond funds, which are stated at the lower of aggregate cost
or market value. Aggregate cost is determined by the weighted-average method. Market value is the
listed net value of the fund at the balance sheet date. Losses resulting from a decline in market value are
recognized in the income statement of the current period.
F-67
Global Reports LLC

INOTERA MEMORIES, INC.
Notes to Financial Statements Ì (Continued)
(e) Inventories
Inventories are stated at the lower of cost or market value. Cost is determined by using the monthly
weighted-average method. Market value represents replacement cost or net realizable value.
(f) Property, plant and equipment/Depreciation
Property, plant and equipment are stated at cost. The cost less accumulated depreciation is the net
book value. Interest from borrowings obtained to finance the construction of property, plant and
equipment is capitalized. Maintenance and repairs are expensed when incurred; major addition,
improvement and replacement expenditures are capitalized.
Depreciation of property, plant and equipment is provided over their estimated useful lives by using
the straight-line method. Assets still in service after reaching the end of their estimated useful lives are
depreciated based on the residual value over their re-estimated useful lives. The useful lives of the assets
are as follows:
(i) Buildings and structures: 8-50 years.
(ii) Vehicles: 5 years.
(iii) Machinery and equipment: 3-5 years.
(iv) Leased assets: 23.7 years.
(v) Miscellaneous equipment: 5-15 years.
Gains or losses on disposal of property, plant and equipment are recorded as non-operating income or
expenses.
(g) Leases
A lease is deemed to be a capital lease if it conforms to any one of the following classification
criteria:
(i) the lease transfers ownership of the leased assets to the lessee by the end of the lease
term;
(ii) the lease contains a bargain purchase option;
(iii) the lease term is equal to 75% or more of the total estimated economic life of the leased
assets; this criterion should not be applied to leases in which the leased asset has been
used for more than 75% of its estimated economic life before the lease begins;
(iv) The present value of the rental plus the bargain purchase price or the guaranteed residual
value is at least 90% of the fair market value of the leased assets at the inception date of
the lease.
For the lessor, a capital lease must also conform to any one of the four classification criteria specified
above and both of the following two further criteria:
(i) collectibility of the lease payments is reasonably predictable; and
(ii) no important uncertainties surround the amount of unreimbursable costs yet to be incurred
by the lessor under the lease.
Under a capital lease, the Company, as the lessee, capitalizes the leased assets based on (a) the
present value of all future installment rental payments (minus executory costs born by lessor) plus the
bargain purchase price or lessee's guaranteed residual value or (b) the fair market value of leased assets
F-68
Global Reports LLC

INOTERA MEMORIES, INC.
Notes to Financial Statements Ì (Continued)
at the lease inception date, whichever is lower. The depreciation period is restricted to the lease term,
rather than the estimated useful life of the assets, unless the lease provides for transfer of title or includes
a bargain purchase option.
Under a capital lease, the Company, as the lessor, records all installments plus the bargain purchase
price or guaranteed residual value as the lease receivables. The implicit interest rate is used to calculate
the present value of lease receivables as the cost of leased assets transferred. The difference between the
total amount of lease receivables and the cost of leased assets transferred is recognized as unrealized
interest income and is then recognized as realized interest income using the interest method over the
lease term.
(h) Deferred charges
(i) Any charges and consulting fees related to the syndicated loans are deferred and amortized
over the loan terms.
(ii) Power line compensation and the royalty paid to the Industrial Technology Research
Institute are deferred and amortized over the estimated useful lives or the agreement
terms.
(i) Employee retirement plan
The Company has established an employee noncontributory defined benefit retirement plan (the
""Plan'') covering full-time employees in the Republic of China. In accordance with the Plan, employees
are eligible for retirement or are required to retire after meeting certain age or service requirements.
Payments of retirement benefits are based on years of service and the average salary for the last six
months before the employee's retirement. Each employee gets 2 months' salary for each service year for
the first 15 years, and 1 month's salary for each service year thereafter. A lump-sum retirement benefit is
paid through the retirement fund.
Starting from July 1, 2005, the enforcement date of the newly enacted Labor Pension Act (the
""New Act''), those employees who adopt the defined contribution plan are stipulated as follows:
(i) employees who originally adopted the Plan and opt to be subject to the pension mechanism
under the New Act;
(ii) employees who commenced working after the enforcement date of the New Act.
In accordance with the New Act, the rate of contribution by an employer to an individual labor
pension fund account per month shall not be less than 6% of the worker's monthly wages.
The Company has adopted Republic of China Statement of Financial Accounting Standards
(SFAS) No. 18, ""Accounting for Pensions'' for the noncontributory defined benefit retirement plan.
SFAS No. 18 requires an actuarial calculation of the Company's pension obligation as of each fiscal year-
end. Based on the actuarial calculation, the Company recognizes a minimum pension liability and net
periodic pension costs covering the service lives of the retirement plan participants.
(j) Revenue recognition
Revenue is generally recognized when products are delivered to customers and the significant risks
and rewards of ownership are transferred. Repair income is recognized when the services are provided.
F-69
Global Reports LLC

INOTERA MEMORIES, INC.
Notes to Financial Statements Ì (Continued)
Revenue is generally recognized when it is realized or realizable and earned when all of the following
criteria are met:
(i) persuasive evidence of an arrangement exists,
(ii) delivery has occurred or services have been rendered,
(iii) the seller's price to the buyer is fixed or determinable, and
(iv) collectibility is reasonably assured.
(k) Income tax
Income taxes are accounted for using the asset and liability method. Deferred income tax is
determined based on differences between the financial statements and tax basis of assets and liabilities
using enacted tax rates in effect during the years in which the differences are expected to reverse. The
income tax effects of taxable temporary differences are recognized as deferred income tax liabilities. The
income tax effects resulting from deductible temporary differences, net operating loss carryforwards, and
income tax credits are recognized as deferred income tax assets. The realization of the deferred income
tax assets is evaluated, and if it is considered more likely than not that the asset will not be realized, a
valuation allowance is recognized accordingly.
The classification of deferred income tax assets and liabilities as current or noncurrent is based on
the classification of the related asset or liability. If the deferred income tax asset or liability is not directly
related to a specific asset or liability, then the classification is based on the expected realization date of
the asset or liability.
A tax imputation system was adopted in accordance with the amended ROC Income Tax Law.
Under this system, the Company may retain the earnings incurred after December 31, 1997, by paying
10% surtax on such undistributed earnings, calculated on tax basis, and the surtax is accounted for as
income tax expense on the date when the stockholders' resolve not to distribute the earnings.
(l) Earnings (loss) per common share
Earnings (loss) per share are computed by dividing the net income (loss) made available for
distribution to common stockholders by the weighted-average number of shares outstanding which is
retroactively adjusted to include stock dividends issued during the period.
(m) Derivative financial instruments
(i) Foreign exchange forward contracts
Foreign exchange forward contracts which are entered into for the purpose of hedging the risks
of exchange rate fluctuation on foreign currency receivables and payables are translated into New
Taiwan Dollars using spot rates on the balance sheet date. The resulting translation difference is
recorded as an exchange gain or loss in the accompanying statements of income. The difference
between the forward rate and spot rate at the contract date is amortized over the contract period.
(ii) Interest rate swap contracts
Because there is no physical transfer of principal, only memo entries of notional principals are
made for interest rate swaps. For trading swaps, the differences between the present and market
values of interest receivables or payables arising thereon are reported as unrealized gains or losses on
derivative instruments. For non-trading swaps, interest is accrued based on contract terms with
interest revenue and expense recognized in the same period that the hedged items affect earnings.
F-70
Global Reports LLC

INOTERA MEMORIES, INC.
Notes to Financial Statements Ì (Continued)
(iii) Cross currency swaps (CCSs)
Memo entries of notional principals are made on the contract date for cross-currency swaps.
Forward accounts receivables are offset against payables on the balance sheet date, with the
difference reflected either as an asset or a liability. For trading swaps, gains or losses on the
differences between the present and market value of principal and interests in New Taiwan Dollars,
are recognized as unrealized gains or losses. For non-trading swaps, interest is accrued based on
contract terms and principal repayment period, with interest revenue and expense recognized in the
same period that the hedged items affect earnings.
(n) Asset impairment
Effective January 1, 2005, the Company adopted Republic of China Statement of Financial
Accounting Standards No. 35 (ROC SFAS 35) ""Accounting for Asset Impairment''. According to
SFAS No. 35, the Company assesses at each balance sheet date whether there is any indication that an
asset (individual asset or cash-generating unit) may have been impaired. If any such indication exists, the
Company estimates the recoverable amount of the asset. The Company recognizes impairment loss for an
asset whose carrying value is higher than the recoverable amount.
The Company reverses an impairment loss recognized in prior periods for assets if there is any
indication that the impairment loss recognized no longer exists or has decreased. The carrying value after
the reversal should not exceed the recoverable amount or the depreciated or amortized balance of the
assets assuming no impairment loss was recognized in prior periods.
(o) Basis for classifying assets and liabilities as current or non-current
Current assets are cash and other assets that a business will convert to cash or use up in a relatively
short period of time Ì one year or one operating cycle, whichever is longer. Current liabilities are debts
due within one year or one operating cycle, whichever is longer.
(3) Reasons for and Cumulative Effect of Accounting Principle Changes
The Company adopted Republic of China Statement of Financial Accounting Standards No. 35
""Accounting for Asset Impairment'' in 2005. After performing an evaluation of impairment of its assets
(individual asset or cash-generating unit), the Company determined that no impairment loss would be
recognized as of December 31, 2005.
F-71
Global Reports LLC

INOTERA MEMORIES, INC.
Notes to Financial Statements Ì (Continued)
(4) Revenues and expenses during development stage
2004.1.1-2004.5.30 2002.12.17-2003.12.31
NTD NTD
Operating revenueÏÏÏÏÏÏÏÏÏÏÏÏÏÏÏÏÏÏÏÏÏÏÏÏÏÏÏÏÏÏÏÏÏÏÏ $ Ì Ì
Cost of goods sold ÏÏÏÏÏÏÏÏÏÏÏÏÏÏÏÏÏÏÏÏÏÏÏÏÏÏÏÏÏÏÏÏÏÏ Ì Ì
Gross profit ÏÏÏÏÏÏÏÏÏÏÏÏÏÏÏÏÏÏÏÏÏÏÏÏÏÏÏÏÏÏÏÏÏÏÏÏÏÏÏÏ Ì Ì
Administrative expensesÏÏÏÏÏÏÏÏÏÏÏÏÏÏÏÏÏÏÏÏÏÏÏÏÏÏÏÏÏÏ (1,452,163) (566,506)
Net loss ÏÏÏÏÏÏÏÏÏÏÏÏÏÏÏÏÏÏÏÏÏÏÏÏÏÏÏÏÏÏÏÏÏÏÏÏÏÏÏÏÏÏÏ (1,452,163) (566,506)
Non-operating income
Interest income ÏÏÏÏÏÏÏÏÏÏÏÏÏÏÏÏÏÏÏÏÏÏÏÏÏÏÏÏÏÏÏÏÏÏÏ 1,171 4,417
Gain on disposal of investment ÏÏÏÏÏÏÏÏÏÏÏÏÏÏÏÏÏÏÏÏÏÏ 15,825 20,737
Exchange gain, net ÏÏÏÏÏÏÏÏÏÏÏÏÏÏÏÏÏÏÏÏÏÏÏÏÏÏÏÏÏÏÏÏ 231,209 5,259
Other income ÏÏÏÏÏÏÏÏÏÏÏÏÏÏÏÏÏÏÏÏÏÏÏÏÏÏÏÏÏÏÏÏÏÏÏÏ 3,633 773
251,838 31,186
Non-operating expenses
Interest expensesÏÏÏÏÏÏÏÏÏÏÏÏÏÏÏÏÏÏÏÏÏÏÏÏÏÏÏÏÏÏÏÏÏÏ (40,420) (23,336)
Other expenses ÏÏÏÏÏÏÏÏÏÏÏÏÏÏÏÏÏÏÏÏÏÏÏÏÏÏÏÏÏÏÏÏÏÏÏ (788) (30)
(41,208) (23,366)
Loss before income tax ÏÏÏÏÏÏÏÏÏÏÏÏÏÏÏÏÏÏÏÏÏÏÏÏÏÏÏÏÏÏ (1,241,533) (558,686)
Income tax benefit ÏÏÏÏÏÏÏÏÏÏÏÏÏÏÏÏÏÏÏÏÏÏÏÏÏÏÏÏÏÏÏÏÏÏ 1,003,936 574,277
Net (loss) income ÏÏÏÏÏÏÏÏÏÏÏÏÏÏÏÏÏÏÏÏÏÏÏÏÏÏÏÏÏÏÏÏÏÏ $ (237,597) 15,591
(5) Cash and cash equivalents
Cash and deposits as of December 31, 2004 and 2005, consisted of:
2004 2005
NTD NTD USD
Cash on hand and petty cash ÏÏÏÏÏÏÏÏÏÏÏÏÏÏÏÏÏÏÏÏÏÏÏÏÏÏ $ 130 160 5
Cash in bank Ì checking account ÏÏÏÏÏÏÏÏÏÏÏÏÏÏÏÏÏÏÏÏÏÏ 4,159 5,346 163
Cash in bank Ì demand deposit accountÏÏÏÏÏÏÏÏÏÏÏÏÏÏÏÏÏ 7,616,966 5,143 157
Cash in bank Ì foreign currency account ÏÏÏÏÏÏÏÏÏÏÏÏÏÏÏÏ 600,106 546,761 16,670
Time deposit ÏÏÏÏÏÏÏÏÏÏÏÏÏÏÏÏÏÏÏÏÏÏÏÏÏÏÏÏÏÏÏÏÏÏÏÏÏÏÏÏ 1,758,828 9,265,158 282,474
Total ÏÏÏÏÏÏÏÏÏÏÏÏÏÏÏÏÏÏÏÏÏÏÏÏÏÏÏÏÏÏÏÏÏÏÏÏÏÏÏÏÏÏÏÏÏÏÏ $9,980,189 9,822,568 299,469
Deposits were not pledged or mortgaged to secure bank loans.
F-72
Global Reports LLC
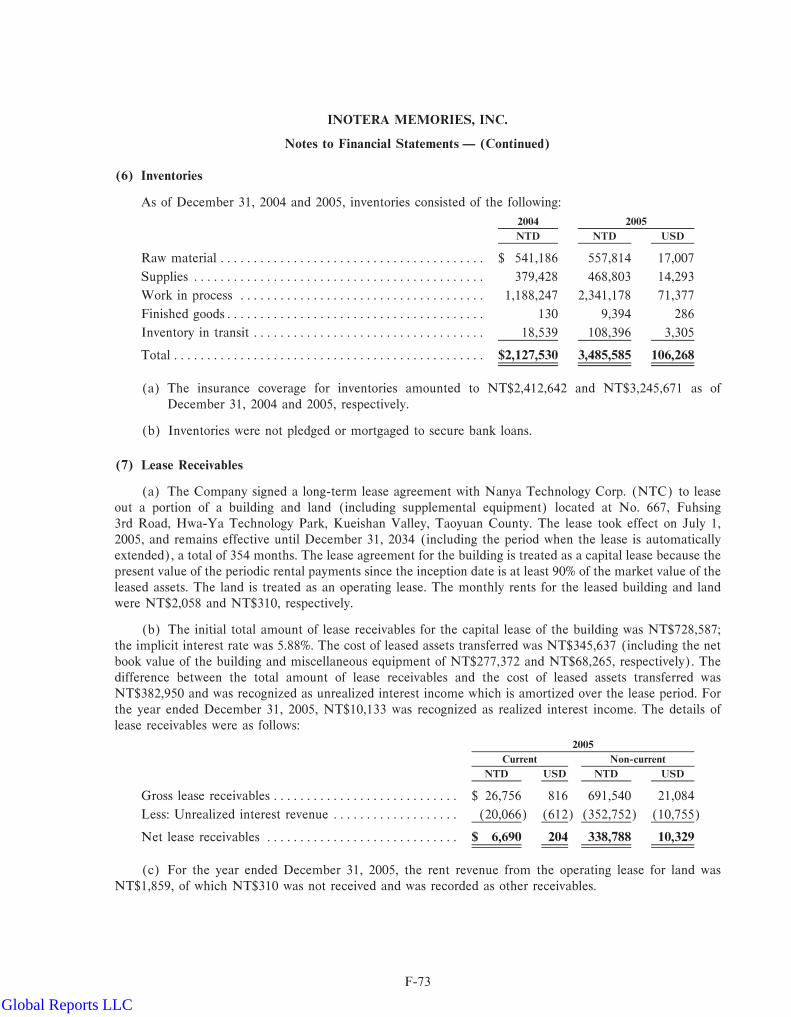
INOTERA MEMORIES, INC.
Notes to Financial Statements Ì (Continued)
(6) Inventories
As of December 31, 2004 and 2005, inventories consisted of the following:
2004 2005
NTD NTD USD
Raw material ÏÏÏÏÏÏÏÏÏÏÏÏÏÏÏÏÏÏÏÏÏÏÏÏÏÏÏÏÏÏÏÏÏÏÏÏÏÏÏÏ $ 541,186 557,814 17,007
Supplies ÏÏÏÏÏÏÏÏÏÏÏÏÏÏÏÏÏÏÏÏÏÏÏÏÏÏÏÏÏÏÏÏÏÏÏÏÏÏÏÏÏÏÏÏ 379,428 468,803 14,293
Work in process ÏÏÏÏÏÏÏÏÏÏÏÏÏÏÏÏÏÏÏÏÏÏÏÏÏÏÏÏÏÏÏÏÏÏÏÏÏ 1,188,247 2,341,178 71,377
Finished goodsÏÏÏÏÏÏÏÏÏÏÏÏÏÏÏÏÏÏÏÏÏÏÏÏÏÏÏÏÏÏÏÏÏÏÏÏÏÏÏ 130 9,394 286
Inventory in transit ÏÏÏÏÏÏÏÏÏÏÏÏÏÏÏÏÏÏÏÏÏÏÏÏÏÏÏÏÏÏÏÏÏÏÏ 18,539 108,396 3,305
Total ÏÏÏÏÏÏÏÏÏÏÏÏÏÏÏÏÏÏÏÏÏÏÏÏÏÏÏÏÏÏÏÏÏÏÏÏÏÏÏÏÏÏÏÏÏÏÏ $2,127,530 3,485,585 106,268
(a) The insurance coverage for inventories amounted to NT$2,412,642 and NT$3,245,671 as of
December 31, 2004 and 2005, respectively.
(b) Inventories were not pledged or mortgaged to secure bank loans.
(7) Lease Receivables
(a) The Company signed a long-term lease agreement with Nanya Technology Corp. (NTC) to lease
out a portion of a building and land (including supplemental equipment) located at No. 667, Fuhsing
3rd Road, Hwa-Ya Technology Park, Kueishan Valley, Taoyuan County. The lease took effect on July 1,
2005, and remains effective until December 31, 2034 (including the period when the lease is automatically
extended), a total of 354 months. The lease agreement for the building is treated as a capital lease because the
present value of the periodic rental payments since the inception date is at least 90% of the market value of the
leased assets. The land is treated as an operating lease. The monthly rents for the leased building and land
were NT$2,058 and NT$310, respectively.
(b) The initial total amount of lease receivables for the capital lease of the building was NT$728,587;
the implicit interest rate was 5.88%. The cost of leased assets transferred was NT$345,637 (including the net
book value of the building and miscellaneous equipment of NT$277,372 and NT$68,265, respectively). The
difference between the total amount of lease receivables and the cost of leased assets transferred was
NT$382,950 and was recognized as unrealized interest income which is amortized over the lease period. For
the year ended December 31, 2005, NT$10,133 was recognized as realized interest income. The details of
lease receivables were as follows:
2005
Current Non-current
NTD USD NTD USD
Gross lease receivables ÏÏÏÏÏÏÏÏÏÏÏÏÏÏÏÏÏÏÏÏÏÏÏÏÏÏÏÏ $ 26,756 816 691,540 21,084
Less: Unrealized interest revenue ÏÏÏÏÏÏÏÏÏÏÏÏÏÏÏÏÏÏÏ (20,066) (612) (352,752) (10,755)
Net lease receivables ÏÏÏÏÏÏÏÏÏÏÏÏÏÏÏÏÏÏÏÏÏÏÏÏÏÏÏÏÏ $ 6,690 204 338,788 10,329
(c) For the year ended December 31, 2005, the rent revenue from the operating lease for land was
NT$1,859, of which NT$310 was not received and was recorded as other receivables.
F-73
Global Reports LLC

INOTERA MEMORIES, INC.
Notes to Financial Statements Ì (Continued)
(d) Future gross lease receivables classified as capital lease or operating lease as of December 31, 2005,
were as follows:
Capital lease Operating lease
Duration NTD USD NTD USD
2006.1.1-2006.12.31 ÏÏÏÏÏÏÏÏÏÏÏÏÏÏÏÏÏÏÏÏÏÏÏÏÏÏÏÏÏÏ $ 24,698 753 3,719 113
2007.1.1-2007.12.31 ÏÏÏÏÏÏÏÏÏÏÏÏÏÏÏÏÏÏÏÏÏÏÏÏÏÏÏÏÏÏ 24,698 753 3,719 113
2008.1.1-2008.12.31 ÏÏÏÏÏÏÏÏÏÏÏÏÏÏÏÏÏÏÏÏÏÏÏÏÏÏÏÏÏÏ 24,698 753 3,719 113
2009.1.1-2009.12.31 ÏÏÏÏÏÏÏÏÏÏÏÏÏÏÏÏÏÏÏÏÏÏÏÏÏÏÏÏÏÏ 24,698 753 3,719 113
2010.1.1-2034.12.31 ÏÏÏÏÏÏÏÏÏÏÏÏÏÏÏÏÏÏÏÏÏÏÏÏÏÏÏÏÏÏ 617,447 18,825 92,964 2,834
$716,239 21,837 107,840 3,286
(8) Property, Plant and Equipment/Depreciation
As of December 31, 2004 and 2005, accumulated depreciation of property, plant and equipment consisted
of:
2004 2005
NTD NTD USD
Buildings and structures ÏÏÏÏÏÏÏÏÏÏÏÏÏÏÏÏÏÏÏÏÏÏÏÏÏÏÏÏÏÏ $ 24,756 99,863 3,045
Machinery and equipment ÏÏÏÏÏÏÏÏÏÏÏÏÏÏÏÏÏÏÏÏÏÏÏÏÏÏÏÏ 1,845,574 9,219,024 281,067
Vehicles ÏÏÏÏÏÏÏÏÏÏÏÏÏÏÏÏÏÏÏÏÏÏÏÏÏÏÏÏÏÏÏÏÏÏÏÏÏÏÏÏÏÏÏ 239 725 22
Leased assets ÏÏÏÏÏÏÏÏÏÏÏÏÏÏÏÏÏÏÏÏÏÏÏÏÏÏÏÏÏÏÏÏÏÏÏÏÏÏÏ Ì 2,873 88
Miscellaneous equipment ÏÏÏÏÏÏÏÏÏÏÏÏÏÏÏÏÏÏÏÏÏÏÏÏÏÏÏÏÏ 171,967 808,146 24,639
Total ÏÏÏÏÏÏÏÏÏÏÏÏÏÏÏÏÏÏÏÏÏÏÏÏÏÏÏÏÏÏÏÏÏÏÏÏÏÏÏÏÏÏÏÏÏÏ $2,042,536 10,130,631 308,861
(a) All construction in progress is insured, and the insurance coverage thereon amounted to
NT$60,354,152 and NT$35,778,787 as of December 31, 2004 and 2005, respectively.
(b) As of December 31, 2004 and 2005, the insurance coverage on the buildings and equipment against
fire loss amounted to NT$33,186,671 and NT$67,533,079, respectively.
(c) In March 2005, the Company purchased two parcels of land numbered 350 and 351 located in Hwa-
Ya, Kueishan, Taoyuan County, for NT$28,465 from the Land Readjustment Committee in
Kueishan, Taoyuan County. As of December 31, 2005, the Company had paid NT$22,772, which
was recorded as a prepayment on land purchase.
(d) As of December 31, 2005, the insurance coverage for losses on business interruption amounted to
NT$13,658,519.
(e) The property, plant and equipment pledged to secure bank loans as of December 31, 2004 and 2005,
were described in note 11.
(9) Leased Assets and Lease Payables
(a) The Company signed a long-term lease agreement with NTC to lease a portion of the building and
land located on the land numbered 348, 348-2 and 348-4, Hwa-Ya Section, Kueishan Valley,
Taoyuan County. The lease took effect on July 1, 2005, and remains effective until February 28,
2029 (including the period when the agreement can be automatically extended), a total of
284 months. The lease agreement for the building is treated as a capital lease because (a) the
present value of the periodic rental payments made since the inception date is at least 90% of the
F-74
Global Reports LLC

INOTERA MEMORIES, INC.
Notes to Financial Statements Ì (Continued)
market value of the leased assets and (b) the lease term is equal to 75% of or more of the total
estimated economic life of the leased assets. The land is treated as an operating lease. The monthly
rents for the leased building and land were NT$775 and NT$357, respectively.
(b) The total amount of lease payables for the capital lease of the building was NT$135,996; the implicit
interest rate was 4.46%. The fair value of the leased assets was NT$135,996. The details were as
follows:
2005.12.31
NTD USD
Lease payables ÏÏÏÏÏÏÏÏÏÏÏÏÏÏÏÏÏÏÏÏÏÏÏÏÏÏÏÏÏÏÏÏÏÏÏÏÏÏÏÏÏÏÏÏÏÏÏÏÏÏÏÏÏ $134,357 4,096
Less: Current portion of lease payablesÏÏÏÏÏÏÏÏÏÏÏÏÏÏÏÏÏÏÏÏÏÏÏÏÏÏÏÏÏÏÏÏÏ (3,390) (103)
$130,967 3,993
(c) For the year ended December 31, 2005, the lease expense for the operating lease for land was
NT$2,141, which was fully paid.
(d) Future lease payments (excluding interest component) classified as capital lease or operating lease
as of December 31, 2005, were as follows:
Duration Capital lease Operating lease
NTD USD NTD USD
2006.1.1-2006.12.31 ÏÏÏÏÏÏÏÏÏÏÏÏÏÏÏÏÏÏÏÏÏÏÏÏÏ $ 3,390 103 4,282 131
2007.1.1-2007.12.31 ÏÏÏÏÏÏÏÏÏÏÏÏÏÏÏÏÏÏÏÏÏÏÏÏÏ 3,544 108 4,282 131
2008.1.1-2008.12.31 ÏÏÏÏÏÏÏÏÏÏÏÏÏÏÏÏÏÏÏÏÏÏÏÏÏ 3,706 113 4,282 131
2009.1.1-2009.12.31 ÏÏÏÏÏÏÏÏÏÏÏÏÏÏÏÏÏÏÏÏÏÏÏÏÏ 3,874 118 4,282 131
2010.1.1-2029.02.28 ÏÏÏÏÏÏÏÏÏÏÏÏÏÏÏÏÏÏÏÏÏÏÏÏÏ 119,843 3,654 82,068 2,502
$134,357 4,096 99,196 3,026
(10) Short-term Loans
Short-term loans as of December 31, 2004 and 2005, consisted of the following:
2004 2005
NTD NTD USD
Unsecured borrowingsÏÏÏÏÏÏÏÏÏÏÏÏÏÏÏÏÏÏÏÏÏÏÏÏÏÏÏÏÏÏÏÏÏÏ $2,481,500 2,323,300 70,832
The short-term loans bore interest at annual rates of 1.050%-1.157% in 2004 and 1.390% in 2005.
The unused credit facility for short-term loans amounted to NT$5,666,700 as of December 31, 2005.
F-75
Global Reports LLC

INOTERA MEMORIES, INC.
Notes to Financial Statements Ì (Continued)
(11) Long-term Loans
Long-term loans as of December 31, 2004 and 2005, consisted of:
2004
Bank Repayment period Nature Interest rate NTD
Taiwan Cooperative Bank (themanaging bank) ÏÏÏÏÏÏÏÏÏÏÏ February 2, 2006- Machinery loan 1.1725%-2.5793% $ 8,298,420
February 2, 2009
I.C.B.C. (the managing bank) November 15, 2006- Machinery loan 3.1607%-3.4567% 6,383,400November 15, 2009
$14,681,820
2005
Bank Repayment period Nature Interest rate NTD USD
Taiwan CooperativeBank (themanaging bank) ÏÏ February 2, 2006- Machinery loan 4.6214%-4.7688% $ 8,541,000 260,396
February 2, 2009
I.C.B.C. (themanaging bank) ÏÏ November 15, 2006- Machinery loan 5.3488% 22,075,200 673,025
November 15, 2009
I.C.B.C. (themanaging bank) ÏÏ November 15, 2006- Machinery loan 2.4260% 1,850,000 56,402
November 15, 2009
32,466,200 989,823
Less: Current portionof long-term loans (6,431,636) (196,086)
$26,034,564 793,737
The Company signed a syndicated loan agreement with Taiwan Cooperative Bank, the managing bank of
this syndicated loan, and 15 other banks on January 16, 2004. The Company had utilized US$260,000 from
this loan facility for the period from February 2 to August 2, 2004. The details of the loan are as follows:
(a) Credit line: US$260,000.
(b) Interest rate: USD 3-month or 6-month London Inter-bank Offered Rate (""LIBOR'') plus
margin.
(c) Duration: 5 years.
(d) Repayment: The principal is payable in 7 semi-annual installments starting from 24 months
after the first drawing date.
(e) The long-term loan is secured by machinery. As of December 31, 2004 and 2005, the net book
value of the pledged assets amounted to NT$11,654,503 and NT$9,625,951, respectively.
(f) This long-term borrowing was guaranteed by Nan Ya Plastics Corporation.
(g) The Company has issued a promissory note for the syndicated loan.
The Company signed a syndicated loan agreement with I.C.B.C., as the managing bank of the syndicated
loan, and 23 other banks on October 14, 2004 (as of December 31, 2005, the actual number of banks had
F-76
Global Reports LLC

INOTERA MEMORIES, INC.
Notes to Financial Statements Ì (Continued)
increased to 28). The Company applied for drawings of US$672,000 and NT$1,850,000 for the period
November 15, 2004, to December 31, 2005. The details of the loan are as follows:
(a) Credit line: US$672,000 and NT$5,700,000.
(b) Interest rate for Tranche A: USD 3-month or 6-month London Inter-bank Offered Rate
(""LIBOR'') plus margin.
(c) Interest rate for Tranche B: The 180-day commercial paper rate in the primary market which
appears on Moneyline Telerate, plus margin.
(d) Duration: 5 years.
(e) Repayment: The principal is payable in 7 semi-annual installments starting from 24 months
after the first drawing date.
(f) This long-term debt is secured by buildings and machinery. As of December 31, 2005, the net
book value of the pledged assets amounted to NT$17,949,184.
(g) This long-term borrowing was guaranteed by Nan Ya Plastics Corporation.
(h) The Company has issued a promissory note for this syndicated loan.
(12) Accrued Pension Liability
The pension information for the years ended December 31, 2004 and 2005, was as follows:
2004 2005
NTD NTD USD
Balance of the retirement fund ÏÏÏÏÏÏÏÏÏÏÏÏÏÏÏÏÏÏÏÏÏÏÏÏÏÏÏÏÏÏÏÏ $12,637 29,193 890
The net pension costs
Defined benefit retirement planÏÏÏÏÏÏÏÏÏÏÏÏÏÏÏÏÏÏÏÏÏÏÏÏÏÏÏÏÏÏ 30,094 35,317 1,077
Defined contribution planÏÏÏÏÏÏÏÏÏÏÏÏÏÏÏÏÏÏÏÏÏÏÏÏÏÏÏÏÏÏÏÏÏÏÏ Ì 23,482 716
Accrued pension expenses ÏÏÏÏÏÏÏÏÏÏÏÏÏÏÏÏÏÏÏÏÏÏÏÏÏÏÏÏÏÏÏÏÏÏÏÏ Ì 12,265 374
Accrued pension liabilities ÏÏÏÏÏÏÏÏÏÏÏÏÏÏÏÏÏÏÏÏÏÏÏÏÏÏÏÏÏÏÏÏÏÏÏÏ 30,755 50,594 1,543
(a) The Company adopted Republic of China Statement of Financial Accounting Standards No. 18,
""Accounting for Pensions'' for those employees covered by the non-contributory defined benefit
retirement plan. The Company recognizes a minimum pension liability based on the actuarial report,
which uses the balance sheet date as the measurement date.
F-77
Global Reports LLC

INOTERA MEMORIES, INC.
Notes to Financial Statements Ì (Continued)
(b) The following table sets forth the details of the reconciliation of funded status to accrued pension
liability on December 31, 2004 and 2005:
2004 2005
NTD NTD USD
Benefit obligation:
Vested benefit obligation ÏÏÏÏÏÏÏÏÏÏÏÏÏÏÏÏÏÏÏÏÏÏÏÏÏÏÏÏÏÏÏ $ (1,589) (4,227) (129)
Non-vested benefit obligation ÏÏÏÏÏÏÏÏÏÏÏÏÏÏÏÏÏÏÏÏÏÏÏÏÏÏÏ (33,262) (54,372) (1,658)
Accumulated benefit obligationÏÏÏÏÏÏÏÏÏÏÏÏÏÏÏÏÏÏÏÏÏÏÏÏÏÏ (34,851) (58,599) (1,787)
Projected compensation increaseÏÏÏÏÏÏÏÏÏÏÏÏÏÏÏÏÏÏÏÏÏÏÏÏÏ (38,746) (65,607) (2,000)
Projected benefit obligation ÏÏÏÏÏÏÏÏÏÏÏÏÏÏÏÏÏÏÏÏÏÏÏÏÏÏÏÏÏ (73,597) (124,206) (3,787)
Fair value of plan assetsÏÏÏÏÏÏÏÏÏÏÏÏÏÏÏÏÏÏÏÏÏÏÏÏÏÏÏÏÏÏÏÏÏÏ 15,132 31,115 949
Funded status ÏÏÏÏÏÏÏÏÏÏÏÏÏÏÏÏÏÏÏÏÏÏÏÏÏÏÏÏÏÏÏÏÏÏÏÏÏÏÏÏÏÏ (58,465) (93,091) (2,838)
Unamortized pension gain or losses ÏÏÏÏÏÏÏÏÏÏÏÏÏÏÏÏÏÏÏÏÏÏÏÏ 27,710 42,497 1,295
Accrued pension liability ÏÏÏÏÏÏÏÏÏÏÏÏÏÏÏÏÏÏÏÏÏÏÏÏÏÏÏÏÏÏÏÏÏ $(30,755) (50,594) (1,543)
(c) As of December 31, 2004 and 2005, the actuarial present value of the vested benefits for the
Company's employees in accordance with the retirement benefit plan was approximately NT$1,835
and NT$4,609, respectively. Major assumptions used to determine the pension plan funded status as
of December 31, 2004 and 2005, were as follows:
2004 2005
Discount rate ÏÏÏÏÏÏÏÏÏÏÏÏÏÏÏÏÏÏÏÏÏÏÏÏÏÏÏÏÏÏÏÏÏÏÏÏÏÏÏÏÏÏÏÏÏÏÏÏÏÏÏÏÏÏÏÏ 3.00% 3.00%
Rate of increase in compensationÏÏÏÏÏÏÏÏÏÏÏÏÏÏÏÏÏÏÏÏÏÏÏÏÏÏÏÏÏÏÏÏÏÏÏÏÏÏÏÏ 3.00% 3.00%
Expected long-term rate of return on plan assetsÏÏÏÏÏÏÏÏÏÏÏÏÏÏÏÏÏÏÏÏÏÏÏÏÏÏÏ 3.00% 3.00%
(13) Income Tax
(a) The Company's earnings are subject to income tax at a statutory rate of 25%. For the years ended
December 31, 2004 and 2005, the components of income tax expense were as follows:
2004 2005
NTD NTD USD
Income tax expense Ì current ÏÏÏÏÏÏÏÏÏÏÏÏÏÏÏÏÏÏÏÏÏÏÏÏÏÏÏÏÏÏÏÏÏ $46 152,162 4,639
Income tax expense Ì deferred ÏÏÏÏÏÏÏÏÏÏÏÏÏÏÏÏÏÏÏÏÏÏÏÏÏÏÏÏÏÏÏÏ Ì 185,199 5,646
Income tax expense ÏÏÏÏÏÏÏÏÏÏÏÏÏÏÏÏÏÏÏÏÏÏÏÏÏÏÏÏÏÏÏÏÏÏÏÏÏÏÏÏÏÏ $46 337,361 10,285
(b) The differences between expected income tax expense calculated at a statutory income tax rate of
25% and the actual income tax as reported in the accompanying financial statements for the years
ended December 31, 2004 and 2005, were summarized as follows:
2004 2005
NTD NTD USD
Income tax calculated based on financial pretax income $ 225,327 1,566,770 47,767
Tax effect of tax-free income from income tax holiday ÏÏ Ì (1,269,719) (38,711)
Increase in income tax credit for purchasing machineryand equipmentÏÏÏÏÏÏÏÏÏÏÏÏÏÏÏÏÏÏÏÏÏÏÏÏÏÏÏÏÏÏÏÏÏÏ (3,480,741) (3,353,698) (102,248)
F-78
Global Reports LLC

INOTERA MEMORIES, INC.
Notes to Financial Statements Ì (Continued)
2004 2005
NTD NTD USD
Differences between estimated and actual income taxexpense filingÏÏÏÏÏÏÏÏÏÏÏÏÏÏÏÏÏÏÏÏÏÏÏÏÏÏÏÏÏÏÏÏÏÏÏ (85) 263,056 8,020
Tax-exempt securitiesÏÏÏÏÏÏÏÏÏÏÏÏÏÏÏÏÏÏÏÏÏÏÏÏÏÏÏÏÏÏ (21,412) (985) (30)
Increase in valuation allowance for deferred income taxassets ÏÏÏÏÏÏÏÏÏÏÏÏÏÏÏÏÏÏÏÏÏÏÏÏÏÏÏÏÏÏÏÏÏÏÏÏÏÏÏÏÏ 3,276,911 3,123,694 95,235
10% surtax on undistributed earnings ÏÏÏÏÏÏÏÏÏÏÏÏÏÏÏÏÏ Ì 7,862 240
Income tax expense imposed separatelyÏÏÏÏÏÏÏÏÏÏÏÏÏÏÏ 46 381 12
Income tax expense ÏÏÏÏÏÏÏÏÏÏÏÏÏÏÏÏÏÏÏÏÏÏÏÏÏÏÏÏÏÏÏ $ 46 337,361 10,285
(c) Deferred income tax assets and tax liabilities as of December 31, 2004 and 2005, were as follows:
2004 2005
NTD NTD USD
Current:
Deferred income tax assets ÏÏÏÏÏÏÏÏÏÏÏÏÏÏÏÏÏÏÏÏÏÏÏÏÏÏÏÏÏÏÏÏÏ 23,744 66,267 2,020
Deferred income tax liabilitiesÏÏÏÏÏÏÏÏÏÏÏÏÏÏÏÏÏÏÏÏÏÏÏÏÏÏÏÏÏÏÏ (11,581) (29,862) (910)
Current deferred income tax assets, net ÏÏÏÏÏÏÏÏÏÏÏÏÏÏÏÏÏÏÏÏÏÏÏ $ 12,163 36,405 1,110
Non-current:
Deferred income tax assets ÏÏÏÏÏÏÏÏÏÏÏÏÏÏÏÏÏÏÏÏÏÏÏÏÏÏÏÏÏÏÏÏÏ $ 4,182,020 7,194,031 219,331
Valuation allowance for deferred income tax assets ÏÏÏÏÏÏÏÏÏÏÏÏÏ (3,472,538) (6,596,233) (201,105)
Deferred income tax assets, netÏÏÏÏÏÏÏÏÏÏÏÏÏÏÏÏÏÏÏÏÏÏÏÏÏÏÏÏÏÏ 709,482 597,798 18,226
Deferred income tax liabilitiesÏÏÏÏÏÏÏÏÏÏÏÏÏÏÏÏÏÏÏÏÏÏÏÏÏÏÏÏÏÏÏ (147,284) (245,040) (7,471)
Non-current deferred income tax assets, net ÏÏÏÏÏÏÏÏÏÏÏÏÏÏÏÏÏÏÏ $ 562,198 352,758 10,755
Total deferred income tax assets, gross ÏÏÏÏÏÏÏÏÏÏÏÏÏÏÏÏÏÏÏÏÏÏÏ $ 4,205,764 7,260,298 221,351
Total deferred income tax liabilities, grossÏÏÏÏÏÏÏÏÏÏÏÏÏÏÏÏÏÏÏÏÏ $ 158,865 274,902 8,381
Total valuation allowance for deferred income tax assetsÏÏÏÏÏÏÏÏÏ $ 3,472,538 6,596,233 201,105
F-79
Global Reports LLC

INOTERA MEMORIES, INC.
Notes to Financial Statements Ì (Continued)
(d) As of December 31, 2004 and 2005, the components of deferred income tax assets or liabilities were
as follows:
2004 2005
NTD NTD USD
Effects on Effects on Effects onAmount income tax Amount income tax Amount income tax
Deferred income tax assets:
Investment tax creditÏÏÏÏÏÏÏÏÏÏÏÏ $4,105,880 4,105,880 7,023,377 7,023,377 214,127 214,127
Difference in depreciation expensefor tax purposes and financialaccounting purposesÏÏÏÏÏÏÏÏÏÏÏ 13,075 3,269 8,030 2,008 245 61
Pension expense in excess of taxlimitÏÏÏÏÏÏÏÏÏÏÏÏÏÏÏÏÏÏÏÏÏÏÏÏ 32,056 8,014 50,594 12,648 1,543 386
Loss carryforwards ÏÏÏÏÏÏÏÏÏÏÏÏÏÏ 189,657 47,414 Ì Ì Ì Ì
Unrealized foreign exchange loss ÏÏ 86,083 21,521 818,944 204,736 24,968 6,242
Unrealized operating expense ÏÏÏÏÏ 78,665 19,666 70,114 17,529 2,138 535
Deferred income tax assets, gross ÏÏÏ 4,205,764 7,260,298 221,351
Deferred income tax liabilities:
Unrealized foreign exchange gain $ 635,458 158,864 1,099,609 274,902 33,525 8,381
(e) Under the ROC Statute for Upgrading Industries, the Company's unused investment tax credits as
of December 31, 2005, were as follows:
Remaining deductible
Year Amount Amount Expiry Year
NTD USD
Investment tax credit for purchasing machinery andequipment:
2003 ÏÏÏÏÏÏÏÏÏÏÏÏÏÏÏÏÏÏÏÏÏÏÏÏÏÏÏÏÏÏÏÏÏÏÏÏÏÏÏÏÏÏÏÏÏÏÏ $ 427,988 13,048 2007
2004 ÏÏÏÏÏÏÏÏÏÏÏÏÏÏÏÏÏÏÏÏÏÏÏÏÏÏÏÏÏÏÏÏÏÏÏÏÏÏÏÏÏÏÏÏÏÏÏ 3,241,691 98,832 2008
2005 ÏÏÏÏÏÏÏÏÏÏÏÏÏÏÏÏÏÏÏÏÏÏÏÏÏÏÏÏÏÏÏÏÏÏÏÏÏÏÏÏÏÏÏÏÏÏÏ 3,353,698 102,247 2009
$7,023,377 214,127
ROC Income Tax Law provides investment tax credit to companies that purchase certain type of
equipment and machinery. Such tax credit can be used to reduce up to 50% of income tax liability arising from
the Company's products produced using such machinery for four years starting from the year of equipment
purchase, and can be used to reduce up to 100% of such income tax liability in the fifth year.
(f) The Company's income tax returns have not been examined or assessed yet by the ROC tax
authority.
(g) Imputation credit account (ICA) and creditable ratio
(h) As of December 31, 2004 and 2005, the balance of the Company's ICA amounted to NT$196 and
NT$27,822, respectively. The Company's creditable ratio related to 2005 was 0.06%. There were no
undistributed earnings belonging to the years before 1997.
(i) The stockholders approved a resolution during their meetings on June 29, 2005, and October 18,
2004, to allow the Company to avail itself of the Income Tax Holiday for investment projects under
F-80
Global Reports LLC

INOTERA MEMORIES, INC.
Notes to Financial Statements Ì (Continued)
Article 9 of the Statute for Upgrading Industries. The Company has availed itself of the five-year
Income Tax Holiday commencing from January 1, 2005 and June 1, 2005, respectively, for the
taxable income that is derived only from the sale of products produced from its Fab 1-Phases 1 and 2
investment project. This income tax holiday reduced the Company's effective income tax rate to as
low as 5% in 2005. As of December 31, 2005, the exemption from profit-seeking enterprise income
tax (""Income Tax Holiday'') under Article 9 of the Statute for Upgrading Industries for the
aforesaid investment projects had the following duration.
Duration of Income Tax Holiday
Inotera Fab-1 Ì Phase 1 ÏÏÏÏÏÏÏÏÏÏÏÏÏÏÏÏÏÏÏÏÏÏÏÏÏÏÏÏÏÏÏÏÏ January 2005-December 2009
Inotera Fab-1 Ì Phase 2 ÏÏÏÏÏÏÏÏÏÏÏÏÏÏÏÏÏÏÏÏÏÏÏÏÏÏÏÏÏÏÏÏÏ June 2005-May 2009
(14) Stockholders' Equity
(a) Capital stock
During their meetings on February 6, April 20, July 28, and November 10, 2004, the board of directors
approved resolutions allowing the Company to increase its capital by issuing 666,670 thousand, 294,120 thou-
sand, 315,790 thousand, and 361,910 thousand shares of common stock, NT$15, NT$17, NT$19, and
NT$21 per share, respectively. The capital increase dates were February 17, May 20, August 3, and
December 30, 2004, respectively, and were approved by and registered with the authorities.
During their meeting on June 29, 2005, the stockholders approved a resolution allowing the Company to
further increase its capital by NT$132,940 by declearing stock dividends out of its 2004 earnings. This capital
increase was approved by the Securities and Futures Bureau (SFB) on July 12, 2005. On July 18, 2005, the
board of directors resolved to set August 9, 2005 as the effective date for paying this stock dividend by issuing
new shares. Following the issuance of these new shares, the total amount of the Company's outstanding
common stock was NT$25,109,540.
As of December 31, 2004 and 2005, the Company's total authorized capital amounted to NT$30,000,000
and NT$40,000,000, respectively, and total issued common stock amounted to NT$24,976,600 and
NT$25,109,540, respectively, with $10 par value per share.
(b) Capital surplus
As of December 31, 2004 and 2005, the capital surplus consisted of the following:
2004 2005
NTD NTD USD
Paid-in capital in excess of par value ÏÏÏÏÏÏÏÏÏÏÏÏÏÏÏÏÏÏ $15,548,660 15,548,660 474,045
According to the ROC Company Law, realized capital surplus can be transferred to common stock after
deducting the accumulated deficit, if any. Realized capital surplus includes the additional paid-in capital from
issuance of common stock in excess of the common stock's par value, donation from others, and additional
paid-in capital Ì treasury stock.
(c) Earnings appropriation and distribution
The Company's annual net profit, after providing for income tax and covering the losses of previous years,
shall be first set aside for legal reserve at the rate of 10% thereof until the accumulated balance of legal reserve
equals the total issued capital. The remaining net profit, if any, after providing for any special reserves or
reserving certain undistributed earnings for business purposes shall be distributed as follows:
(i) 0.1%-1% as bonuses for directors and supervisors
F-81
Global Reports LLC

INOTERA MEMORIES, INC.
Notes to Financial Statements Ì (Continued)
(ii) 1%-8% as employee bonuses
(iii) The remainder as dividends and bonuses for stockholders, distributed in the form of cash
dividends and/or stock dividends.
Because it belongs to a highly capital-intensive industry with strong growth potential, the Company
adopts a dividend distribution policy which is in line with its capital budget and long-term financial plans. This
policy requires, among other things that the distribution of cash dividends shall be at least fifty percent (50%)
of the Company's total dividends for the year.
Based on the resolutions approved by the stockholders during their meeting on June 29, 2005, the
Company distributed its 2004 earnings as follows:
(i) Legal reserve (10% of net income): NT$90,130
(ii) Voluntary reserve: NT$542,605
(iii) Remuneration of directors and supervisors: NT$2,686
(iv) Employees' bonus Ì cash: NT$8,057
(v) Employees' bonus Ì stock: NT$8,057
(vi) Stockholders' dividend Ì stock (0.05 NT dollar per share): NT$124,883
(vii) Stockholders' dividend Ì cash (0.05 NT dollar per share): NT$124,883
If the remuneration of directors and supervisors and the employees' bonus were distributed by cash and
recorded as compensation expenses, the retroactive earning per share in 2004 would decrease from NTD$0.51
to NTD$0.50. The distributed shares of the employees' stock bonus in 2004 were 0.03% of the outstanding
shares.
The appropriation of the Company's 2005 net income for the employees' bonus and remuneration of
directors and supervisors is subject to a resolution to be passed and approved by the Company's directors and
stockholders during their meetings normally held within six months after the year-end closing. Following the
approval of this resolution, related information can be obtained from the public information website.
(15) Earnings per Share
For the years ended December 31, 2004 and 2005, the weighted-average number of outstanding common
shares and the common stock equivalents for calculating the basic EPS consisted of the following (expressed
in thousands of New Taiwan Dollars and shares, except for earnings per share expressed in New Taiwan
Dollars):
2004
Amount Earnings per share
Income before Income after Total shares Before Afterincome tax income tax outstanding income tax income tax
Basic earnings per share Ì retroactivelyadjustedÏÏÏÏÏÏÏÏÏÏÏÏÏÏÏÏÏÏÏÏÏÏÏÏÏÏ $ 901,347 901,301 1,767,217 0.51 0.51
F-82
Global Reports LLC
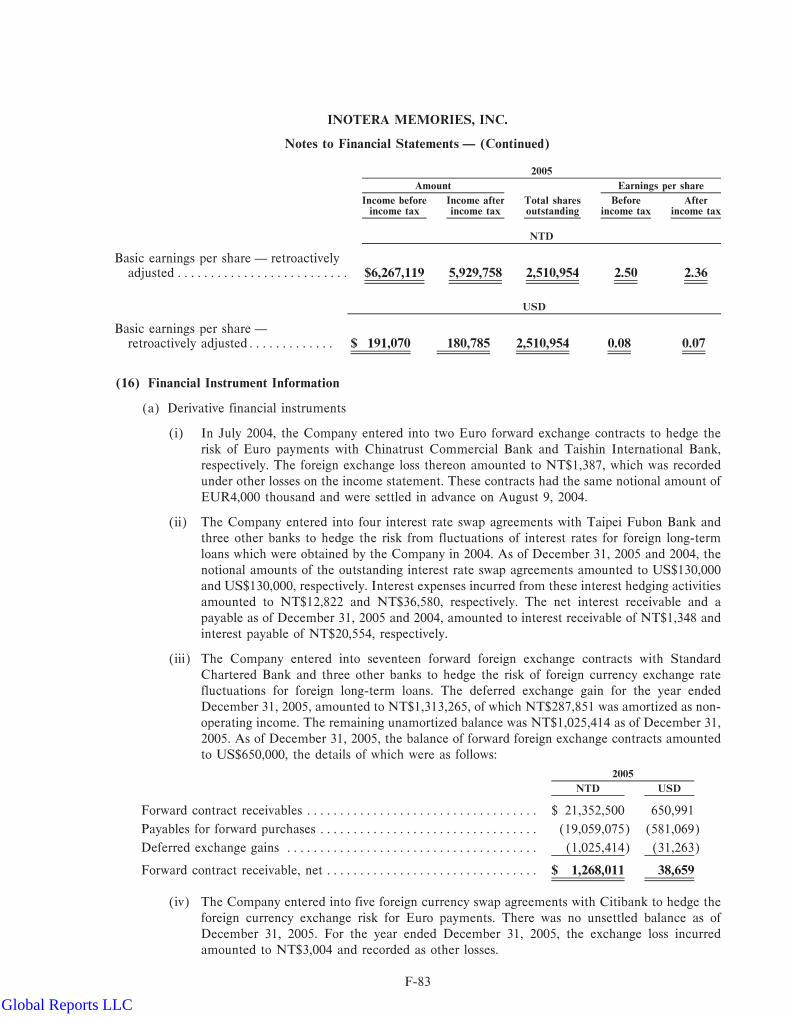
INOTERA MEMORIES, INC.
Notes to Financial Statements Ì (Continued)
2005
Amount Earnings per share
Income before Income after Total shares Before Afterincome tax income tax outstanding income tax income tax
NTD
Basic earnings per share Ì retroactivelyadjustedÏÏÏÏÏÏÏÏÏÏÏÏÏÏÏÏÏÏÏÏÏÏÏÏÏÏ $6,267,119 5,929,758 2,510,954 2.50 2.36
USD
Basic earnings per share Ìretroactively adjustedÏÏÏÏÏÏÏÏÏÏÏÏÏ $ 191,070 180,785 2,510,954 0.08 0.07
(16) Financial Instrument Information
(a) Derivative financial instruments
(i) In July 2004, the Company entered into two Euro forward exchange contracts to hedge the
risk of Euro payments with Chinatrust Commercial Bank and Taishin International Bank,
respectively. The foreign exchange loss thereon amounted to NT$1,387, which was recorded
under other losses on the income statement. These contracts had the same notional amount of
EUR4,000 thousand and were settled in advance on August 9, 2004.
(ii) The Company entered into four interest rate swap agreements with Taipei Fubon Bank and
three other banks to hedge the risk from fluctuations of interest rates for foreign long-term
loans which were obtained by the Company in 2004. As of December 31, 2005 and 2004, the
notional amounts of the outstanding interest rate swap agreements amounted to US$130,000
and US$130,000, respectively. Interest expenses incurred from these interest hedging activities
amounted to NT$12,822 and NT$36,580, respectively. The net interest receivable and a
payable as of December 31, 2005 and 2004, amounted to interest receivable of NT$1,348 and
interest payable of NT$20,554, respectively.
(iii) The Company entered into seventeen forward foreign exchange contracts with Standard
Chartered Bank and three other banks to hedge the risk of foreign currency exchange rate
fluctuations for foreign long-term loans. The deferred exchange gain for the year ended
December 31, 2005, amounted to NT$1,313,265, of which NT$287,851 was amortized as non-
operating income. The remaining unamortized balance was NT$1,025,414 as of December 31,
2005. As of December 31, 2005, the balance of forward foreign exchange contracts amounted
to US$650,000, the details of which were as follows:
2005
NTD USD
Forward contract receivables ÏÏÏÏÏÏÏÏÏÏÏÏÏÏÏÏÏÏÏÏÏÏÏÏÏÏÏÏÏÏÏÏÏÏÏ $ 21,352,500 650,991
Payables for forward purchases ÏÏÏÏÏÏÏÏÏÏÏÏÏÏÏÏÏÏÏÏÏÏÏÏÏÏÏÏÏÏÏÏÏ (19,059,075) (581,069)
Deferred exchange gains ÏÏÏÏÏÏÏÏÏÏÏÏÏÏÏÏÏÏÏÏÏÏÏÏÏÏÏÏÏÏÏÏÏÏÏÏÏÏ (1,025,414) (31,263)
Forward contract receivable, net ÏÏÏÏÏÏÏÏÏÏÏÏÏÏÏÏÏÏÏÏÏÏÏÏÏÏÏÏÏÏÏÏ $ 1,268,011 38,659
(iv) The Company entered into five foreign currency swap agreements with Citibank to hedge the
foreign currency exchange risk for Euro payments. There was no unsettled balance as of
December 31, 2005. For the year ended December 31, 2005, the exchange loss incurred
amounted to NT$3,004 and recorded as other losses.
F-83
Global Reports LLC

INOTERA MEMORIES, INC.
Notes to Financial Statements Ì (Continued)
(v) The Company's hedging strategy is to cover the biggest part of the risk. Because the foreign
forward exchange rate is fixed, the cash flow risk is low. Credit risk is the risk that a counter-
party will default on its obligation. The banks with which the Company entered into derivative
transactions are all well-known financial institutions. Therefore, the Company does not expect
the banks to default. As a result, the Company estimates credit risk to be reasonably low.
(b) Fair value of financial instruments
In accordance with ROC SFAS No. 27, ""Disclosure of Financial Instruments'', the fair value of the
Company's derivative and non-derivative financial instruments was as follows:
2004 2005
NTD NTD USD
Book Fair Book Fair Book FairFinancial Instruments value value value value value value
Forward foreign exchange contracts ÏÏÏÏÏÏÏÏÏÏÏÏÏÏ $Ì Ì 1,268 912 39 28
Interest rate swap agreementsÏÏÏÏÏÏÏÏÏÏÏÏÏÏÏÏÏÏÏ Ì (37) Ì 39 Ì 1
Ì (37) 1,268 951 39 29
The methods and assumptions used to estimate the fair value of each class of financial instruments were
as follows:
(i) The book value is believed to be not materially different from their fair value because the
maturity dates of short-term financial instruments are within one year from the balance sheet
date. Therefore, their book value is adopted as a reasonable basis for determining their fair
value. This principle is applied in estimating the fair value of short-term financial instruments
including cash and cash equivalents, account receivables, account payables, accrued expenses
and short-term loans.
(ii) Refundable deposits and guarantee deposits are collected or refunded in cash based on their
amount. Therefore, their book value is equivalent to their fair value.
(iii) The discounted present value of anticipated cash flows is adopted as the fair value of long-term
debt and corporate bonds payable. The discounting rates used in calculating the present value
are similar to those of the Company's existing long-term loans.
(iv) The fair values of derivative financial instruments are the estimated amounts expected to be
received or to be paid by the Company assuming that it terminates the contracts on the
balance sheet date. The majority of the Company's derivative financial instruments have
quotations available from financial institutions which are used in the calculation of the fair
value.
(v) The fair value of letters of credit or endorsements/guarantees is based on the contract price.
(c) As of December 31, 2004 and 2005, the fair values of non-derivative financial instruments were
estimated to be equal to their book values as of the same date.
F-84
Global Reports LLC
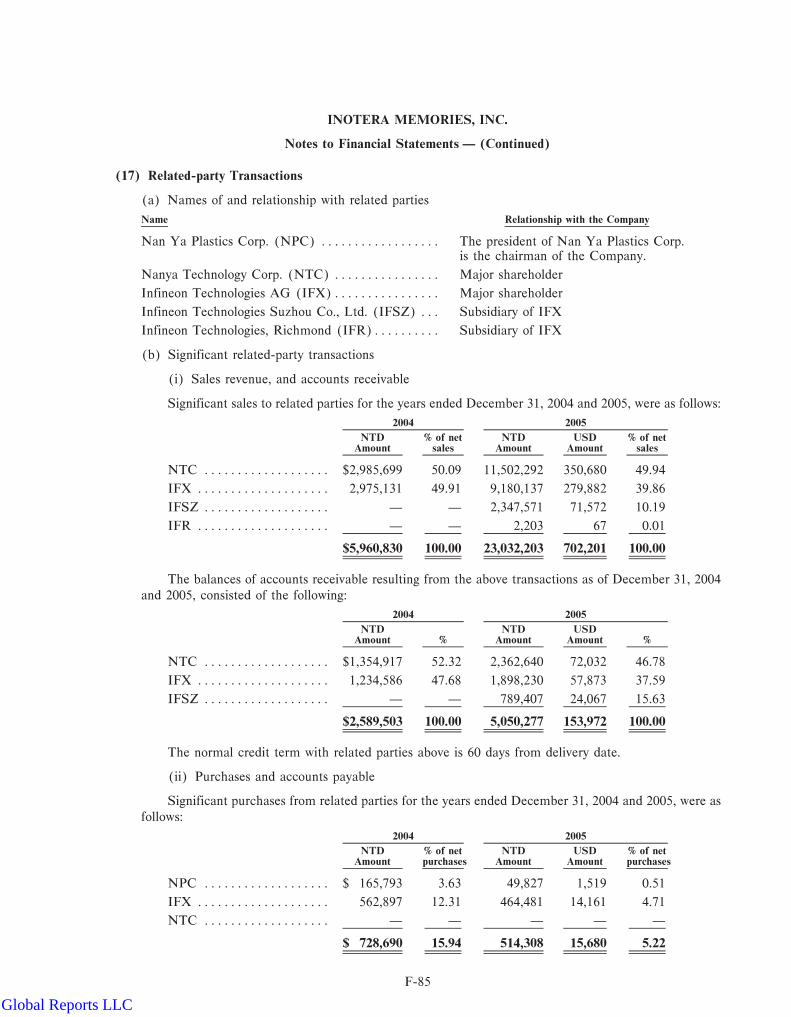
INOTERA MEMORIES, INC.
Notes to Financial Statements Ì (Continued)
(17) Related-party Transactions
(a) Names of and relationship with related parties
Name Relationship with the Company
Nan Ya Plastics Corp. (NPC) ÏÏÏÏÏÏÏÏÏÏÏÏÏÏÏÏÏÏ The president of Nan Ya Plastics Corp.is the chairman of the Company.
Nanya Technology Corp. (NTC) ÏÏÏÏÏÏÏÏÏÏÏÏÏÏÏÏ Major shareholder
Infineon Technologies AG (IFX)ÏÏÏÏÏÏÏÏÏÏÏÏÏÏÏÏ Major shareholder
Infineon Technologies Suzhou Co., Ltd. (IFSZ) ÏÏÏ Subsidiary of IFX
Infineon Technologies, Richmond (IFR)ÏÏÏÏÏÏÏÏÏÏ Subsidiary of IFX
(b) Significant related-party transactions
(i) Sales revenue, and accounts receivable
Significant sales to related parties for the years ended December 31, 2004 and 2005, were as follows:
2004 2005
NTD % of net NTD USD % of netAmount sales Amount Amount sales
NTC ÏÏÏÏÏÏÏÏÏÏÏÏÏÏÏÏÏÏÏ $2,985,699 50.09 11,502,292 350,680 49.94
IFX ÏÏÏÏÏÏÏÏÏÏÏÏÏÏÏÏÏÏÏÏ 2,975,131 49.91 9,180,137 279,882 39.86
IFSZ ÏÏÏÏÏÏÏÏÏÏÏÏÏÏÏÏÏÏÏ Ì Ì 2,347,571 71,572 10.19
IFR ÏÏÏÏÏÏÏÏÏÏÏÏÏÏÏÏÏÏÏÏ Ì Ì 2,203 67 0.01
$5,960,830 100.00 23,032,203 702,201 100.00
The balances of accounts receivable resulting from the above transactions as of December 31, 2004
and 2005, consisted of the following:
2004 2005
NTD NTD USDAmount % Amount Amount %
NTC ÏÏÏÏÏÏÏÏÏÏÏÏÏÏÏÏÏÏÏ $1,354,917 52.32 2,362,640 72,032 46.78
IFX ÏÏÏÏÏÏÏÏÏÏÏÏÏÏÏÏÏÏÏÏ 1,234,586 47.68 1,898,230 57,873 37.59
IFSZ ÏÏÏÏÏÏÏÏÏÏÏÏÏÏÏÏÏÏÏ Ì Ì 789,407 24,067 15.63
$2,589,503 100.00 5,050,277 153,972 100.00
The normal credit term with related parties above is 60 days from delivery date.
(ii) Purchases and accounts payable
Significant purchases from related parties for the years ended December 31, 2004 and 2005, were as
follows:
2004 2005
NTD % of net NTD USD % of netAmount purchases Amount Amount purchases
NPC ÏÏÏÏÏÏÏÏÏÏÏÏÏÏÏÏÏÏÏ $ 165,793 3.63 49,827 1,519 0.51
IFX ÏÏÏÏÏÏÏÏÏÏÏÏÏÏÏÏÏÏÏÏ 562,897 12.31 464,481 14,161 4.71
NTC ÏÏÏÏÏÏÏÏÏÏÏÏÏÏÏÏÏÏÏ Ì Ì Ì Ì Ì
$ 728,690 15.94 514,308 15,680 5.22
F-85
Global Reports LLC

INOTERA MEMORIES, INC.
Notes to Financial Statements Ì (Continued)
The balances of accounts payable resulting from the above transactions as of December 31, 2004 and
2005, were as follows:
2004 2005
% of total % of totalaccounts accounts
NTD and notes NTD USD and notesAmount payable Amount Amount payable
NPC ÏÏÏÏÏÏÏÏÏÏÏÏÏÏÏÏÏÏÏÏÏÏÏÏÏÏÏÏÏÏÏÏ $ 88,654 0.98 32,420 988 0.80
IFX ÏÏÏÏÏÏÏÏÏÏÏÏÏÏÏÏÏÏÏÏÏÏÏÏÏÏÏÏÏÏÏÏÏ 42,385 0.47 22,792 695 0.56
NTC ÏÏÏÏÏÏÏÏÏÏÏÏÏÏÏÏÏÏÏÏÏÏÏÏÏÏÏÏÏÏÏÏ Ì Ì Ì Ì Ì
$131,039 1.45 55,212 1,683 1.36
The Company pays NPC on the 15th of the month following the month of purchase, and pays IFX
within 30 days of the invoice date. Purchasing prices and payment terms of purchases from related parties
are not materially different from those of non-related general suppliers.
(iii) Due to related parties
The details of financial borrowing from related parties for the year ended December 31, 2004, were
as follows:
2004
Maximum daily Balance onbalance December 31
Related party NTD NTD Interest rate Interest expense
NTC ÏÏÏÏÏÏÏÏÏÏÏÏÏÏÏÏÏÏÏÏÏÏÏÏÏ $315,500 Ì 2.281-2.849% 68
No financial borrowing was obtained from related parties for the year ended December 31, 2005.
As of December 31 2004, the Company had interest payable of NT$9 to NTC which was accounted
as other payables Ì related parties.
(iv) Acquisition of property, plant and equipment
In May 2005, the Company purchased from NTC six parcels of land numbered 347 and five other
numbers which are located in Hwa-Ya, Kueishan, Taoyuan County for NT$1,575,000. As of Decem-
ber 31, 2005, the Company had fully paid the purchase price.
In June 2005, the Company purchased electronic equipment from NTC for NT$73,827. As of
December 31, 2005, the Company had fully paid the purchase price.
(v) Training expense
NTC and IFX both transferred a number of their employees to the Company to enable the
Company to maintain a sufficient number of high-quality and loyal staff. Consequently, the Company is
required to reimburse NTC and IFX for the loss of their experienced employees an amount equal to
F-86
Global Reports LLC
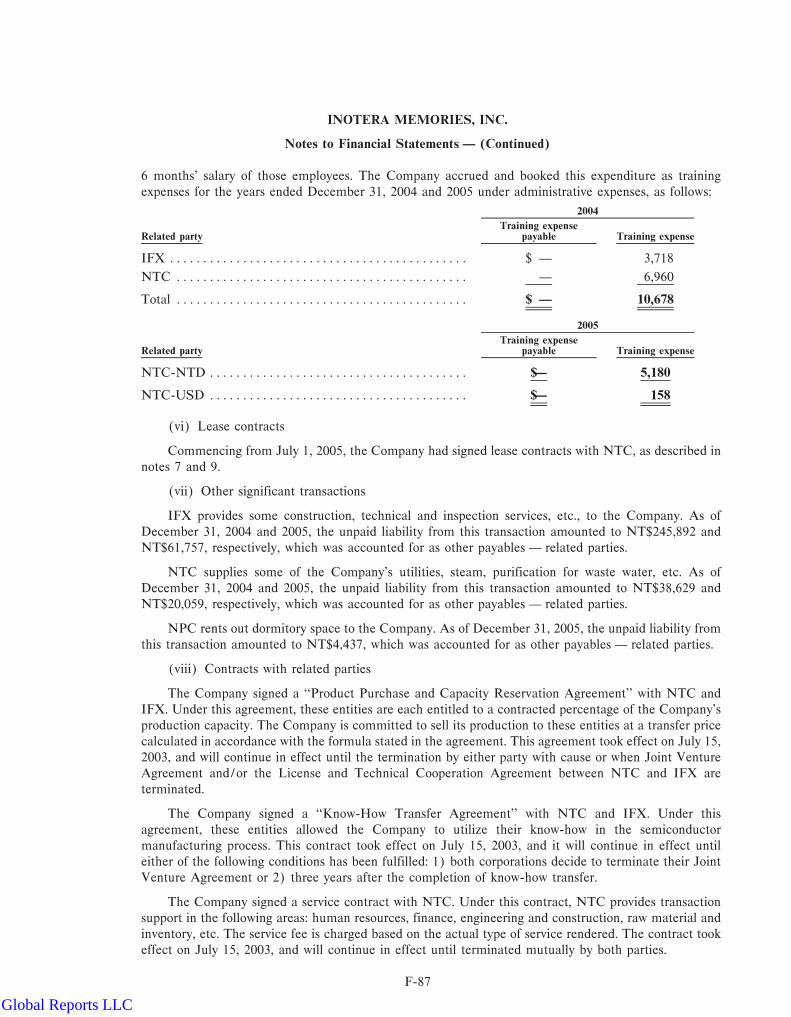
INOTERA MEMORIES, INC.
Notes to Financial Statements Ì (Continued)
6 months' salary of those employees. The Company accrued and booked this expenditure as training
expenses for the years ended December 31, 2004 and 2005 under administrative expenses, as follows:
2004
Training expenseRelated party payable Training expense
IFX ÏÏÏÏÏÏÏÏÏÏÏÏÏÏÏÏÏÏÏÏÏÏÏÏÏÏÏÏÏÏÏÏÏÏÏÏÏÏÏÏÏÏÏÏÏ $ Ì 3,718
NTC ÏÏÏÏÏÏÏÏÏÏÏÏÏÏÏÏÏÏÏÏÏÏÏÏÏÏÏÏÏÏÏÏÏÏÏÏÏÏÏÏÏÏÏÏ Ì 6,960
Total ÏÏÏÏÏÏÏÏÏÏÏÏÏÏÏÏÏÏÏÏÏÏÏÏÏÏÏÏÏÏÏÏÏÏÏÏÏÏÏÏÏÏÏÏ $ Ì 10,678
2005
Training expenseRelated party payable Training expense
NTC-NTD ÏÏÏÏÏÏÏÏÏÏÏÏÏÏÏÏÏÏÏÏÏÏÏÏÏÏÏÏÏÏÏÏÏÏÏÏÏÏÏ $Ì 5,180
NTC-USD ÏÏÏÏÏÏÏÏÏÏÏÏÏÏÏÏÏÏÏÏÏÏÏÏÏÏÏÏÏÏÏÏÏÏÏÏÏÏÏ $Ì 158
(vi) Lease contracts
Commencing from July 1, 2005, the Company had signed lease contracts with NTC, as described in
notes 7 and 9.
(vii) Other significant transactions
IFX provides some construction, technical and inspection services, etc., to the Company. As of
December 31, 2004 and 2005, the unpaid liability from this transaction amounted to NT$245,892 and
NT$61,757, respectively, which was accounted for as other payables Ì related parties.
NTC supplies some of the Company's utilities, steam, purification for waste water, etc. As of
December 31, 2004 and 2005, the unpaid liability from this transaction amounted to NT$38,629 and
NT$20,059, respectively, which was accounted for as other payables Ì related parties.
NPC rents out dormitory space to the Company. As of December 31, 2005, the unpaid liability from
this transaction amounted to NT$4,437, which was accounted for as other payables Ì related parties.
(viii) Contracts with related parties
The Company signed a ""Product Purchase and Capacity Reservation Agreement'' with NTC and
IFX. Under this agreement, these entities are each entitled to a contracted percentage of the Company's
production capacity. The Company is committed to sell its production to these entities at a transfer price
calculated in accordance with the formula stated in the agreement. This agreement took effect on July 15,
2003, and will continue in effect until the termination by either party with cause or when Joint Venture
Agreement and/or the License and Technical Cooperation Agreement between NTC and IFX are
terminated.
The Company signed a ""Know-How Transfer Agreement'' with NTC and IFX. Under this
agreement, these entities allowed the Company to utilize their know-how in the semiconductor
manufacturing process. This contract took effect on July 15, 2003, and it will continue in effect until
either of the following conditions has been fulfilled: 1) both corporations decide to terminate their Joint
Venture Agreement or 2) three years after the completion of know-how transfer.
The Company signed a service contract with NTC. Under this contract, NTC provides transaction
support in the following areas: human resources, finance, engineering and construction, raw material and
inventory, etc. The service fee is charged based on the actual type of service rendered. The contract took
effect on July 15, 2003, and will continue in effect until terminated mutually by both parties.
F-87
Global Reports LLC
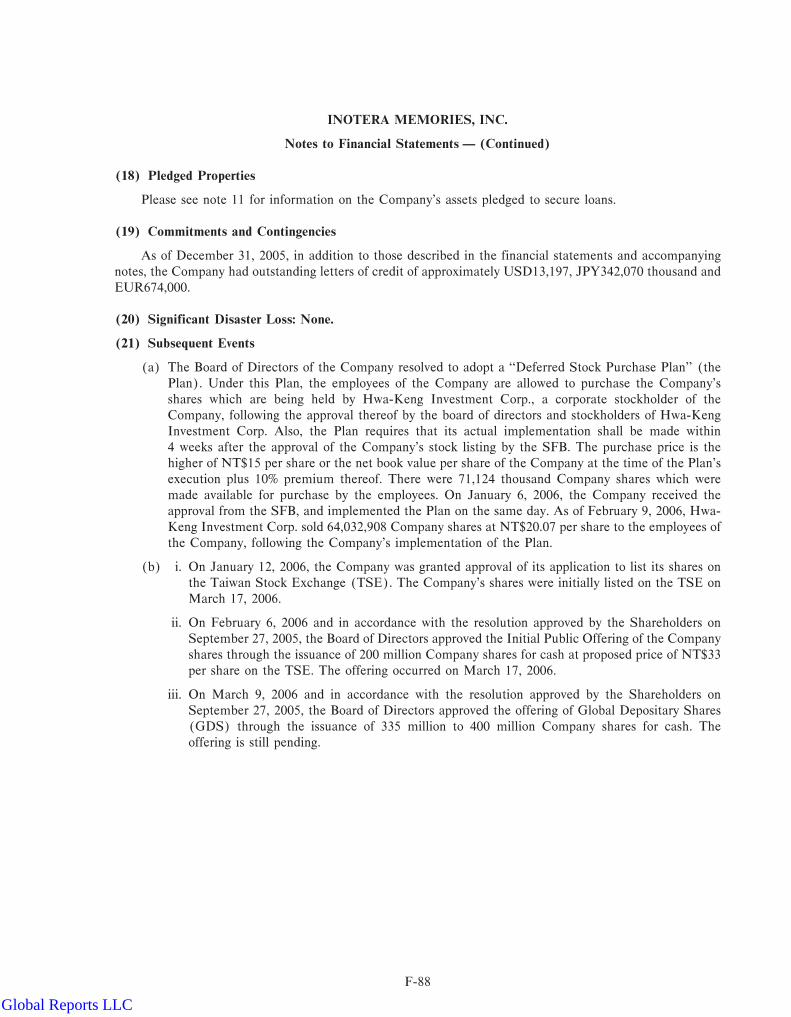
INOTERA MEMORIES, INC.
Notes to Financial Statements Ì (Continued)
(18) Pledged Properties
Please see note 11 for information on the Company's assets pledged to secure loans.
(19) Commitments and Contingencies
As of December 31, 2005, in addition to those described in the financial statements and accompanying
notes, the Company had outstanding letters of credit of approximately USD13,197, JPY342,070 thousand and
EUR674,000.
(20) Significant Disaster Loss: None.
(21) Subsequent Events
(a) The Board of Directors of the Company resolved to adopt a ""Deferred Stock Purchase Plan'' (the
Plan). Under this Plan, the employees of the Company are allowed to purchase the Company's
shares which are being held by Hwa-Keng Investment Corp., a corporate stockholder of the
Company, following the approval thereof by the board of directors and stockholders of Hwa-Keng
Investment Corp. Also, the Plan requires that its actual implementation shall be made within
4 weeks after the approval of the Company's stock listing by the SFB. The purchase price is the
higher of NT$15 per share or the net book value per share of the Company at the time of the Plan's
execution plus 10% premium thereof. There were 71,124 thousand Company shares which were
made available for purchase by the employees. On January 6, 2006, the Company received the
approval from the SFB, and implemented the Plan on the same day. As of February 9, 2006, Hwa-
Keng Investment Corp. sold 64,032,908 Company shares at NT$20.07 per share to the employees of
the Company, following the Company's implementation of the Plan.
(b) i. On January 12, 2006, the Company was granted approval of its application to list its shares on
the Taiwan Stock Exchange (TSE). The Company's shares were initially listed on the TSE on
March 17, 2006.
ii. On February 6, 2006 and in accordance with the resolution approved by the Shareholders on
September 27, 2005, the Board of Directors approved the Initial Public Offering of the Company
shares through the issuance of 200 million Company shares for cash at proposed price of NT$33
per share on the TSE. The offering occurred on March 17, 2006.
iii. On March 9, 2006 and in accordance with the resolution approved by the Shareholders on
September 27, 2005, the Board of Directors approved the offering of Global Depositary Shares
(GDS) through the issuance of 335 million to 400 million Company shares for cash. The
offering is still pending.
F-88
Global Reports LLC
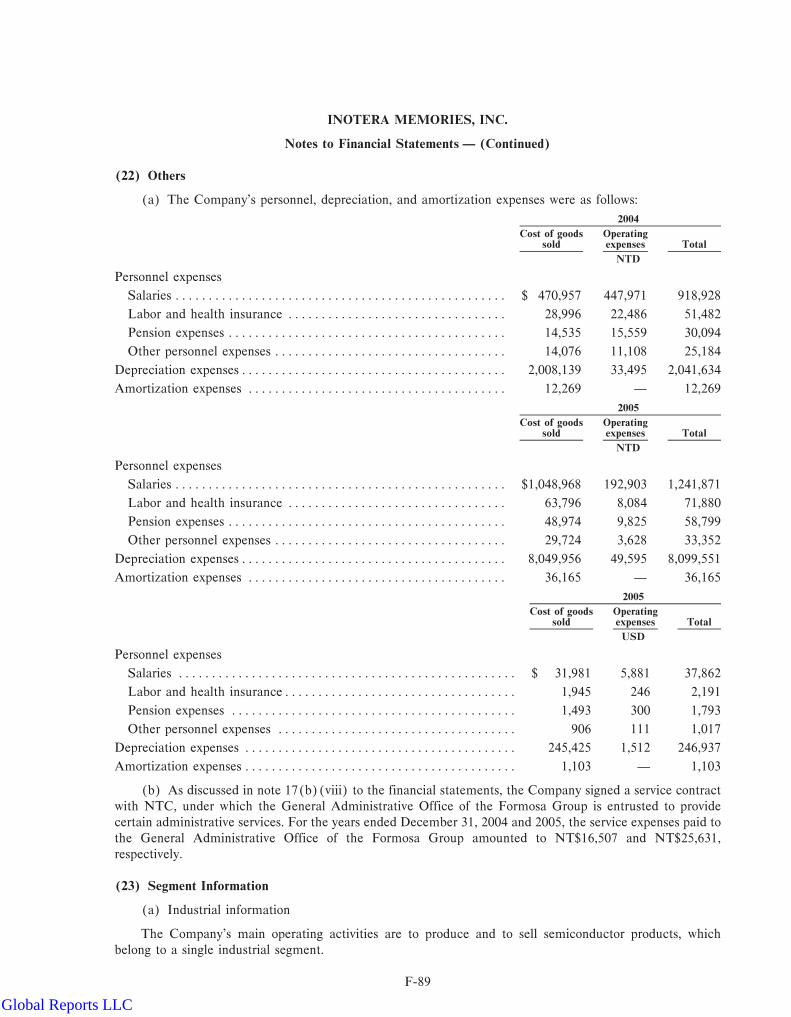
INOTERA MEMORIES, INC.
Notes to Financial Statements Ì (Continued)
(22) Others
(a) The Company's personnel, depreciation, and amortization expenses were as follows:
2004
Cost of goods Operatingsold expenses Total
NTD
Personnel expenses
Salaries ÏÏÏÏÏÏÏÏÏÏÏÏÏÏÏÏÏÏÏÏÏÏÏÏÏÏÏÏÏÏÏÏÏÏÏÏÏÏÏÏÏÏÏÏÏÏÏÏÏÏ $ 470,957 447,971 918,928
Labor and health insurance ÏÏÏÏÏÏÏÏÏÏÏÏÏÏÏÏÏÏÏÏÏÏÏÏÏÏÏÏÏÏÏÏÏ 28,996 22,486 51,482
Pension expenses ÏÏÏÏÏÏÏÏÏÏÏÏÏÏÏÏÏÏÏÏÏÏÏÏÏÏÏÏÏÏÏÏÏÏÏÏÏÏÏÏÏÏ 14,535 15,559 30,094
Other personnel expenses ÏÏÏÏÏÏÏÏÏÏÏÏÏÏÏÏÏÏÏÏÏÏÏÏÏÏÏÏÏÏÏÏÏÏÏ 14,076 11,108 25,184
Depreciation expensesÏÏÏÏÏÏÏÏÏÏÏÏÏÏÏÏÏÏÏÏÏÏÏÏÏÏÏÏÏÏÏÏÏÏÏÏÏÏÏÏ 2,008,139 33,495 2,041,634
Amortization expenses ÏÏÏÏÏÏÏÏÏÏÏÏÏÏÏÏÏÏÏÏÏÏÏÏÏÏÏÏÏÏÏÏÏÏÏÏÏÏÏ 12,269 Ì 12,269
2005
Cost of goods Operatingsold expenses Total
NTD
Personnel expenses
Salaries ÏÏÏÏÏÏÏÏÏÏÏÏÏÏÏÏÏÏÏÏÏÏÏÏÏÏÏÏÏÏÏÏÏÏÏÏÏÏÏÏÏÏÏÏÏÏÏÏÏÏ $1,048,968 192,903 1,241,871
Labor and health insurance ÏÏÏÏÏÏÏÏÏÏÏÏÏÏÏÏÏÏÏÏÏÏÏÏÏÏÏÏÏÏÏÏÏ 63,796 8,084 71,880
Pension expenses ÏÏÏÏÏÏÏÏÏÏÏÏÏÏÏÏÏÏÏÏÏÏÏÏÏÏÏÏÏÏÏÏÏÏÏÏÏÏÏÏÏÏ 48,974 9,825 58,799
Other personnel expenses ÏÏÏÏÏÏÏÏÏÏÏÏÏÏÏÏÏÏÏÏÏÏÏÏÏÏÏÏÏÏÏÏÏÏÏ 29,724 3,628 33,352
Depreciation expensesÏÏÏÏÏÏÏÏÏÏÏÏÏÏÏÏÏÏÏÏÏÏÏÏÏÏÏÏÏÏÏÏÏÏÏÏÏÏÏÏ 8,049,956 49,595 8,099,551
Amortization expenses ÏÏÏÏÏÏÏÏÏÏÏÏÏÏÏÏÏÏÏÏÏÏÏÏÏÏÏÏÏÏÏÏÏÏÏÏÏÏÏ 36,165 Ì 36,165
2005
Cost of goods Operatingsold expenses Total
USD
Personnel expenses
Salaries ÏÏÏÏÏÏÏÏÏÏÏÏÏÏÏÏÏÏÏÏÏÏÏÏÏÏÏÏÏÏÏÏÏÏÏÏÏÏÏÏÏÏÏÏÏÏÏÏÏÏÏ $ 31,981 5,881 37,862
Labor and health insuranceÏÏÏÏÏÏÏÏÏÏÏÏÏÏÏÏÏÏÏÏÏÏÏÏÏÏÏÏÏÏÏÏÏÏÏ 1,945 246 2,191
Pension expenses ÏÏÏÏÏÏÏÏÏÏÏÏÏÏÏÏÏÏÏÏÏÏÏÏÏÏÏÏÏÏÏÏÏÏÏÏÏÏÏÏÏÏÏ 1,493 300 1,793
Other personnel expenses ÏÏÏÏÏÏÏÏÏÏÏÏÏÏÏÏÏÏÏÏÏÏÏÏÏÏÏÏÏÏÏÏÏÏÏÏ 906 111 1,017
Depreciation expenses ÏÏÏÏÏÏÏÏÏÏÏÏÏÏÏÏÏÏÏÏÏÏÏÏÏÏÏÏÏÏÏÏÏÏÏÏÏÏÏÏÏ 245,425 1,512 246,937
Amortization expenses ÏÏÏÏÏÏÏÏÏÏÏÏÏÏÏÏÏÏÏÏÏÏÏÏÏÏÏÏÏÏÏÏÏÏÏÏÏÏÏÏÏ 1,103 Ì 1,103
(b) As discussed in note 17(b)(viii) to the financial statements, the Company signed a service contract
with NTC, under which the General Administrative Office of the Formosa Group is entrusted to provide
certain administrative services. For the years ended December 31, 2004 and 2005, the service expenses paid to
the General Administrative Office of the Formosa Group amounted to NT$16,507 and NT$25,631,
respectively.
(23) Segment Information
(a) Industrial information
The Company's main operating activities are to produce and to sell semiconductor products, which
belong to a single industrial segment.
F-89
Global Reports LLC

INOTERA MEMORIES, INC.
Notes to Financial Statements Ì (Continued)
(b) Geographic information
No geographic information was disclosed because the Company has no foreign operating segments.
(c) Export sales information
Export sales to geographic areas in 2004 and 2005 were summarized as follows:
2004 2005
% of % ofNTD net NTD USD net
Destination area Amount sales Amount Amount sales
Europe ÏÏÏÏÏÏÏÏÏÏÏÏÏÏÏÏÏÏÏÏÏÏÏÏÏÏÏÏÏ $2,975,131 49.91 9,180,137 279,882 39.86
Asia ÏÏÏÏÏÏÏÏÏÏÏÏÏÏÏÏÏÏÏÏÏÏÏÏÏÏÏÏÏÏÏ Ì Ì 2,347,571 71,572 10.19
North America ÏÏÏÏÏÏÏÏÏÏÏÏÏÏÏÏÏÏÏÏÏÏ Ì Ì 2,203 67 0.01
$2,975,131 49.91 11,529,911 351,521 50.06
(d) Major clients
The major clients of the Company for the years 2004 and 2005 were summarized as follows:
2004 2005
% of % ofNTD net NTD USD net
Amount sales Amount Amount sales
NTCÏÏÏÏÏÏÏÏÏÏÏÏÏÏÏÏÏÏÏÏÏÏÏÏÏÏÏÏÏÏ $2,985,699 50.09 11,502,292 350,680 49.94
IFXÏÏÏÏÏÏÏÏÏÏÏÏÏÏÏÏÏÏÏÏÏÏÏÏÏÏÏÏÏÏÏ 2,975,131 49.91 9,180,137 279,882 39.86
IFSZÏÏÏÏÏÏÏÏÏÏÏÏÏÏÏÏÏÏÏÏÏÏÏÏÏÏÏÏÏÏ Ì Ì 2,347,571 71,572 10.19
$5,960,830 100.00 23,030,000 702,134 99.99
(24) Summary of Significant Difference Between Accounting Principles Followed by the Company and
Generally Accepted Accounting Principles in the United States of America
The Company's financial statements have been prepared in accordance with ROC GAAP. ROC GAAP
varies in certain significant respects from accounting principles generally accepted in the United States of
America (""U.S. GAAP''). A brief description of certain significant differences between ROC GAAP and
U.S. GAAP are set out below.
Certain differences which would have a significant effect on the Company's results of operations and
stockholders' equity are as follows:
a. Derivative Financial Instrument Transactions
Under ROC GAAP, there are no specific rules related to accounting for derivative financial
instruments, nor criteria for hedge accounting. Therefore, companies have flexibility in choosing
when to recognize derivative financial instruments and when to follow hedge accounting versus
fair value accounting for such instruments.
U.S. GAAP contains detailed rules as to when hedge accounting is appropriate. As a conse-
quence, certain derivative contracts such as foreign currency forward contracts and interest rate
swaps included in the Company's balance sheet would be recorded at the derivatives contract's
market rate as of the reporting date, resulting in a decrease in other receivables as reported under
the ROC GAAP balance sheet.
F-90
Global Reports LLC

INOTERA MEMORIES, INC.
Notes to Financial Statements Ì (Continued)
b. Bonuses to Employees, Directors and Supervisors
Under the ROC regulations and the Company's Articles of Incorporation, a portion of
distributable earnings should be set aside as bonuses to employees, directors and supervisors.
Bonuses to directors and supervisors are always paid in cash. However, bonuses to employees
may be granted in cash or shares or both. All of these appropriations, including share bonuses
which are valued at par value of NT$10, are charged against retained earnings, after such
appropriations are formally approved by the shareholders in the following year.
Under U.S. GAAP, bonuses and remuneration are generally expensed as services are rendered.
Also under U.S. GAAP, bonuses which are paid in the form of Company shares are recorded
within equity at fair market value, with a corresponding charge to earnings for the difference
between the fair value of the shares at the date of grant and the price paid by the employee, if
any.
c. Surtax
Companies in the ROC are subject to a 10% surtax on undistributed tax basis profits earned after
December 31, 1997. If the undistributed tax earnings are distributed in the following year, the
10% surtax is not due. Under ROC GAAP, income tax expense is recorded in the statement of
operations in the following year if the earnings are not distributed to the shareholders.
Under U.S. GAAP, a 10% surtax leviable on the undistributed tax earnings is recorded in the
statement of income in the year when the profits were earned. The income tax expense, including
the tax effects of temporary differences, in such year is measured by using the rate that includes
this 10% surtax.
d. Capital contribution
Under ROC GAAP, the expatriate employees payroll cost paid by a foreign joint venture
partner/shareholder is not recorded nor treated as the shareholder's capital contribution in the
Company.
Under U.S. GAAP, the expatriate employees payroll cost paid by a foreign joint venture partner
would be recorded as expense and treated as capital contribution in the Company.
e. Lease
Under ROC GAAP, the estimated fair value of a partial leased building used in evaluating the
lease classification described under note 2 (g) to the financial statements can be based on the
proportionate fair value of the entire building.
Under U.S. GAAP, the fair value of a partial lease building used in determining the lease
classification must be based on the specific fair value of the leased asset. In the event that the fair
value of the partial leased building can not be determined, the lease of a partial building should
be treated as an operating lease. As a result, the leased asset described in note 7 to the financial
statements, which was treated as a capital lease under ROC, would be treated as an operating
lease under U.S. GAAP.
f. Related party
Under ROC GAAP, the transaction with the Formosa Group as described in note 22(b) is not
treated as a related party transaction.
Under U.S. GAAP, the transaction would be considered a related party transaction.
g. Earnings per share
Under ROC GAAP, earnings per share in calculated based on the weighted average number of
outstanding shares. The number of outstanding shares is retroactively adjusted for stock
dividends and new common stock issued through unappropriated earnings and capital surplus.
F-91
Global Reports LLC

INOTERA MEMORIES, INC.
Notes to Financial Statements Ì (Continued)
Under U.S. GAAP, when a simple capital structure exists, basic earnings per share is calculated
using the weighted average number of common shares outstanding. The number of outstanding
shares is not retroactively adjusted for stock dividends.
The following reconciles net income and shareholders entity under ROC GAAP as reported in the
audited financial statements to the net income and shareholders' equity amounts determined under
U.S. GAAP, giving effect to adjustments for the difference listed above.
2004 2005
NTD NTD USD
Net incomeÏÏÏÏÏÏÏÏÏÏÏÏÏÏÏÏÏÏÏÏÏÏÏÏÏÏÏÏÏÏÏÏÏÏÏÏÏÏÏÏÏÏÏ $ 901,301 $ 5,929,758 180,785Net income based on ROC GAAPAdjustments:
a. Foreign currency forward contracts-mark-to-marketÏÏÏÏÏ Ì (355,857) (10,849)a. Interest rate swaps-mark-to-market ÏÏÏÏÏÏÏÏÏÏÏÏÏÏÏÏÏÏ (53,763) 75,943 2,315b. Bonuses to employees (24,976) (298,866) (9,112)b. Remuneration to directors and supervisors ÏÏÏÏÏÏÏÏÏÏÏÏ (2,686) (3,736) (114)c. 10% surtax on undistributed tax earningsÏÏÏÏÏÏÏÏÏÏÏÏÏÏ Ì (565,812) (17,250)c. Tax expense ÏÏÏÏÏÏÏÏÏÏÏÏÏÏÏÏÏÏÏÏÏÏÏÏÏÏÏÏÏÏÏÏÏÏÏÏÏÏ 50,725 588,522 17,943d. Expatriate employees payroll cost paid by IFXÏÏÏÏÏÏÏÏÏ (156,076) (168,697) (5,143)e. Operating lease ÏÏÏÏÏÏÏÏÏÏÏÏÏÏÏÏÏÏÏÏÏÏÏÏÏÏÏÏÏÏÏÏÏÏÏ Ì (4,742) (145)
Net decrease in net income ÏÏÏÏÏÏÏÏÏÏÏÏÏÏÏÏÏÏÏÏÏÏÏÏÏÏÏÏÏ (186,776) (733,245) (22,355)Net income based on U.S. GAAPÏÏÏÏÏÏÏÏÏÏÏÏÏÏÏÏÏÏÏÏÏÏÏÏ $ 714,525 $ 5,196,513 158,430Earnings per share ÏÏÏÏÏÏÏÏÏÏÏÏÏÏÏÏÏÏÏÏÏÏÏÏÏÏÏÏÏÏÏÏÏÏÏÏÏ $ 0.41 $ 2.08 0.06
Shareholders' equityShareholders' equity based on ROC GAAPÏÏÏÏÏÏÏÏÏÏÏÏÏÏÏÏ $41,442,152 $47,236,284 1,440,131Adjustments:
a. Foreign currency forward contracts Ì mark-to-market ÏÏ Ì (355,857) (10,849)a. Interest rate swaps Ì mark-to-marketÏÏÏÏÏÏÏÏÏÏÏÏÏÏÏÏ (37,306) 38,637 1,178b. Bonuses to employeesÏÏÏÏÏÏÏÏÏÏÏÏÏÏÏÏÏÏÏÏÏÏÏÏÏÏÏÏÏÏ (24,976) (298,866) (9,112)b. Remuneration to directors and supervisors ÏÏÏÏÏÏÏÏÏÏÏÏ (2,686) (3,736) (114)c. 10% surtax on undistributed tax earningsÏÏÏÏÏÏÏÏÏÏÏÏÏÏ Ì (565,812) (17,250)c. Tax expense ÏÏÏÏÏÏÏÏÏÏÏÏÏÏÏÏÏÏÏÏÏÏÏÏÏÏÏÏÏÏÏÏÏÏÏÏÏÏ 50,725 639,247 19,489d. Expatriate employees payroll cost paid by IFXÏÏÏÏÏÏÏÏÏ (156,076) (324,773) (9,902)d. Contributed capital (net of tax) arising from employees
payroll paid by IFX ÏÏÏÏÏÏÏÏÏÏÏÏÏÏÏÏÏÏÏÏÏÏÏÏÏÏÏÏÏÏÏ 105,351 219,221 6,684e. Operating lease ÏÏÏÏÏÏÏÏÏÏÏÏÏÏÏÏÏÏÏÏÏÏÏÏÏÏÏÏÏÏÏÏÏÏÏ Ì (4,742) (145)
Net decrease in shareholders' equity ÏÏÏÏÏÏÏÏÏÏÏÏÏÏÏÏÏÏÏÏÏÏ (64,968) (656,681) (20,021)
Shareholders' equity based on U.S. GAAP ÏÏÏÏÏÏÏÏÏÏÏÏÏÏÏÏ $41,377,184 $46,579,603 1,420,110
Changes in shareholders' equity based on U.S. GAAPBalance, beginning of year ÏÏÏÏÏÏÏÏÏÏÏÏÏÏÏÏÏÏÏÏÏÏÏÏÏÏÏÏÏÏ $11,957,098 $41,377,184 1,261,500Issuance of common stock ÏÏÏÏÏÏÏÏÏÏÏÏÏÏÏÏÏÏÏÏÏÏÏÏÏÏÏÏÏÏ 28,600,210 Ì ÌBonus to stockholders ÏÏÏÏÏÏÏÏÏÏÏÏÏÏÏÏÏÏÏÏÏÏÏÏÏÏÏÏÏÏÏÏÏÏ Ì (124,883) (3,807)Bonus share issued at a premium to the employees ÏÏÏÏÏÏÏÏÏ Ì 16,919 516Contributed capital (net of tax) arising from employees
payroll paid by IFXÏÏÏÏÏÏÏÏÏÏÏÏÏÏÏÏÏÏÏÏÏÏÏÏÏÏÏÏÏÏÏÏÏÏ 105,351 113,870 3,471Net income for the twelve months ÏÏÏÏÏÏÏÏÏÏÏÏÏÏÏÏÏÏÏÏÏÏÏ 714,525 5,196,513 158,430
Balance, end of year ÏÏÏÏÏÏÏÏÏÏÏÏÏÏÏÏÏÏÏÏÏÏÏÏÏÏÏÏÏÏÏÏÏÏÏ $41,377,184 $46,579,603 1,420,110
F-92
Global Reports LLC

INOTERA MEMORIES, INC.
Notes to Financial Statements Ì (Continued)
A reconciliation of the significant balance sheet accounts to the approximate amounts determined under
U.S. GAAP as of December 31, 2004 and 2005 were as follows:
2004 2005
NTD NTD USD
Current Assets
As reported ÏÏÏÏÏÏÏÏÏÏÏÏÏÏÏÏÏÏÏÏÏÏÏÏÏÏÏÏÏÏÏÏÏÏÏÏÏÏÏÏÏÏÏÏÏÏ $15,881,410 $20,340,339 620,132
U.S. GAAP adjustments
Financial assets-Interest rate swaps ÏÏÏÏÏÏÏÏÏÏÏÏÏÏÏÏÏÏÏÏÏÏÏÏ Ì 38,637 1,178
Financial assets-Foreign currency forward contracts ÏÏÏÏÏÏÏÏÏÏ Ì (355,857) (10,849)
Current portion of lease receivablesÏÏÏÏÏÏÏÏÏÏÏÏÏÏÏÏÏÏÏÏÏÏÏÏ Ì (6,690) (204)
Deferred tax assets Ì current, net ÏÏÏÏÏÏÏÏÏÏÏÏÏÏÏÏÏÏÏÏÏÏÏÏÏ Ì 11,277 344
Other current assetsÏÏÏÏÏÏÏÏÏÏÏÏÏÏÏÏÏÏÏÏÏÏÏÏÏÏÏÏÏÏÏÏÏÏÏÏÏ Ì 2,057 63
As adjustedÏÏÏÏÏÏÏÏÏÏÏÏÏÏÏÏÏÏÏÏÏÏÏÏÏÏÏÏÏÏÏÏÏÏÏÏÏÏÏÏÏÏÏÏÏÏ $15,881,410 $20,029,763 610,664
Property, plant and equipment
As reported ÏÏÏÏÏÏÏÏÏÏÏÏÏÏÏÏÏÏÏÏÏÏÏÏÏÏÏÏÏÏÏÏÏÏÏÏÏÏÏÏÏÏÏÏÏÏ $51,543,552 $66,162,814 2,017,158
U.S. GAAP adjustments
Building and structure ÏÏÏÏÏÏÏÏÏÏÏÏÏÏÏÏÏÏÏÏÏÏÏÏÏÏÏÏÏÏÏÏÏÏÏ Ì 281,538 8,583
Other equipment ÏÏÏÏÏÏÏÏÏÏÏÏÏÏÏÏÏÏÏÏÏÏÏÏÏÏÏÏÏÏÏÏÏÏÏÏÏÏÏ Ì 75,555 2,304
Accumulated depreciationÏÏÏÏÏÏÏÏÏÏÏÏÏÏÏÏÏÏÏÏÏÏÏÏÏÏÏÏÏÏÏÏ Ì (18,414) (561)
As adjustedÏÏÏÏÏÏÏÏÏÏÏÏÏÏÏÏÏÏÏÏÏÏÏÏÏÏÏÏÏÏÏÏÏÏÏÏÏÏÏÏÏÏÏÏÏÏ $51,543,552 $66,501,493 2,027,484
Other Assets
As reported ÏÏÏÏÏÏÏÏÏÏÏÏÏÏÏÏÏÏÏÏÏÏÏÏÏÏÏÏÏÏÏÏÏÏÏÏÏÏÏÏÏÏÏÏÏÏ $ 727,142 $ 854,936 26,065
U.S. GAAP adjustments
Deferred tax assets Ì non-current, net ÏÏÏÏÏÏÏÏÏÏÏÏÏÏÏÏÏÏÏÏÏ Ì 239,512 7,302
Lease Receivables Ì long term ÏÏÏÏÏÏÏÏÏÏÏÏÏÏÏÏÏÏÏÏÏÏÏÏÏÏÏ Ì (338,788) (10,329)
As adjustedÏÏÏÏÏÏÏÏÏÏÏÏÏÏÏÏÏÏÏÏÏÏÏÏÏÏÏÏÏÏÏÏÏÏÏÏÏÏÏÏÏÏÏÏÏÏ $ 727,142 $ 755,660 23,038
Current Liabilities
As reported ÏÏÏÏÏÏÏÏÏÏÏÏÏÏÏÏÏÏÏÏÏÏÏÏÏÏÏÏÏÏÏÏÏÏÏÏÏÏÏÏÏÏÏÏÏÏ $11,996,800 $13,903,989 423,902
U.S. GAAP adjustments
Employees bonus ÏÏÏÏÏÏÏÏÏÏÏÏÏÏÏÏÏÏÏÏÏÏÏÏÏÏÏÏÏÏÏÏÏÏÏÏÏÏÏ 24,976 298,866 9,112
Remuneration to directors and supervisors ÏÏÏÏÏÏÏÏÏÏÏÏÏÏÏÏÏÏ 2,686 3,736 114
10% surtax on undistributed earnings ÏÏÏÏÏÏÏÏÏÏÏÏÏÏÏÏÏÏÏÏÏÏ Ì 282,906 8,625
As adjustedÏÏÏÏÏÏÏÏÏÏÏÏÏÏÏÏÏÏÏÏÏÏÏÏÏÏÏÏÏÏÏÏÏÏÏÏÏÏÏÏÏÏÏÏÏÏ $12,024,462 $14,489,497 441,753
Other Liabilities
As reported ÏÏÏÏÏÏÏÏÏÏÏÏÏÏÏÏÏÏÏÏÏÏÏÏÏÏÏÏÏÏÏÏÏÏÏÏÏÏÏÏÏÏÏÏÏÏ $ 31,332 $ 52,285 1,594
U.S. GAAP adjustments
Other financial liabilities-IRS ÏÏÏÏÏÏÏÏÏÏÏÏÏÏÏÏÏÏÏÏÏÏÏÏÏÏÏÏ 37,306 Ì Ì
As adjustedÏÏÏÏÏÏÏÏÏÏÏÏÏÏÏÏÏÏÏÏÏÏÏÏÏÏÏÏÏÏÏÏÏÏÏÏÏÏÏÏÏÏÏÏÏÏ $ 68,638 $ 52,285 1,594
F-93
Global Reports LLC
SIGNATURES
The registrant hereby certifies that it meets all of the requirements for filing on Form 20-F and that it has
duly caused and authorized the undersigned to sign this annual report on its behalf.
QIMONDA AG
By: /s/ Kin Wah Loh
Name: Kin Wah Loh
Chairman of the Management Board
By: /s/ Dr. Michael Majerus
Name: Dr. Michael Majerus
Member of the Management Board
Date: November 21, 2006
Global Reports LLC
EXHIBIT INDEXExhibit
No. Description
1(i) Articles of Association of Qimonda AG, as amended (English translation).
1(ii)(A) Rules of Procedure for the Management Board of Qimonda AG, as amended (English
translation).
1(ii)(B) Rules of Procedure for the Supervisory Board of Qimonda AG (English translation).
(incorporated by reference to Exhibit 3(ii)(B) of Qimonda AG's Registration Statement on
Form F-1, as amended, filed with the SEC on August 8, 2006).
2 The total amount of long-term debt securities of Qimonda AG authorized under any
instrument does not exceed 10% of the total assets of the group on a consolidated basis.
Qimonda AG hereby agrees to furnish to the SEC, upon its request, a copy of any instrument
defining the rights of holders of long-term debt of Qimonda AG or of its subsidiaries for which
consolidated or unconsolidated financial statements are required to be filed.
4(i)(A) Contribution Agreement (Einbringungsvertrag) between Infineon Technologies AG and
Qimonda AG, dated as of April 25, 2006, and addendum thereto, dated as of June 2, 2006
(English translation). (incorporated by reference to Exhibit 10(i)(A) of Qimonda AG's
Registration Statement on Form F-1, as amended, filed with the SEC on August 8, 2006)
4(i)(B) Contribution Agreement (Einbringungsvertrag) between Infineon Holding B.V. and Qimonda
AG, dated as of May 4, 2006 (English translation). (incorporated by reference to Ex-
hibit 10(i)(B) of Qimonda AG's Registration Statement on Form F-1, as amended, filed with
the SEC on August 8, 2006)
4(i)(C) Trust Agreement between Infineon Technologies AG and Qimonda AG, dated as of April 25,
2006, as amended (English translation).
4(i)(D) Master Loan Agreement between Qimonda AG and Infineon Technologies Holding B.V.,
dated April 28, 2006. (incorporated by reference to Exhibit 10(i)(D) of Qimonda AG's
Registration Statement on Form F-1, as amended, filed with the SEC on August 8, 2006)
4(i)(E) Global Services Agreement between Infineon Technologies AG and Qimonda AG, effective
May 1, 2006. (incorporated by reference to Exhibit 10(i)(E) of Qimonda AG's Registration
Statement on Form F-1, as amended, filed with the SEC on August 8, 2006)
4(i)(F) Multicurrency Revolving Credit Facility Agreement dated July 31, 2006 for Qimonda AG
coordinated by Citigroup Global Markets Limited, Credit Suisse, London Branch, J.P. Morgan
PLC and the other lenders listed therein, with Citibank International PLC acting as agent.
(incorporated by reference to Exhibit 10(i)(F) of Qimonda AG's Registration Statement on
Form F-1, as amended, filed with the SEC on August 8, 2006)
4(i)(G) Joint Venture Agreement between Infineon and Nanya Technology Corporation, executed on
November 13, 2002. (incorporated by reference to Exhibit 10(i)(G) of Qimonda AG's
Registration Statement on Form F-1, as amended, filed with the SEC on August 8, 2006, for
portions of which confidential treatment has been granted)
4(i)(H) Amendments No. 1, 2 and 3 to the Joint Venture Agreement between Infineon and Nanya
Technology Corporation, executed on November 13, 2002. (incorporated by reference to
Exhibit 10(i)(H) of Qimonda AG's Registration Statement on Form F-1, as amended, filed
with the SEC on August 8, 2006, for portions of which confidential treatment has been
granted)
4(i)(I) Amendment No. 4 to the Joint Venture Agreement between Infineon and Nanya Technology
Corporation, executed on November 13, 2002. (incorporated by reference to Exhibit 10(i)(I)
of Qimonda AG's Registration Statement on Form F-1, as amended, filed with the SEC on
August 8, 2006, for portions of which confidential treatment has been granted)
Global Reports LLC

ExhibitNo. Description
4(i)(J) 60nm Technical Cooperation Agreement between Nanya Technology Corporation and In-
fineon Technologies AG for DRAM Process Technology, dated September 29, 2005. ‰,
(incorporated by reference to Exhibit 10(i)(J) of Qimonda AG's Registration Statement on
Form F-1, as amended, filed with the SEC on August 8, 2006, for portions of which
confidential treatment has been granted)
4(i)(K) 110nm License and 90/70nm Technical Cooperation Agreement between Nanya Technology
Corporation and Infineon Technologies AG for DRAM Process Technology, dated Novem-
ber 13, 2002, as amended.‰, ƒ (incorporated by reference to Exhibit 10(i)(K) of Qimonda
AG's Registration Statement on Form F-1, as amended, filed with the SEC on August 8, 2006,
for portions of which confidential treatment has been granted)
4(i)(L) Product Purchase and Capacity Reservation Agreement by and between Hwa-Ya Semiconduc-
tor Inc. (Inotera), Nanya Technology Corporation and Infineon Technologies AG, dated
July 15, 2003, as amended. (incorporated by reference to Exhibit 10(i)(L) of Qimonda AG's
Registration Statement on Form F-1, as amended, filed with the SEC on August 8, 2006, for
portions of which confidential treatment has been granted)
4(i)(M) Product Purchase and Capacity Reservation Agreement by and between Semiconductor
Manufacturing International Corporation, Semiconductor Manufacturing International
(Shanghai) Corporation and Infineon Technologies AG, dated December 4, 2002, as
amended. (incorporated by reference to Exhibit 10(i)(M) of Qimonda AG's Registration
Statement on Form F-1, as amended, filed with the SEC on August 8, 2006, for portions of
which confidential treatment has been granted)
4(i)(N) Product Purchase and Capacity Reservation Agreement 300nm by and between Winbond
Electronics Corporation and Infineon Technologies AG, dated August 6, 2004. (incorporated
by reference to Exhibit 10(i)(N) of Qimonda AG's Registration Statement on Form F-1, as
amended, filed with the SEC on August 8, 2006, for portions of which confidential treatment
has been granted)
4(i)(O) Cooperative Joint Venture Contract between Infineon Technologies China Co., Ltd. and
China-Singapore Suzhou Industrial Park Ventures Co., Ltd., dated July 28, 2003, as amended.
(incorporated by reference to Exhibit 10(i)(O) of Qimonda AG's Registration Statement on
Form F-1, as amended, filed with the SEC on August 8, 2006, for portions of which
confidential treatment has been granted)
4(i)(P) Settlement and License Agreement by and among Rambus Inc., Infineon, Infineon Technolo-
gies North America Corp. and Infineon Technologies Holding North America Inc., dated as of
March 21, 2005. (incorporated by reference to Exhibit 10(i)(P) of Qimonda AG's Registra-
tion Statement on Form F-1, as amended, filed with the SEC on August 8, 2006, for portions of
which confidential treatment has been granted)
4(i)(Q) Master IT Cost Sharing Agreement by and between Infineon Technologies AG and Qimonda
AG, effective May 1, 2006. (incorporated by reference to Exhibit 10(i)(Q) of Qimonda AG's
Registration Statement on Form F-1, as amended, filed with the SEC on August 8, 2006
4(i)(R) License Agreement between Tessera, Inc. and Qimonda AG, dated August 1, 2006. (incorpo-
rated by reference to Exhibit 10(i)(R) of Qimonda AG's Registration Statement on
Form F-1, as amended, filed with the SEC on August 8, 2006, for portions of which
confidential treatment has been granted)
4(i)(S) Eleventh Amendment to License and Technical Cooperation Agreement dated November 13,
2002 and First Amendment to 60nm Technical Cooperation Agreement dated September 29,
2005, both between Nanya Technology Corporation and Infineon Technologies AG. (incorpo-
rated by reference to Exhibit 10(i)(S) of Qimonda AG's Registration Statement on Form F-1,
as amended, filed with the SEC on August 8, 2006)
Global Reports LLC

ExhibitNo. Description
4(i)(T) Twelfth Amendment to License and Technical Cooperation Agreement dated November 13,
2002 between Nanya Technology Corporation and Infineon Technologies AG, for portions of
which confidential treatment has been requested.
4(i)(U) Addenda No. 6 and 7 to Product Purchase and Capacity Reservation Agreement by and
between Semiconductor Manufacturing International Corporation, Semiconductor Manufac-
turing International (Shanghai) Corporation and Infineon Technologies AG, dated Decem-
ber 4, 2002, for portions of which confidential treatment has been requested.
4(i)(V) First Addendum to Product Purchase and Capacity Reservation Agreement 300mm by and
between Winbond Electronics Corporation and Infineon Technologies AG, dated August 6,
2004, for portions of which confidential treatment has been requested.
4(i)(W) Addenda No. 2 and 3 to Contribution Agreement (Einbringungsvertrag) between Infineon
Technologies AG and Qimonda AG, dated as of April 25, 2006 (English Translation).
8 List of Significant Subsidiaries and Associated Companies of Qimonda AG as defined in
Rule 1-02(w) of Regulation S-X: See ""Additional Information Ì Group Structure Ì Signifi-
cant Subsidiaries.''
12(i) Certification pursuant to Section 302 of the Sarbanes-Oxley Act.
12(ii) Certification pursuant to Section 302 of the Sarbanes-Oxley Act.
13 Certification pursuant to Section 906 of the Sarbanes-Oxley Act.
15 Articles of Association of Inotera Memories, Inc., amended as of June, 7 2006 (incorporated
by reference to Exhibit 99(A) of Qimonda AG's Registration Statement on Form F-1, as
amended, filed with the SEC on August 8, 2006)
‰ Eleventh Amendment to 110nm License and 90/70nm Technical Cooperation Agreement and First Amendment to 60nmTechnical Cooperation Agreement were filed as Exhibit 10(i)(S) to Qimonda AG's Registration Statement on Form F-1, asamended, filed with the SEC on August 8, 2006.
ƒ Twelfth Amendment to 110nm License and 90/70nm Technical Cooperation Agreement is filed as Exhibit 4(i)(T) to thisAnnual Report on Form 20-F.
Global Reports LLC

[THIS PAGE INTENTIONALLY LEFT BLANK]
Global Reports LLC

Global Reports LLC

Qimonda AG Annual Report 2006 on Form 20-F
Rücken
www.qimonda.com
Rücken
Qim
onda
AG –
Ann
ual Re
port
2006
on
Form
20-
F
06109_AnnualReport2006_rz 22.11.2006 14:08 Uhr Seite 1
Global Reports LLC


