The Determinants of Capital Structure: Capital Market Oriented versus Bank Oriented Institutions Antonios Antoniou, Yilmaz Guney, and Krishna Paudyal * Forthcoming: Journal of Financial and Quantitative Analysis * A. Antoniou, [email protected], Centre for Empirical Research in Finance, Durham Business School, Durham University, Mill Hill Lane, Durham, DH1 3LB; Y. Guney, [email protected], University of Hull, Hull, HU6 7RX; K. Paudyal, [email protected], Centre for Empirical Research in Finance, Durham Business School, Durham University, Mill Hill Lane, Durham, DH1 3LB. This is a revised and extended version of previous working paper circulated under the title ‘Determinants of Corporate Capital Structure: Evidence from European Countries’. We would like to thank Paul H. Malatesta (the managing editor) and an anonymous referee for very helpful comments and suggestions. We also like to thank Gioia Pescetto for valuable comments. Any remaining errors are our own.
Transcript
The Determinants of Capital Structure: Capital Market Oriented versus Bank Oriented Institutions
Antonios Antoniou, Yilmaz Guney, and Krishna Paudyal*
Forthcoming: Journal of Financial and Quantitative Analysis
* A. Antoniou, [email protected], Centre for Empirical Research in Finance, Durham Business School, Durham University, Mill Hill Lane, Durham, DH1 3LB; Y. Guney, [email protected], University of Hull, Hull, HU6 7RX; K. Paudyal, [email protected], Centre for Empirical Research in Finance, Durham Business School, Durham University, Mill Hill Lane, Durham, DH1 3LB. This is a revised and extended version of previous working paper circulated under the title ‘Determinants of Corporate Capital Structure: Evidence from European Countries’. We would like to thank Paul H. Malatesta (the managing editor) and an anonymous referee for very helpful comments and suggestions. We also like to thank Gioia Pescetto for valuable comments. Any remaining errors are our own.
The Determinants of Capital Structure: Capital Market Oriented versus Bank Oriented Institutions
Abstract
The paper investigates how firms operating in capital market oriented economies (the United Kingdom
and the United States) and bank oriented economies (France, Germany and Japan) determine their capital
structure. Using panel data and a two-step system-GMM procedure, the paper finds that the leverage
ratio is positively affected by the tangibility of assets and the size of the firm, but declines with an
increase in firm profitability, growth opportunities and share price performance in both types of
economies. The leverage ratio is also affected by the market conditions in which the firm operates. The
degree and effectiveness of these determinants are dependent on the country’s legal and financial
traditions. The results also confirm that firms have target leverage ratios, with French firms being the
quickest in adjusting their capital structure towards their target level, and the Japanese are the slowest.
Overall, the capital structure of a firm is heavily influenced by the economic environment and its
institutions, corporate governance practices, tax systems, the borrower-lender relationship, exposure to
capital markets, and the level of investor protection in the country in which the firm operates.
The Determinants of Capital Structure: Capital Market Oriented versus Bank Oriented Institutions
I. Introduction
In spite of extensive research, Myers’ (1984) classic question “How do firms choose their capital
structure?” remains unanswered. The trade-off theory postulates that optimal capital structure involves
balancing the corporate tax advantages of debt financing against the costs of financial distress that arise
from bankruptcy risks (Kraus and Litzenberger, 1973) and agency costs (Jensen and Meckling, 1976).
The empirical support for this theory, however, is far from conclusive. For instance, while Bradley,
Jarrel and Kim (1984) find no clear evidence, Trezevant (1992) find support for this theory. The
inclusion of personal taxation (Miller, 1977) and non-debt tax shields (DeAngelo and Masulis, 1980) has
made the debate even more complex. Later, in the early 1980s theories based on asymmetric information
joined the debate (Myers, 1984).
The pecking order theory based on informational asymmetry suggests that firms do not have
leverage targets. They use debt only when retained earnings are insufficient and raise external equity
capital only as a last resort. More recent models of capital structure choice include ‘windows of
opportunity’ and ‘managerial optimism’ (Heaton, 2002). Baker and Wurgler (2002) suggest that
managers could minimize the cost of capital by timing the market (issuing equity when share prices
increase) implying that market conditions influence the pecking order. However, Hovakimian (2006)
shows that the timing of equity issuance does not have any significant long-lasting impact on capital
structure. In a quest for the factors that managers consider in deciding the financing mix of a firm, many
studies have examined the role of several firm-specific factors. In a review article, Harris and Raviv
(1991) report that leverage is positively related to non-debt tax shields, firm size, asset tangibility, and
investment opportunities, while it is inversely related to bankruptcy risk, research and development
expenditure, advertising expenditure, and firm’s uniqueness. In general, major studies so far have
analyzed the role of firm-specific factors that represent taxation, agency costs and information
asymmetries.
Previous studies have left at least two major gaps in the literature. Firstly, there are virtually no
studies dedicated to the analysis of the implications of the financial orientation of the economy.1
1 Nearest to this study is Rajan and Zingales (1995) who report international evidence and pave the way for
comparative analysis of capital structure decisions in various countries. However, no study, to our knowledge,
2
However, an understanding of the implications of the traditions of capital market oriented and bank
oriented economies on the capital structure decision is important because they have direct implications
on the sources of funds available to the corporate sector. It is particularly important in the light of extant
literature that shows the environment in which the firms operate differs across countries (see, for
instance, Ball, Kothari and Robin, 2000). Therefore, the lessons learned from one environment cannot be
generalized to countries with different legal and institutional traditions.2 This paper bridges this gap by
analyzing the determinants of capital structure in the G5 countries, which have different financial and
institutional traditions. These countries include examples of capital market oriented economies with high
transparency and investor protection, the U.S.A. and the U.K., and bank oriented economies with lower
transparency and investor protection, France, Germany and Japan.
Secondly, empirical studies generally concentrate on identifying the firm specific factors that
managers should consider in making the capital structure choice, while they ignore the possible
implications of macroeconomic conditions that could affect the choice of financing mix. This paper
controls for the possible implications of such factors on capital structure decisions. In addition, it is
apparent that the role and strength of factors influencing firms’ capital structure decisions do change over
time. Hence, a cross sectional analysis of leverage ratios alone would not be sufficient for a clear
understanding of the dynamic aspects of its determinants. It is important to analyze whether corporations
react to new circumstances that occur in financial markets and how quickly they revert to their target
capital structure when moved away by random events. Thus, this paper extends the literature by
incorporating a more dynamic perspective on models of leverage. This is achieved by analyzing panel
data using a two-step system-GMM procedure.3
explicitly compares the cases of bank oriented and capital market oriented economies and incorporates a
comprehensive set of possible determinants as the model in the paper. 2 Examples of such differences include companies operating in capital market oriented economies (such as the
U.S.A. and the U.K.) are known to have lower level of leverage than firms operating in bank based economies
(such as Japan and Germany). Agency costs and indirect bankruptcy costs are also known to be higher in Anglo-
Saxon countries due to arms’ length relation between creditors and borrowers (Edward and Nibler, 2000).
Therefore, the role and strength of various determinants of leverage are likely to depend on the economic
environment of the country in which the firms operate. 3 Studies that examine some form of dynamic perspective in capital structure include Fischer, Heinkel and Zechner
(1989) and Marsh (1982).
3
The results reveal considerable similarities and differences in the determinants of capital
structures of firms operating in capital market oriented and bank oriented economies.4 A positive effect
of firm size and inverse impact of growth opportunities, term-structure of interest rates and share price
performance on leverage is found in all sample countries. However, the impacts of asset tangibility,
equity premium, profitability and the effective tax rate vary across countries, suggesting that differences
in their institutional arrangements and traditions may contribute to the capital structure decisions of
firms. The factors that were identified in earlier studies are found to be more relevant for firms operating
in capital market oriented economies than for firms operating in bank oriented economies. These
findings confirm that: (i) the lessons learned from the experience of a particular type of economy cannot
necessarily be generalized to firms operating in other types of economies; and (ii) in deciding on a firm’ s
financing mix, managers consider not only firm specific factors but also general market conditions.
Finally, firms appear to have target leverage ratios but the speed at which they adjust their capital
structure towards the target varies by country, with French firms being the fastest and Japanese the
slowest.
The rest of the paper is organized as follows. The next section identifies the factors that affect
the capital structure choice of firms and develops the hypotheses. The sample, estimation methods and
their robustness are discussed in section 3. Section 4 analyzes the empirical results. Finally, section 5
concludes the paper.
II. Theories and Hypotheses Development
Based on the institutional set-ups and economic traditions, the sample countries are grouped into
two categories, namely capital market oriented (the United States and the United Kingdom) and bank
oriented (Germany, Japan and France).5 This section identifies the firm specific factors and the market
4 Whilst there are several merits in comparing international experiences, as correctly noted by Rajan and Zingales
(1995), comparisons of firm-level accounting data across countries are not free from limitations. Although the
harmonization in accounting standards and practices has improved in recent years and Datastream (our data source)
attempts to standardize company accounts to facilitate international comparisons, the comparability problems
cannot be undermined. Therefore, the results should be interpreted with some caution. 5 Table 1 summarises the major institutional factors in sample countries. For most legal and institutional provisions
the United States and Germany represent the two extremes of the spectrum. Therefore, the role of various factors
and the magnitude of their effects on capital structure choice of firms is likely to vary across the countries and more
so between the United States and Germany. A comparative analysis of institutional set-ups in sample countries is
available in the working paper version of the paper.
4
related factors (control variables) that are potentially responsible for determining the leverage ratio of a
firm. To examine the robustness of the results, two different measures of leverage are used, namely
book-leverage and market leverage. All variables used in this study, namely dependent, explanatory and
control variables, are defined in Appendix B.
A. Firm Characteristics and Leverage
Several studies have examined the role of firm specific factors on the capital structure decision.6
Both the pecking order and the free cash-flow theories suggest that a firm’ s profitability affects its
financing mix. The former states that firms prefer to finance new investments from retained earnings and
raise debt capital only if internal resources are insufficient, while issuing equity is the least favored
option. As the ability to retain earnings depends on profitability, we expect an inverse relation between
leverage and profitability. Rajan and Zingales (1995), among others, empirically confirm this prediction.
Jensen (1986) shows that agency costs increase with free cash flow. However, debt may reduce the
agency cost of free cash flow by ensuring that managers are disciplined, make efficient investment
decisions, and do not pursue individual objectives as this increases bankruptcy risk (Harris and Raviv,
1990). Increases in debt ratio also signal quality, and that lenders are prepared to lend. Therefore, the
free cash flow theory implies a positive relation between leverage and profitability. In order to avoid the
dilution of their ownership structure, closely held or family owned firms prefer not to raise external
equity. The firms in bank-based countries (especially Germany and France) are closely held, while the
corporate ownership in market-based nations is less concentrated (Table 1). Therefore, we expect a
stronger effect of profitability on the capital structure of the firms operating in continental European
nations than those operating in the Anglo-Saxon countries.
Table 1 about here
A negative relationship is expected between growth opportunities and leverage for two main
reasons. Firstly, according to the trade-off theory, the cost of financial distress increases with expected
growth forcing the managers to reduce the debt in their capital structure. Secondly, in the presence of
information asymmetries, firms issue equity, instead of debt, when overvaluation leads to higher
expected growth. However, internal resources of growing firms may not be sufficient to finance their
positive NPV investment opportunities and hence they may have to raise external capital. If firms require
6 Appendix C summarizes the relationship between capital structure and its determinants found in the literature.
5
external finance, they issue debt before equity according to the pecking order theory. In this case, growth
opportunities should be positively associated with leverage. Due to the differences in disclosure practices
and lender-borrower relations in the companies operating in bank-based and market-based countries, the
role of growth opportunities is likely to vary across nations. It is anticipated that growth opportunity
should have a stronger negative coefficient in capital market oriented economies than in bank oriented
economies.
In the case of bankruptcy, tangible assets are more likely to have a market value, while
intangible assets will lose their value. Therefore, the risk of lending to firms with higher tangible assets
is lower and hence lenders will demand a lower risk premium. Furthermore, a firm’ s opportunity to
engage in asset substitution can be reduced by secured debt (Stulz and Johnson, 1985), which reduces
agency costs and hence the cost of borrowing. This suggests a positive relationship between leverage and
the tangibility of assets. Since the need for collateral is more pronounced in traditional bank lending, the
role of asset tangibility is expected to be more prominent in bank oriented economies. It is generally
accepted that firm size is an inverse proxy of the probability of bankruptcy and hence larger firms have
higher debt capacity and may borrow more to maximize their tax benefits. Due to lower information
asymmetry, larger firms are likely to have easier access to debt markets, and be able to borrow at lower
cost, irrespective of the type of economy’ s orientation, bank or market. Therefore, a positive relation is
anticipated between leverage and firm size in all countries.
The gains from borrowing increase with the rate of tax. Therefore, a positive relationship
between the effective tax rate and leverage is expected. However, the implication of tax on capital
structure choice depends upon the tax policy objectives especially when the tax system is designed to
favor the retention of earnings against dividend payout, or vice versa. For instance, the German tax
system favors payout against retention, discouraging internal equity. Similarly, the split rate system of
Japan favors dividends against retention. On the other hand, the French system encourages retention,
reducing the need for external finance. Until 1997 the British tax system favored dividend payments,
especially when the shares were owned by tax exempt institutions. Thus, the importance of this factor to
corporate managers should vary across nations. The trade-off theory implies that a major borrowing
incentive is the tax advantage of interest payment. However, DeAngelo and Masulis (1980) argue that
tax deductions for depreciation and investment tax credits can be considered as substitutes for tax
benefits of debt financing. These features can lead to a market equilibrium, where each firm has an
interior optimal leverage. Accordingly, firms with higher amount of non-debt tax shields will have lower
debt levels. Therefore, firms’ motivation to borrow declines with increase in non-debt tax shields.
Firms with high earnings volatility carry a risk of earnings level dropping below their debt
servicing commitments. Such eventuality may result in rearranging the funds at high cost or face
6
bankruptcy risk. Therefore, firms with highly volatile earnings should have lower debt capital. This
particularly holds for firms operating in capital market oriented economies with arms-length relations
between lenders and borrowers. However, firms operating in bank oriented markets have close ties with
lenders. This, in turn, reduces the effective costs of failure to service debt. Therefore, the American and
the British firms are expected to be more concerned with earnings volatility than their German and
Japanese counterparts.
The dividend payout ratio is likely to play a prominent role in the financing-mix decision mainly
because of market imperfections.7 Based on agency and transactions costs arguments Rozeff (1982)
predicts an inverse relation between dividend payout and leverage. On the other hand, Chang and Rhee
(1990) theoretically prove and empirically confirm that when the effective capital gain tax rate is lower
than the dividend tax rate, firms with high payout ratios are likely to borrow more than firms with low
payout ratio. However, if increased dividends signal increased future earnings then the firm’ s cost of
equity will be lower, favoring equity to debt. This implies a negative relation between leverage and
payout ratio. The effect of dividend policy on capital structure is also likely to be influenced by country
specific institutional factors that are beyond the control of the firm. For instance, owing to dispersed
share ownership the signaling value of dividend should be higher in the U.S. and the U.K. than in
Germany, France and Japan where share ownership is concentrated and/or firms have close ties with
their lenders. Moreover the tax provisions affect the payout policy, which in turn affects the financing
mix. Thus, the direction and significance of the relation between financing mix and payout policy should
depend on the net impact of information asymmetries, agency costs, ownership structure, and tax laws of
the country in which the firm is operating.
Share price performance is another factor that mangers are likely to consider while making a
capital structure decision. Information asymmetries between managers and outside investors force
managers to sell equity at a discount according to the pecking order theory. Managers offer such a
discount when the benefit of raising external equity capital outweighs the cost of the discount. When
shares are overvalued a discount could be offered without any real loss in the wealth of existing
shareholders. This is possible if equity is issued after an increase in share price due to overvaluation.
This suggests an inverse relationship between share price performance and leverage ratio. However, such
an inverse relationship with market leverage may be observed due to statistical distortions as the market
value of equity increases with the increase in share price even if there has not been any further equity
issue. But, the book leverage ratio is independent of this effect. Therefore, the effects on these two
7 It is also possible that the dividend payout is endogenous to the capital structure decision. We control for such
possibility in our empirical models.
7
measures taken together should reveal the cause and the nature of the relationship between leverage and
changes in share price.
B. Control Variables
If a firm requires external capital at the time of high market equity premium the managers are
likely to opt for debt. This suggests a positive relationship between leverage ratio and market equity
premium. However, if the observed high equity premium is due to overconfidence of investors driving
equity prices up, the managers are likely to issue equity. This indicates an inverse relation between
equity premium and leverage. Therefore, the effect of equity premium on leverage depends on the source
of variation in equity premium. At times when long-term interest rates are expected to rise, managers are
less likely to opt for debt. Thus, the term structure of interest rate is expected to have an inverse relation
with the level of leverage. Due to their private interests, managers do not want their company to be
acquired and hence look for ways to deter a potential predator. Agency theory based models (for
example, Jensen 1986) suggest that firms with surplus debt capacity may become potential targets. To
avoid such risk, managers are likely to borrow more when the market for mergers and acquisitions, M&A
activity, is particularly active. This suggests a positive relation between book-leverage and M&A
activity. However, M&A activity is positively related to booming stock markets, and when stock markets
are booming a firm’ s market leverage declines due to an increase in the market value of its equity. This
counteracts the expected positive relationship just stated. Therefore, the sign of the coefficient of M&A
activity is dependent on both the measure of leverage, and the strength of the effect.
C. Target Leverage and Speed of Adjusting
The trade off theory suggests that firms have a target capital structure and managers adjust the
ratios towards this target. The speed of adjustment depends on the cost of adjustment relative to the cost
of being off target (see, Hovakimian, Opler and Titman, 2001). An examination of the effect of a one
period lagged leverage on the current leverage should shed light on whether firms have a target capital
structure and, if so, what is the speed of adjustment. A positive and below unity coefficient would
suggest that firms have a target leverage ratio and revise their capital structure overtime. A coefficient
greater than one implies that firms do not have any target debt-equity ratio.
8
III. Sample and Methodology A. The Sample
The selection of sample countries is motivated by the existence of distinct financial and
institutional traditions prevailing in the five major economies of the world – France, Germany, Japan, the
United Kingdom and the United States. On the basis of their financial and institutional traditions, these
countries could be categorized into two groups: (i) market-based economies (the United States and the
United Kingdom), and (ii) bank-based economies (Germany, Japan and France). These two groups also
coincide with the split between common law and code law countries, respectively. The sample comprises
of all non-financial firms, including dead firms, traded in the major stock exchanges of the sample
countries. The choice of sample period, from 1987 to 2000, is guided by the availability of data and the
objective of maintaining the same period for all countries to allow for comparability. We use dynamic
models of estimation that require at least three consecutive annual observations. Furthermore, at least
five consecutive observations are required for diagnostics to be robust (see Arellano and Bond, 1991).
Therefore, firms with less than five consecutive annual observations and missing variables are excluded
from the sample. The final sample is comprised of 4,854 firms (244 French, 479 German, 1,442
Japanese, 1,562 British and 1,127 American) with 57,134 firm-year observations (2,513 for France,
5,744 for Germany, 18,963 for Japan, 16,363 for the UK and 13,551 for the US).8
Unless otherwise stated, all data are obtained from Datastream. Data on Mergers & Acquisitions
activities in each country are downloaded from SDC platinum (Thomson Financial) database and
measures of corporate governance for each sample country are obtained from La Porta, Lopez-de-
Silanes, Shleifer and Vishny (1997, 1998). Table 2 reveals that, on average, Japanese firms have the
highest book and market leverage ratios, 30.1% and 32.3% respectively, while British firms borrow the
least, 17.9% and 21.3%, respectively. French and American firms follow Japanese firms closely. Among
the Europeans, the relatively higher debt ratios of French and German firms confirm the view that
companies in continental Europe borrow more than British firms. These observations are in line with the
suggestion of Fukuda and Hirota (1996) that firms experiencing a strong main bank relationship have
relatively high leverage ratios. On the other hand, the lower leverage ratios of American and British
firms emphasize the managerial preference for equity capital. Such preference is possibly due to the
dispersed share ownership and the firm’ s arm’ s length relation with their lenders. These observations
indicate that the financial traditions in which the firms operate affect the level of borrowing. Firms
8 See Appendix A for annual distribution of sample firms and observations.
9
operating in a system where the lenders and borrowers have close ties and face lower threat of
bankruptcy borrow more. The standard deviations of the book leverage ratios show that they vary most
across Japanese firms (19.1%), closely followed by German firms (18.9%), while they vary least among
British firms (14.6%).
Table 2 about here
The market leverage ratios of French firms reveal a decreasing trend over the years while their
book leverage ratios remain fairly stable.9 On face value, the decreasing trend in market leverage may
imply that France is moving towards a capital market oriented system. However, on closer observation, it
is likely to be because of the high retention ratio (93.5%). Such strategy increases equity capital without
affecting the ownership distribution. In Japan, the market leverage ratio has increased substantially and
reached 44.8% in 2000 from its lowest level of 19.7% in 1990. Like in France, the book leverage ratio
of Japanese firms has remained stable around 30%. The increasing trends of both measures of leverage
for German firms suggest that they are raising more debt than equity. This further emphasizes the lenders
oriented structure of German corporate sector. Book leverage in the United Kingdom is increasing
steadily, while market leverage has high variability ranging from 15.0% in 1987, to 27.9% in 1990 and
23.8% in 2000. Such a high variation in market leverage could be attributed to the changes in market
capitalization reflecting the fluctuations in the stock markets. Yet, the overall leverage ratio in the United
Kingdom is lower than is other countries implying the importance of equity over debt financing. In
contrast, both leverage ratios of U.S. firms are showing an increasing trend. The book (market) leverage
ratio has increased from 25.7% (28.3%) in 1987 to 29.6% (32.0%) in 2000. In line with British firms, the
market leverage ratios of American firms display a high variation corresponding to the fluctuations in
stock market.
Consistent with the predictions of the pecking order theory, the correlation analysis reveals a
negative association between both measures of leverage and profitability in all countries (not reported in
table). Consistent with the theoretical reasons discussed in the previous section, the association between
leverage and market-to-book ratio is negative in all cases. Similarly, except in Germany, both measures
of leverage are found to be positively related to fixed assets and size in all the other countries. However,
while revealing, these univariate analysis cannot provide a complete picture of the relation between the
company features and their leverage ratios. Therefore, we model leverage as a function of several
variables as described in the following sub-sections.
9 In the interest of brevity these estimates are not reported, but are available on request.
10
B. The Model
Leverage is modeled as a function of various firm specific factors. The model controls for
market conditions (see section 2). Panel data are used because this increases the degrees of freedom,
reduces the possibility of collinearity among the explanatory variables, and consequently leads to more
efficient estimates. As discussed by Devereux and Schiantarelli (1990), to construct a complete dynamic
specification that allows for the possible effect of the AR-process on the stochastic term and the
implications of adjustment costs, a one period lagged dependent variable (Yi,t-1) is included in the model.
Consider the autoregressive model:
(1) ittik
itkktiit XYY HKPJDD ����� ¦�� 1,1,10
where, Yit is a measure of leverage10 (book or market leverage) of firm i in year t; X represents the vector
of H[SODQDWRU\� YDULDEOHV�� i represents time-invariant unobservable firm-specific effects (e.g.,
structure of interest rates, and (xii) M&A activity. These variables are defined in Appendix B. We also
control for 15 industry groups effects (see Appendix D), using [0, 1] dummy variables.
C. Methods of Estimation
As summarised in Antoniou, Guney and Paudyal (2006), Hsiao (1985) suggests that the OLS
estimation of equation (1) would result in biased coefficients because i is not directly observable and is
correlated with other regressors in the model. Furthermore, the correlation of Yi,t-1 ZLWK� i would result in
10 The dependent variable takes any value (continuous) between zero and one. All observations are positive, and the
distribution is non-normal. Our statistical model considers this. It is established in the econometrics literature that
GMM models are robust with respect to non-normality and heteroscedasticity (see, e.g., Arellano and Bond (1991);
Blundell and Bond (1998)). For the same reason Korajczyk and Levy (2003), MacKay and Phillips (2005) and Mao
(2003), among others, also use the GMM technique with the same type of dependent variable.
11
inconsistent estimates of coefficients. To overcome these problems, one could take the first differences
of the variables and thereby eliminate time-LQYDULDQW�IL[HG�HIIHFWV�� i). However, the OLS estimators are
still inefficient because of the correlation between 'Hit (i.e. Hit-Hit-1) and 'Yi,t-1 (i.e. Yi,t-1-Yi,t-2) due to the
correlation between HI,t-1 and Yi,t-1. OLS specification assumes that all the explanatory variables are
strictly exogenous. However, this is a naive presumption since the random events affecting the
dependent variable are likely to influence the explanatory variables as well. To overcome this, Anderson
and Hsiao (1982) propose an instrumental variables (IV) technique, where 'Yi,t-2 , or Yi,t-2 , can be used
as instruments for 'Yi,t-1. This is valid because 'Yi,t-2 , or Yi,t-2 , is correlated with 'Yi,t-1 but not with
'Hit. If Hit is not serially correlated per se, the IV estimation results will be consistent. However, they
might not be efficient estimators since the IV technique does not use all available moment conditions.
As an alternative solution, Arellano and Bond (1991) suggest using Generalized Methods of
Moments (GMM). GMM uses additional instruments obtained by utilizing the orthogonal conditions that
exists between the disturbances and the lagged values of the dependent variable. In general, one can find
a GMM estimator of the true parameter by finding the elements of the parameter space which sets linear
combinations of the sample cross products ’as close to zero as possible’ (Hansen, 1982). Thus, the
advantage of GMM stems from the fact that it optimally exploits all the linear moment restrictions
specified by the model. It is argued in Antoniou, Guney and Paudyal (2006) that E(Hit,Hit-1) in equation (1)
is not necessarily zero, but is assumed that E(Hit,Hit-2) is zero as the consistency of the GMM procedure is
based on the absence of second-order correlation in differences and that of first-order correlation in
levels. Assuming that the disturbances are not correlated, it is expected that 'Hit is orthogonal to the past
history of the dependent variables (Y) and the explanatory variable (X), so that (Yit-2, Yit-3
,…, Xit-2, Xit-3
,…)
can be used as valid instruments for 'Hit. If Hit follows an MA(1) process, the first valid instruments start
from the third lag, not from the second, since the differenced disturbances follow an MA(2) process. As
a result, it is essential to ensure that there is no higher-order serial correlation to have a valid set of
instruments independent of the residuals. This can be investigated by using Sargan’ s test of over-
identifying restrictions. This two-step GMM methodology can control for the correlation of errors
overtime, heteroscedasticity across firms, simultaneity, and measurement errors due to the utilization of
orthogonal conditions on the variance-covariance matrix.11
11 Two-step GMM estimators, which use one-step residuals to construct asymptotically optimal weighting matrices,
are more efficient than one-step estimators if the disturbances are expected to show heteroscedasticity in the large
sample data with a relatively long time span. See Blundell and Bond (1998) for further discussion.
12
Although the GMM specification of the first differences (GMM-DIF) is superior to many other
methodologies, recent studies in econometrics document that standard GMM-DIF estimator has a
problem of weak instruments. As noted in Antoniou, Guney and Paudyal (2006), Arellano and Bover
(1995) argue that the absence of information concerning the parameters in the level-variables causes
substantial loss of efficiency in models estimated in first-differences using instruments in levels. Hence,
they propose using instruments in first-differences for equations in levels and instruments in levels for
equations in first-differences. Furthermore, Blundell and Bond (1998) document that the extended GMM
(GMM-SYS) estimator of Arellano and Bover (1995) reveals dramatic efficiency gains, where the
standard GMM-DIF estimator performs poorly (e.g. for short sample periods and persistent data). This is
especially relevant when the coefficient of a lagged dependent variable approaches unity and when the
UDWLR�RI�YDULDQFH� i��YDULDQFH� it) in equation (1) increases. Blundell and Bond (1998) further document
that once lagged first-differenced and lagged levels instruments are included in the instrument set, one
could reduce the finite sample bias substantially by exploiting the additional moment conditions in this
approach. Their results show that the instruments used by the GMM-DIF estimator contain little
information about the endogenous variables in first-differences, and that lagged first-differences are
informative instruments for the endogenous variables in levels. Under GMM-SYS technique, the model
is estimated in both levels and first-differences, as level equations are simultaneously estimated using
differenced lagged regressors as instruments. In this way, apart from controlling for individual
heterogeneity, variations among firms can partially be retained. For the reasons explained above the
paper’ s examination of the determinants of corporate capital structure is based on the estimation of
equation (1) using the GMM-SYS method.12
Although GMM-SYS is superior to many other methods some caveats are worth mentioning. For
example, in most cases the two-step GMM-SYS estimates are more efficient than the first-step
estimators. However, the superiority of the two-step estimators over the first-step is not always clear.
Similarly, due to the absence of an optimal way of choosing the instrument set for GMM-SYS estimator
it may lead to the ‘many instruments’ problem relative to the sample size.13
12 To assess the applicability of the issues discussed in this section on the paper’ s data set, equation (1) has been
estimated using OLS, Anderson-Hsiao type estimates, and GMM estimates in level and first difference. The
diagnostic statistics suggest that these models do not provide efficient estimators and suffer from the problems
discussed in the text. 13 However, we determined the instrument set efficiently without employing all available instruments to avoid any such potential bias.
13
D. Industry Effects
It is known that some industries, for example capital-intensive manufacturing industries and
utilities, are characterized by high leverage, while others are known to have low leverage, such as hi-tech
and mineral extraction industries. Ferri and Jones (1979) emphasize the statistical relationship between
relative debt structure class and generic industry class. Similarly, Harris and Raviv (1991) account for
the industry classification by commenting that ‘firms within an industry are more alike than those in
different industries, and that industries tend to retain their leverage rankings over time’ . More recently,
Maksimovic, Stomper and Zechner (1999), MacKay and Phillips (2005) and Miao (2005) also
emphasize the relevance of industry effects on capital structure decisions. Thus, to control for this effect
we include industry dummies where appropriate.14
E. Target Leverage and Speed of Adjustment
The following procedure examines the existence of a target leverage in a framework that allows
for adjustment costs and measures the speed of adjustment. Assuming that the desired target debt-
ratio, *itLeverage , is a function of k explanatory variables, as in equation (1), then:
(2) ¦�
� 1
*
kitkitkit XLeverage Z\
ZKHUH��;�LV�D�YHFWRU�RI�N�H[SODQDWRU\�YDULDEOHV�� it is a serially correlated disturbance term with mean
]HUR�DQG�SRVVLEO\�KHWHURVFHGDVWLF��DQG� k's are unknown parameters to be estimated and common to all
firms. Equation (2) assumes the presence of a firm-level target capital structure, which is determined by
firm-specific and country-specific factors, after controlling for market conditions, as in equation (1).
Because of the existence of transaction costs, firms cannot adjust their leverage ratios too frequently.
According to Leary and Roberts (2005), firms adjust their capital structure on average once a year. This
relatively infrequent adjustment implies a trade-off between the costs of being off-target and the cost of
leverage adjustment, as shown in Ju, Parrino, Poteshman and Weisbach (2005). Therefore, this model
shows that firms adjust their current debt-ratios, Leverageit, with the degree of adjustment coefficieQW�� ��to attain the desired capital structure, as follows:
(3) )( 1*
1 �� � � itititit LeverageLeverageLeverageLeverage T
14 These effects can only be investigated through the models in levels, not in differences. In addition, the models
that include industry specific M&A activity do not include industry dummies.
14
,I� ���WKH�DFWXDO�FKDQJH�LQ�OHYHUDJH�LV�HTXDO�WR�WKH�GHVLUHG�FKDQJH�DQG�WKH�DGMXVWPHQW�LV�WUDQVDFWLRQ�FRVW�IUHH��,I� ��WKHUH�LV�QR�DGMXVWPHQW�LQ�OHYHUDJH��7KH�DEVHQFe of adjustment is possible when adjustment
costs are excessively high, or the cost of adjustment is significantly higher than the cost of remaining off
target, and firms set their current debt-ratios to the past level, Leverageit-1. Substituting (2) into (3), we
obtain:
(4) tk
kitkitit xLeverageLeverage TZT\T ��� ¦�� 11)1(
In this model tKH�YDOXH�RI� �PHDVXUHV�KRZ�TXLFNO\� ILUPV�DGMXVW� WKHLU� OHYHUDJH� UDWLR�� LQ� OLQH�ZLWK�Miguel and Pindado, (2001)�� ,W� DVVXPHV� WKDW� � OLHV� EHWZHHQ� ]HUR� DQG� XQLW\� GXH� WR� WKH� H[LVWHQFH� RI�adjustment costs�� ,I� WKH�FRVW�RI�EHLQJ�LQ�GLVHTXLOLEULXP�LV�KLJKHU��ORZHU��WKDQ�WKH�FRVW�RI�DGMXVWPHQW�� �tends to be unit (zero).
IV. The Results
Estimation of equation (1) using alternative methods suggests that the most appropriate
methodology for testing a firm’ s dynamic capital structure is a two-step system-GMM specification that
combines the differenced equations with level equations. The validity of this method is confirmed by the
diagnostics reported in the tables. Therefore, we discuss the results from this method of estimation.
A. The Determinants of Leverage: Pooled Data for All Countries
The data of all five countries is pooled and equation (1) is estimated with four country dummy
variables representing Germany, Japan, the U.K. and the U.S. The dummy variable for a given country
takes a value of 1 if the firm operates in that particular country and 0 otherwise. A significant coefficient
of a country dummy would suggest that there are country-specific determinants of leverage. After
controlling for market conditions, the first column of results in Table 3 indicates that the market
leverage15 of firms operating in the G5 countries declines with an increase in their profitability, growth
opportunities, and effective tax rate.16 The inverse relation of leverage with profitability and growth
15 In addition, following Rajan and Zingales (1995), we re-estimated the model using two further definitions of
leverage: (a) the ratio of non-equity liabilities to total assets, and (b) the ratio of total debt to net assets. Since the
results are not qualitatively different from the results reported in the paper, we do not report them. 16 Following the argument that market leverage is more relevant than book leverage (see, for instance, Welch,
2004) the results presented are based on market leverage. In the interest of brevity, the estimates using book
15
opportunities is consistent with the findings of Flannery and Rangan (2006) and De Jong and Veld
(2001), among others. Contrary to the predictions of the trade-off theory, the estimates reveal an inverse
relationship between the effective tax rate and leverage. Similar evidence is reported by Kremp, Stoss
and Gerdesmeier (1999). It can be argued that this is due to reverse causality, i.e. firms with low leverage
pay higher effective tax.17 However, why the firms do not adjust their leverage to minimize their tax
burden remains a puzzle. Consistent with the findings of Titman and Wessels (1988) and Mao (2003),
the effect of non-debt tax shields on market leverage is positive. If the amount of depreciation is the
primary component of non-debt tax shields, the firm possesses relatively more tangible fixed assets that
generate proportionally high levels of depreciation and tax credit. Such assets have collateral value for
the attainment of secured debt, which in turn increase the debt capacity of firms allowing them to borrow
more and save more on tax (see MacKie-Mason, 1990a). The estimates further show that larger firms
and firms with higher tangible assets borrow more. Similar findings are reported by Flannery and
Rangan (2006).
The estimates show that the payout policy does not have a significant effect on capital structure
decisions of firms operating in the G5 nations. This finding differs from the positive relation reported by
Chang and Rhee (1990) and the inverse relation reported by Rozeff (1982). Since the payout ratio could
be endogenous to the capital structure decision, although the estimation method accounts for such
endogeneity, equation (1) is re-estimated without this variable to examine the robustness of the results.
This second set of results is reported in the final column of Table 3 and they show that overall findings
remain qualitatively the same. Consistent with the prediction of the pecking order theory that managers
issue shares when they are overvalued, the negative and significant effect of share price performance on
both market and book leverage confirms that managers issue equity after an increase in the market price
of their shares.18 Hovakimian, Hovakimian and Tehranian (2004) also report an inverse relation between
leverage and changes in share price.
Table 3 about here
leverage are not reported but are available on request. They are discussed in the text whenever they differ
qualitatively from the estimates based on market leverage. 17 It should be noted that such a potential endogeneity problem is controlled for in GMM. 18 The negative effect of share price performance on book leverage confirms that the observed inverse relation
between share price performance and market leverage is due to managerial decisions and not due to statistical
distortions brought about by the increase in the market value of equity owing to an increase in share price.
16
The significant coefficients of all the control factors, equity premium, term-structure of interest
rates, and M&A activity, support the prediction that, while choosing the financing mix, managers not
only take into account the firm specific situation, but also the market conditions in which they operate.
The estimates show a positive effect of equity premium on market leverage implying that firms raise
debt capital at times of high market equity premia. Further, the term-structure of interest rates, prior
changes in share price of the company, and the M&A activity are all inversely related to a firm’ s market
leverage.19 These estimates confirm that firms avoid issuing debt when long-term interest rate is
relatively high.20 The statistically significant coefficient of the lagged dependent variable confirms that
firms have a target capital structure and on average they do not fully adjust to the target every year,
consistent with the findings of Miguel and Pindado (2001), Frank and Goyal (2004) and Ju et al. (2005).
Finally, all the coefficients of the country dummies are statistically significant, implying that there are
country-specific effects. Therefore, a detailed country specific analysis is desirable to investigate this
further.21
Due to differences in institutional factors affecting liquidation risk, the risk premium on loan
capital and the level of information asymmetry among managers and outside investors, firms operating
in various countries may consider different factors, or weigh them differently, while deciding their
capital structure. To examine the proposition that the corporate governance and legal traditions of the
country in which a firm operates play a significant role, equation (1) is modified to include measures of
the rule of law, ownership concentration, creditors’ rights, and anti-directors’ rights. In this expanded
model, firm specific characteristics are also included. Table 4 presents the findings for the three versions
of this model that are estimated to avoid possible multicollinearity between the country specific
variables. These estimates confirm that these factors have statistically significant effects on the capital
structure choice of firms operating in the G5 countries. Higher rule of law implies more efficient law
enforcement regulations, including bankruptcy laws. Thus, to avoid bankruptcy, firms in countries with
higher rule of law index may keep their leverage ratio lower to decrease the risk of bankruptcy. The
19 As anticipated and discussed in section II B the sign of the coefficient of the M&A activity on book leverage is
positive while it is negative on market leverage. 20 Unlike market leverage, book leverage is inversely affected by the equity premium and positively affected by the
M&A activity. An inverse relation between book leverage and equity premium is possible when firms retain more
earnings during periods of high equity premium. 21 The M&A activity variable is industry and year specific and hence it represents industry and time dummies.
Therefore no separate industry and time dummies are included in the model. To examine the robustness of the
estimates to this specification, equation (1) is re-estimated with 14 industry dummies (see Appendix D for a list of
the 15 industries) and time dummies. The results, available upon request, are qualitatively the same.
17
positive effect of ownership concentration supports the view that firms with concentrated share
ownership favor debt as opposed to external equity to prevent possible dilution of ownership and control.
The observed positive effect of ownership concentration may also be a reflection of differences in banks’
ownership. Concentrated bank ownership reduces the cost of financial distress as the firms are likely to
be rescued by the owner-banks. The positive effect of creditors’ rights on leverage is self-explanatory as
higher creditors’ protection reduces the risk premium in the cost of borrowing and hence firms favor debt
capital. The anti-director rights index also has a positive effect on leverage, since the higher this index,
the less the information asymmetry between managers and external investors. As a result, firm’ s debt
capacity increases. Thus, corporate governance and legal provisions appear to play a prominent role in
capital structure decisions. Since the sample countries have different financial traditions, the role of the
determinants of capital structure is thus expected to vary across countries. The significant coefficients of
the country dummies reported in Table 3, and the variables representing corporate governance practices
reported in Table 4 confirm this prediction. Therefore, in the following sub-section each sample country
is examined separately and the effects of the determinants of capital structure are compared and
discussed in the context of the institutional set-up in each country.
Table 4 about here
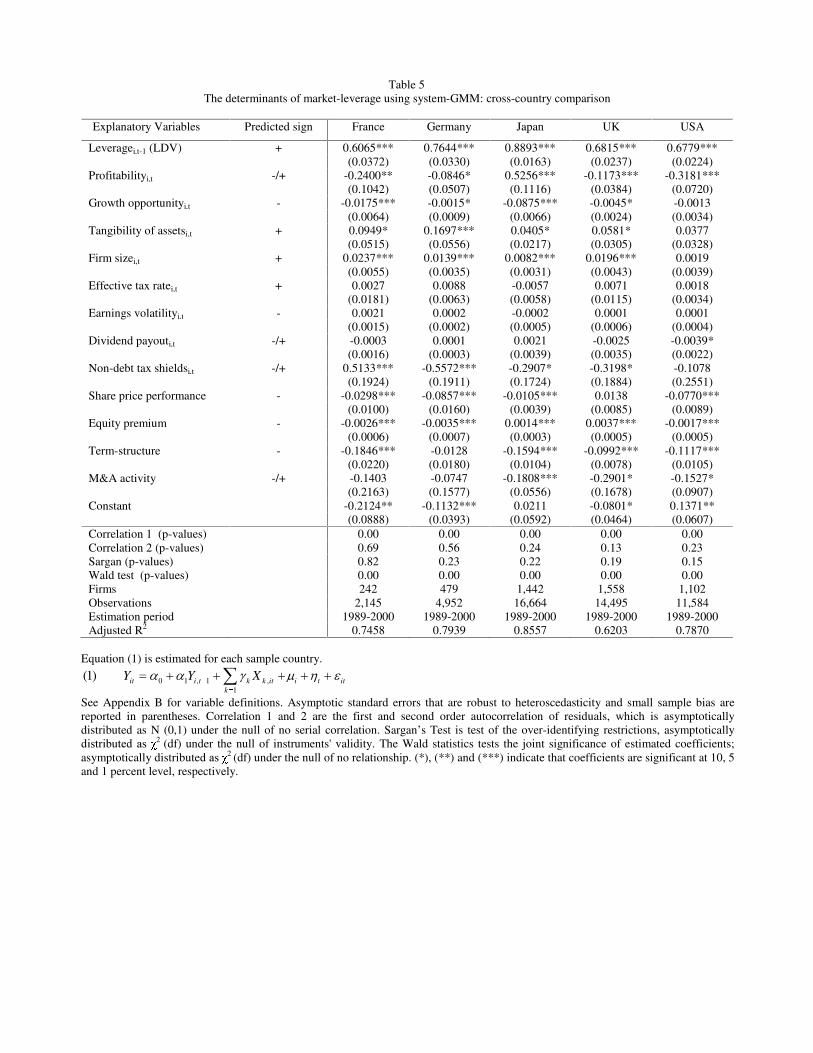
B. The Determinants of Leverage: Cross Country Comparison
The determinants of leverage of firms operating in the sample countries are further investigated
by estimating equation (1) using a general dynamic system-GMM method. The estimates are reported in
Table 5 and are based on an autoregressive model. Further, the static long-run equilibrium results
obtained by using the error correction mechanism are presented in Table 6.
1. The Firm Specific Factors
The results in Table 5 reveal a significant inverse relation between profitability and market
leverage in all sample countries, except Japan where profitability has a positive effect.22 This inverse
relation is consistent with the pecking order hypothesis that internal funding is preferred to the more
expensive external sources. Higher profitability by enhancing internal resources reduces the need for
external finance, as also reported by De Jong and Veld (2001) and Flannery and Rangan (2006). The
long-run results in Table 6 also confirm these findings. Although the view that debt reduces the agency
22 Book-leverage is significantly inversely related to profitability in all sample countries, including Japan.
18
cost of free cash-flow cannot be challenged just on the basis of these estimates, the evidence suggests
that the information asymmetries effect is stronger than agency considerations. There is also a marked
difference in the size of the coefficients of profitability, especially in the long-run (Table 6), across the
G5 countries implying a different degree in the economic significance of profitability on capital structure
decisions. The negative coefficient is largest (in absolute terms) in the United States. Among the
European countries, the coefficient is the largest in France and this could be explained by a combination
of various factors. Firstly, French managers prefer high earnings retention in order to maintain a closely
held ownership structure (see table 1). Secondly, due to the strategic informational advantage over
creditors, French managers may use the hierarchy of alternative financing strategies suggested by the
pecking order theory. Finally, the relatively weaker protection of creditors in France (table 1) may lead
to difficulties in raising debt, and thus companies may be forced to rely more on internal resources.
Among the G5 countries the payout ratio of British firms is the highest with a relatively smaller negative
coefficient. This could be because strong institutional share ownership encourages British firms to
payout more in dividends and thus reducing the possibility of financing from internal equity. In
summary, the impact of profitability on the financing mix is dependent on several country specific
features.
Tables 5 and 6 about here
The estimated relationship between growth opportunities and market leverage is negative in all
countries, apart from the United States where it is insignificant. This inverse relation is consistent with
the findings of Johnson (1998), Rajan and Zingales (1995) and Flannery and Rangan (2006). Since the
cost of financial distress and the agency costs of debt are higher for high growth firms, lenders demand
higher return rates and thus debt is less attractive to managers. A cross-country comparison reveals the
lowest impact in Germany, consistent with extant evidence that the large shareholders of German firms
are in a position to better monitor managers and hence the opportunity for managers to pursue their own
objectives at the expense of shareholders is very limited (see, for example, Edwards and Fischer, 1994).
The relatively larger coefficients for Japanese and British firms suggest that the presence of information
asymmetries in these countries raises the agency cost of debt, thus deterring managers from raising
costly debt capital. The insignificant coefficient in the US remains a puzzle. In summary, the estimates
confirm that the effect of growth opportunities on company’ s capital structure is dependent on
regulations and provisions pertaining to investors’ protection and corporate governance.
The relationship between leverage and the tangibility of assets is significantly positive in all G5
countries, apart from the United States. This is consistent with the view that tangible assets are more
valuable to creditors should firms go into liquidation and the findings of Flannery and Rangan (2006)
19
and Mao (2003). The long-term coefficient (table 6) is largest in Germany, followed by Japan and France
respectively. These estimates confirm that the effect of asset tangibility on corporate debt is more
prominent in bank oriented (France, Germany and Japan) than in capital market oriented economies (the
United States and the United Kingdom). Such stronger relation in bank oriented economies is likely to be
caused by institutional provisions such as restrictions on banks’ ability to grant unsecured loans and the
traditional banking practices that require sufficient collateral.23 The smaller (or insignificant) coefficients
for asset tangibility in the UK and US suggest that firms operating in these countries have arm’ s length
relation with their lenders and thus the role of collateral in raising debt is limited. Hence, the importance
of asset tangibility depends upon the sources of debt financing – banks vs. capital markets.
Consistent with the findings of Michaelas, Chittenden and Poutziouris (1999), Mao (2003) and
Flannery and Rangan (2006) the size of the firm, measured by total sales, appears to be positively related
to leverage in all G5 countries, apart again from the US.24 Larger firms are known to be less exposed to
bankruptcy risk and hence are likely to be able to borrow more (Warner, 1977). The conventional
wisdom that firms with high volatile earnings should borrow less is not supported by the evidence
reported in Tables 5 and 6. Equally, the role of effective tax rate on market leverage is not statistically
significant in any country. In line with Ang and Peterson (1986) and Titman and Wessels (1988), this
observation may be caused by the lack of variation in the rate of corporate tax across firms. Any
observed variation is likely to be a manifestation of the changes in corporate tax rate over the sample
period.25 Consistent with the prediction of the trade-off theory and the findings of Leary and Roberts
(2005), firms with higher non-debt tax shields borrow less in Germany, Japan and the UK. On the
contrary, this relationship is found to be positive in France. As discussed earlier, a positive effect is
possible when the depreciation of tangible assets is the major component of non-debt tax shields (see,
MacKie-Mason, 1990a).26
23 An alternative view is that the firms in bank oriented economies (especially in Germany and Japan) have closer
ties with their banks and hence the tangibility of assets should not matter. However, this view is not supported by
the data. It is also possible that the banks who know the firms closely discourage/stop them from borrowing more,
unless they have sufficient collateral. 24 Results based on total assets are qualitatively the same. 25 The estimates based on book-leverage show that German and Japanese firms with higher effective tax rate
borrow more. 26 It is also possible that non-debt tax shield is endogenously determined since it is a function of investment
decisions, which is clearly endogenously determined. Since effective tax rate may be a function of non-debt tax
shields and including both variables at the same time may raise some concerns. To test for the implications of this
possibility, we reestimated the model in three other forms: first, we excluded the effective tax rate but retained non-
20
Also the effect of the dividend payout ratio on capital structure appears to be country dependent,
being significantly negative in the US and insignificant in all other countries. The inverse relation
between leverage and dividend in the United States, consistent with the findings of Rozeff (1982),
supports the view that dividend payment signals firm’ s future performance and thus high dividend
paying firms benefit from a lower equity cost of capital. In addition, firms with high payout policy are
likely to be classified as higher risk by creditors and thus face a higher cost of debt.27 Among the
continental European countries, Germany had the higher average payout ratio (28.8%) than France
(6.5%). In Germany the corporate tax rate on dividends (30%) is less than on retained earnings (45%).
This encourages more payouts and more frequent external financing. However, this provision does not
favor debt over equity and hence capital structure choice appears to be independent of dividend policy,
as shown by the statistical insignificance of the payout ratio coefficient. The United Kingdom is an
interesting case, since there was a change in the tax treatment of dividends in 1997. Before 1997, tax-
exempted investors, such as pension funds, were able to reclaim part of the advance corporation tax paid
on the dividends, but this provision was subsequently withdrawn. To control for the possible
implications of this change, the model was re-estimated with an interactive dummy variable that takes
the value of 0 before 1997 and the value of the dividend payout ratio afterwards.28 The dividend payout
coefficient became statistically significant and negative, while the interactive dummy was found to be
statistically significant and positive. This implies that the negative impact of the dividend payout ratio is
mitigated from 1997 onwards by the change in the tax treatment of dividends. The inclusion of the
interactive dummy does not qualitatively alter the other results.
The results also suggest that market leverage declines after an increase in share price in all
countries except the UK, implying that managers tend to issue more equity after a positive share price
debt tax shields; second, we excluded the non-debt tax shields but retained the effective tax rate, and finally, we
excluded both the effective tax rate and non-debt tax shields variables from the model. The estimates of these
alternative specifications remain qualitatively similar to the estimates of the main model confirming that our results
are robust. 27 It is also possible that the payout ratio is endogenous to the capital structure decisions. Although, our estimation
method accounts for possible endogeneity by using two period lagged values, to further investigate whether the
explanatory variables are endogenous, exogenous or pre-determined we followed the procedure conducted by
Blundell, Bond, Devereux and Schiantarelli (1992). We find that all firm-specific factors, including the dividend
payout, are endogenously determined. In addition, we re-estimate the equation without the payout ratio, the results
remain qualitatively the same. 28 An alternative dummy that takes the value of 1 after 1997 was also used and the result were qualitatively the
same.
21
movement,29 Assuming that managers are better informed than outside investors and they act in the best
interest of existing shareholders, an issue of new equity would signal that shares are overvalued. Since
the new equity investors would demand a discount, the realized value of new equity when share prices
are high is more likely to be at least equivalent to the true value of equity. This may explain why
managers tend to issue more equity at times of high share prices irrespective of the institutional
environment in which they operate. Hovakimian et al (2004) also report a similar finding.
2. The Control Factors
The influence of the equity premium on firm’ s capital structure decision differs from country to
country. Market-leverage is inversely affected by equity premium in France, Germany and the United
States, while it is positively affected in Japan and the United Kingdom.30 The positive effect suggests
that managers have a preference for the relatively cheaper debt when the equity premium is high. On the
other hand, the inverse relation implies that managers would issue more equity when the equity premium
is high. This is likely if the observed high equity premium is due to a bull market and managers believe
that even after offering a discount on new equity, the amount raised is at least equivalent to its true value,
as predicted by the ‘window of opportunity’ hypothesis. The results also reveal a significant negative
relation between the term-structure of interest rates and leverage in all sample countries except
Germany. The inverse relation is consistent with the proposition that shareholders’ wealth-maximizing
managers prefer equity to debt when the term-structure of interest rates widen. This evidence confirms
the view that when long-term interest rates are relatively high, firms are reluctant to raise debt capital,
especially long-term debts. This conclusion holds in all countries irrespective of their differences in
institutional arrangements and traditions and supports dynamism in capital structure decisions.
Another factor that appears to influence the capital structure decision of managers of firms
operating in Japan, the UK and the US is the M&A activity. Firms operating in these countries seem to
borrow less when the market for the M&A is more active, perhaps to avoid financial distress while
predators are active. However, this variable has no significant impact on capital structure decision of
firms operating in France and Germany. These findings are consistent with the view that hostile takeover
bids are more common in market based economies than in bank based economies, with Japan being the
29 The relation between book-leverage and share price performance of the firms operating in the UK is also
negative, in line with the findings for other countries. Similar to the evidence from pooled sample (footnote 18)
these estimates reconfirm that managers opt for equity issue, rather than debt, after an increase in share price. 30 Book-leverage is related to equity premium differently from market-leverage in all countries except the US.
22
exception.31 Overall, the results confirm the need to control for market conditions while analyzing the
factors that determine the capital structure of a firm. The discussion in preceding paragraphs confirm that
managers consider firm specific factors as well as country specific factors when deciding the capital
structure of their firms.
C. Target Leverage and Speed of Adjustment
The results in Table 5 reveal a significant and positive effect of the one-period lagged dependent
variable, leverage, on the capital structure of firms in all the sample countries.32 Such a positive effect is
consistent with the findings of Frank and Goyal (2004) and Miguel and Pindado (2001). The coefficients
are between zero and one implying that the estimates are stable and the leverage ratio converges to its
desired level over time. This confirms the existence of dynamism in the capital structure decision, in the
sense that firms adjust their leverage ratios in order to achieve their target.33 Moreover, the explanatory
power of the model increases remarkably when the lagged dependent variable is included in the model.34
The speed of adjustment varies across sample countries, being fastest among French firms, followed by
American, British, German and Japanese firms respectively.35 This is consistent with the view that the
time dimension is an important variable in explaining the evolution of firms’ debt ratios in France
(Kremp et al, 1999). It is possible that for German and Japanese firms the cost of being off target relative
to the cost of adjustment is low. Since German and Japanese firms have close ties with their creditors, it
is feasible for them to adjust slowly towards their target level without incurring substantial agency costs.
German and Japanese firms not only have easier access to debt finance, but they also need to rely less on
using debt as a mechanism to signal firm quality to a large number of investors in capital markets, as
their counterparts need to do in market oriented economies such as the United States and the United
Kingdom. Overall, the results reveal the presence of dynamism in the capital structure decisions of firms
operating in the G5 countries. Managers assess the tradeoff between the cost of adjustment and the cost
31 The results based on two other measures of the M&A activity (defined in Appendix B) are qualitatively similar. 32 This finding holds for both market-leverage and book-leverage. 33 In their survey of 392 U.S. firms, Graham and Harvey (2001) find that 44% have strict or somewhat strict target
debt ratios, and 64% of investment-grade firms have somewhat strict optimal capital structure implied by the static
trade-off theory. 34 The regression results based on the static forms of the capital structure model are available upon request. 35 For instance, WKH�VSHHG�RI�DGMXVWPHQW�LQ�)UDQFH�LV��������� � ���– 0.6065) as reported in Table 5.
23
of being off target. Thus, the speed at which they adjust their capital structure may crucially depend on
the financial systems and corporate governance traditions of the country.
D. Tests of Robustness
To examine the robustness of findings, the pooled sample is split according to several criteria
and equation (1) is re-estimated. The criteria used for sub-sampling are: (i) firm size, (ii) growth
opportunities, (iii) industry, and (iv) sample period. Firstly, since a firm’ s size may affect its access to
capital markets, bankruptcy risks, and scale economies in raising capital, the sample firms are divided
into three size categories based on their total sales. The results in Table 7 for small and large firms reveal
some differences.36 Although most variables have a similar impact on both small and large firms,
effective tax rate, payout ratio, and earnings volatility differ as they are only significant for large firms.
The impact of the M&A activity is important for all firms, but larger for smaller firms. This confirms
that smaller firms are more likely to become acquisition targets than larger firms. Moreover, no country
dummy is significant in the case of smaller firms, suggesting that firms of this category face similar
situations in all sample countries, while larger firms are affected differently across countries. Secondly,
sample firms are grouped into three categories according to their growth opportunities. The results reveal
that firms in the lowest and highest growth categories are similarly affected by most firm specific
variables and control factors. However, only the leverage of low growth firms is affected significantly by
profitability, while the effective tax rate impacts on the capital structure of high growth firms only.
Table 7 about here
Thirdly, the determinants of leverage are examined in service and manufacturing industries. The
findings reveal some differences in the factors that affect the capital structure choice of these two
industries. For instance, only the leverage decisions of service firms are inversely affected by
profitability, while only the manufacturing firms are influenced by growth opportunities, and asset
tangibility plays a much stronger role on the capital structure choice of manufacturing firms. Finally, the
sample is split into two seven-year periods, namely 1987-1993 and 1994-2000, to test for any structural
36 Since the medium size firms do not offer any distinct pattern, the results for the medium size group are not
presented in the paper. See Mao (2003).
24
breaks in the capital structure decision.37 The results show that the impact of effective tax rate and the
M&A activity changed significantly during these two sub-sample periods. The impact of effective tax
rate has turned from being statistically significant and negative, to being insignificant. On the contrary,
the coefficient of the M&A activity is only significant for the most recent period. The significant
coefficients of most country dummies indicate that the country specific factors have played an important
role across the whole sample period. Overall, the evidence suggests that the earlier findings are robust
and confirms that the capital structure decision of firms is affected by firm specific as well as market
specific factors.38
V. Conclusion
The paper investigates how firms operating in capital market oriented economies and bank
oriented economies determine their capital structure. Among the five major countries included in the
sample, the United States and the United Kingdom represent the cases of capital market oriented
economies, while France, Germany and Japan represent the bank oriented economies. These countries
also have different legal traditions. While the American and British legal systems are based on common
law, French and German legal systems are based on code law traditions, and the Japanese system is a
hybrid of both. These countries are characterized by different financial structures, accounting systems,
tax provisions, corporate governance practices, and insolvency codes, all factors thought to be relevant
for corporate capital structure decisions. A comparative analysis of the firm specific and market related
factors that determine the capital structure of firms operating in different institutional and economic
traditions enhances our understanding of how firms choose their financing mix. It also helps regulators to
design a financial system consistent with the achievement of an efficient resource allocation.
A dynamic system-GMM method is applied to panel data. Although most of the variables
identified in the literature affect the leverage of firms in the five countries when pooled together, the
degree and importance of these determinants are country-specific. The results also suggest that firms
adjust their leverage ratio regularly to maintain/achieve a target capital structure. The speed of
adjustment is the quickest in France, while Japan has the slowest one. Among the firm specific
determinants of capital structure, the leverage ratio is positively related to the tangibility of assets and to
37 The sample period is split into two sub-periods of 7 years each. For GMM diagnostics to be robust, at least 5
years of data are needed. 38 The cases of high leverage and low leverage firms were also estimated separately. The results remain
qualitatively similar to those of the full sample.
25
the size of the firm in both types of economies. On the other hand, it declines generally with increases in
profitability, growth opportunities and share price performance, with some evidence of cross-country
variation. The impact of effective tax rate and dividend payout ratio is dependent on country’ s rules and
regulations. Therefore, these results support the view that the impact of firm specific factors on firm’ s
leverage ratio is crucially influenced by corporate governance practices, tax systems, the role of capital
markets, corporate and banking relations and investor protection of the country in which the firm
operates. Among the control variables, the term-structure of interest rates has a strong inverse effect on
leverage, while the effects of equity risk premium and the M&A activity are country dependent. The
estimates of the long-run static model and various sub-sampling analysis also confirm that the results are
robust. These findings support the importance of incorporating market-wide factors while modeling the
capital structure of a firm. In summary, the strength and the nature of the effect of firm specific as well
as market related factors on the capital structure choice of a firm are dependent on the economic and
legal traditions of a country. Therefore, the capital structure decision of a firm is not only the product of
its own characteristics, but also the result of environment and traditions in which it operates.
26
References Alderson, M. J., and B. L. Betker. “Liquidation Costs and Capital Structure.” Journal of Financial Economics, 39 (1995), 45-69. Anderson, T. W., and C. Hsiao. “Formulation and Estimation of Dynamic Models Using Panel Data.” Journal of Econometrics, 18 (1982), 47-82. Ang, J. S., and D. R. Peterson. “Optimal Debt versus Debt Capacity: A Disequilibrium Model of Corporate Debt Behavior.” In Chen, A. W., ed. Research in Finance, 6 (1986), JAI Press. Antoniou, A. Y. Guney and K. Paudyal. “ The Determinants of Debt Maturity Structure: Evidence from France, Germany and the UK.” European Financial Management, 12 (2006), 161-194. Arellano, M., and S. Bond. “ Some Tests of Specification for Panel Data.” Review of Economic Studies, 58 (1991), 277-297. Arellano, M., and O. Bover. “ Another Look at the Instrumental Variable Estimation of Error-Components Models.” Journal of Econometrics, 68 (1995), 29-51. Baker, M., and J. Wurgler. “ Market Timing and Capital Structure.” Journal of Finance, 57 (2002), 1-32. Ball, R., S. P. Kothari, and A. Robin. “ The Effect of International Institutional Factors on Properties of Accounting Earnings.” Journal of Accounting and Economics, 29 (2000), 1-51. Blazenko, G. W. “ Managerial Preferences, Asymmetric Information, and Financial Structure.” Journal of Finance, 42 (1987), 839-862. Blundell, R. W., and S. R. Bond. “ Initial Conditions and Moment Restrictions in Dynamic Panel Data Models.” Journal of Econometrics, 87 (1998), 115-143. Blundell, R. W., S. R. Bond, M. Devereux, and F. Schiantarelli. “ Investment and Tobin's Q.” Journal of Econometrics, 51 (1992), 233-257. Bradley, M., G. A. Jarrel, and E. H. Kim. “ On the Existence of an Optimal Capital Structure: Theory and Evidence.” Journal of Finance, 39 (1984), 857-877. Chang, R. P., and S. G. Rhee. “ The Impact of Personal Taxes on Corporate Dividend Policy and Capital Structure Decisions.” Financial Management, 19(2) (1990), 21-31. Chung, K. H. “ Asset Characteristics and Corporate Debt Policy: An Empirical Test.” Journal of Business Finance and Accounting, 20 (1993), 83-98. DeAngelo, H., and R. W. Masulis. “ Optimal Capital Structure under Corporate and Personal Taxation.” Journal of Financial Economics, l8 (1980), 3-29. De Jong, A., and C. Veld. “ An Empirical Analysis of Incremental Capital Structure Decisions under Managerial Entrenchment.” Journal of Banking and Finance, 25 (2001), 1857-1895.
27
Devereux, M., and F. Schiantarelli. “ Investment, Financial Factors and Cash Flow: Evidence from UK Panel Data.” In Asymmetric information, corporate finance and investment, R.G. Hubbard, ed. University of Chicago Press (1990), 279-306. Edwards, J., and K. Fischer. Banks, Finance and Investment in Germany, Centre for economic policy research, Cambridge University Press (1994). Edwards, J., and M. Nibler. “ Corporate Governance in Germany: the Role of Banks and Ownership Concentration.” Economic Policy, 31 (2000), 239-267. Fama, E. F., and K. R. French. “ Testing Trade-off and Pecking Order Predictions about Dividends and Debt.” Review of Financial Studies, 15 (2002), 1-33. Ferri, M. G., and W. H. Jones. “ Determinants of Financial Structure: A New Methodological Approach.” Journal of Finance, 34 (1979), 631-644. Fischer, E. O., R. Heinkel, and J. Zechner. “ Dynamic Capital Structure Choice: Theory and Tests.” Journal of Finance, 44 (1989), 19-40. Flannery, M. J., and K. P. Rangan. “ Partial Adjustment toward Target Capital Structures.” Journal of Financial Economics, 79 (2006), 469-506. Frank, M. Z., and V. K. Goyal. “ The Effect of Market Conditions on Capital Structure Adjustment.” Finance Research Letters, 1 (2004), 47-55. Friend, I., and L. Lang. “ An Empirical Test of the Impact of Managerial Self-Interest on Corporate Capital Structure.” Journal of Finance, 43 (1988), 271-281. Fukuda, A., and S. Hirota. “ Main Bank Relationships and Capital Structure in Japan.” Journal of the Japanese and International Economies, 10 (1996), 250-261. Graham, J. R., and C. R. Harvey. “ The Theory and Practice of Corporate Finance: Evidence from the Field.” Journal of Financial Economics, 60 (2001), 187-243. Hansen, L. P. “ Large Sample Properties of Generalized Methods of Moments Estimators.” Econometrica, 50 (1982), 1029-1054. Harris, M., and A. Raviv. “ Capital Structure and the Informational Role of Debt.” Journal of Finance, 45 (1990), 321-349. Harris, M., and A. Raviv. “ The Theory of Capital Structure.” Journal of Finance, 46 (1991), 297-355. Haugen, R. A., and L. W. Senbet. “ Corporate Finance and Taxes: A Review.” Financial Management, 15 (1986), 5-22. Heaton, J. B., “ Managerial Optimism and Corporate Finance.” Financial Management, 31 (2002), 33-45. Hovakimian, A. “ The Role of Target Leverage in Security Issues and Repurchases.” Journal of Business, 77 (2004), 1041-1071.
28
Hovakimian, A., “ Are Observed Capital Structures Determined by Equity Market Timing?” Journal of Financial and Quantitative Analysis, 41 (2006), 221-243. Hovakimian, A., G. Hovakimian, and H. Tehranian. “ Determinants of Target Capital Structure: The Case of Dual Debt and Equity Issues.” , Journal of Financial Economics, 71 (2004), 517-540. Hovakimian, A., T. Opler, and S. Titman. “ The Debt-Equity Choice.” Journal of Financial and Quantitative Analysis, 36 (2001), 1-24. Hsiao, C. “ Benefits and Limitations of Panel Data.” Econometric Reviews, 4 (1985), 121-174. Jensen, M. “ Agency Costs of Free Cash Flows, Corporate Finance and Takeovers.” American Economic Review, 76 (1986), 323-339. Jensen, M. C., and W. H. Meckling. “ Theory of the Firm: Managerial Behavior, Agency Costs and Ownership Structure.” Journal of Financial Economics, 3 (1976), 305-360. Johnson, A. S. “ The Effect of Bank Debt on Optimal Capital Structure.” Financial Management, 27 (1998), 47-57. Ju, N., R. Parrino, A. M. Poteshman, and M. S. Weisbach. “ Horses and Rabbits? Trade-off Theory and Optimal Capital Structure” , Journal of Financial and Quantitative Analysis, 40 (2005), 259-281. Kester, C. W. “ Capital and Ownership Structure: A Comparison of United States and Japanese Manufacturing Corporations.” Financial Management, 15 (1986), 5-16. Kim, W. S., and E. H. Sorensen. “ Evidence on the Impact of the Agency Costs of Debt in Corporate Debt Policy.” Journal of Financial and Quantitative Analysis, 21 (1986), 131-144. Korajczyk, R. A., and A. Levy. “ Capital Structure Choice: Macroeconomic Conditions and Financial Constraints.” Journal of Financial Economics, 68 (2003), 75-109. Kraus, A., and R. H. Litzenberger. “ A State-preference Model of Optimal Financial Leverage.” Journal of Finance, 28 (1973), 911-922. Kremp, E., E. Stöss, and D. Gerdesmeier. “ Estimation of a Debt Function: Evidence from French and German Firm Panel Data.” In Corporate finance in Germany and France, Sauvé, A., and M. Scheuer, eds. A joint research of the Deutsche Bundesbank and the Banque de France, (1999), 139-194. La Porta, R., F. Lopez-de-Silanes, A. Shleifer, and R. W. Vishny. “ Legal Determinants of External Finance.” Journal of Finance, 52 (1997), 1131-1150. La Porta, R., F. Lopez-de-Silanes, A. Shleifer, and R. W. Vishny. “ Law and Finance.” Journal of Political Economy, 106 (1998), 1113-1155. Leary, M. T., and M. R. Roberts. “ Do Firms Rebalance their Capital Structures?” Journal of Finance, 60 (2005), 2575-2619. MacKay, P., and G. M. Phillips. “ How Does Industry Affect Firm Financial Structure?” Review of Financial Studies, 18 (2005), 1433-1466.
29
MacKie-Mason, J. K. “ Do Taxes Affect Corporate Financing Decisions?” Journal of Finance, 45 (1990a), 1471-1493. MacKie-Mason, J. K. “ Do Firms Care Who Provides their Financing?” In R. G. Hubbard, ed. Asymmetric Information, Corporate Finance and Investment, (1990b), 63-103, University of Chicago Press. Maksimovic, V., A. Stomper, and J. Zechner. “ Capital Structure, Information Acquisition and Investment Decisions in an Industry Framework.” European Finance Review, 2 (1999), 251-271. Mao, C. X. “ Interaction of Debt Agency Problems and Optimal Capital Structure: Theory and Evidence.” Journal of Financial and Quantitative Analysis, 38 (2003), 399-423. Marsh, P. “ The Choice between Equity and Debt: An Empirical Study.” Journal of Finance, 37 (1982), 121-144. Miao, J. “ Optimal Capital Structure and Industry Dynamics.” Journal of Finance, 60 (2005), 2621-2659. Michaelas, N., F. Chittenden, and P. Poutziouris. “ Financial Policy and Capital Structure Choice in U.K. SMEs: Empirical Evidence from Company Panel Data.” Small Business Economics, 12 (1999), 113-130. Miguel, A., and J. Pindado. "Determinants of Capital Structure: New Evidence from Spanish Panel Data." Journal of Corporate Finance, 7 (2001), 77-99. Miller, M. H. “ Debt and Taxes.” Journal of Finance, 32 (1977), 261-274. Myers, S. C. “ Determinants of Corporate Borrowing.” Journal of Financial Economics, 5 (1977), 147-175. Myers, S. C. “ The Capital Structure Puzzle.” Journal of Finance, 39 (1984), 575-592. Nestor, S., and J. K. Thompson. “ Corporate Governance Patterns in OECD Economies: Is Convergence under Way?” OECD Publications (2000). Ozkan, A., “ Determinants of Capital Structure and Adjustment to Long Run Target: Evidence from UK Company Panel Data.” Journal of Business Finance and Accounting, 28 (2001), 175-198. Rajan, R. G., and L. Zingales. “ What do We Know about Capital Structure? Some Evidence from International Data.” Journal of Finance, 50 (1995), 1421-1460. Rozeff, M. S. “ Growth, beta and Agency Costs as Determinants of Dividend Payout Ratios", Journal of Financial Research, 5 (1982), 249-259. Scott, D. “ Bankruptcy, Secured Debt, and Optimal Capital Structure.” Journal of Finance, 32 (1977), 1-19. Stulz, R., and H. Johnson. “ An Analysis of Secured Debt.” Journal of Financial Economics, 14 (1985), 501-521. Swoboda, P. and J. Zechner. “ Financial Structure and the Tax System.” In R. Jarrow et al., eds. Handbooks in Operations Research and Management Science, 9 (1995), 767-792.
30
Taub, A. J. “ Determinants of the Firms' Capital Structure.” Review of Economics and Statistics, 57 (1975), 410-416. Titman, S., and R. Wessels. “ The Determinants of Capital Structure Choice.” Journal of Finance, 43 (1988), 1-19. Trezevant, R. “ Debt Financing and Tax Status: Tests of Substitution Effect and the Tax Exhaustion Hypothesis Using Firms’ Responses to the Economic Recovery Tax Act of 1981.” Journal of Finance, 47 (1992), 1557-1568. Warner, J. B. “ Bankruptcy Costs: Some Evidence.” Journal of Finance, 32 (1977), 337-347. Welch, I. “ Capital Structure and Stock Returns.” Journal of Political Economy, 112 (2004), 106-131. Zimmerman, J. “ Taxes and Firm Size.” Journal of Accounting and Economics, 5 (1983), 119-149.
Table 1
Panel A: Banking sector and stock market indicators of sample countries Countries
Market Capitalization
Value Traded
Turnover Ratio
Listed Companies
Bank Credit
$-billions % of GDP % of GDP % of GDP 1990 2000 1990 1999 1990 1999 1990 2000 1990 2000 1990 1999
Market Capitalization: The share price times the number of shares outstanding. Value Traded: The total value of shares traded during the period. Turnover Ratio: The total value of shares traded during the period divided by the average market capitalization (average of the end-of-period values for the current and past values) for the period. Listed Companies: The number of domestically incorporated companies listed on the country’s stock exchanges at the end of the year. This indicator does not include investment companies, mutual funds or other collective investment vehicles. Bank Credit: Domestic credit provided by the banking sector. Source: World Development Report, World Bank. Panel B: Distribution of outstanding listed corporate equity among different categories of shareholders in 1996.
Non-financial Enterprises (%) 19 42 27 1 - Public Authorities (%) 2 4 1 1 - Households (%) 23 15 20 21 49 Rest of the World (%) 25 9 11 9 5
Total (%) 100 100 100 100 100 * end-1994. **Pension and investment funds are included. Source: Nestor and Thompson (2000).
Panel C: Selected Institutional Factors France Germany Japan UK US Legal origin French Germanic Germanic English English Legal tradition Code Code Code Common Common Anti-directors rights 2 1 3 4 5 Creditor Rights 0 3 2 4 1 Rule of law 8.98 9.23 8.98 8.57 10 Ownership concentration 0.34 0.48 0.18 0.19 0.20 Restrictions on Reorganizations 0 1 0 1 0 Efficiency of Judicial System 8 9 10 10 10 No automatic stay 0 1 0 1 0 Secured creditors first 0 1 1 1 1
Anti-directors rights index shows the level of shareholders’ rights ranging from zero (weakest) to six (strongest). Creditor rights index shows the level of creditors’ rights ranging from zero (weakest) to four (strongest). Rule of law assesses the law and order tradition to indicate the quality of law enforcement ranging from zero (least tradition) to ten (most tradition). Ownership concentration is the mean % of common shares owned by the largest three shareholders in the 10 largest private non-financial firms. Restrictions is one if the reorganization procedure imposes restrictions (e.g., creditors’ consent to file for reorganization), is zero if there are no such restrictions. Efficiency of judicial system assesses the integrity and efficiency of legal environment. It ranges from zero (least efficient) to ten (most efficient). No automatic stay is one if the reorganization procedure does not impose an automatic stay on the assets of the firm on filing the reorganization petition, zero otherwise; automatic stay prevents secured creditors from gaining possession of their security. Secured creditors first is one if secured creditors are ranked first in the distribution of the proceeds of the disposition of the bankrupt firm’ s assets, is zero if non-secured creditors are given absolute priority. Source: La Porta et al. (1997, 1998).
32
Table: 2 Summary statistics
This table records summary statistics of firm-specific variables. Book Leverage (BookLev) is the ratio of book value of total debt to book value of total assets. Market Leverage (MktLev) is the ratio of book value of total debt to market value of equity plus book value of total debt. Profitability (PROFIT) is the ratio of operating profit to book value of total assets. Market-to-Book Ratio (MBR) is the ratio of book value of total assets less book value of equity plus market value of equity to book value of total assets. Fixed Asset Ratio (FAR) is the ratio of net tangible assets to book value of total assets. Firm size (SIZE) is the natural logarithm of total sales. Effective Tax Rate (ETR) is the ratio of total tax charge to total taxable income. Earnings Volatility (EARNV) is the first-difference of earnings minus average of the first-differences. Dividend payout ratio (DIVID) is ordinary dividends to net income. Non-debt tax shields (NDTS) is the ratio of depreciation to total assets. Change in share price (CHSHP), or share price performance, is the difference between share prices at times [t] and [t-1] to share price at time [t-1]. All monetary units, for example SIZE, are measured in local currencies. The number of observations and firms in each country are in Appendix A
The data is pooled for all 5 countries and the modified version of equation (1) that includes four dummy variables to represent Germany, Japan, the U.K. and the U.S. (equation 1’ ) is estimated.
0 1 , 1 ,1
(1’) it i t k k it j i t itk
Y Y X DD D J P K H� � � � � � � �¦
The dummy variable (Dj) for a given country takes the value of 1 if the firm is from country j, and 0 otherwise. See Appendix B for variable definitions. Asymptotic standard errors that are robust to heteroscedasticity and small sample bias are given in the parentheses. Correlation 1 and 2 are the first and second order autocorrelation of residuals, which is asymptotically distributed as N (0,1) under the null of no serial correlation. Sargan’ s Test is a test of the over-identifying UHVWULFWLRQV��DV\PSWRWLFDOO\�GLVWULEXWHG�DV� 2 (df) under the null of instruments' validity. The Wald statistics tests the joint VLJQLILFDQFH�RI�HVWLPDWHG�FRHIILFLHQWV��DV\PSWRWLFDOO\�GLVWULEXWHG�DV� 2 (df) under the null of no relationship. (*), (**) and (***) indicate that coefficients are significant at 10, 5 and 1 percent level of significance, respectively.
34
Table 4
The determinants of capital structure in G-5 countries including corporate governance factors: system-GMM
Explanatory Variables Predicted Sign Market Leverage Model I Model II Model III
The data is pooled for all 5 countries and a modified version of equation (1) that includes corporate governance variables (equation 1” ) is estimated:
0 1 , 1 ,1
(1’’) it i t k k it j i t itk
Y Y X CG�� � ���� �� � � � �����¦
Four factors representing the corporate governance systems (CGj) in country j (j=1,5) are introduced in the model. See Appendix B for variable definitions. Asymptotic standard errors that are robust to heteroscedasticity and small sample bias are in the parentheses. Correlation 1 and 2 are the first and second order autocorrelation of residuals, which is asymptotically distributed as N (0,1) under the null of no serial correlation. Sargan’ s Test is test of the over-identifying restrictions, DV\PSWRWLFDOO\�GLVWULEXWHG�DV� 2 (df) under the null of instruments' validity. The Wald statistics tests the joint significance of HVWLPDWHG�FRHIILFLHQWV��DV\PSWRWLFDOO\�GLVWULEXWHG�DV� 2 (df) under the null of no relationship. (*), (**) and (***) indicate that coefficients are significant at 10, 5 and 1 percent level of significance, respectively.
Table 5
The determinants of market-leverage using system-GMM: cross-country comparison
Explanatory Variables Predicted sign France Germany Japan UK USA
Equation (1) is estimated for each sample country.
0 1 , 1 ,1
(1) it i t k k it i t itk
Y Y XD D J P K H� � � � � � �¦
See Appendix B for variable definitions. Asymptotic standard errors that are robust to heteroscedasticity and small sample bias are reported in parentheses. Correlation 1 and 2 are the first and second order autocorrelation of residuals, which is asymptotically distributed as N (0,1) under the null of no serial correlation. Sargan’ s Test is test of the over-identifying restrictions, asymptotically GLVWULEXWHG�DV� 2 (df) under the null of instruments' validity. The Wald statistics tests the joint significance of estimated coefficients; asymptotically distributeG�DV� 2 (df) under the null of no relationship. (*), (**) and (***) indicate that coefficients are significant at 10, 5 and 1 percent level, respectively.
36
Table 6 Corporate capital structure in G-5 countries using system-GMM: Static long-run results
Explanatory Variables Market Leverage Predicted Sign France Germany Japan UK USA Profitabilityi,t -/+ -0.610** -0.359* 4.747*** -0.368*** -0.987***
See Appendix B for variable definitions. Asymptotic standard errors that are robust to heteroscedasticity and small sample bias are reported in parentheses. *, ** and *** indicate that coefficients are significant at 10, 5, and 1 percent, respectively. The significance level is obtained by dividing the estimated long-run coefficient with its standard error. The long-run relationship between Yi,t and Xi,t in equation (1) is estimated as follows:
*,
1
*
1 itkk
it XY DJ�
37
Table: 7
Factors affecting market leverage of firms in G-5 countries: system-GMM (pooled)
Explanatory Variables
Firm Size Growth Opportunities Industry Sample Year Small Large Low High Service Manufacturing 1987-1993 1994-2000
The data is pooled for all 5 countries and the modified version of equation (1) that includes four dummy variables to represent Germany, Japan, the U.K. and the U.S is estimated:
0 1 , 1 ,1
(1’) it i t k k it j i t itk
Y Y X DD D J P K H� � � � � � � �¦
See Appendix B for variable definitions. Asymptotic standard errors that are robust to heteroscedasticity and small sample bias are given in the parentheses. Correlation 1 and 2 are the first and second order autocorrelation of residuals, which is asymptotically distributed as N (0,1) under the null of no serial correlation. Sargan’ s Test is test of the over-identifying restrictions, asymptotically distributeG� DV� 2(df) under the null of instruments' validity. The Wald statistics tests the joint significance of estimated coefficients; asymptotically distributed DV� 2 (df) under the null of no relationship. (*), (**) and (***) indicate that coefficients are significant at 10, 5 and 1 percent level, respectively. See Appendix D for industry groupings.
38
Appendix A
The structure of panel data
a) Number of firms b) Number of observations N
(years) France Germany Japan UK US Year France Germany Japan UK USA
Total 244 479 1,442 1,562 1,127 Total 2,513 5,744 18,963 16,363 13,551
Total sample-firms 4,854 Total sample-observations 57,134
All dead and alive firms whose data are available are included in the initial sample. The total number of non-financial firms stands at 1,235 for France; 1,590 for Germany; 1,671 for Japan; 3,153 for the UK and 5042 for the USA. Our dynamic models require at least 3 consecutive observations. However, to improve the reliability of diagnostics, firms with less than five consecutive observations and missing variables are excluded from the sample. The final sample comprises of 4,854 unique firms with 57,134 firm-year observations distributed as below. The panel data set is unbalanced as there are more observations for some firms than for others. Sections in the table below are as follows: a) Number of firms having ’n’ continuous observations during the period; b) number of observations in each year. Unless otherwise stated, data are compiled from Datastream.
39
Appendix B Variable definition
Variables Definition / Source
The Dependent Variable: Book-Leverage Ratio of book value of total debt to book value of total assets.
Market-Leverage Ratio of book value of total debt to market value of equity plus book value of total debt.
The Explanatory Variables: Profitability Ratio of operating profit to book value of total assets.
Growth opportunities Market value-to-book value ratio. Ratio of book value of total assets less book value of equity plus market value of equity to book value of total assets.
Tangibility of assets Ratio of net tangible assets to total assets (book value).
Firm size Natural logarithm of total annual sales based on 1987 prices. Alternative measure: natural logarithm of total annual assets based on 1987 prices.
Effective tax rate Ratio of total tax to total taxable income.
Earnings volatility First-difference of annual earnings (% change) minus average of the first-differences.
Dividend payout Ratio of ordinary dividends to net income for each year.
Non-debt tax shield Deprecation to total assets ratio (annual).
Share price performance Annual change in the share price. On average, a lag of six-month is expected to cover for the time required for decision making, preparing documents for raising debt or equity capital from the market, seeking approval from the stock exchanges, the issue to be subscribed by the investors and the effect to appear in the annual books of accounts. Therefore, the change in share price is matched to the month of the firm’ s fiscal year-end with a six-month lag.
The Control Factors: Equity premium Annual equity premium. This is measured as the difference between the annual return on the
stock market index (FT-All Share) and the return on three month treasury-bills (annualized). This variable is matched to the month of the firm’ s fiscal year-end with a six-month lag for the reasons explained in the case of “ share price performance” variable.
Term-structure of interest rate Annualized difference between the yields on long-term government bonds and the three-month treasury-bills. This variable is matched to the month of firm’ s fiscal year-end with a six-month lag for the reasons explained in the case of “ share price performance” variable.
M&A activity The number of the M&A deals in an industry in a given year divided by the total number of M&A deals in the country during the year. Alternative measures used are: (a) ratio of number of delisted firms to total number of listed companies in the market for each year, and (b) ratio of M&A deals in a given year to total M&A deals during the sample period (1987-2000). Mergers & Acquisitions details, required to compile the above measures for each country, are compiled from SDC Platinum (Thomson Financial) database.
Rule of Law Assessment of the law and order tradition to indicate the quality of law enforcement ranging from zero (least tradition) to ten (most tradition). Source: La Porta et al. (1997, 1998).
Ownership concentration Mean percentage of common shares owned by the largest three shareholders in the 10 largest private non-financial firms. Source: La Porta et al. (1997, 1998).
Creditor rights Index showing the level of creditors’ rights ranging from zero (weakest) to four (strongest). Source: La Porta et al. (1997, 1998).
Anti-director rights Index showing the level of shareholders’ rights ranging from zero (weakest) to six (strongest). Source: La Porta et al. (1997, 1998).
The variables used in the paper are defined in this appendix. The sample comprises of all non-financial firms, including dead firms, traded in the major stock exchanges of the sample countries covering annual observations from 1987 to 2000. Unless otherwise stated, all data are compiled from Datastream and measured for the end of company’ s accounting year.
40
Appendix C A summary of selected studies on the Determinants of Capital Structure
Explanatory variable Positive relation with leverage Negative relation with leverage No relation with leverage Lagged Leverage
Frank and Goyal (2004), MacKie-Mason (1990b), Miguel and Pindado (2001), Ozkan (2001)
De Jong and Veld (2001), Flannery and Rangan (2006), Kester (1986), Rajan and Zingales (1995), Titman and Wessels (1988)
Growth opportunities (Market-to-book ratio)
Kremp et al. (1999), MacKay and Phillips (2005)
Flannery and Rangan (2006), Hovakimian (2004), Johnson (1998), Mao (2003), Myers (1977), Rajan and Zingales (1995), Maksimovic et al. (1999), Miao (2005)
Fixed assets ratio Alderson and Betker (1995), Flannery and Rangan (2006), Mao (2003), Myers (1977), Scott (1977), Titman and Wessels (1988)
Leary and Roberts (2005) Hovakimian et al. (2004)
Firm size Flannery and Rangan (2006), Friend and Lang (1988), Hovakimian et al. (2004), MacKay and Phillips (2005), Mao (2003)
Johnson (1998), Kester (1986), Titman and Wessels (1988)
Chung (1993), Ferri and Jones (1979), and Kim and Sorensen (1986)
Effective tax rate Haugen and Senbet (1986), Swoboda and Zechner (1995), Taub (1975), Zimmerman (1983)
Kremp et al. (1999), Taub (1975)
Ang and Peterson (1986), Bradley et al. (1984), Fischer et al. (1989), Titman and Wessels (1988)
Earnings volatility Leary and Roberts (2005)
Dividend payout Chang and Rhee (1990) Rozeff (1982)
Non-debt tax shields Bradley et al. (1984), Titman and Wessels (1988), MacKie-Mason (1990a), Mao (2003, for high-growth firms)
DeAngelo and Masulis (1980); Leary and Roberts (2005); Miguel and Pindado (2001), Mao (2003, for low-growth firms)
Share price performance
Hovakimian et al. (2004); Korajczyk and Levy (2003)
Presence of optimal capital structure
Fama and French (2002), Flannery and Rangan (2006), Frank and Goyal (2004), Graham and Harvey (2001), Hovakimian et al. (2004), Johnson (1998), Ju et al. (2005), Korajczyk and Levy (2003), Leary and Roberts (2005), MacKie-Mason (1990b), Mao (2003), Miguel and Pindado (2001), Ozkan (2001)
41
Appendix D
Industry Classification
No Industry Name Two Groups 1 Automotive, Aviation and transportation Manufacturing 2 Beverages, Tobacco Manufacturing 3 Building and construction Manufacturing 4 Chemicals, Healthcare, Pharmaceuticals Manufacturing 5 Computer, Electrical and electronic equipment Manufacturing 6 Diversified industry Manufacturing 7 Engineering, Mining, Metallurgy, Oil and gas exploration Manufacturing 8 Food producer and processors, Farming and fishing Manufacturing 9 Leisure, Hotels, restaurants and pubs Services 10 Other business Services 11 Paper, Forestry, Packaging, Printing and Publishing, Photography Services 12 Retailers, Wholesalers and distributors Services 13 Services Services 14 Textile, Leather, Clothing, Footwear and furniture Manufacturing 15 Utilities Services