08 July 2020 Sector Update Cement HSIE Research is also available on Bloomberg ERH HDF <GO> & Thomson Reuters Prices, retail sales hold up despite COVID Despite the ongoing COVID situation, cement demand recovered MoM in June, driven by strong traction in retail sales (semi-urban/rural areas) while non-trade sales continued to decline. Our channel checks suggest sales in north/central/east regions printed flattish to marginal growth. Even in the south and west India, the volume decline rate moderated to ~20-30% YoY in June vs ~40% in May. These factors imply that 1QFY21 sales would decline ~20% YoY in the north and ~40% in the south. Cement prices mostly held up in June, bolstering 1Q realization YoY across the south (+11%), north (+6%), and central (+2%) India. West and east prices are down ~1% and 2% YoY respectively. We believe that falling energy costs could further cushion the impact of dwindling demand on profitability. Resilient demand in the northern half of India: As per our channel checks, cement sales in the north/central/east regions fell 20-25% YoY in 1QFY21. It implies that demand was fairly strong (flattish to marginal growth) in the month of June! Lower impact of Covid in rural/semi urban areas along with better availability of incoming labourers led to healthy demand in these regions. However, the fall in 1Q sales in the south/west regions was much sharper at ~45%/30% YoY on overall weak demand in the south and larger non-trade share in Maharashtra. Prices cool off marginally MoM in Jun’20; strong gains QoQ: On the significant price increase taken in April/May, there was a marginal correction MoM across all regions. Trade prices in north/central/east regions cooled off 4/2/2% MoM in June 2020. East prices remained flat MoM. Prices in south moderated 7% MoM (after a spike in April/May). As prices remained firm across all the three months, 1QFY21 trade prices are up 6/5/9/4/26% QoQ. North/central prices remain buoyant YoY, south flares up: North and central prices further firmed up 6% and 2% YoY respectively on healthy retail demand. South prices buoyed the most (+11% YoY) as companies focused on remunerative pricing amidst a sharp volume decline. Despite the recent hikes, east/west prices are expected to be down 2/1% YoY. Weak YoY pricing in Maharashtra drags west realization down. In the east, pricing is higher YoY in the NE region and in Chhattisgarh (+7% YoY). Falling energy cost: Petcoke prices (both domestic and imported) cooled off 4% QoQ, leading to a 20-30% YoY decline. Imported coal prices fell sharply during 1Q: South African coal was down 25%/11% QoQ/YoY, and Indonesian coal fell 10%/15% QoQ/YoY. Despite sharp slump in crude prices, the Indian government’s sharp tax hikes in June elevated diesel prices by 1/1% YoY/QoQ. Trade cement price trend Rs/bag Jun-20 MoM (%) YoY (%) 1QFY21 QoQ (%) YoY (%) North 348 (4.1) 1.5 358 6.4 6.2 Central 361 (2.4) 0.6 366 5.2 2.2 East 341 (2.4) (0.4) 343 8.5 (2.4) West 346 (0.4) (0.4) 345 4.4 (0.5) South 390 (6.8) 7.8 411 26.1 11.1 Pan India 357 (3.4) 1.9 364 10.0 3.4 Source: HSIE Research COMPANY RATING TP (Rs.) UltraTech BUY 4,720 Shree Cement REDUCE 17,900 Ambuja Cem BUY 210 ACC BUY 1,440 Ramco Cem ADD 685 Dalmia Bharat BUY 930 JK Cement BUY 1,425 Star Cement BUY 115 JK Lakshmi BUY 370 Orient Cement BUY 85 Deccan Cem BUY 370 Rajesh Ravi [email protected]+91-22-6171-7352 Saurabh Dugar [email protected]+91-22-6171-7353
Transcript
08 July 2020 Sector Update
Cement
HSIE Research is also available on Bloomberg ERH HDF <GO> & Thomson Reuters
Prices, retail sales hold up despite COVID Despite the ongoing COVID situation, cement demand recovered MoM in
June, driven by strong traction in retail sales (semi-urban/rural areas) while
non-trade sales continued to decline. Our channel checks suggest sales in
north/central/east regions printed flattish to marginal growth. Even in the
south and west India, the volume decline rate moderated to ~20-30% YoY in
June vs ~40% in May. These factors imply that 1QFY21 sales would decline
~20% YoY in the north and ~40% in the south. Cement prices mostly held up
in June, bolstering 1Q realization YoY across the south (+11%), north (+6%),
and central (+2%) India. West and east prices are down ~1% and 2% YoY
respectively. We believe that falling energy costs could further cushion the
impact of dwindling demand on profitability.
Resilient demand in the northern half of India: As per our channel checks,
cement sales in the north/central/east regions fell 20-25% YoY in 1QFY21. It
implies that demand was fairly strong (flattish to marginal growth) in the
month of June! Lower impact of Covid in rural/semi urban areas along with
better availability of incoming labourers led to healthy demand in these
regions. However, the fall in 1Q sales in the south/west regions was much
sharper at ~45%/30% YoY on overall weak demand in the south and larger
non-trade share in Maharashtra.
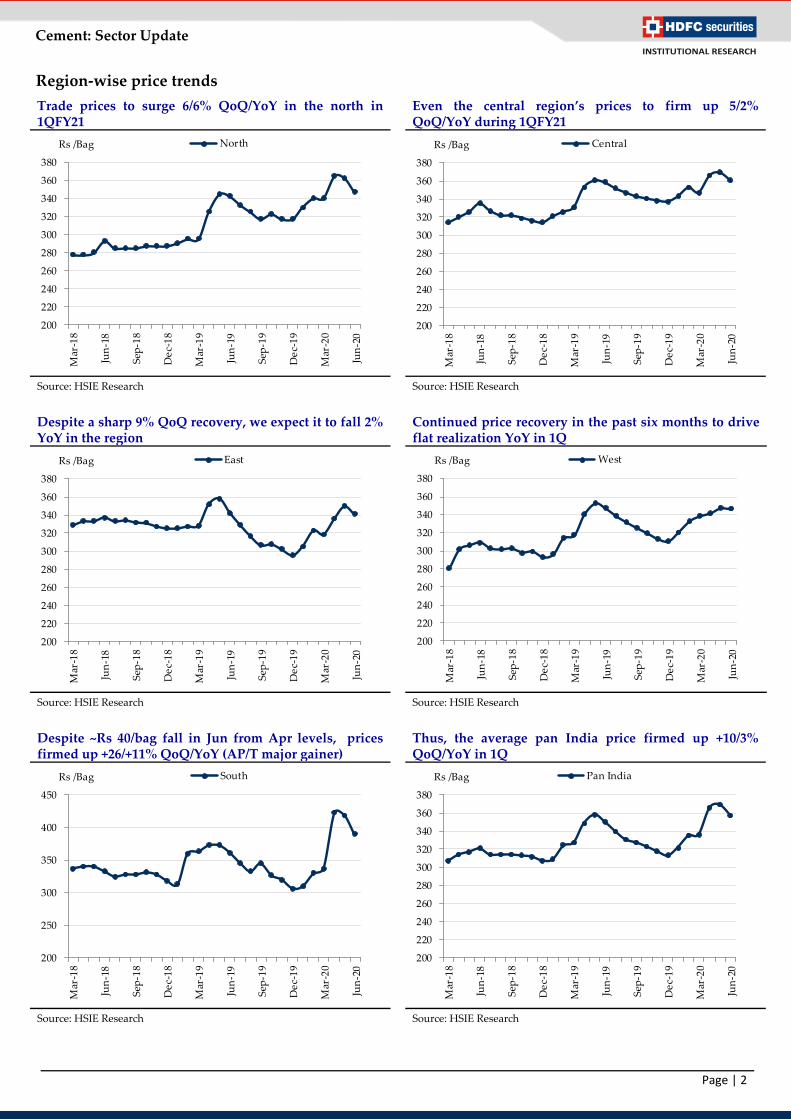
Prices cool off marginally MoM in Jun’20; strong gains QoQ: On the
significant price increase taken in April/May, there was a marginal
correction MoM across all regions. Trade prices in north/central/east regions
cooled off 4/2/2% MoM in June 2020. East prices remained flat MoM. Prices
in south moderated 7% MoM (after a spike in April/May). As prices
remained firm across all the three months, 1QFY21 trade prices are up
6/5/9/4/26% QoQ.
North/central prices remain buoyant YoY, south flares up: North and
central prices further firmed up 6% and 2% YoY respectively on healthy
retail demand. South prices buoyed the most (+11% YoY) as companies
focused on remunerative pricing amidst a sharp volume decline. Despite the
recent hikes, east/west prices are expected to be down 2/1% YoY. Weak YoY
pricing in Maharashtra drags west realization down. In the east, pricing is
higher YoY in the NE region and in Chhattisgarh (+7% YoY).
Falling energy cost: Petcoke prices (both domestic and imported) cooled off
4% QoQ, leading to a 20-30% YoY decline. Imported coal prices fell sharply
during 1Q: South African coal was down 25%/11% QoQ/YoY, and
Indonesian coal fell 10%/15% QoQ/YoY. Despite sharp slump in crude
prices, the Indian government’s sharp tax hikes in June elevated diesel
We, Rajesh Ravi, MBA & Saurabh Dugar, MBA authors and the names subscribed to this report, hereby certify that all of the views expressed in this research
report accurately reflect our views about the subject issuer(s) or securities. HSL has no material adverse disciplinary history as on the date of publication of this
report. We also certify that no part of our compensation was, is, or will be directly or indirectly related to the specific recommendation(s) or view(s) in this report.
Research Analyst or his/her relative or HDFC Securities Ltd. does not have any financial interest in the subject company. Also Research Analyst or his relative or
HDFC Securities Ltd. or its Associate may have beneficial ownership of 1% or more in the subject company at the end of the month immediately preceding the
date of publication of the Research Report. Further Research Analyst or his relative or HDFC Securities Ltd. or its associate does not have any material conflict of
interest.
Any holding in stock –No
HDFC Securities Limited (HSL) is a SEBI Registered Research Analyst having registration no. INH000002475.
Disclaimer:
This report has been prepared by HDFC Securities Ltd and is solely for information of the recipient only. The report must not be used as a singular basis of any
investment decision. The views herein are of a general nature and do not consider the risk appetite or the particular circumstances of an individual investor;
readers are requested to take professional advice before investing. Nothing in this document should be construed as investment advice. Each recipient of this
document should make such investigations as they deem necessary to arrive at an independent evaluation of an investment in securities of the companies referred
to in this document (including merits and risks) and should consult their own advisors to determine merits and risks of such investment. The information and
opinions contained herein have been compiled or arrived at, based upon information obtained in good faith from sources believed to be reliable. Such information
has not been independently verified and no guaranty, representation of warranty, express or implied, is made as to its accuracy, completeness or correctness. All
such information and opinions are subject to change without notice. Descriptions of any company or companies or their securities mentioned herein are not
intended to be complete. HSL is not obliged to update this report for such changes. HSL has the right to make changes and modifications at any time.
This report is not directed to, or intended for display, downloading, printing, reproducing or for distribution to or use by, any person or entity who is a citizen or
resident or located in any locality, state, country or other jurisdiction where such distribution, publication, reproduction, availability or use would be contrary to
law or regulation or what would subject HSL or its affiliates to any registration or licensing requirement within such jurisdiction.
If this report is inadvertently sent or has reached any person in such country, especially, United States of America, the same should be ignored and brought to the
attention of the sender. This document may not be reproduced, distributed or published in whole or in part, directly or indirectly, for any purposes or in any
manner.
Foreign currencies denominated securities, wherever mentioned, are subject to exchange rate fluctuations, which could have an adverse effect on their value or
price, or the income derived from them. In addition, investors in securities such as ADRs, the values of which are influenced by foreign currencies effectively
assume currency risk. It should not be considered to be taken as an offer to sell or a solicitation to buy any security.
This document is not, and should not, be construed as an offer or solicitation of an offer, to buy or sell any securities or other financial instruments. This report
should not be construed as an invitation or solicitation to do business with HSL. HSL may from time to time solicit from, or perform broking, or other services for,
any company mentioned in this mail and/or its attachments.
HSL and its affiliated company(ies), their directors and employees may; (a) from time to time, have a long or short position in, and buy or sell the securities of the
company(ies) mentioned herein or (b) be engaged in any other transaction involving such securities and earn brokerage or other compensation or act as a market
maker in the financial instruments of the company(ies) discussed herein or act as an advisor or lender/borrower to such company(ies) or may have any other
potential conflict of interests with respect to any recommendation and other related information and opinions.
HSL, its directors, analysts or employees do not take any responsibility, financial or otherwise, of the losses or the damages sustained due to the investments made
or any action taken on basis of this report, including but not restricted to, fluctuation in the prices of shares and bonds, changes in the currency rates, diminution
in the NAVs, reduction in the dividend or income, etc.
HSL and other group companies, its directors, associates, employees may have various positions in any of the stocks, securities and financial instruments dealt in
the report, or may make sell or purchase or other deals in these securities from time to time or may deal in other securities of the companies / organizations
described in this report.
HSL or its associates might have managed or co-managed public offering of securities for the subject company or might have been mandated by the subject
company for any other assignment in the past twelve months.
HSL or its associates might have received any compensation from the companies mentioned in the report during the period preceding twelve months from t date
of this report for services in respect of managing or co-managing public offerings, corporate finance, investment banking or merchant banking, brokerage services
or other advisory service in a merger or specific transaction in the normal course of business.
HSL or its analysts did not receive any compensation or other benefits from the companies mentioned in the report or third party in connection with preparation
of the research report. Accordingly, neither HSL nor Research Analysts have any material conflict of interest at the time of publication of this report.
Compensation of our Research Analysts is not based on any specific merchant banking, investment banking or brokerage service transactions. HSL may have
issued other reports that are inconsistent with and reach different conclusion from the information presented in this report.
Research entity has not been engaged in market making activity for the subject company. Research analyst has not served as an officer, director or employee of the
subject company. We have not received any compensation/benefits from the subject company or third party in connection with the Research Report.
HDFC securities Limited, I Think Techno Campus, Building - B, "Alpha", Office Floor 8, Near Kanjurmarg Station, Opp. Crompton Greaves, Kanjurmarg