Introduction World trade generally rises and falls with the overall level of global economic activity. Global trading activities were sluggish during 2012, it declined to 2.0 percent from 5.2 percent in 2011 and is expected to continue in 2013 at around 3.3 percent on account of slowdown in Europe The abrupt deceleration of trade in 2012 was attributed to slow growth in developed economies. Fig-8.1: The growth of world merchandise trade in 2012 was much lower compared to the rate of World Gross Domestic Product (GDP) growth for the year. Under normal conditions, the growth rate for trade is usually around twice that of GDP, but in 2012 the ratio of trade growth to GDP growth fell to 1:1. Four years after the eruption of the global financial crisis, the world economy is still struggling to recover. During 2012, global economic growth has weakened further. A growing number of developed economies have fallen into a double-dip recession. Those in severe sovereign debt distress moved even deeper into recession, caught in the downward spiraling dynamics from high unemployment, weak aggregate demand compounded by fiscal austerity, high public debt burdens, and financial sector fragility. Growth in the major developing countries and economies in transaction has also decelerated notably, reflecting both external vulnerabilities and domestic challenges. Most low-income countries have held up relatively well so far, but now face intensified adverse spillover effects from the slowdown in both developed and major middle- income countries. The prospects for the next two years continue to be challenging, loaded with major uncertainties and risks inclined towards the downside. According to UN report on a set of some assumptions, growth of World of Gross Product (WGP) is around 2.2 percent in 2012 and is forecast to remain well below potential at 2.4 percent in 2013 and 3.2 percent in 2014. At this moderate pace, many economies will continue to operate below potential. After plunging by more than 10 percent in the Great Recession 2009, world trade rebounded strongly in 2010. Since 2011, the recovery of the volume of world exports has lost momentum. Growth of world trade decelerated sharply during 2012, mainly owing to declining import demand in Europe, as the region entered in to its second recession in three years, and weak aggregate demand in the United States and Japan. As a result, developing countries and economies in transition have seen demand for their exports weaken. The trade data of different regions and countries showed a clear sequence of the weakening demand that originated in the Euro Area transmitting to the rest of the word. Import demand in Greece, Italy, Portugal and Spain started to decline in late 2011 and fell further during 2012, but the weakness in trade activity has spread further to the rest of Europe as well, including France and Germany. As a result, imports of the United States and Japan also slowed significantly in the second half of 2012. East Asian economies that trade significantly with the major developed countries have experienced commensurate declines in exports. For example, the republic of Korea, and Taiwan registered considerable drops in exports during 2012. China’s exports also declined notably. Further down the global value chain, energy and other primary exporting economies have seen demand for their exports weaken as well. Brazil and the Russian Federation, for instance, all registered export declines in varying degrees in the second half of 2012. Lower export earnings, compounded by domestic demand constraints have also pushed down Chapter 8 Trade and Payments
Transcript
Introduction
World trade generally rises and falls with the overall level of global economic activity. Global trading activities were sluggish during 2012, it declined to 2.0 percent from 5.2 percent in 2011 and is expected to continue in 2013 at around 3.3 percent on account of slowdown in Europe The abrupt deceleration of trade in 2012 was attributed to slow growth in developed economies.
Fig-8.1:
The growth of world merchandise trade in 2012 was much lower compared to the rate of World Gross Domestic Product (GDP) growth for the year. Under normal conditions, the growth rate for trade is usually around twice that of GDP, but in 2012 the ratio of trade growth to GDP growth fell to 1:1.
Four years after the eruption of the global financial crisis, the world economy is still struggling to recover. During 2012, global economic growth has weakened further. A growing number of developed economies have fallen into a double-dip recession. Those in severe sovereign debt distress moved even deeper into recession, caught in the downward spiraling dynamics from high unemployment, weak aggregate demand compounded by fiscal austerity, high public debt burdens, and financial sector fragility. Growth in the major developing countries and economies in transaction has also decelerated notably, reflecting both external vulnerabilities and domestic challenges. Most low-income countries have held up relatively well so far, but now face intensified adverse spillover effects from the slowdown in both developed and major middle-
income countries. The prospects for the next two years continue to be challenging, loaded with major uncertainties and risks inclined towards the downside.
According to UN report on a set of some assumptions, growth of World of Gross Product (WGP) is around 2.2 percent in 2012 and is forecast to remain well below potential at 2.4 percent in 2013 and 3.2 percent in 2014. At this moderate pace, many economies will continue to operate below potential.
After plunging by more than 10 percent in the Great Recession 2009, world trade rebounded strongly in 2010. Since 2011, the recovery of the volume of world exports has lost momentum. Growth of world trade decelerated sharply during 2012, mainly owing to declining import demand in Europe, as the region entered in to its second recession in three years, and weak aggregate demand in the United States and Japan. As a result, developing countries and economies in transition have seen demand for their exports weaken.
The trade data of different regions and countries showed a clear sequence of the weakening demand that originated in the Euro Area transmitting to the rest of the word. Import demand in Greece, Italy, Portugal and Spain started to decline in late 2011 and fell further during 2012, but the weakness in trade activity has spread further to the rest of Europe as well, including France and Germany. As a result, imports of the United States and Japan also slowed significantly in the second half of 2012. East Asian economies that trade significantly with the major developed countries have experienced commensurate declines in exports. For example, the republic of Korea, and Taiwan registered considerable drops in exports during 2012. China’s exports also declined notably. Further down the global value chain, energy and other primary exporting economies have seen demand for their exports weaken as well. Brazil and the Russian Federation, for instance, all registered export declines in varying degrees in the second half of 2012. Lower export earnings, compounded by domestic demand constraints have also pushed down
Chapter 8
Trade and Payments
102 Pakistan Economic Survey 2012-13
GDP growth in many developing countries and economies in transition during 2012. This has led to flagging import demand from these economies, further slowing trade of developed countries.
In the outlook for 2013, the continued weak global growth outlook and heightened uncertainties lead to expectations that world trade will continue to expand at a rather moderate pace of 4.3 percent in volume terms in 2013, compared to 3.3 percent in 2012 and 6.8 percent during 2005-2008.
Pakistan recent trade data also reflects the spillover effects in the growth of our exports. Geographically, the EU and the US represent the most important destinations of Pakistan exports and their markets absorb 31 percent and 23 percent of exports. While China represents the third most important destination with an 11.5 percent share. UAE,
Afghanistan, Oman and Turkey have recently become important destinations. Therefore, slow down in US and European economies and weak demand have significant impact on Pakistan’s export growth.
Exports
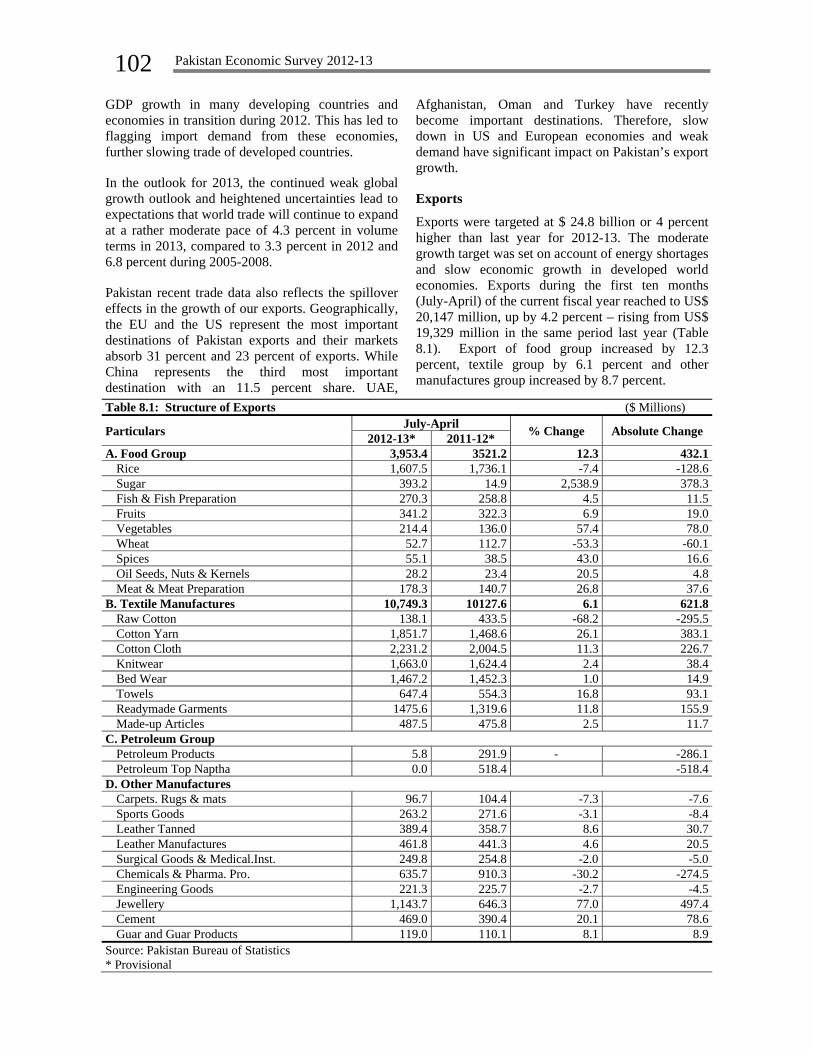
Exports were targeted at $ 24.8 billion or 4 percent higher than last year for 2012-13. The moderate growth target was set on account of energy shortages and slow economic growth in developed world economies. Exports during the first ten months (July-April) of the current fiscal year reached to US$ 20,147 million, up by 4.2 percent – rising from US$ 19,329 million in the same period last year (Table 8.1). Export of food group increased by 12.3 percent, textile group by 6.1 percent and other manufactures group increased by 8.7 percent.
The increase in food group is attributed to an increase of 57.4 percent, 43.0 percent and 26.8 percent in export of vegetables, spices and meat and meat preparation, respectively, during current year. Export of sugar also brought valuable foreign exchange of US$ 393.2 million to the national exchequer during this year as its export quantity increased considerably to 174,876 MT during Jul-April, FY13 from only 25,180 MT during same period last year. However, export of rice declined by 7.4 percent due to 10 percent lesser production and delay in harvesting due to late monsoon rain which kept the domestic price higher. Moreover, other competitors in rice export also kept the international market less favourable for Pakistani rice. The price and quantity both affected the value of export of rice this year. Total fall of 7.4 percent in export of rice during Jul-April, FY13 was around negatively contributed by 57.4 percent by quantity and 42.6 percent positively by unit value. In quantum terms it registered a net loss of US$ 304.5 million while the favourable prices contributed positively by US$ 226.2 million. One more aspect regarding export of rice which needs to be highlighted is the continued rise in the proportion of non basmati rice in overall export of rice which also affected the total export value of rice and the other reason was introduction of a high yield basmati rice variety in India last year capturing a substantial portion of international rice market. Other commodities fruits, vegetables, fish and meat preparations witnessed favourable trends in terms of value while price and quantity effects remained mix. Quantity of export of vegetables witnessed substantial improvement of 60 percent during first ten months of FY13 against same period last year. Export of wheat declined considerably (53.3 percent) due to unfavorable international prices during 2012-13 compared to 2011-12. The decline in wheat export is also attributed to higher increase in domestic cost of production due to high input prices like fertilizer, insecticides, transportation cost and power cost resulting its non competitiveness in the international market.
Exports of textile manufactures grew by 6.1 percent during Jul-April FY13 compared to same period last year and remained at US$ 10.7 billion. The gain in textile group is primarily due to increased exported quantity and favorable prices in international market. The expansion was broad based with visible increase in the export of cotton yarn, towels readymade garments, etc. Estimates suggest that both positive quantity and price effects contributed for the gain in textile sector. Prominent among these are the export
of cotton yarn (26.1 percent growth), towels (16.8 percent), readymade garments (11.8 percent) cotton cloth (11.3 percent), and made up articles (2.5 percent). Export of knitwear and bed wear, however, could not perform and registered a meager growth of 2.4 percent and 1.0 percent, respectively. Export of raw cotton declined by 68.2 percent during this period which is a positive sign. Recent data of growth in exports in the month of April was mainly driven by bed-wear, towels and readymade garments, which are valued-added products. The lessening of the power crisis and the restoration of electricity and gas supply to textile industries in Punjab in later part of winter has given some hope of achieving the set target of US$ 14 billion in textile and garment exports from Pakistan by the end of current fiscal year. The European Union preferential package on import of 75 items was in operation since December 2012 and our exporters have received more orders than in normal circumstances because of preferential duties. The growth in yarn and fabric exports was on account of improved energy supply and also on account of owners are installing their own power generating units to overcome the crises which helped in growth and export of home textile; towels and bed-wear as well.
The exports of jewellery during ten months of current fiscal year have witnessed sharp increase of 77 percent. The jewellery exports during the period under review is recorded at US$ 1.1 billion while during same period last year its export stood at US$ 646.3 million. Pakistan’s jewellery exports to the rest of the world are rising much faster than to EU where the expatriate Pakistan origin has more spending power than in other areas. Moreover, removal of Indian jewellery from US GSP led to doubling of Pakistan jewellery export to the US. Cement sector also performed well and registered a growth of 20.1 percent during Jul-April, FY13 with a contribution of US$ 469 million to the overall exports. The rise in Cement export was led by a strong demand from African and Afghanistan markets. Most of the items under other manufactures group witnessed moderate growth in export value mainly due to the price effect whereas quantity effect in most of the items was negative or weak.
Exports of engineering goods, petroleum products, and chemical & pharmaceutical products showed negative trends. Export of petroleum products declined sharply and stood at only $ 5.8 million against $291.9 million during the same period last year whereas export of chemical & pharmaceutical
104 Pakistan Economic Survey 2012-13
products declined by 30.2 percent and stood at US$ 635.7 million.
In absolute term the overall exports posted an increase of $ 818 million in the first ten months of the current fiscal year over the same period last year. Of this increase, 76 percent or US$ 621.8 million was contributed by textile manufactures while all other items increased by 24 percent or $196.2 million. This increase of $ 818 million was slashed due to a decline in exports of rice ($ 128.6 million).
Trends in Monthly Exports
The monthly exports for the period July-April, 2012-13 remained mostly above the corresponding months of last year, averaging $ 2019 million per month as against an average of $ 1933 million last year. [Table 8.2]
Concentration of Exports
Pakistan's exports are highly concentrated in few items namely, cotton & cotton manufactures, leather, rice and few others. Jewllery has recently become another mentionable item of our exports. The first three categories i-e cotton & cotton manufactures, leather, rice exports account for 63.7 percent of total exports during the first nine months of 2012-13 with cotton manufacturers alone contributing 51.4
percent. The degree of concentration has changed over the years when these items contributed around 70 percent of our total exports. However, as compared to last year it has not been improved. Further disaggregation reveals that almost all the export earnings have originated from textile manufactures. This pattern shows that Pakistan’s export is still concentrated in few items. The annual percentage shares of the major export commodities are given in Table 8.3.
Table 8.2: Monthly Exports Month ($ Million)
2012-13* 2011-12 July 2057.5 2157.5August 1911.2 1945.4September 2218.5 1831.5October 2015.6 1880.1November 1895.6 1533.1December 1969.5 1854.2January 2023.2 1916February 1835.5 2010.2March 2134.1 1972.6April 2130 2229Total 20190.7 19329.6Monthly Average 2019.1 1933Source: Federal Bureau of Statistics. *: Provisional
Although Pakistan trade with a large number of countries, its exports are highly concentrated in few countries including USA, Germany, Japan, UK, Hong Kong, UAE and Saudi Arabia. The United States is the single largest export market for Pakistan, accounting for 15 percent of its exports followed by UAE, U.K and Germany. Despite concentrated in few markets, Pakistan has witnessed some geographical diversification in exports during last few years. Few years back, around 43 percent of the country’s exports were concentrated in five markets (USA, UK, Germany, Hong Kong and
U.A.E.) of the world and remaining share of all other countries was 57 percent. This concentration is on continuous decline and the share of these five market is now stood at 36.3 percent during current fiscal year whereas the share of all other countries increased to 63.7 percent. This improvement in geographical diversification was mainly the result of the Strategic Trade Policy Framework (STPF-2009-12 and the resulting increase in exports to China, Afghanistan and Bangladesh.
Pakistan needs to diversify its exports not only in terms of commodities but also in terms of markets.
Trade and Payments 105
Heavy concentration of exports in few commodities and few markets can lead to export instability.
Table 8.4: Major Exports Markets (Percentage Share) Country 07-08 08-09 09-10 10-11 11-12 Jul-Mar
The surge in imports during last couple of years was mainly driven through the rising commodity and oil prices. After growing at an average rate of 14 percent per annum during last two years, Pakistan’s
import growth slowed down and show negative growth of 1.02 percent during first ten months of current fiscal year. Current fiscal year has seen an easing of international commodity and oil prices which reflected in the Pakistan’s import bill during first ten months.
It is in this perspective that imports were targeted to increase by 6.8 percent ($42.9 billion) during 2012-13. However, ten months import data suggests that imports decelerated by 1.02 percent against the same period last year. Lower import prices along with declining quantum in some of the categories of imports were the main reasons for slight fall in import bill. Group-wise data on imports show that the food, transport, textile and agriculture imports recorded decline during Jul-April, FY13, which partially has been offset by the rise in machinery, oil and metal imports during first ten months of FY13. Food group was mainly responsible in reducing the country’s import bill due to the decline in milk products, spices, palm oil, pulses and sugar imports. The decline in palm oil imports is attributed to both lower quantum and price. Record stock piles in the world and a reduction in export duty by Malaysia (the largest producer and exporter of palm oil), could be the primary reason behind the lower prices in the international markets. The lower import quantum may also be linked to the increased use of soybean oil after record production of soybean in Indonesia. The import of pulses is on declining trend on account of remarkable production of gram pulse. Last year, the import was higher on account of less production domestically and the gap was filled through import of pulses. This year import of pulses is on declining side on account of better production.
Agriculture and chemical imports also recorded a fall during first ten months of FY13, because of the decline in fertilizer imports. Imports of manufactured fertilizer recorded a steep decline in quantum (58.9 percent) during Jul-April, FY13. This follows the high price of domestic fertilizer which
led to lower Urea off-take during this period. In addition, large domestic inventories were also available from last year’s imports, which precluded the need for further imports. Machinery imports posted a rise of 3.1 percent during Jul-April, FY13. Category-wise data reveals that import of construction, mining machinery and telecom machinery increased, which more than offset the decline in import of textile, agriculture, and power generating machineries.
Transport group imports fell by 1.3 percent due to the fall in import of road motor vehicles, CKD kits and motor cars during Jul-April, FY13, Lower import of CKD kits follows the fall in domestic production of cars in the country as manufacturers discontinued the Suzuki Alto and Daihatsu Cuore models. Moreover, more than 20,000 cabs were produced for the Punjab Government yellow cab scheme in FY12, which did not boost the domestic demand this year. In addition amnesty scheme for legalization of smuggled vehicles also played some role for the demand of imported vehicles.
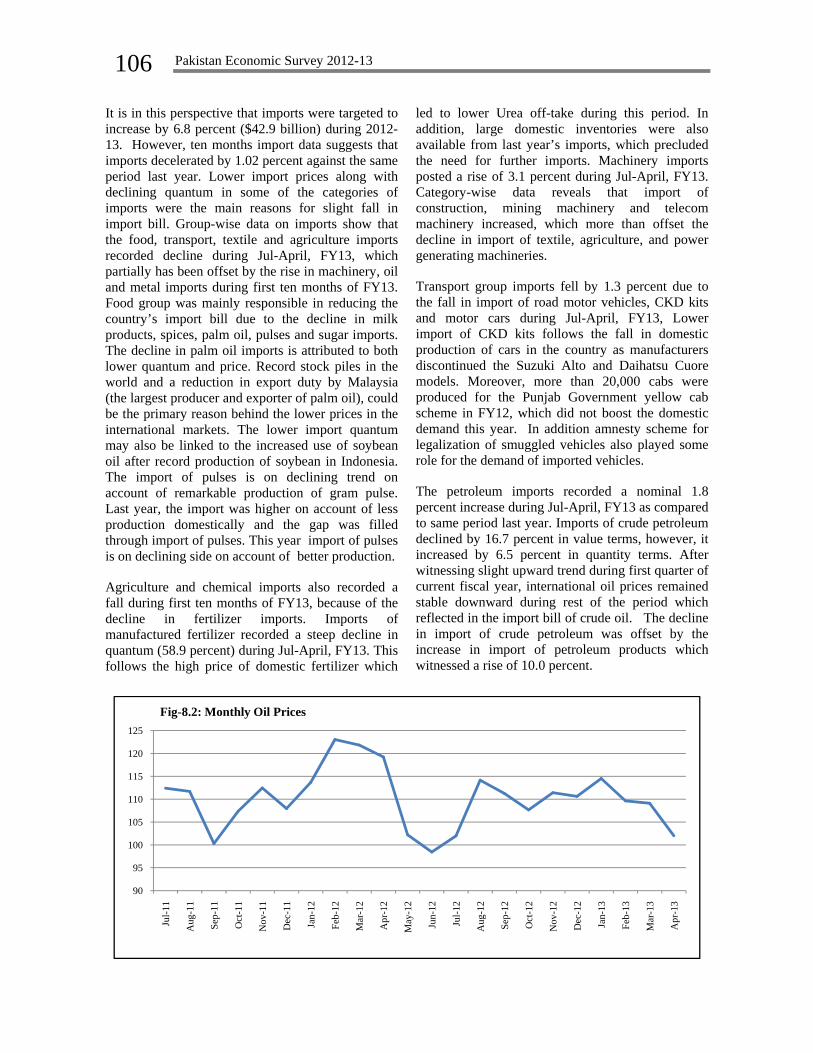
The petroleum imports recorded a nominal 1.8 percent increase during Jul-April, FY13 as compared to same period last year. Imports of crude petroleum declined by 16.7 percent in value terms, however, it increased by 6.5 percent in quantity terms. After witnessing slight upward trend during first quarter of current fiscal year, international oil prices remained stable downward during rest of the period which reflected in the import bill of crude oil. The decline in import of crude petroleum was offset by the increase in import of petroleum products which witnessed a rise of 10.0 percent.
90
95
100
105
110
115
120
125
Jul-1
1
Aug
-11
Sep-
11
Oct
-11
Nov
-11
Dec
-11
Jan-
12
Feb-
12
Mar
-12
Apr
-12
May
-12
Jun-
12
Jul-1
2
Aug
-12
Sep-
12
Oct
-12
Nov
-12
Dec
-12
Jan-
13
Feb-
13
Mar
-13
Apr
-13
Fig-8.2: Monthly Oil Prices
Trade and Payments 107
Direction of imports
Despite fairly concentrated in a few markets, Pakistan’s import sources are witnessing a change in direction since 2007-08. The combined share of
Pakistan’s major imports markets (Saudi Arabia, Kuwait, Japan, U.S.A., Germany and U.K.) has been declining from the 36.7 percent in 2007-08 to 28.6 percent, at present, thereby showing a 8.1 percentage points fall during the period under review.
Table-8.6: Major Sources of Imports (Percentage Share) Country 07-08 08-09 09-10 10-11 11-12 Jul-Mar
The government started the three year policy cycle and presented its first Strategic Trade Policy Framework 2009-12 in September 2009. The three year policy cycle was appreciated by the Industry as it allowed the medium term development projects to be implemented properly. STPF 2009-12 achieved its export targets at the end of 2010-2011. In spite of various challenges faced by economy, our trade has shown consistent improvement. Our exports increased by 27 percent in the year 2010-11 and touched a record level of US $ 25.4 billion. There was a slight fall of 4.7 percent in exports during 2011-12, due to external factors like shrinkage in global demand in wake of the global financial crisis and lower prices of cotton in the international market.
The second Strategic Trade Policy Framework (STPF) for next three-year period, 2012-15 essentially build on the STPF 2009-12 and seeks to identify those aspects of Pakistan’s export competitiveness, which have been relatively less attended. The salient features of STPF 2012-15 are as follows:
Focus on Regional Trade Create Regulatory Efficiencies Promote Agro-processed exports Increase Exports from less developed regions of
Pakistan Promote exports of Services Sector
Enhance access to export financing and credit guarantees
Revamp Export Promotion Agencies Mobilize new investment in export oriented
industries Facilitate exporting industry overcome energy
crisis Enhance Product and Market Development and
Diversification Undertake effective Trade Diplomacy Increasing Green Exports Rationalize the Tariff Protection Policy Enhance Role of Women in Exports Reform and Develop Domestic Commerce
With the help of development interventions enunciated in STPF 2012-15, the government hopes to take Pakistan’s cumulative exports from $ 65 billion to $ 95 billion. The STPF 2012-15 has three major parts. The first part consists of the interventions aimed at strengthening the existing trade related institutions and seeking to establish the ‘missing’ institutions. The second part consists of the export development initiatives to overcome the competitiveness deficit identified in the form of the fifteen principles given above. The Cabinet has approved Rs. 5 billion for these initiatives for 2012-13 and Rs 26 billion for the whole policy cycles. The third part of STPF 2012-15 consists of the regulatory amendments to Import Policy Order and Export Policy Order with a view to enhance the ease of doing business and streamlining of procedures and
108 Pakistan Economic Survey 2012-13
strengthening the regulations related to public safety and security.
The export development initiatives as incorporated in the STPF, 2012-15 are outlined below:
Mark-up support of 2% on prevailing Long Term Financing Facility(LTFF) for future import/purchase of machinery.
Mark-up Rate support of 1.5% on Export Finance Scheme (EFS) to selected export sectors
Ad-Hoc relief @ 3% of fob to offset the impact of higher cost of utilities for Pakistani exporters in selected sectors
Marketing development assistance for regional countries
Export promotion campaigns for agro-processed products
Encouraging the opening of retail outlets Subsidizing 50 percent cost of plant and
machinery for establishing processing plants for meat, fruits, vegetables, dates and olives in Baluchistan, Gilgit-Baltistan , Khyber Pakhtun Khwa and FATA
Up-gradation of Rice Inspection Labs Mark-up subsidy @ 100 percent of the prevailing
mark-up rate and 50 percent subsidy for wire saw cutting machinery to reduce wastages for establishing mining and processing in KPK, FATA, GB and Baluchistan
Strengthening Women Chamber of Commerce Establishment of Leather Export Promotion
Council Trade Links with India
On the face of massive economic challenges, a burgeoning population, energy and water shortages, and huge and growing numbers of unemployed workers, especially youth, Pakistan needs to look for ways to move itself out of the economic hole. Greater trade with India offers great possibility of economic growth for both Pakistan and India. Recent contacts meetings between the two sides appear to have yielded some good intentions to increase trade from its current level of $2.5 billion a
year to $6 billion, still well below what many scholars and researchers estimate to be the potential.
A historical review shows that at the time of independence, India and Pakistan were heavily dependent on each other. In fact, India’s share in Pakistan’s global exports and imports accounted for 23.6 percent and 50.6 percent, respectively in 1948-1949 which declined to 1.3 percent and 0.06 percent, respectively, in 1975-76. Pakistan’s share in India’s global exports and imports was 2.2 percent and 1.1 percent, respectively, in 1951-1952 which gradually went down to 0.7 percent and 0.13 percent in 2005-2006. India’s trade balance with Pakistan which was US$ 94.7 million in 2001 has increased to US$ 948.6 million in 2006 and currently stands at approximately US$ 2 billion. Pakistan account for less than 0.5 percent of India trade and India account for above 3 percent. In formal trade via third country is estimated to be more than US$ 3 billion.
Politically, India and Pakistan are perceived as arch rivals in the region. Since their independence, bilateral economic relations have been affected by political factors. With a vision to enhance peace and prosperity to flourish in the region, the two countries are now progressing toward a closer economic relation realizing the synergy of bilateral potential. Both governments have in the past two years shown courage and taken steps to follow up. Pakistan began in November 2011 by announcing that it would apply Most Favored Nation (MFN) treatment to goods coming from India by the end of 2012 (India granted Pakistan MFN in 1996.) In February 2012, both countries announced the conclusion of agreements on customs cooperation, mutual recognition of standards, and redressal of trade grievances. This was followed in March 2012 by the Pakistan Commerce Ministry’s announcement that it would replace the relatively short “positive list” of less than 2000 items that could be imported from India with a “negative list” of 1200 prohibited items, thereby, effectively freeing up trade in almost 6800 previously banned product areas. In September 2012, both governments announced a new visa agreement that included provisions designed to facilitate business travel and build an atmosphere of confidence and trust and for that the only way is economic partnership.
Box-1 Pakistan’s Market Access Initiatives
Pakistan-China FTA
The FTA was signed on November 24, 2006 and operationalised on July 1, 2007. China has given tariff preferences on 7550 tariff lines at 8 digit H.S. Code to items of Pakistan’s export interest.
Market access granted by China enabled Pakistan to maintain an overall growth trend in export performance in the first
Trade and Payments 109
five years of implementation of FTA. Pakistan-China volume of trade, which stood at US$ 4.1 billion in the year 2006-07, recorded an increase of 116% as it exceeded US$ 8.9 billion in 2011-12. Pakistan’s exports registered 279 percent increase in 2011-12 as compared to 2006-07. Similarly, China’s exports to Pakistan also increased by 90 percent during this period.
Pakistan’s exports of rice, raw cotton, all crude mineral, petroleum, chemical elements, chemical material and product, leather, cotton yarn, cotton fabric, article of apparel and medical and surgical instruments increased substantially from the year 2007-08 to 2011-12.
Pakistan-Malaysia FTA
The FTA was signed on November 8, 2007 and operationalised on January 1, 2008. Malaysia has given tariff preferences on 10593 tariff lines at 9 digit H.S. Code to items of Pakistan’s export interest.
Pakistan-Malaysia volume of trade, which was in the region of US$ 1017.80 million in the year 2006-07 reached all-time high in 2011-12, amounting to US$ 2.66 billion showing an increase of 163 percent. Pakistan’s exports registered 211% increase in 2011-12 as compared to 2006-07.Similarly, Malaysia’s exports to Pakistan also increased by157% during this period.
Pakistan’s exports of rice, raw cotton, crude vegetables materials, chemical material and product, leather, made up articles of textile material, hosiery, and sports goods have sustained increase from the year 2007-08 to 2011-12.
Pak-Sri Lanka FTA
Pakistan concluded a Free Trade Agreement with Sri Lanka on August 2002. The FTA came operational from June, 2005.Under the bilateral FTA Sri Lanka offered 102 Tariff Lines at 6 digit HS code to Pakistan at Zero percent tariff. The bilateral volume of trade between the two countries increased from US$ 200 million in 2004-05 to US$ 374 million in 2011 and 2012. Pakistan’s export has increased by almost 100 percent during the said period. From US$ 155 million in 2004-05 exports registered an increase by exceeding US$ 305 million in 2011-12.
The export items of Pakistan that maintained a healthy growth trend since implementation of bilateral FTA include rice, fish and fish preparations, cotton yarn, cotton fabrics, pharmaceuticals, knitted or crocheted fabrics and iron and steel.
Pakistan-Iran Preferential Trade Agreement
Pak-Iran PTA was signed on March 4, 2004. The Agreement became operational from September 1, 2006.
Under the PTA Pakistan has been granted tariff concessions on 309 tariff lines at 6 digit HS code. Average tariff concessions are around 18 percent. Pakistan’s major projects covered under the PTA include rice, fruits, cotton, cotton yarn, pharmaceutical products and cutlery.
Initially, the PTA gives tremendous boost to Pakistan’s export to Iran and the bilateral trade as well. In 2008-09 and 2009-10 Pakistan’s bilateral trade with Iran crossed the magic figure of US$ 1 million, while export’s touched its peak in 2008-09 at the figure of US$ 400 million. However, there has been gradual decrease in Pakistan’s exports to Iran as an aftermath of international sanctions imposed on Iran. The bilateral trade was its lowest in 2001-12 with the figure of US$ 306.6 million. The major reason for this decrease bilateral trade can be attributed to the reluctance on the part of Iranian side to fully implement PTA rates, thereby causing trust deficit on part of both sides.
SAFTA
The Agreement on South Asian Free Trade Area was signed on January 6, 2004. The first tariff reduction was enforced w.e.f. July 1, 2006.
Under SAFTA, the member states maintain their respective Sensitive Lists wherein no concessions are granted. Items not included in the Sensitive Lists are offered tariff concession from 0-5 percent by the Contracting Parties. There are 936 tariff lines at 6 digit HS code in the sensitive List of Pakistan under SAFTA. The tariff lines kept in the Sensitive List by the remaining member states are as follows;
India 614 Sri Lanka 906 Bangladesh 993 Bhutan 150 Maldives 152 Nepal 1038 Afghanistan 858
Pakistan’s export to SAARC region which was recorded at US$ 1.9 billion in 2007-08 increased to US$ 3.5 billion in 2011-12.
110 Pakistan Economic Survey 2012-13
Balance of Payments
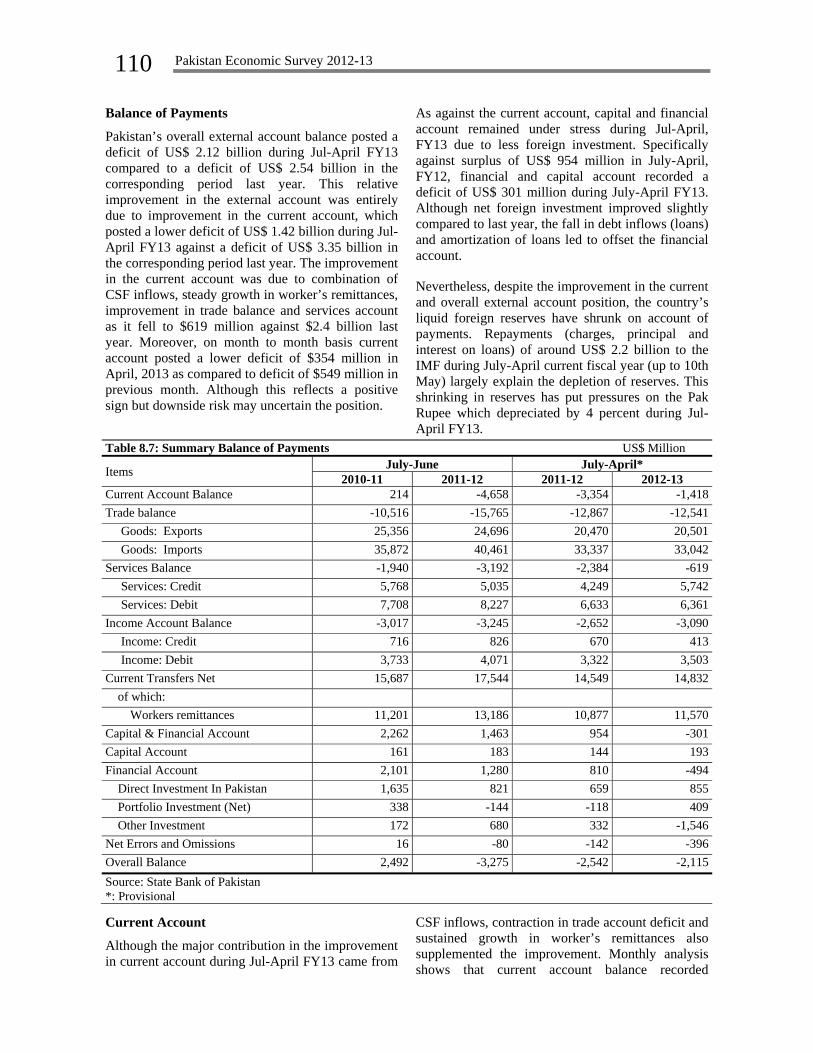
Pakistan’s overall external account balance posted a deficit of US$ 2.12 billion during Jul-April FY13 compared to a deficit of US$ 2.54 billion in the corresponding period last year. This relative improvement in the external account was entirely due to improvement in the current account, which posted a lower deficit of US$ 1.42 billion during Jul-April FY13 against a deficit of US$ 3.35 billion in the corresponding period last year. The improvement in the current account was due to combination of CSF inflows, steady growth in worker’s remittances, improvement in trade balance and services account as it fell to $619 million against $2.4 billion last year. Moreover, on month to month basis current account posted a lower deficit of $354 million in April, 2013 as compared to deficit of $549 million in previous month. Although this reflects a positive sign but downside risk may uncertain the position.
As against the current account, capital and financial account remained under stress during Jul-April, FY13 due to less foreign investment. Specifically against surplus of US$ 954 million in July-April, FY12, financial and capital account recorded a deficit of US$ 301 million during July-April FY13. Although net foreign investment improved slightly compared to last year, the fall in debt inflows (loans) and amortization of loans led to offset the financial account.
Nevertheless, despite the improvement in the current and overall external account position, the country’s liquid foreign reserves have shrunk on account of payments. Repayments (charges, principal and interest on loans) of around US$ 2.2 billion to the IMF during July-April current fiscal year (up to 10th May) largely explain the depletion of reserves. This shrinking in reserves has put pressures on the Pak Rupee which depreciated by 4 percent during Jul-April FY13.
Table 8.7: Summary Balance of Payments US$ Million
Although the major contribution in the improvement in current account during Jul-April FY13 came from
CSF inflows, contraction in trade account deficit and sustained growth in worker’s remittances also supplemented the improvement. Monthly analysis shows that current account balance recorded
Trade and Payments 111
surpluses in August and December 2012 while remaining in deficit during the other months of FY13. (Figure 8.3 ). CSF inflows of US$ 1.12
billion in August and US$ 0.68 billion in December 2012 largely explain the surplus during these two respective months.
Trade account balance, the largest and most important component of the current account, recorded a marginal improvement during Jul-April FY13. Trade account deficit contracted by 2.5 percent in Jul-April FY13 as imports declined 0.9 percent during Jul-April, FY13 compared to same period last year whereas export remained almost the same (only 0.15 percent growth) compared to last year during the period under review. The decline in import bill was primarily caused by the fall in imports of fertilizer, food and transport group and oil prices whereas the contraction in export growth was on account of decline in textile exports.
Credit of US$ 1.8 billion on account of CSF helped services account showed nominal deficit of US$ 0.6 billion during July-April FY13 against a deficit of US$ 2.4 billion during the corresponding period last year.
Income account registered a deficit of US$ 3.1 billion in Jul-April FY13 against the deficit of US$ 2.7 during Jul-April FY12. Both lower receipts and higher payments contributed to this increase in deficit in income account. While the payments in income account remained US$ 181 million higher during Jul-April FY13 than the same period level last year, receipts fell by US$ 257 million.
Capital & Financial Account
Capital and financial accounts posted a deficit of US$ 301 million during Jul-April FY13 against a surplus of US$ 954 million in the corresponding period last year. While net foreign investment increased from US$ 658.2 million during July-April, FY12 to US$853.5 million during Jul-April FY13, net outflows of loans resulted in the overall deterioration of the capital and financial accounts. As against inflows of US$ 337 million, foreign long terms loans/credit recorded net outflows of US$ 268 million during the period under consideration.
Worker’s Remittances
Following the impressive performance of last year, worker’s remittances continued to provide strength to the current account. During July-April FY13, worker’s remittances grew by 6.4. Monthly analysis show that after a drop in August, 2012, worker’s remittances rebounded in the following months (Figure:8.4). However, during quarter three FY13 remittances again declined compared to the same period last year. The cumulative increase of US$ 0.69 billion during Jul-April FY13 over Jul-April FY12 is largely attributed to the government’s efforts to divert remittances from informal to the formal channels. Since the launch of Pakistan
-433
1008
-231-315
-544
702
-315-387
-513
-390
-700-600-500-400-300-200-100
0100200300400500600700800900
10001100
jul,
2012
Aug
, 201
2
Sep,
201
2
Oct
, 201
2
Nov
, 201
2
Dec
, 201
2
Jan,
201
3
Feb,
201
3
Mar
, 201
3
Apr
, 201
3
US
$ M
illio
nFig-8.3: Monthly Current Account Balance
112 Pakistan Economic Survey 2012-13
Remittances Initiative (PRI), the share of worker’s remittances coming through banking channel has
increased considerably from 75 percent in FY10 to 90 percent in FY13.
County-wise data shows that remittances from UK, Saudi Arabia and GCC countries sources increased that compensated the decline in remittances from USA, UAE and EU. The share of Saudi Arabia in overall remittances was the largest; with UAE and
USA having the second and third largest shares. Other sources of remittances like UK and GCC countries also contributed to the increase in remittances during the period under review.
2011-12 2012-13* % Change % Share USA 1,922.4 1,819.9 -5.3 15.7U.K. 1,263.7 1,611.11 19.6 13.9Saudi Arabia 2,987.9 3,371.6 12.8 29.1UAE 2,386.3 2,312.0 -3.1 20.0Other GCC Countries 1,226.6 1,331.7 15.3 11.5EU Countries 304.6 297.7 8.6 2.6Other Countries 785.5 825.7 5.1 7.2Total 10,877.0 11,569.7 6.4 100.0Source: State Bank of Pakistan *: Provisional
Foreign Direct Investment
During Jul-April FY13, foreign direct investment (FDI) increased by 29.7 percent in contrast to a decline of 36.7 percent during the same period last year. During Jul-April, FY13 inflows of FDI remained at $1,893.6 million against $1,723.3 million showing an increase of 9.9 percent.
Sector wise data shows that major rise came in the financial business. In comparison to net inflows of US$ 46.1 million in July-April FY12, this sector attracted net inflows of US$ 248.7 million during Jul-April FY13. On the other hand, telecommunication sector continued to record net outflows during this period. Major source of inflows
include UAE($281.5 million), USA($271.6 million), Hong Kong($204.5 million), UK($183.4 million), Italy($172.8 million) and Switzerland ($133.8 million)
Portfolio investment witnessed a sharp rise during Jul-April, FY13 as it increased to $219.4 million against a net outflow of $63.5 million during same period last year. The inflow of portfolio investment played a major role in deriving the Pakistan stock market which witnessed a bullish trend during FY13.
0
200
400
600
800
1000
1200
1400
1600
Jul Aug Sep Oct Nov Dec Jan Feb Mar Apr
$ M
illio
nFig-8.4: Monthly Worker's Remittances FY12 FY13
F
PUrTdp
E
Pirdt
Qfj
Foreign Exch
Pakistan’s foUS$ 3.1 bilreached US$This fall in due to the reperiod.
Exchange Ra
Pak Rupee cin SBP reseresult, Pakisdepreciated bthe same per5.2 percent.
Quarterly anafairly stable just 0.25 perc
1
Rs./
US$
hange Reser
oreign exchallion from e
$ 12.3 billionthe gross res
epayments ma
ate
came under prves during stan’s currenby 4.0 percentiod last year
alysis indicateduring Q1-F
cent against th
80
85
90
95
100
Jul-1
0
Sep-
10
Fig-8.6: Ex
ves
ange reservesend-June 20n as on 3Ist serve positionade to the IM
pressure with current fisca
ncy vis-à-vit during this prupee had de
es that the RuFY13 as it dhe US Dollar
Nov
-10
Jan-
11
Mar
-11
xchange Rate
s depleted by12 level andMarch 2013
n was mainlyMF during thi
the depletional year. As s US dollaperiod. Duringepreciation by
upee remaineddepreciated byr, compared to
May
-11
Jul-1
1
y d
3. y is
Of the odecreasedschedule(Figure:8FY13 wa2.2 billioMay, 20$6.468 bcommerc
n a
ar g y
d y o
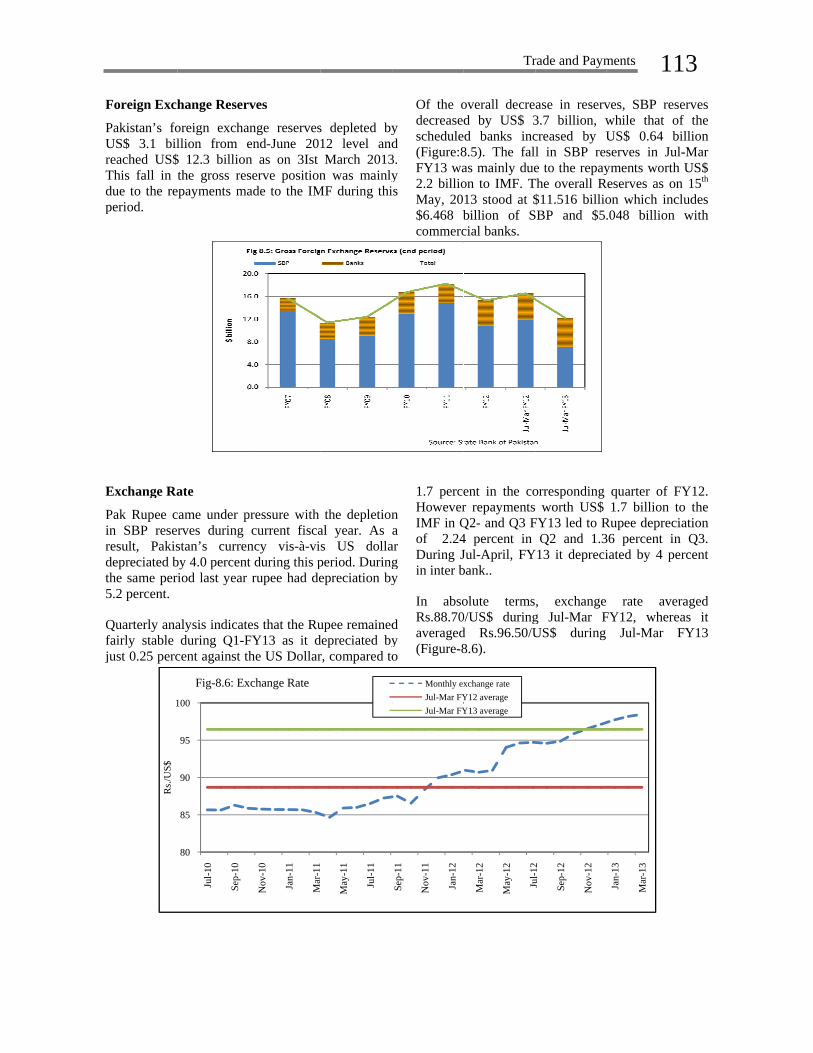
1.7 perceHoweverIMF in Qof 2.24During Jin inter b
In absoRs.88.70averaged(Figure-8
Sep-
11
Nov
-11
Jan-
12
Monthly exJul-Mar FYJul-Mar FY
Tr
overall decred by US$ 3d banks inc
8.5). The falas mainly dueon to IMF. T13 stood at $billion of Scial banks.
ent in the cor repaymentsQ2- and Q3 F4 percent in Jul-April, FYbank..
olute terms0/US$ duringd Rs.96.50/U8.6).
Mar
-12
May
-12
Jul-1
2
xchange rateY12 averageY13 average
rade and Paym
ase in reserv3.7 billion, wcreased by Ul in SBP rese to the repay
The overall R$11.516 billio
SBP and $5.
orresponding worth US$
FY13 led to RQ2 and 1.3
Y13 it depreci
, exchange g Jul-Mar FUS$ during
Jul1
2
Sep-
12
Nov
-12
ments 11ves, SBP reswhile that oUS$ 0.64 bserves in Julyments worth
Reserves as onon which inc.048 billion
quarter of F1.7 billion t
Rupee depreci36 percent iniated by 4 pe
rate averFY12, where
Jul-Mar F
Jan-
13
Mar
-13
13 serves of the billion l-Mar
h US$ n 15th cludes
with
FY12. to the iation n Q3. ercent
raged eas it FY13
114 Pakistan Economic Survey 2012-13
Real Effective Exchange Rate
Exchange rate of Pak rupee vis-a-vis basket of trading partner currencies usually referred to as Nominal Effective Exchange Rate (NEER) depreciated by 5.2 percent during Jul-Feb FY13 compared to an appreciation of 1.04 percent during the same period last year. On the other hand, the relative price index recorded a rise of 1.06 percent
compared with a rise of 5.0 percent during Jul-Feb FY12. The deceleration in the relative price index was attributed to a slowdown in domestic inflation during this period. The depreciation of NEER and narrowing relative prices led to depreciation in real terms. Real effective exchange rate therefore depreciated by 4.2 percent during Jul-Feb FY13 in contrast to an appreciation of 1.9 percent during the same period last year (Figure 8.7).
Conclusion:
The external sector performance is improving on the back of rising foreign investment witnessed during March and April, better improvement in remittances and narrowing of the negative gap in balance of
payment. However, the fast shrinking of reserves and scheduled repayments to the IMF in the rest of FY13 and FY14 remains challenging. These challenges are required to be addressed through decisive structural reforms.


![D:Budget 2020-21BUDGET SPEECH Part -1 (Final)finance.gov.pk/budget/budget_speech_urdu_2020_21.pdf · Ýqà sZ@Z{ Š™gàÐs§ÅŸg0*i¸M»Y2019-20 w‚àâ äë-5 ÃuÐTñVZ]âZŠ](https://static.documents.pub/doc/80x56/600b8aaf516c482a641734d9/dbudget-2020-21budget-speech-part-1-final-qf-szz-agsg0imy2019-20.jpg)
![MONTHLY PAYME[] ACCELERATION FUEL GREEN ...ta-cdn.mybluemix.net/2.0/themes/TradeoffAnalyticsThem...IBM Watson Tradeoff Analytics Overview + Add for Comparison Add your favorite candidates](https://static.documents.pub/doc/80x56/6036b2ec3520270d0a5c3b21/monthly-payme-acceleration-fuel-green-ta-cdn-ibm-watson-tradeoff-analytics.jpg)


