45
University of Cyprus Biomedical Imaging and Applied Optics Biomedical Imaging and Applied Optics Raman Spectroscopy Raman Spectroscopy

University of CyprusBiomedical Imaging and Applied OpticsBiomedical Imaging and Applied Optics
Raman SpectroscopyRaman Spectroscopy
Introduction
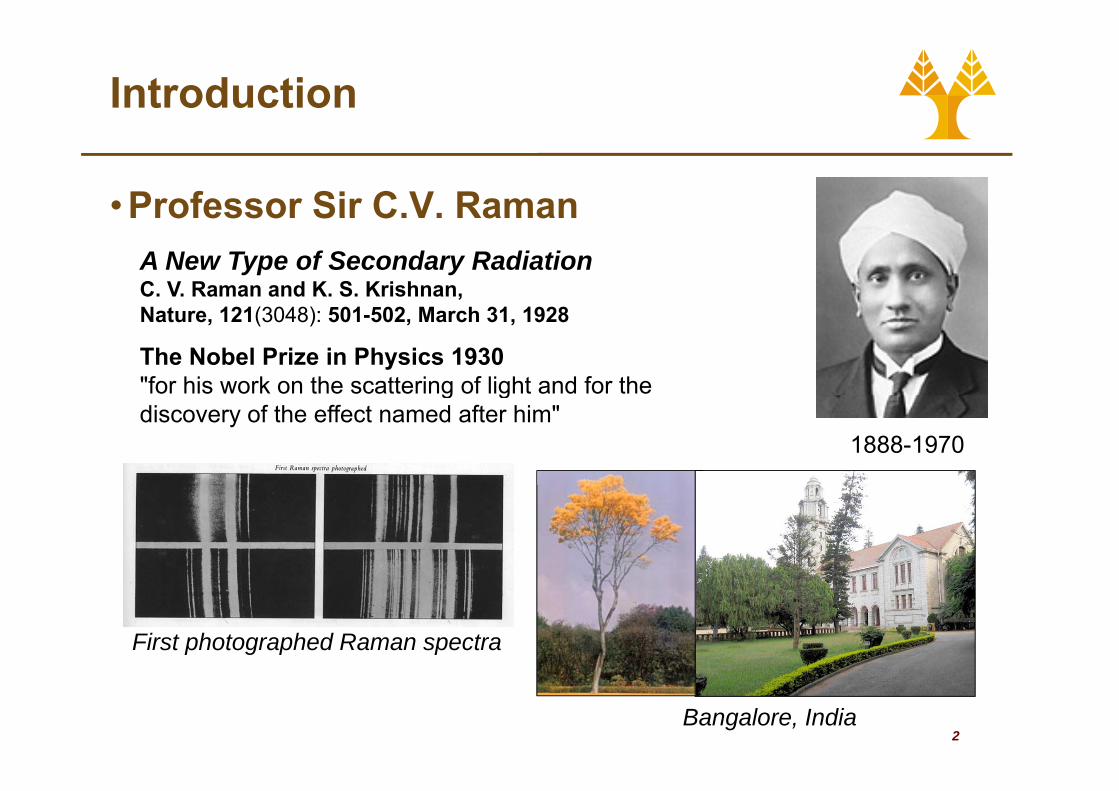
• Professor Sir C.V. RamanProfessor Sir C.V. RamanA New Type of Secondary RadiationC. V. Raman and K. S. Krishnan,
The Nobel Prize in Physics 1930"for his work on the scattering of light and for the
Nature, 121(3048): 501-502, March 31, 1928
1888-1970
g gdiscovery of the effect named after him"
First photographed Raman spectra
2Bangalore, India
Introduction
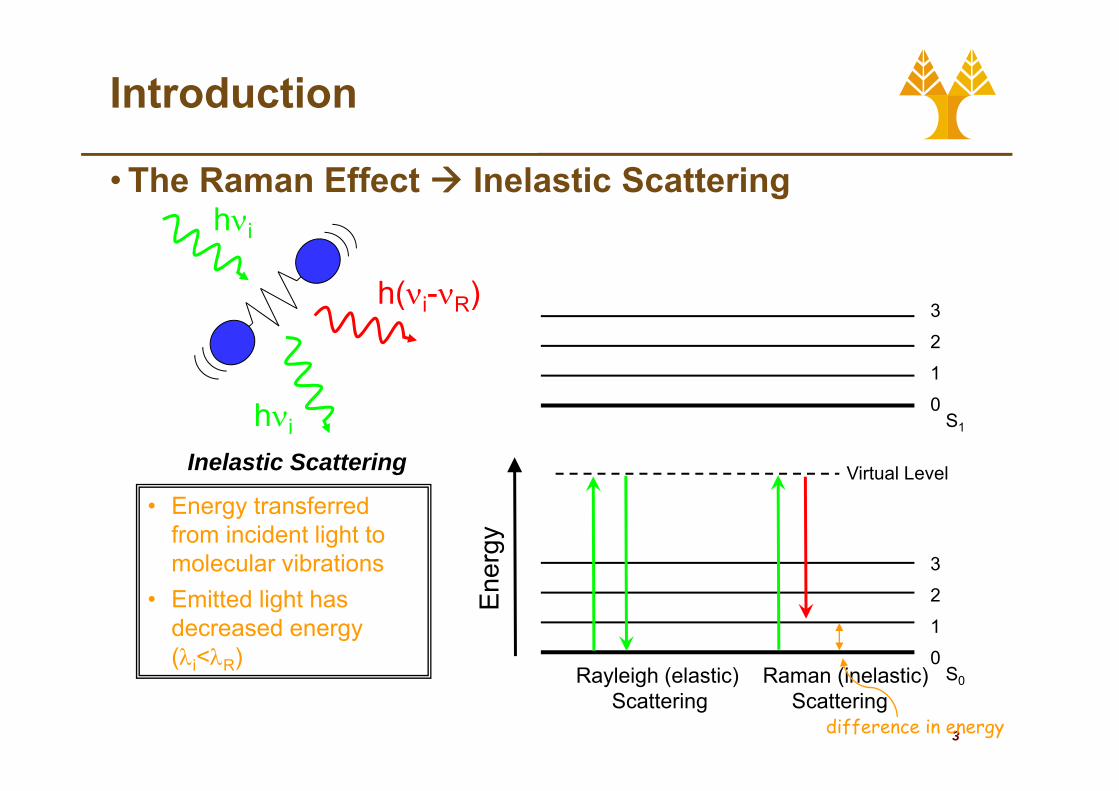
• The Raman Effect Inelastic Scatteringhνhνi
h(νi-νR)3
( i R)3
2
1
hνi0
S1
Virtual LevelInelastic Scattering
3ergy
• Energy transferred from incident light to molecular vibrations
2
1
0
Ene• Emitted light has
decreased energy (λi<λR)
3
S0Rayleigh (elastic) Raman (inelastic) Scattering Scattering
( i R)
difference in energy
Introduction
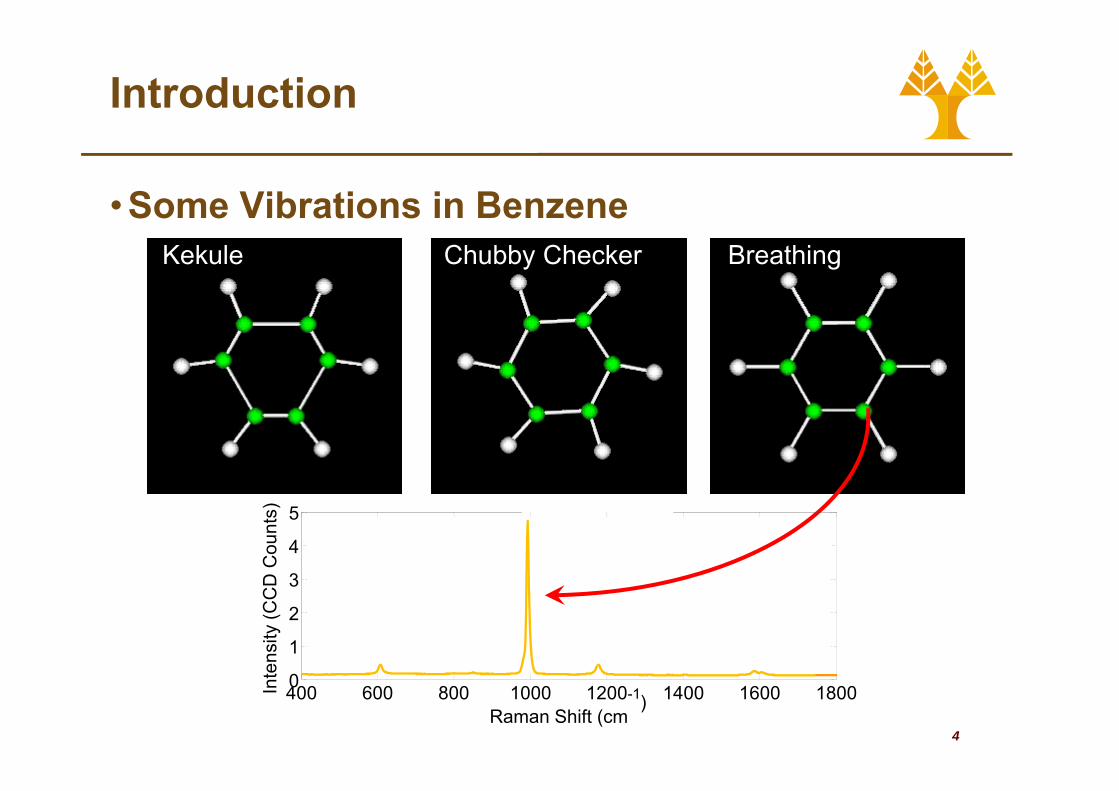
• Some Vibrations in BenzeneSome Vibrations in BenzeneBreathingChubby CheckerKekule
3
4
5
D C
ount
s)
1
2
3
ensi
ty (C
CD
4
400 600 800 1000 1200 1400 1600 18000
Raman Shift (cm-1)
Inte
Introduction
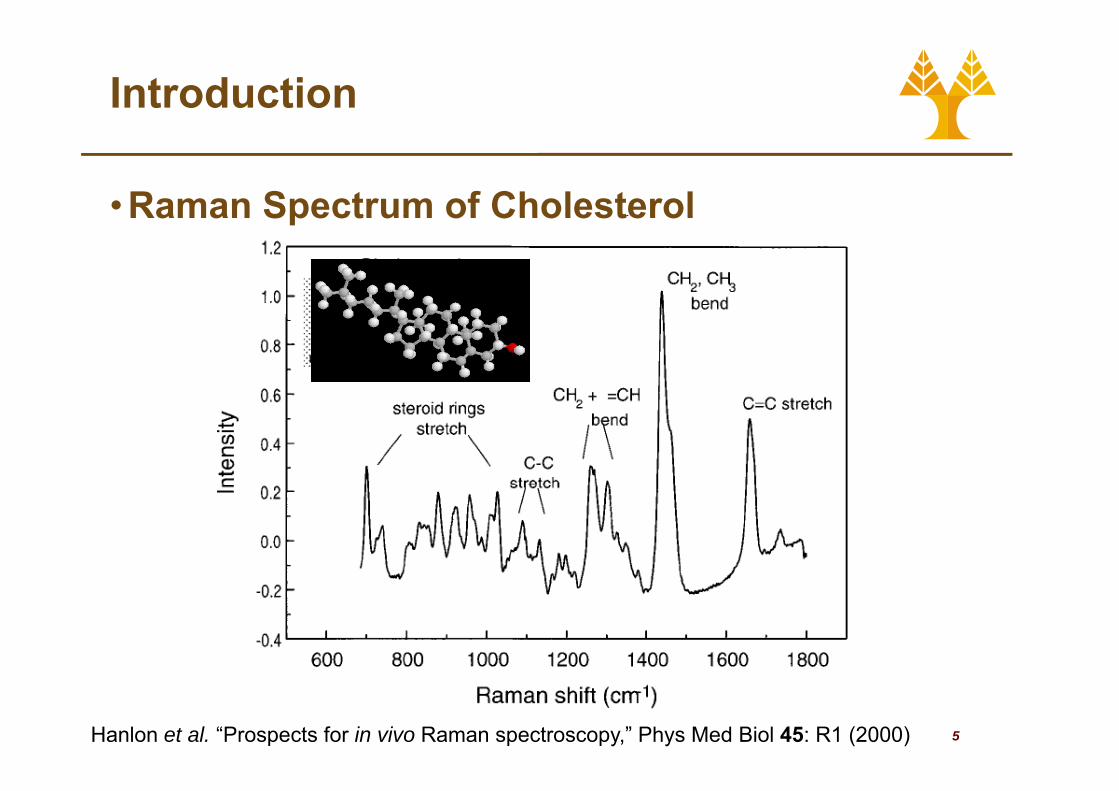
• Raman Spectrum of CholesterolRaman Spectrum of Cholesterol
5Hanlon et al. “Prospects for in vivo Raman spectroscopy,” Phys Med Biol 45: R1 (2000)

Introduction
• Raman Spectra pFingerprinting a Molecule
• Raman spectra are molecule specificS t t i• Spectra contain information about vibrational modes of the molecule
• Spectra have sharp f t ll ifeatures, allowing identification of the molecule by its spectrum
6
y pExamples of analytes found in blood
which are quantifiable with Raman spectroscopy

Introduction
Evolution of Raman Spectroscopy• 1928~1960
• Minor experimental advances
1960
• Late 1980s→1990s• Biomedical investigations• Advanced dispersive• 1960
• Invention of laser expands scope experiments
Advanced dispersive spectrometers
• 2000 →p p
• 1980s: rapid technological advances
• In vivo application• Optical fiber probes
Non linear spectroscopy• Fourier Transform
spectroscopy• Charge Coupled Device
• Non-linear spectroscopy
Charge Coupled Device (CCD) detectors
• Holographic and dielectric filters
7
filters• Near-Infrared (NIR) lasers

Introduction
• Applications of Raman SpectroscopyApplications of Raman Spectroscopy• Structural chemistry
Solid state• Solid state• Analytical chemistry• Applied materials analysis• Process controlProcess control• Microspectroscopy/imaging
Environmental monitoring• Environmental monitoring• Biomedical
8

Introduction
History of Biological Raman Spectroscopy• 1970: Lord and Yu record 1st protein spectrum from
lysozyme using HeNe excitation• Evolution to NIR excitation
• Decreased fluorescence, Increased penetration (mm)• 1980s:
• FT Raman with Nd:YAG and cooled InGaAs detectors (long collection times (30 min))(long collection times (30 min))
• Clarke (1987-1988): visible excitation of arterial calcium hydroxyapatite and carotenoids
• 1990s, advances in:• Lasers, Detectors, Dispersive spectrometers, Filters
Ch i9
• Chemometrics
Introduction
• Diagnostic Advantages of Raman SpectroscopyDiagnostic Advantages of Raman Spectroscopy• Wavelength selection (from UV to IR)
No biops req ired• No biopsy required• Directly measures molecules
• Small concentrations• Chemical composition• Morphological analysis
• Quantitative analysisy• In vivo diagnosis
10

Classical Raman Physics
• Interaction between electric field of incidentInteraction between electric field of incident photon and molecule• Electric field oscillating with incident frequency f :• Electric field oscillating with incident frequency fi:
0 cos(2 )i iE E f tπ=• Induces molecular electric dipole (p):
p Eα=• Proportional to molecular polarizability, α
• ease with which the electron cloud around a molecule can be distorted
• Polarization results in nuclear displacement( )
11
( )0 cos 2 Rq q tπν=

Classical Raman Physics
• For small distortions, polarizability is linearlyFor small distortions, polarizability is linearly proportional to the displacement
α⎛ ⎞∂0 0
0
...qqαα α
⎛ ⎞∂= + +⎜ ⎟∂⎝ ⎠
• Resultant dipole:( )cos 2p E E tα α πν= = +
Rayleigh Scattering
( )0 0 cos 2 ip E E tα α πν= = +
( ) ( ){ }0 01 cos 2 cos 22 i R i RE q t t
qα π ν ν π ν ν
⎛ ⎞∂ ⎡ ⎤ ⎡ ⎤+ + −⎜ ⎟ ⎣ ⎦ ⎣ ⎦∂⎝ ⎠
k RStokes Raman
{ }02 q∂⎝ ⎠
12
Anti-Stokes Raman
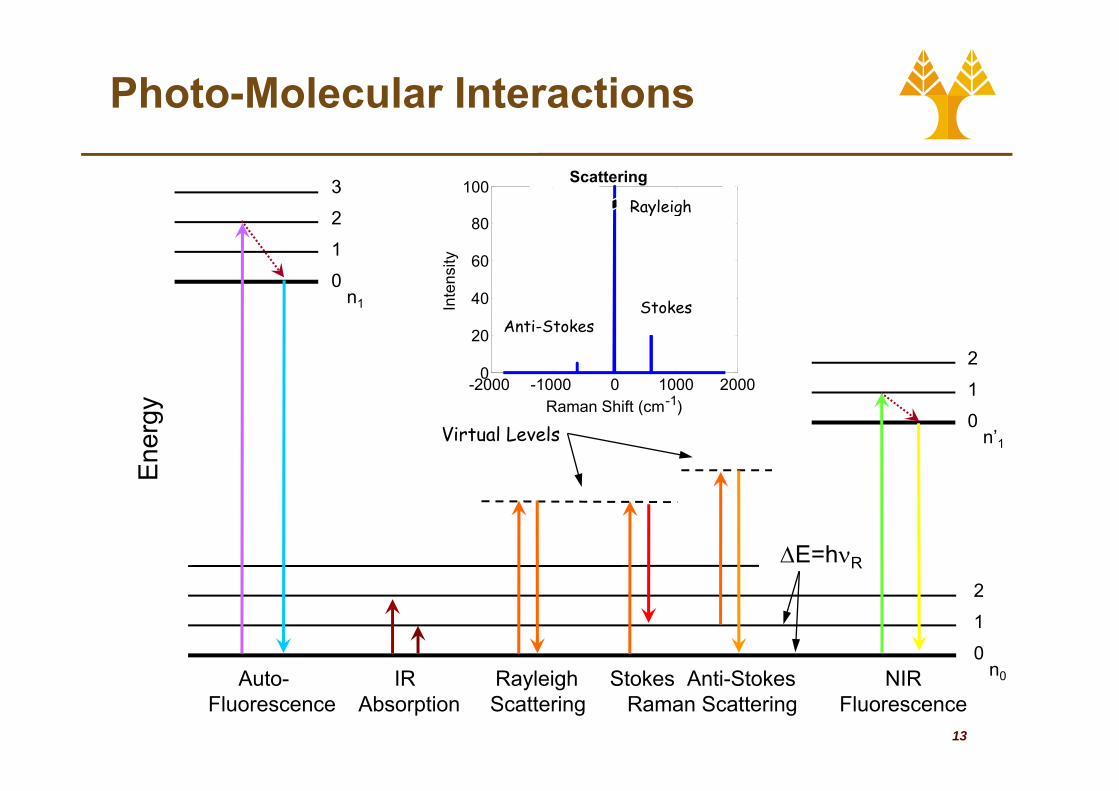
Photo-Molecular Interactions
1003
2 Rayleigh
Scattering
40
60
80
nten
sity
2
1
0n1 Stokes
-2000 -1000 0 1000 20000
20
1
I1
2
1
Anti-StokesStokes
Raman Shift (cm-1)
Ene
rgy
Virtual Levels
1
0n’1
ΔE=hνR
2
1
0
13
Auto- IR Rayleigh Stokes Anti-Stokes NIRFluorescence Absorption Scattering Raman Scattering Fluorescence
n0

Classical Raman Physics
• Raman scattering occurs only when the molecule is ‘polarizable’
• Raman intensity ∝ f4
0dqα∂≠
• Raman intensity ∝ f• Classical dipole radiation• Stokes shifted Raman is more intense than anti-Stokes by Boltzmann factor:
4 hf⎛ ⎞4
Rhfi RA kT
S i R
f fI eI f f
−⎛ ⎞+= ⎜ ⎟−⎝ ⎠
• Consistent with other scattering phenomena, often reported in terms of cross-section (σ [cm2]), or probability of scattering:
I I lσρ=
• ρ: density of molecules• l: pathlength
0I I lσρ=
14
p g

Characteristics of Raman Scattering
• Very weak effect7• Only 1 in 107 photons is Raman scattered
• NIR elastic scattering in tissue:• NIR absorption in tissue:
'1/ 1s mmμ ≈
1/ 10a cmμ ≈NIR absorption in tissue:• Red absorption in tissue or water:• Raman scattering in tissue or water:
1/ 10a cmμ1/ 5a mμ ≈
1/ 3R kmμ ≈• True scattering process
• Virtual state is a short-lived distortion of the electron cloud which creates molecular vibrationswhich creates molecular vibrations
• τ < 10-14 s• Strong Raman scatterers have distributed electron clouds
• C=C• π-bonds
15
Units & Dimensional Analysis
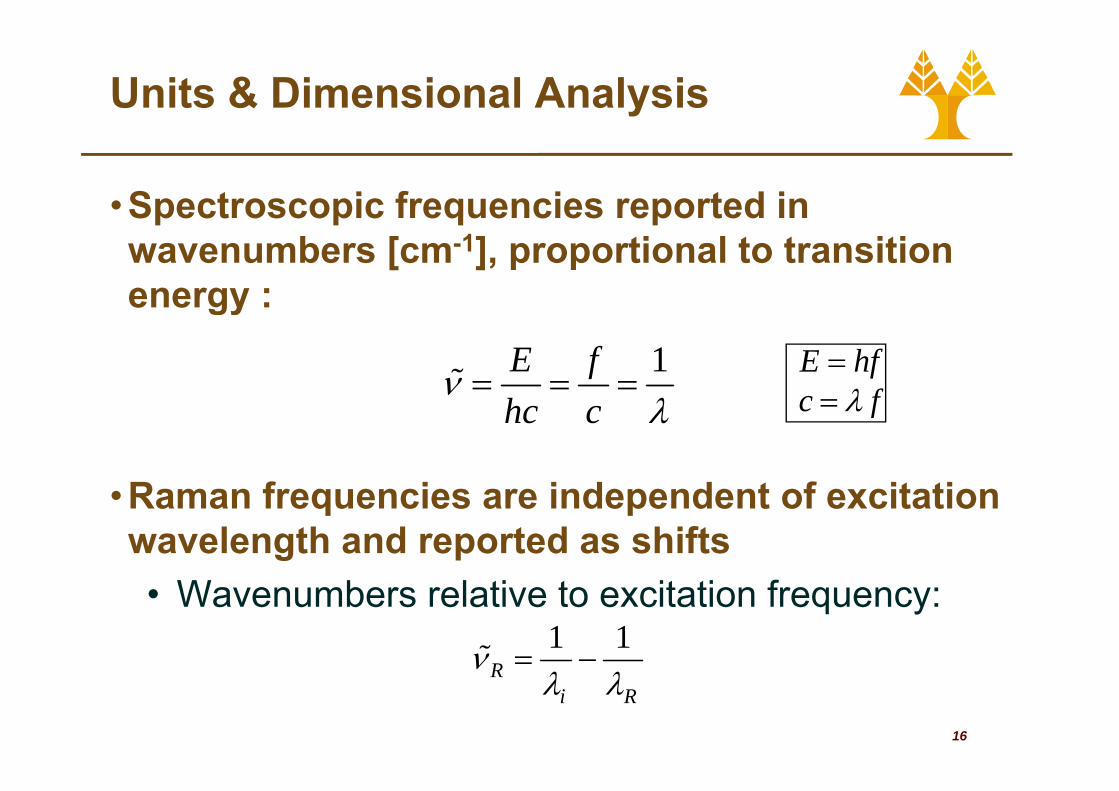
• Spectroscopic frequencies reported inSpectroscopic frequencies reported in wavenumbers [cm-1], proportional to transition energy :energy :
1E fν = = = fλE hf=
R f i i d d t f it ti
hc c λ c fλ=
• Raman frequencies are independent of excitation wavelength and reported as shifts• Wavenumbers relative to excitation frequency:
1 1Rν = −
16
Ri R
νλ λ

Units & Dimensional Analysis
• ExampleExample• NIR excitation at 830 nm: 12,048 cm-1
T pical Raman shift 1000 cm 1Rν• Typical Raman shift: ~1000 cm-1
• λR = 905 nm
Rν
• Sharp biological Raman linewidths ~10 cm-1
FWHM• ΔλR= 0.69 nm
1717

UV, Visible, and NIR Excitation
• Wavelength Selectionf• Raman signals have a constant shift
can vary excitation wavelength and get same information
• UV• + Resonance enhanced• + λR<λF filter fluorescence• - photo damage, low penetration
• Visible• + Raman ∝λ-4 ↑I vs IR• + Raman ∝λ 4 ↑IR vs. IR• - fluorescence overlaps with
Raman signal
NIR• NIR: • + Low fluorescence • + Deep penetration
18
• - Raman ∝λ-4 ↓IR vs. Vis
UV, Visible, and NIR Excitation
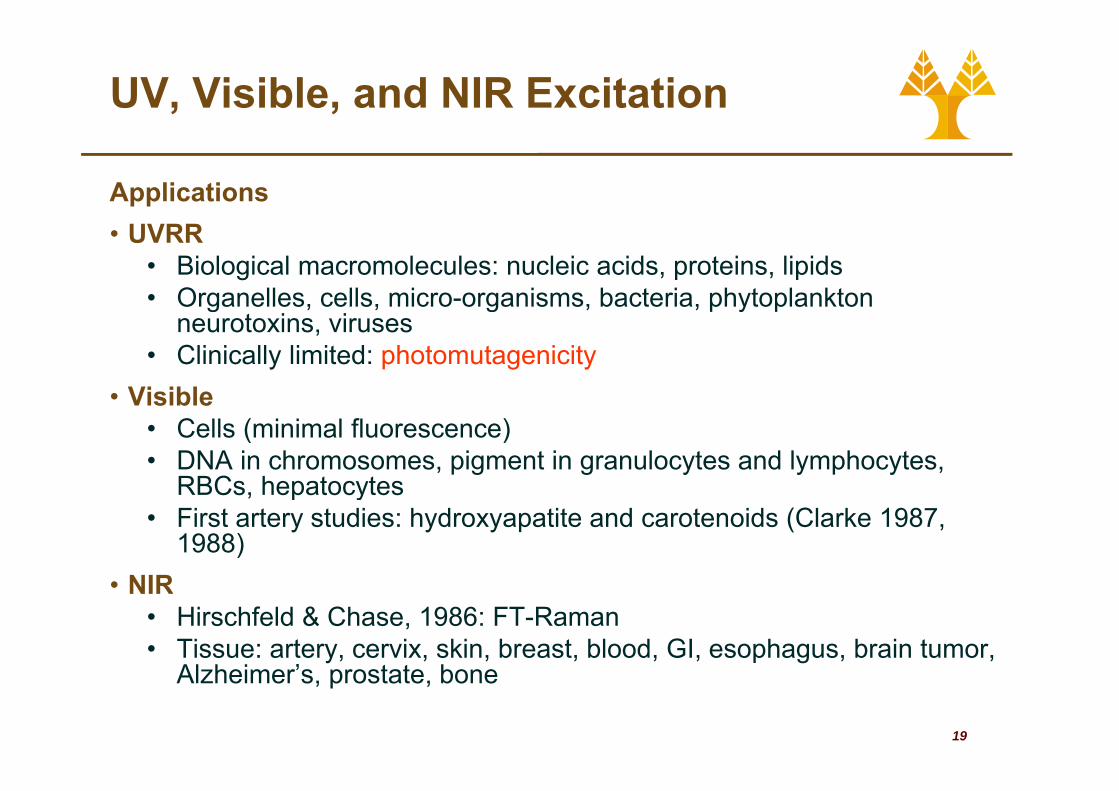
Applications• UVRR
• Biological macromolecules: nucleic acids, proteins, lipids• Organelles, cells, micro-organisms, bacteria, phytoplanktonOrganelles, cells, micro organisms, bacteria, phytoplankton
neurotoxins, viruses• Clinically limited: photomutagenicity
• Visible• Visible• Cells (minimal fluorescence)• DNA in chromosomes, pigment in granulocytes and lymphocytes,
RBCs hepatocytesRBCs, hepatocytes• First artery studies: hydroxyapatite and carotenoids (Clarke 1987,
1988)NIR• NIR
• Hirschfeld & Chase, 1986: FT-Raman• Tissue: artery, cervix, skin, breast, blood, GI, esophagus, brain tumor,
Al h i ’ t t b
19
Alzheimer’s, prostate, bone
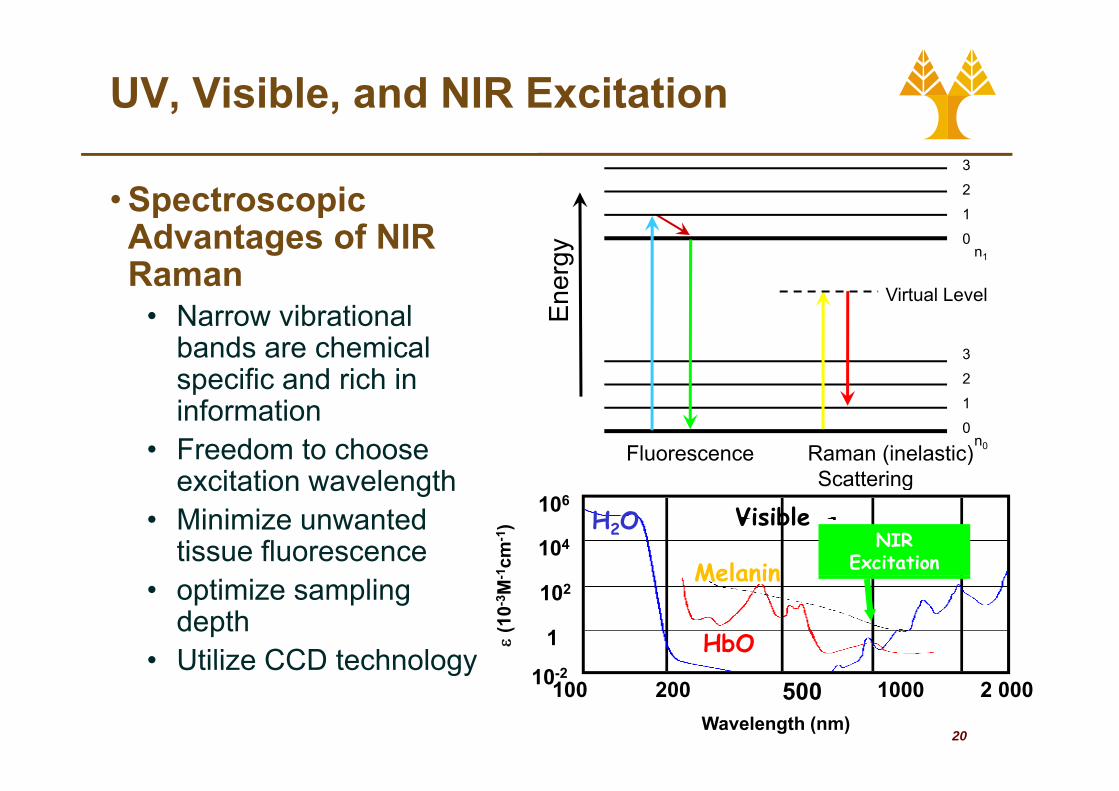
UV, Visible, and NIR Excitation
• Spectroscopic 3
2
1p pAdvantages of NIR Raman
N ib ti lVisible
1
0n1
nerg
y
Virtual Level• Narrow vibrational
bands are chemical specific and rich in
Melanin 3
2
E
information• Freedom to choose
excitation wavelength
1
0n0Fluorescence Raman (inelastic)
Scatteringexcitation wavelength• Minimize unwanted
tissue fluorescence
Scattering
104
1061 c
m-1
) H2O VisibleNIR
ExcitationMelanin• optimize sampling depth
• Utilize CCD technology
102
1ε(1
0-3 M
-
HbO
Melanin
20
Utilize CCD technology100 200 500 1000 2 00010-2
Wavelength (nm)

Current Raman Instrumentation
• Laser diodesC t St bl li NIR• Compact, Stable narrow line, NIR
• High throughput spectrographs (f/1.8)• Holographic elements• Holographic elements
• Bandpass filters (eliminates spontaneous emission of lasing medium)• Notch filters (106 rejection of Rayleigh scattered laser line)
L hi hl ffi i t t i i ti• Large area, highly efficient transmission gratings• CCD detectors
• High QE (back-thinned, deep-depletion)g Q (bac t ed, deep dep et o )• Low noise (LN2 cooled)• Multichannel detection
Hi h th h t filt d fib ti b• High throughput, filtered fiber optics probes• NIR FT and scanning PMT systems no longer useful
21

Clinical Raman Systems
830 nmbandpassfilter
shutter
Diode Laser filterDiode Laser
holographic grating
notch filter
22
CCD

Fiber Raman Probe Design
Problems Fiber background NA2Problems
• Fiber backgroundFiber background μ NA2
• Distorts signal• Adds shot-noise
• Low signal collection• Raman effect is weakRaman effect is weak• Tissue is highly
diffusivediffusive
23

Fiber Raman Probe Design• Reduce Fiber Background
• Fiber background produced equally in excitation and collection fibersg p q y• Excitation laser Raman scattered light from tissue• Fiber Raman scattering, transmitted by excitation fiber*• Fiber Raman background elastically scattered from sample (and
collected)• Excitation elastically scattered and gathered by collection fibersy g y• Fiber Raman scattering by collection fibers*
x c* ∝ NA2
Excitation laser
Tissue Ramanx c
From McCreery RL
Tissue Raman
Fiber background
24
Tissue Sample
From McCreery RL “Raman Spectroscopy for Chemical Analysis,” 2000. Tissue Sample

Fiber Raman Probe Design
• Filter Transmission100
R i f I t t80
(%)
Region of Interest
60
mis
sion
(
Collection FilterExcitation Filter
40
Tran
sm
20
25
0 500 1000 15000
Raman Shift (cm-1)

Fiber Raman Probe Design
• Problems • SolutionsProblems
• Fiber background • Micro-optical filters• Short pass excitation• Distorts signal
• Adds shot-noise
• Short-pass excitation filter
• Long-pass collection filter• Low signal collection
• Raman effect is weak
Long pass collection filter
• Optimize optical designRaman effect is weak
• Tissue is highly diffusivedesign
• Characterize distribution of Raman light in tissueof Raman light in tissue
• Define optimal geometry• Design collection optics
26
g p
Fiber Raman Probe Design
Design Goals• Restricted geometry for clinical use
• Total diameter ~2mm for access to coronary arteriesy• Flexible• Able to withstand sterilization
• Designed to work with 830 nm excitation• High throughput• High throughput
• Data accumulation in 1 or 2 seconds• Safe power levelsSafe power levels• SNR similar to open-air optics laboratory system• Accurate application of models
27
pp

Fiber Raman Probe Designcollection fibers
aluminum jacketaluminum jacket
excitation fiber
long-passfilter tube
1 m
m
metal sleevesleeve
0.55short-passfilt d
retainingsleeve 1 75 mm
0.70filter rod
282 mm
sleeve
ball lens
1.75 mmSingle Ring Probe has 15 Fibers
Motz et al. Appl Opt 43: 52 (2004)

Cardiovascular Disease
The Burden of Cardiovascular Disease†The Burden of Cardiovascular Disease†
• 71,300,000 people in United States afflicted
• 910,600 deaths per year• 1 out of every 2 7 deaths• 1 out of every 2.7 deaths
• Coronary artery disease claims 653,000 lives annually
• 1 out of every 5 deaths• Economic cost: greater than $142.5 billion
29†American Heart Association, Heart and Stroke Statistics-2006 Update

Cardiovascular Disease
• Arterial Anatomy
Media
Normal Mildly Atherosclerotic Plaque Ruptured Plaque
Media
Fibrous Cap
LumenT
Atheroma
Cap
IntimaAtheroma
NC
AdventitiaT th b
30
T: thrombusNC: necrotic core

Cardiovascular Disease
• Some Current Challenges in CardiologySome Current Challenges in Cardiology• Evaluation and development of therapeutics
Etiolog of atherosclerosis• Etiology of atherosclerosis• Mechanisms of re-stenosis
• Post-angioplasty• Transplant vasculopathy
• Detection of vulnerable atherosclerotic plaques• Prediction/prevention of cardiac eventsp
31

Cardiovascular Disease
Vulnerable Plaques• Account for majority of sudden cardiac death• Frequently occur in clinically silent vessels q y y
• <50% stenosis• Effective treatments unknown • Characterized by:
• Biochemical changesg• Foam cells• Lipid pool
I fl t ll• Inflammatory cells• Thin fibrous cap (<65 μm)
C tl d t t bl
32
• Currently undetectable

Cardiovascular Disease
Standard Diagnostic Techniquesg q• Angiography
• Severity of stenosis thrombosis dense calcifications• Severity of stenosis, thrombosis, dense calcifications• Provides no biochemical information
A i• Angioscopy• Surface features of plaque, including color
N i f i f b f f• No information of sub-surface features
• Histopathologygy• Biochemical and morphological information• Requires excision of tissue
33
q

Cardiovascular Disease
• Emerging Diagnostic g g gTechniques
• Magnetic resonance imaging
• Intravascular ultrasoundMicrostructure (100 μm)imaging
• External ultrasound• Positron emission
• Microstructure (100 μm)• Optical coherence
tomographyPositron emission tomography
• Electron beam computed tomography
• Microstructure (10 μm) • Fluorescence spectroscopy
• Limited chemicaltomography• Thermography• Elastography
• Limited chemical information
• Broad spectral featuresR S tElastography • Raman Spectroscopy
• Quantitative biochemical information
Non Invasive
34
• Morphological analysisNon-Invasive

Cardiovascular Disease
0 6
0.8
1.0• Raman Spectral Pathology of Atherosclerosis • Ca hydroxyapatite
0.0
0.2
0.4
0.6y y p
• proteins
800 1000 1200 1400 1600 1800
-0.2
0.81.0
.)
• cholesterol• β-carotene
0 20.00.20.40.6
nten
sity
(a.u • β-carotene
• proteins
0.81.0
800 1000 1200 1400 1600 1800-0.4-0.2In
• collagen
-0.20.00.20.40.6 • elastin
• actin
35
800 1000 1200 1400 1600 1800-0.6-0.4
Raman Shift (cm-1)Image from medstat.med.utah.edu/WebPath/webpath.html

Cardiovascular Disease
• Coronary Artery Disease Classification: A Prospective Study
1.0 Normal Artery Non-Calcified Plaque Calcified Plaque
1.0 Normal Artery Non-Calcified Plaque Calcified PlaqueP t t C l ifi ti
0 6
0.8
on 0 6
0.8 Punctate Calcification
on
0.4
0.6
3 σ error zonealci
ficat
io
0.4
0.6
3 σ error zonealci
ficat
io
0.2
Ca
0.2
Ca
0.0 0.1 0.2 0.3 0.4 0.5 0.60.0
0.0 0.1 0.2 0.3 0.4 0.5 0.60.0
36
CholesterolNCR + Lipid CoreNCRCholesterolNCR + Lipid CoreNCR
Buschman HPJ, Motz JT, et al. Cardiovascular Pathology 10(2), 59-68 (2001)

Cardiovascular Disease
Clinical In Vivo Data: Methods• Peripheral vascular surgery
• Femoral bypass• Carotid endarterectomy• Carotid endarterectomy
• Laser power calibration set with Teflon• ~100 mW (82-132mW)100 mW (82 132mW)
• OR room lights turned off as during angioscopy• Spectra collected for a total of 5 secondsSpectra collected for a total of 5 seconds
• 20 accumulations of 0.25s each• Probe held normal to arterial wall
• Analysis of 1s and 5s data • Additional model components: sapphire, epoxy, water, HbO2
37

Cardiovascular Disease
• Clinical In Vivo Data: Calcified Plaque 50 μmClinical In Vivo Data: Calcified Plaque1
DataFitResidual
0.5
.u.)
Residual
0
Inte
nsity
(a
-0.5
800 1000 1200 1400 1600 1800Raman Shift (cm -1 )
38Motz JT et al., J Biomed Opt 11(2): 021003

Cardiovascular Disease
• Clinical In Vivo Data: Ruptured PlaqueClinical In Vivo Data: Ruptured Plaque
0 5
1DataFitR id l
0
0.5
.)
Residual
-0.5
Inte
nsity
(a.u
.
-1.5
-1
0.4 mm
0.1 mm800 1000 1200 1400 1600 1800Raman Shift (cm -1 )
39Motz JT et al., J Biomed Opt 11(2): 021003
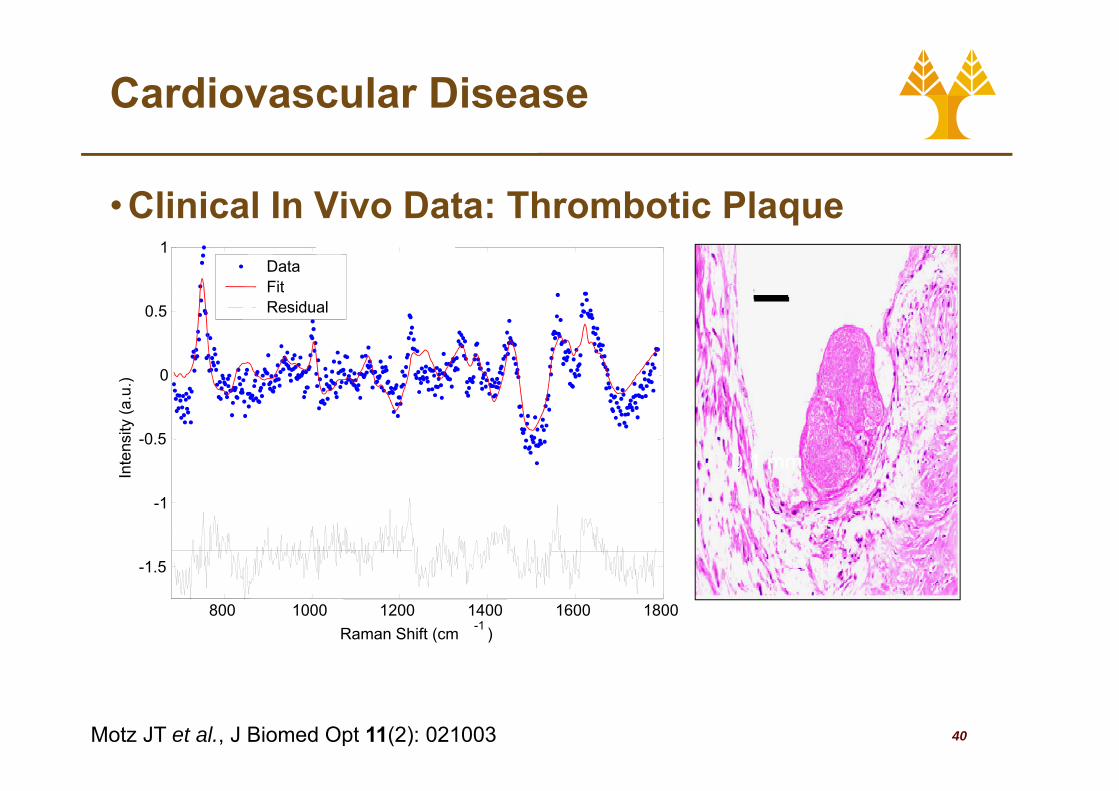
Cardiovascular Disease
• Clinical In Vivo Data: Thrombotic PlaqueClinical In Vivo Data: Thrombotic Plaque
0 5
1DataFitResidual
0
0.5
u.)
Residual
0.1 mm-0.5
Inte
nsity
(a.
-1.5
-1
800 1000 1200 1400 1600 1800Raman Shift (cm -1 )
40Motz JT et al., J Biomed Opt 11(2): 021003

Application To Other Diseases
Normal Breast Tissue Malignant Breast Tumor1 1
0 5
1Data Fit Residual
0.5
1Data Fit Residual
0
0.5
ntes
nity
(a.u
.)
-0.5
0
ntes
nity
(a.u
.)
0In
-1
0.5In
800 1000 1200 1400 1600 1800
-0.5
Raman Shift (cm -1)800 1000 1200 1400 1600 1800
-1.5
Raman Shift (cm -1)
100 mW excitation, 1 second collection
41

Frontier Investigations
• High-Wavenumber RamanHigh Wavenumber Raman
Advantages• Higher Raman signal• Lower fluorescence
N fib b k d
Disadvantages• Broader lineshapes• Smaller spectral region
M tl li it d t li id
42www.sigma.com
• No fiber background• Distinguishes cholesterol esters
• Mostly limited to lipids• No calcification signalc

Frontier Investigations
• High-Wavenumber RamanNormal Bladder
High Wavenumber Raman
DNA
Collagen
A ti
Glycogen
Cholesteryl palmitate
Actin High-Wavenumber H&Elp: lamina propriau: urotheliumCholesteryl palmitate
Cholesteryl linoleate
Triolein
43Koljenovic S et al., J Biomed Opt 10(3): 031116 (2005)
Triolein

Conclusions
• Raman spectroscopy ‘fingerprints’ molecules byRaman spectroscopy fingerprints molecules by characterizing interactions between photons and molecular vibrationsmolecular vibrations
• Near-infrared excitation is preferred for bi di l li tibiomedical applications
• Recent optical fiber probe developments allowRecent optical fiber probe developments allow accurate real-time analysis in vivo
N f h i i f• New areas of research are promising for widespread clinical application
4444

References
• McCreery RL. Raman Spectroscopy for Chemical A l i Wil I t i N Y k 2000Analysis. Wiley-Interscience, New York, 2000.
• Ferraro JR, Nakamoto K, and Brown CW. I t d t R S t 2 d dIntroductory Raman Spectroscopy 2nd ed. Academic Press, Boston, 2003.H l EB t l “P t f i i R• Hanlon EB, et al. “Prospects for in vivo Raman spectroscopy,” Phys Med Biol 45: R1-R59 (2000).
• Mahadevan Jensen A and Richards Kortum R• Mahadevan-Jensen A and Richards-Kortum R. “Raman spectroscopy for the detection of cancers and precancers,”J Biomed Opt 1:31-70 (1996).( )
• Utzinger U and Richards-Kortum R. “Fiber optic probes for biomedical spectroscopy,” J Biomed Opt 8 121 147 (2003)
45
8: 121-147 (2003).45


