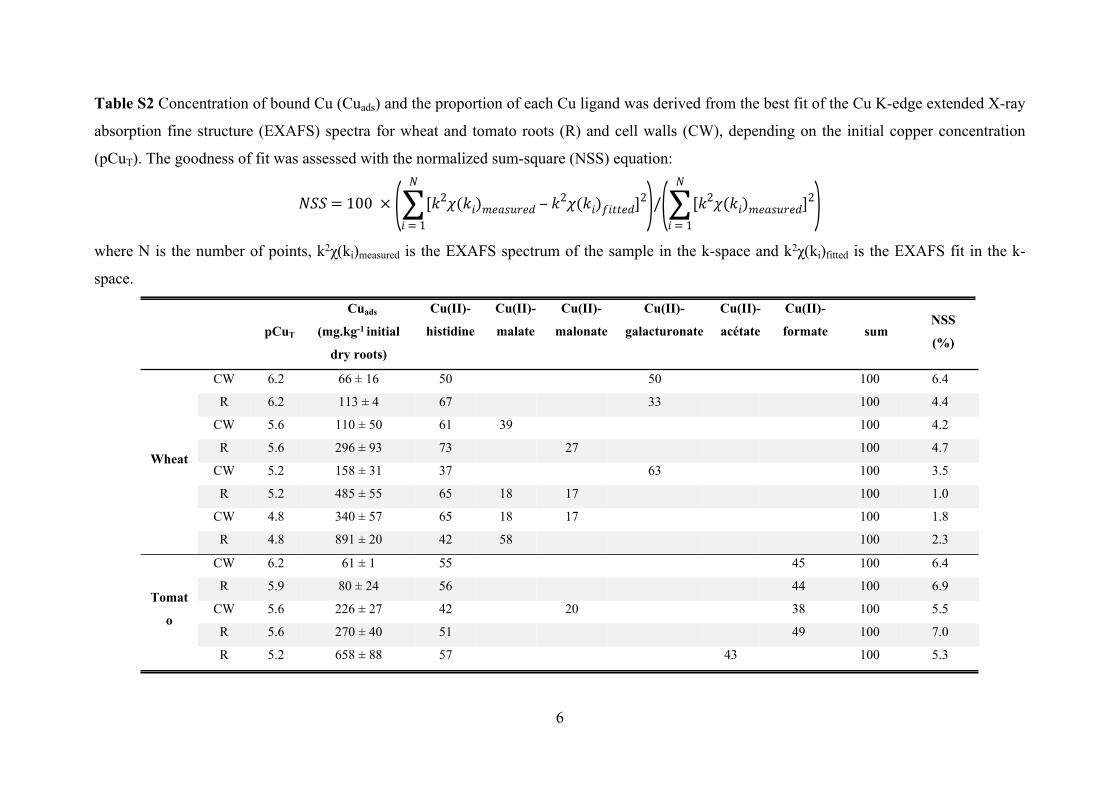
Table S2 Concentration of bound Cu (Cuads) and the proportion of each Cu ligand was derived from the best fit of the Cu K-edge extended X-ray
absorption fine structure (EXAFS) spectra for wheat and tomato roots (R) and cell walls (CW), depending on the initial copper concentration
(pCuT). The goodness of fit was assessed with the normalized sum-square (NSS) equation:
𝑁𝑆𝑆 = 100 × ( 𝑁
∑𝑖 = 1
[𝑘2𝜒(𝑘𝑖)𝑚𝑒𝑎𝑠𝑢𝑟𝑒𝑑 ‒ 𝑘2𝜒(𝑘𝑖)𝑓𝑖𝑡𝑡𝑒𝑑]2)/( 𝑁
∑𝑖 = 1
[𝑘2𝜒(𝑘𝑖)𝑚𝑒𝑎𝑠𝑢𝑟𝑒𝑑]2)where N is the number of points, k2χ(ki)measured is the EXAFS spectrum of the sample in the k-space and k2χ(ki)fitted is the EXAFS fit in the k-
space.
pCuT
Cuads
(mg.kg-1 initial
dry roots)
Cu(II)-
histidine
Cu(II)-
malate
Cu(II)-
malonate
Cu(II)-
galacturonate
Cu(II)-
acétate
Cu(II)-
formate sumNSS
(%)
CW 6.2 66 ± 16 50 50 100 6.4
R 6.2 113 ± 4 67 33 100 4.4
CW 5.6 110 ± 50 61 39 100 4.2
R 5.6 296 ± 93 73 27 100 4.7
CW 5.2 158 ± 31 37 63 100 3.5
R 5.2 485 ± 55 65 18 17 100 1.0
CW 4.8 340 ± 57 65 18 17 100 1.8
Wheat
R 4.8 891 ± 20 42 58 100 2.3
CW 6.2 61 ± 1 55 45 100 6.4
R 5.9 80 ± 24 56 44 100 6.9
CW 5.6 226 ± 27 42 20 38 100 5.5
R 5.6 270 ± 40 51 49 100 7.0
Tomat
o
R 5.2 658 ± 88 57 43 100 5.3
7
Figure S1 Potentiometric titrations for wheat (squares) and tomato (circles) roots (filled
symbols) and cell walls (empty symbols) expressed in charge (Q) corrected by the initial
charge (Q0). Solid lines refer to the fitting curves obtained with model VII using one humic-
acid, as described in the Material and Methods.
8
Figure S2 Theoretical potentiometric titrations for wheat (triangles) and tomato (cross)
plasma membranes expressed in charge (Q) corrected by the initial charge (Q0). Solid lines
refer to the fitting curves obtained with model VII using the two HA model as described in the
Material and Methods.
9
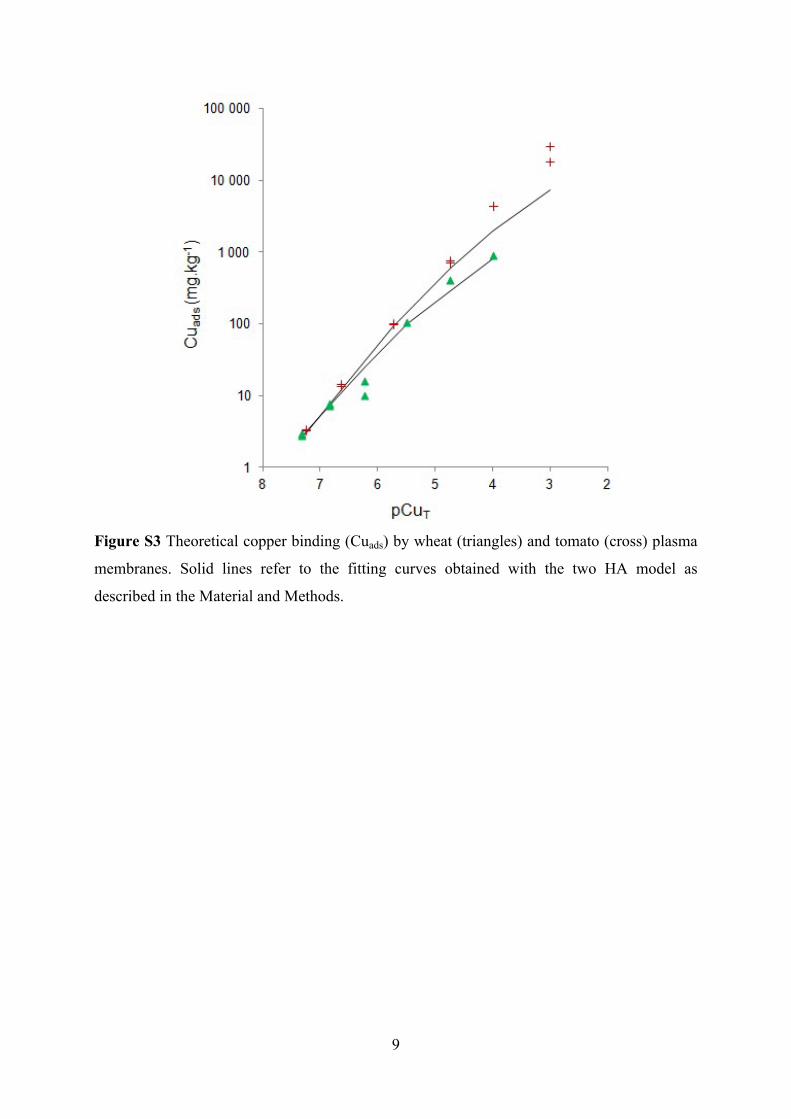
Figure S3 Theoretical copper binding (Cuads) by wheat (triangles) and tomato (cross) plasma
membranes. Solid lines refer to the fitting curves obtained with the two HA model as
described in the Material and Methods.
10
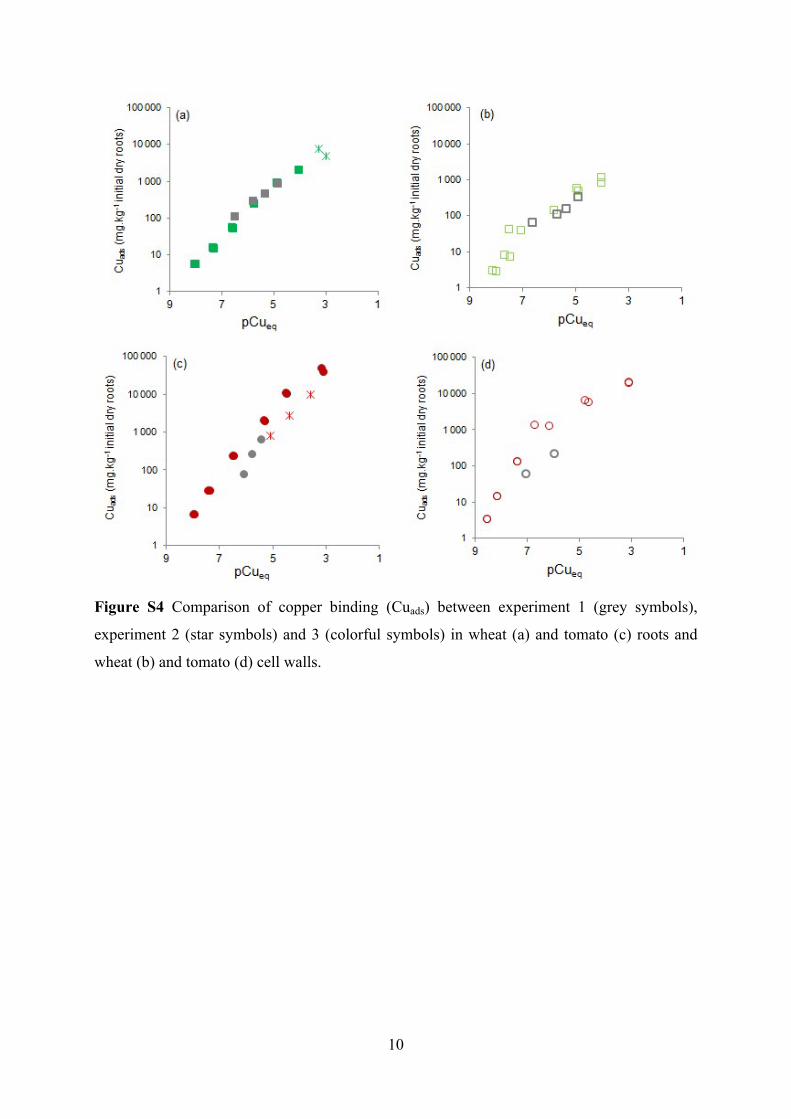
Figure S4 Comparison of copper binding (Cuads) between experiment 1 (grey symbols),
experiment 2 (star symbols) and 3 (colorful symbols) in wheat (a) and tomato (c) roots and
wheat (b) and tomato (d) cell walls.
11
Figure S5 Visible shift (arrows) in the first oscillation of the Cu K-edge k2-weighted
extended X-ray absorption fine structure (EXAFS) spectra for wheat (green line) and tomato
(red line) roots, as similarly observed between the two reference compounds, i.e. Cu(II)-
histidine (dotted black line) and Cu(II)-formate (dotted grey line).
12
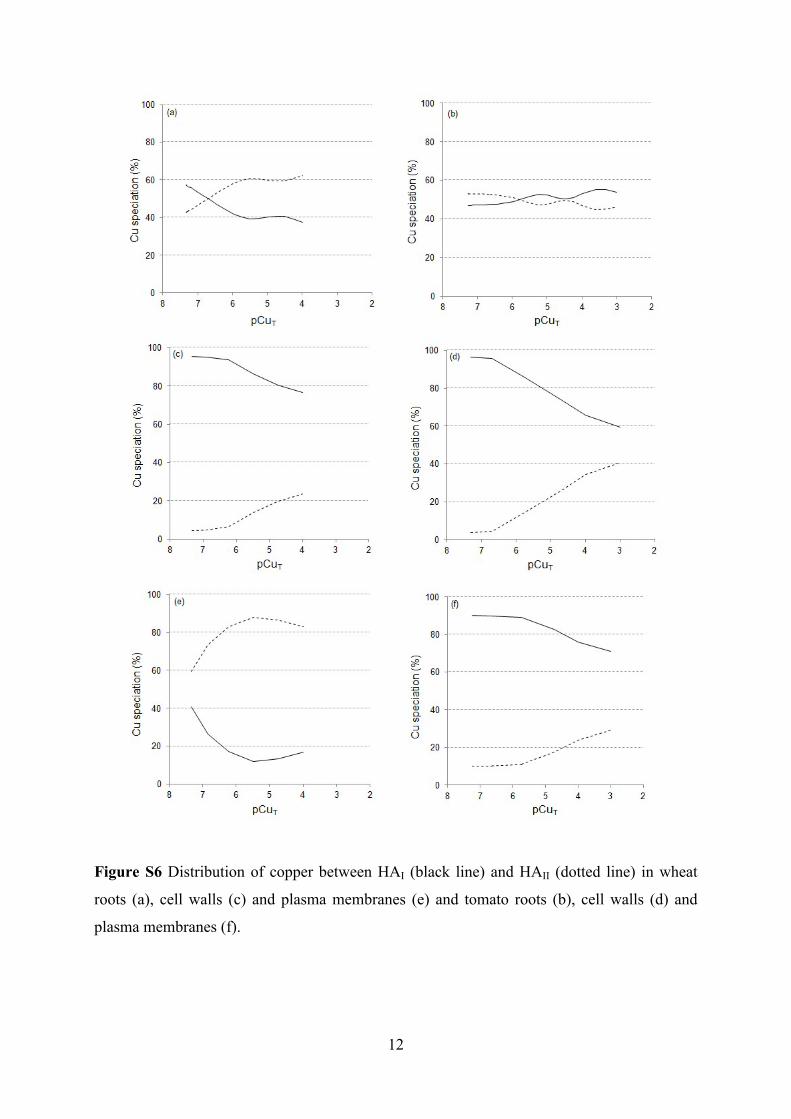
Figure S6 Distribution of copper between HAI (black line) and HAII (dotted line) in wheat
roots (a), cell walls (c) and plasma membranes (e) and tomato roots (b), cell walls (d) and
plasma membranes (f).
13
Figure S7 Normalized k2-weighted EXAFS spectra at Cu K-edge and their corresponding Fourier transform (FT) magnitudes (not corrected for
phase shift) of reference compounds used to fit the roots and cell walls samples.
14
References
Collin B et al. (2014) Evidence of sulfur-bound reduced copper in bamboo exposed to high silicon and