Page 1
CatalyticpromiscuityofglycopeptideN‐methyltransferasesenablesbio‐orthogonal labeling
ofbiosyntheticintermediates
ClaraBrieke,GraceYim,MadeleinePeschke,GerardD.Wright,MaxJ.Cryle
ElectronicalSupplementaryInformation
Content:
GeneralMethods
CloningandExpressionofMtfadbvandMtfapek
AlignmentofMtfadbvandMtfapekwithMtfacle
Synthesisofcompounds1,2a‐c
Mtaseinvitroactivityassayswithteicoplaninaglycone1
Loadingof3‐CoAontoapo‐PCP‐Xtei
CoupledP450/Mtaseinvitroactivityassay
IEDDAofmodifiedteicoplaninaglycone1cwithtetrazines
HPLC,HPLC‐MS‐andMS/MS‐Characterisationofpeptidesisolatedfrominvitroactivitystudies
Chemicalstructuresoftype‐IVandtype‐IGPAs
Antibioticactivityassaysof1,1b,1c
NMRcharacterizationof1,1b,1c
References
Electronic Supplementary Material (ESI) for ChemComm.This journal is © The Royal Society of Chemistry 2016
Page 2
GeneralMethods
All chemicals and solvents were obtained from commercial suppliers (Sigma‐Aldrich; VWR) and
usedwithoutfurtherpurification.
HPLC analysis and purifications were carried out using a High Performance Liquid
Chromatograph/MassSpectrometerLCMS‐2020(ESI,operatingbothinpositiveandnegativemode)
equippedwith a SPD‐M20A Prominence Photo Diode Array Detector in preparativemode and a
SPD‐20A Prominence Dual Wavelength UV Detector in analytical mode, all from Shimadzu. For
analytical analyses the solvent deliverymodule LC‐20ADwas used; for preparative purifications
twoLC‐20APunitswereused.AnalyticalseparationswereperformedonWatersXBridgeBEH300
C18 columns (5 or 10 µm, 4.6 x 250mm). Preparative separations were performed on aWaters
XBridgeBEH300PrepC18column(5µm,19x150mm)ataflowrateof20mL/min.Thesolvents
usedwereHPLC‐grade acetonitrile + 0.1% formic acid (solventA) andwater + 0.1% formic acid
(solvent B). UHPLC‐MS measurements were performed on a Shimadzu Nexera X2 LCMS 8050
system(triplequadrupoleESI,operatingbothinpositiveandnegativemode)usinganAcquityUPLC
peptideBEHC18column(130Å,1.7µm,2.1x100mm)andMS‐gradeacetonitrile+0.1%formic
acid(solventA)andwater+0.1%formicacid(solventB)assolvents.ElectrosprayIonizationMass
Spectrometry(ESI‐MS)andESI‐MS/MSmeasurementswereperformedwithHPLC‐purifiedsamples
on a Bruker maXis ultra‐high resolution time‐of‐flight (TOF) mass spectrometer. Samples were
analysed in positive mode and fragmented by collision induced dissociation (CID). NMR studies
were performed at the Institute for Pharmacy and Molecular Biotechnology of the University of
HeidelbergusingaVarian500MHzNMRspectrometer.
The synthesis of the teicoplanin‐like heptapeptide‐Coenzyme A conjugate 3‐CoA has been
previouslyreported.1,2TheteicoplaninproducingP450enzymesOxyBtei(ProteinID:Q70AY8),3and
OxyAtei(ProteinID:Q6ZZI8)4werealsogeneratedaspreviouslydescribed.Cloning,expressionand
purification for thePCP‐Xdi‐domainproteinasaGB1(IgGbindingB1domainofStreptococcus)5‐
fusion proteinwith anN‐terminal hexahistidine tag and a C‐terminal Strep‐II‐tagwas performed
according to references.6 Redox partner proteinswere obtained fromDr. StephenBell (Adelaide,
Australia).7
Page 3
CloningofmethyltransferasesMtfadbvandMtfapek
Genes were PCR amplified from genomic DNA using Phusion High‐Fidelity DNA Polymerase
(Thermo Fisher Scientific, USA). The primers MtfA WAC4229 NdeI F (5' ‐
TTTCATATGAGTGATCAGCTGGAGCACG ‐3') and MtfA WAC4229 HindIII R (5' ‐
TTTAAGCTTCATGCGGGACCGGTCTTC ‐3') were used to amplify mtfapek from the pekiskomycin
producer S. malachitospinus WAC4229 11. The oligonucleotides MtfA dbv HindIII R (5' ‐
TTTAAGCTTCTAATGCGCGTCTTCCAC ‐3') and MtfA dbv NdeI F (5' ‐
AAACATATGATAAGCAAAGCAATGCATG ‐3’) were employed to amplify mtfadbv from the A4096
producerActinomadurasp.ATCC39727.PCRproductsandthevectorpET28a(Novagen,USA)were
digestedwithNde IandHind IIIand ligatedtogetherwithT4DNA ligase.Ligationreactionswere
transformedintoE.coliTOP10(ThermoFisherScientific,USA).Error‐freeconstructswerevalidated
bySangersequencingusingstandardT7promoterandterminatorprimers.
ExpressionandPurificationofmethyltransferasesMtfadbvandMtfapek
The methyltransferase proteins were expressed in the E.coli BL21Gold (DE3) strain (Agilent,
Waldbronn,Germany)withanN‐terminalhexahistidinetag.2LLBmedium(+50mg/Lkanamycin)
wereinoculatedwithanovernightstartercultureoftransformedE.coliBL21(DE3)andgrownat37
°CuntilOD600reached0.6.Aftercoolingdownto20°Cproteinexpressionwasinducedbyadding
100 mM IPTG and the cell culture was incubated at 20 °C overnight. Cells were harvested by
centrifugationat4°C(5000xg),resuspendedinlysisbuffer(50mMTrispH8.0,50mMNaCl,10
mMimidazole)includingproteaseinhibitorcocktail(Sigma‐Aldrich,München,Germany)andlysed
bypassingtreetimesthroughafluidizer(Microfluidics,Newton,USA).Aftercentrifugation(50000x
g, 4 °C,25min) the soluble fractionwas incubated for1h at 4°Cwith4mLofNi‐NTA resinpre‐
equilibratedwith2x10columnbedvolumes(CV)ofwashbuffer(50mMTrispH8.0,300mMNaCl,
10mMimidazole).Afterseparatingtheresinfromthesupernatantbycentrifugationat1000gitwas
transferredintoacolumnandwashedwith10CVofwashbuffer.Proteinswereelutedwith3CVof
elution buffer (50mM Tris pH 8.0, 300mM NaCl, 300mM imidazole). The elution fraction was
further purified by size exclusion chromatography on a Superose‐12 column (GE Healthcare,
München,Germany)connectedtoanÄktaFPLCusingexchangebuffer(20mMTris.HClpH7.4,20
mMNaCl,5mMDTE).ElutionfractionswereanalysedbySDS‐PAGE,appropriatefractionspooled
and concentrated using centrifugal concentrators with a 10,000 MW cut‐off (Sartorius Stedim
Biotech, Göttingen, Germany). Aliquotswere flash frozen in liquid nitrogen and stored at ‐80 °C.
Page 4
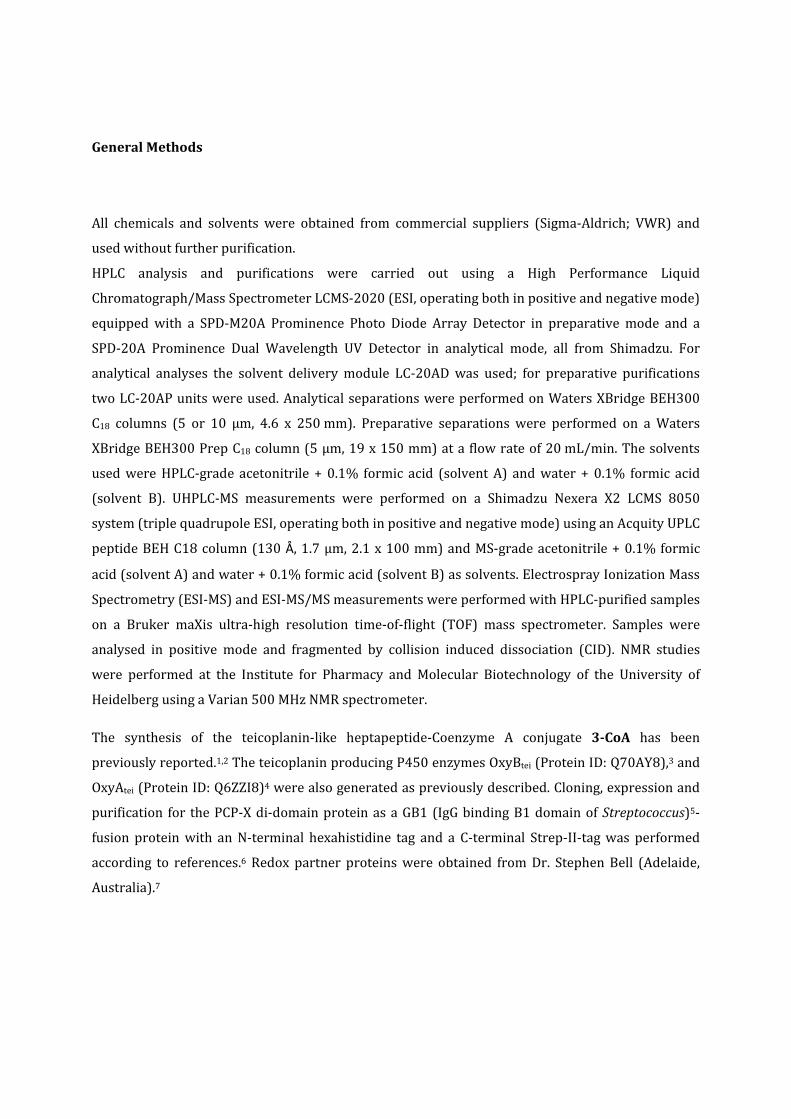
Proteinswereobtainedinayieldof15.8mg(0.5µmol)/LcultureforMtfadbvand32mg(1µmol)/L
cultureforMtfapek.
FigS1.Gelfiltrationchromatogramsandelectrophoreticanalysis(10%SDS‐PAGEgel)ofpurified
Mtfadbv (left side, marked with a star) and Mtfapek (right side, marked with a star). As marker
“PrecisionPulsProteinAllBlueStandards(BioRad)wasused;stainingwasperformedusingInstant
Blue(Expedeon).
* *
Page 5
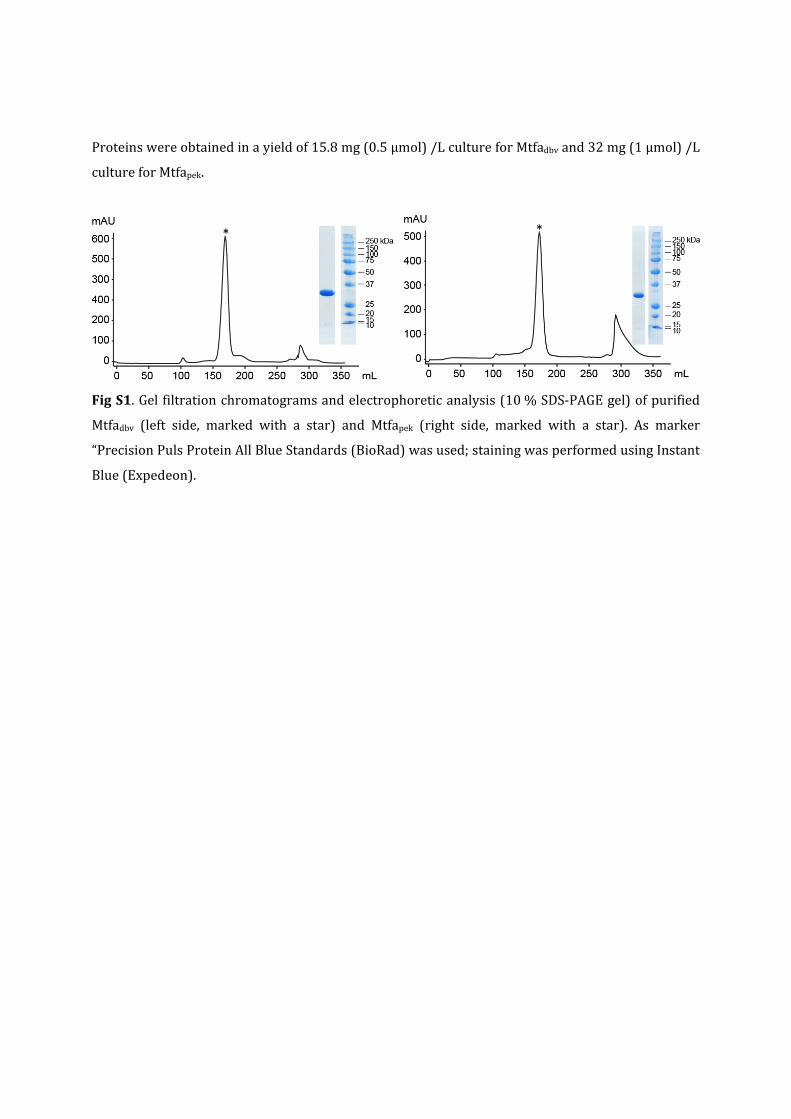
Fig.S2:AlignmentofMtfadbvandMtfapekwiththealreadycharacterisedMtfacle fromthechloroeremomycin
producingA.orientalis.SecondarystructureelementsaretakenfromMtfacleandshownabovethealignment.
Thesequencesdisplay46%identity.AlignmentwasperformedwithClustalOmega.8
Page 6
Synthesisofcompounds
Teicoplanin aglycone 1 was obtained as describe in literature.9 Briefly, teicoplanin (45 mg,
SantaCruz,Heidelberg,Germany)wassonicatedinamixtureofconc.HCl(1.12mL)andaceticacid
(10.2mL) until a clear solutionwas obtained. Thismixturewas heated to 80 °C under vigorous
shaking.After2 h ice‐colddiethyl ether (35mL)was added andawhite solidprecipitated.After
keeping themixture at ‐24 °C overnight, the solidwas separated and purified using preparative
HPLC.AfterlyophilisationoftherespectiveHPLCfractionsteicoplaninaglycone1wasobtainedas
whitefoam.Stocksolutions(1mM)werepreparedin20%DMSOandstoredat‐24°C.
AdoPropen 2b and AdoViBenz 2c were synthesized according to literature:10,11 S‐adenosyl‐L‐
homocysteine(20mg,52μmol)wasdissolvedin3mLofa1:1mixtureofformicandaceticacidand
cooledto0°C.3‐Bromo‐1‐propene(264μL,3.1mmol)or4‐vinylbenzylchloride(533μL,3.7mmol)
was slowly added to the stirred solution.The reactionmixturewas allowed towarmup to room
temperature and stirred for 4 days.By adding the reactionmixture into10mL cooledwater the
reactionwasquenchedandthewaterphasewasextractedwith5mLdiethyletherforfourtimes.
After lyophilisation the crude product was purified by preparative reversed‐phase HPLC using
following gradient: 0 ‐15 min up to 10 % solvent A. The obtained diastereomeric mixture was
concentrated by lyophilisation. Stock solutions (10 mM) in water were aliquoted and stored at
−80°Cbeforeuse.
Page 7
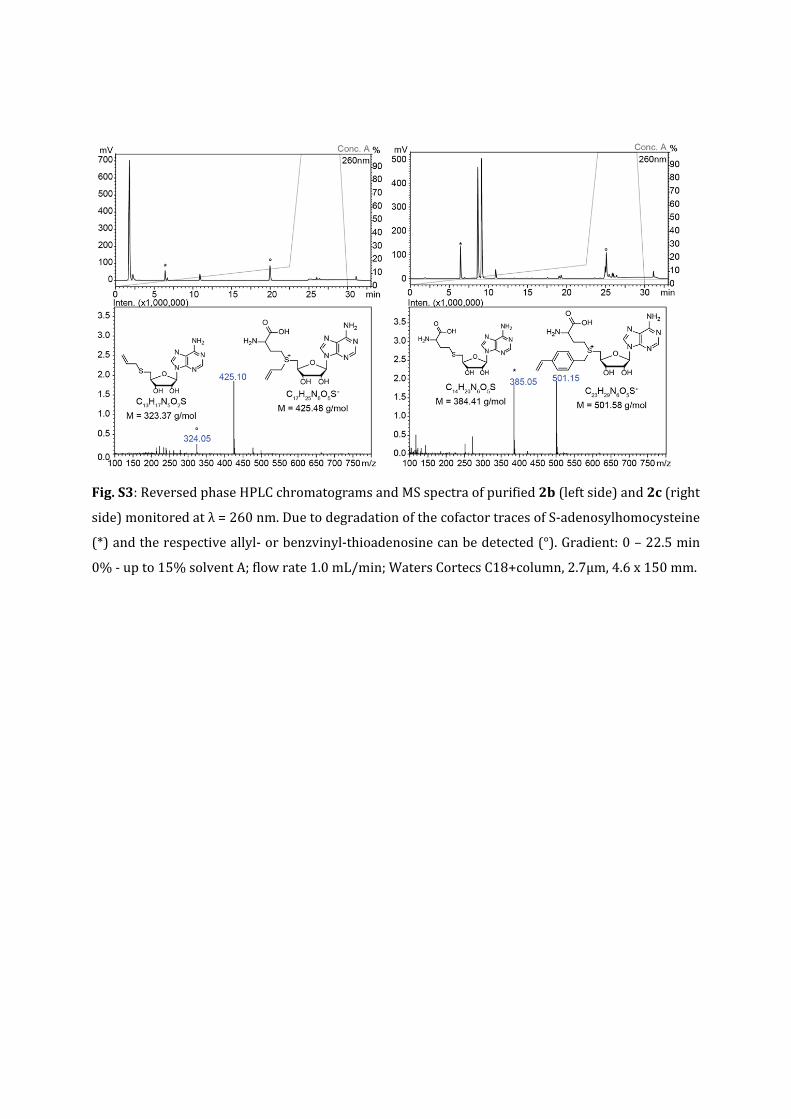
Fig.S3:ReversedphaseHPLCchromatogramsandMSspectraofpurified2b(leftside)and2c(right
side)monitoredatλ=260nm.DuetodegradationofthecofactortracesofS‐adenosylhomocysteine
(*)andtherespectiveallyl‐orbenzvinyl‐thioadenosinecanbedetected(°).Gradient:0–22.5min
0%‐upto15%solventA;flowrate1.0mL/min;WatersCortecsC18+column,2.7µm,4.6x150mm.
Page 8
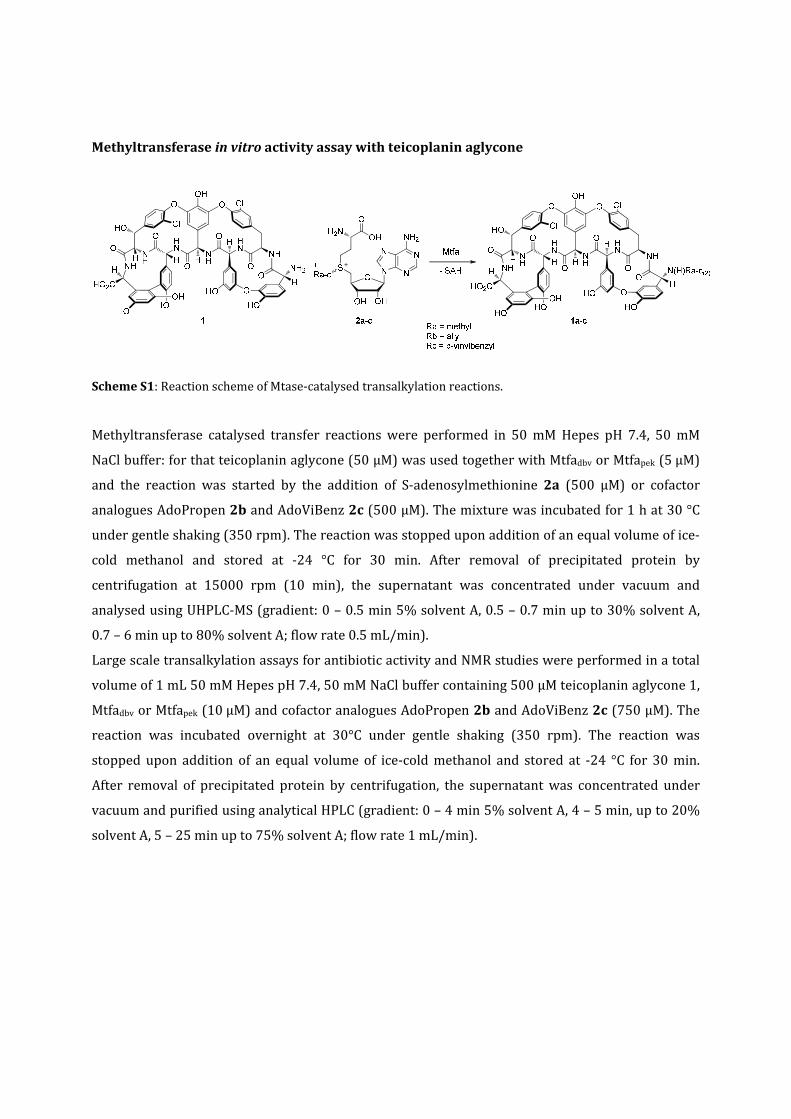
Methyltransferaseinvitroactivityassaywithteicoplaninaglycone
SchemeS1:ReactionschemeofMtase‐catalysedtransalkylationreactions.
Methyltransferase catalysed transfer reactions were performed in 50mM Hepes pH 7.4, 50mM
NaClbuffer:forthatteicoplaninaglycone(50µM)wasusedtogetherwithMtfadbvorMtfapek(5µM)
and the reaction was started by the addition of S‐adenosylmethionine 2a (500 µM) or cofactor
analoguesAdoPropen2bandAdoViBenz2c(500µM).Themixturewasincubatedfor1hat30°C
undergentleshaking(350rpm).Thereactionwasstoppeduponadditionofanequalvolumeofice‐
cold methanol and stored at ‐24 °C for 30 min. After removal of precipitated protein by
centrifugation at 15000 rpm (10 min), the supernatant was concentrated under vacuum and
analysedusingUHPLC‐MS(gradient:0–0.5min5%solventA,0.5–0.7minupto30%solventA,
0.7–6minupto80%solventA;flowrate0.5mL/min).
LargescaletransalkylationassaysforantibioticactivityandNMRstudieswereperformedinatotal
volumeof1mL50mMHepespH7.4,50mMNaClbuffercontaining500µMteicoplaninaglycone1,
MtfadbvorMtfapek(10µM)andcofactoranaloguesAdoPropen2bandAdoViBenz2c(750µM).The
reaction was incubated overnight at 30°C under gentle shaking (350 rpm). The reaction was
stopped upon addition of an equal volume of ice‐coldmethanol and stored at ‐24 °C for 30min.
After removal of precipitated protein by centrifugation, the supernatantwas concentrated under
vacuumandpurifiedusinganalyticalHPLC(gradient:0–4min5%solventA,4–5min,upto20%
solventA,5–25minupto75%solventA;flowrate1mL/min).
Page 9
Loadingofteicoplanin‐like‐CoApeptide(3‐CoA)ontoapo‐PCP‐Xtei
Thepeptide‐CoAconjugatewas loadedontothePCP‐domainoftheteicoplaninPCP‐Xteidi‐domain
protein catalyzed by the Sfp variant R4‐412 by incubating amixture of 60 µMPCP‐Xtei, 6 µM Sfp,
120µM3‐CoA,50mMHepespH7.0,50mMNaCl,10mMMgCl2for1hat30°C.Afterwards,excess
of free peptidewas removed by a dilution‐concentration procedurewith low salt buffer (50mM
HepespH7.0 forP450activityassayor50mMHepespH7.4 formethyltransferaseactivityassay,
50mM NaCl, 4 x 1:5 dilution) using centrifugal filter units with a 10,000MW cut‐off (Merck
Millipore, Darmstadt, Germany). The generatedpeptidyl‐PCP‐Xtei constructwas immediately used
forfurtherenzymaticinvitroactivityassays.
CoupledP450/methyltransferaseinvitroactivityassay
Invitrooxidationexperimentswereperformedin50mMHepes,pH7.0,50mMNaClbufferat30°C.
Understandardturnoverconditions2µMofOxyBteiorOxyBteiandOxyAteiwereusedtogetherwith
50µM peptidyl‐PCP‐Xtei immediately after the PCP loading reaction. Palustrisredoxin B variant
A105V (PuxB) together with palustrisredoxin reductase (PuR) were used as a redox system7 in
5:1:50(PuxB:PuR:peptidyl‐PCP‐X)ratio.Theturnoverreactionwasstarteduponadditionof2mM
NADH (Gerbu, Biotechnik, Heidelberg, Germany). For NADH regeneration 0.33% glucose and
9U/mL glucose dehydrogenase (Sorachim, Lausanne, Switzerland)were included in the reaction
mixture.Theturnoverreactionwasincubatedfor1hwithgentleshaking(350rpm).
Forthesubsequentmethyltransferaseassayeitherprotocola)orb)wasused.
Protocola)MethyltransferaseassaywithPCP‐Xtei‐boundpeptidesassubstrates
Tostoptheoxidationreaction in thecytochromeP450turnovermixtureNADHandglucosewere
removedbyadilution‐concentrationprocedurewithbuffer(50mMHepespH7.4,50mMNaCl,3x
1:5 dilution) using centrifugal filter unitswith a 10,000MW cut‐off (MerckMillipore, Darmstadt,
Germany).Followingthat,themixturewasseparatedintotriplicatesandpeptidyl‐PCP‐Xtei(50µM)
wasincubatedwithmethyltransferaseMtfadbvorMtfapek(5µM)andS‐adenosylmethionine2a(500
µM)for1hat30°C(350rpm).Controlreactionswereperformedwithoutmethyltransferaseorco‐
substrate.Forworkup,peptideswerereleasedfromthePCPaddingmethylamine(40%solutionin
H2O, 15min incubation at RT), resulting in peptidemethylamides. For the following purification
procedure ice‐cold diluted formic acidwas added to neutralise the turnovermixture,whichwas
Page 10
thenpurifiedviasolidphaseextraction(Strata‐Xpolymericreversedphase3mg/mL,Phenomenex,
Aschaffenburg, Germany): 1. loading sample using gravity flow, 2. washing column with 5 %
methanol in water, 3. elution of peptidewith 100%methanol + 0.1% formic acid. The elution
fraction was concentrated under vacuum and analysed by analytical UHPLC‐MS using single ion
monitoring in negative mode. After integration of the signals obtained for the different peptide
speciestheMtfaactivitieswerecalculatedbasedonthepercentageofalkylatedpeptiderelativeto
therespectivesubstrateobtainedfromtheP450turnover.
Protocolb)MethyltransferaseassaywithPCP‐X‐cleavedpeptidesassubstrates
ThecytochromeP450turnovermixturewastreatedwithmethylaminetocleavethepeptidefrom
thePCP‐Xteidi‐domainproteinasdescribedinprotocola).Afterneutralisationwithdilutedformic
acidandpurificationviasolidphaseextractiontheelutionfractionwasconcentratedundervacuum
anddissolvedin50mMHepespH7.4,50mMNaCl(equalvolumeasforcytochromeP450turnover
assay). The mixture was split into triplicates and Mtfadbv or Mtfapek (5 µM) and co‐substrate
derivatives 2a‐c (500 µM) were added. Control reactions were performed without
methyltransferase.Afterincubationfor1hat30°C(350rpm)thereactionwasquenchedwithan
equal volume of ice‐cold methanol and stored at ‐24 °C for 30 min. Precipitated protein was
removed by centrifugation and the supernatant was concentrated under vacuum followed by
UHPLC‐MSanalysis.Dataanalysiswasperformedasdescribedinprotocola).
Forenzymaticmodificationswithco‐substrate2aand2bthefollowinggradientwasused:0–0.5
min5%solventA,0.5–0.7minupto20%solventA,0.7–6minupto70%solventA;flowrate0.5
mL/min. For reactionswith co‐substrate2c: 0 – 0.5min 5% solventA, 0.5 – 0.7min up to 20%
solventA,0.7–7minupto90%solventA;flowrate0.5mL/min.
Page 11
Enzymaticmodificationofteicoplaninaglyconefollowedby inverseelectron‐demandDiels‐
Alderreaction
Teicoplaninaglycone1 (500µM)was incubated togetherwithMtfapek (50µM)andAdoViBenz2c
(600µM)in50mMHepes,pH7.4,50mMNaClbufferfor2hat30°C(350rpm).Aftermethanol
precipitation and removal of precipitated protein by centrifugation the supernatantwas purified
usinganalyticalHPLCtoseparate4‐vinylbenzylN‐terminallymodifiedteicoplaninaglycone1cfrom
unreactedcofactorspecies.AfterremovaloftheHPLCsolvent1cwasdissolvedin50mMHepes,pH
7.4/ acetonitrile (1:1) and incubatedwith6‐methyl‐tetrazine‐5‐TAMRA6 (1mMof10mMstock
solutioninDMSO,JenaBioscience,Jena,Germany)ortetrazine‐PEG4‐biotin7(1mMof50mMstock
solutioninDMSO,JenaBioscience,Jena,Germany)at37°Cfor24hexcludinglightexposure(strong
shaking at 2000 rpm). The reactionwas analysed using analytical HPLC and labelled teicoplanin
aglycones8and9werecharacterisedusingMSfragmentation(seeFig.S10‐S12).
Page 12
Fig.S4:RepresentativeUHPLC‐MSchromatogramsofmethyltransferaseturnoverreactionswithteicoplanin
aglycone 1 and different co‐substrates 2a‐c. Chromatograms were recorded using single monitoring for
unmodifiedteicoplaninaglycone(blackline),mono‐(redline)andbisalkylatedaglycone(blueline)inpositive
mode.
Fig.S5:HPLCchromatogramsofinverseelectrondemandingDielsAlderreactionsmonitoredatλ=260and
280nm.A)HPLCtraceofpurifiedteicoplaninaglyconederivative1c;B)HPLCtraceofreactionfrom1cwith
tetrazine‐TAMRAderivative6yielding80%ofproduct8after18hreactiontime;C)HPLCtraceofreaction
from1cwithtetrazine‐PEGderivative7toproduct9.
Page 13
Fig.S6:Mtfawacturnoverreactionswithteicoplaninaglycone1anddifferentco‐substrates2a‐canalysedwith
analyticalUV/VISHPLC(leftside,monitoredat260and280nm)andUHPLC‐MS(rightside,monitoredusing
single ion detection in positive mode). UV/VIS‐HPLC monitoring confirms full conversion of teicoplanin
aglycone1asshownbyUHPLC‐MSanalysis.Peaksrepresentingco‐substrates2a‐c,co‐substrateproductof
Mtase reactionS‐adenosylhomocysteine (#) and co‐substratedegradationproducts allyl‐thioadenosine (for
2b,*)orvinylbenzyl‐thioadenosine(2c,*)aremarked.
Page 14
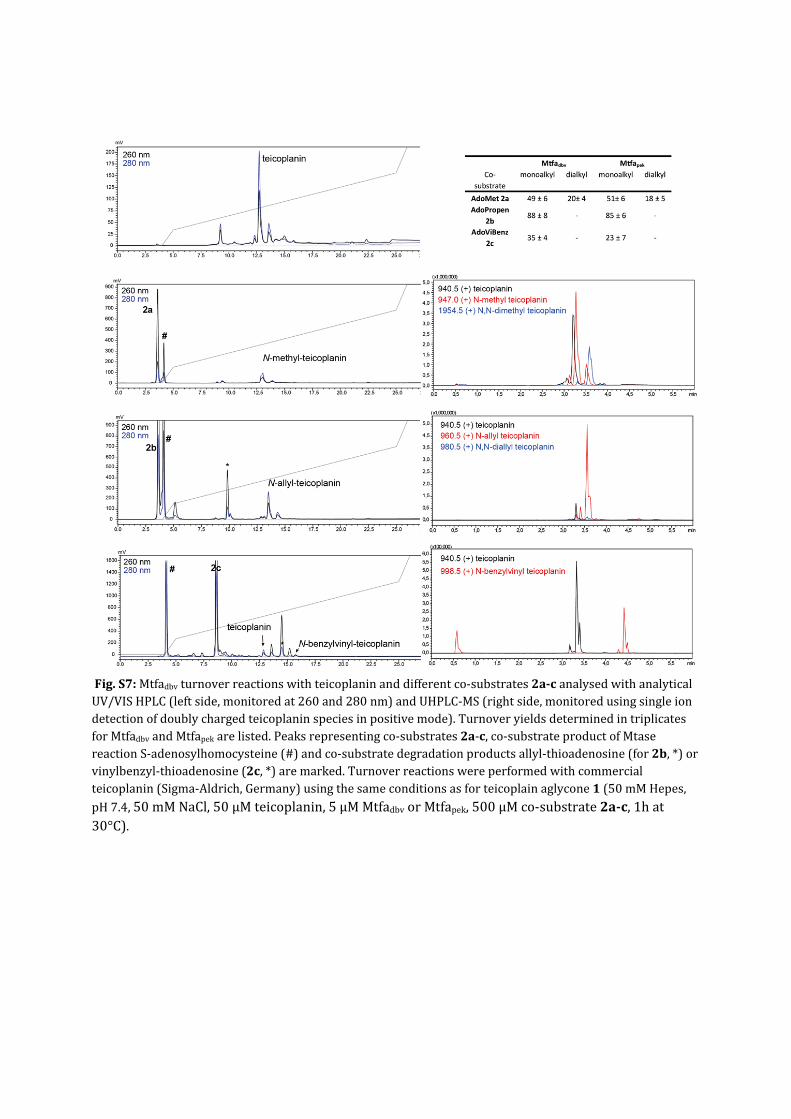
Fig.S7:Mtfadbvturnoverreactionswithteicoplaninanddifferentco‐substrates2a‐canalysedwithanalyticalUV/VISHPLC(leftside,monitoredat260and280nm)andUHPLC‐MS(rightside,monitoredusingsingleiondetectionofdoublychargedteicoplaninspeciesinpositivemode).TurnoveryieldsdeterminedintriplicatesforMtfadbvandMtfapekarelisted.Peaksrepresentingco‐substrates2a‐c,co‐substrateproductofMtasereactionS‐adenosylhomocysteine(#)andco‐substratedegradationproductsallyl‐thioadenosine(for2b,*)orvinylbenzyl‐thioadenosine(2c,*)aremarked.Turnoverreactionswereperformedwithcommercialteicoplanin(Sigma‐Aldrich,Germany)usingthesameconditionsasforteicoplainaglycone1(50mMHepes,pH7.4,50mMNaCl,50µMteicoplanin,5µMMtfadbvorMtfapek,500µMco‐substrate2a‐c,1hat30°C).
Page 15
1198.23
1199.23
1200.231+
1201.231+
1202.231+
1203.231+
+MS, 0.1‐0.6min #3‐35
0.0
0.5
1.0
1.5
2.0
2.5
5x10Intens.
1196 1198 1200 1202 1204 m/z
1198.231+
1199.231+
1200.231+
1201.231+
1202.231+
1203.231+
C₅₈H₄₆Cl₂N₇O₁₈, , 1198.23
0.0
0.5
1.0
1.5
2.0
2.5
5x10Intens.
1196 1198 1200 1202 1204 m/z
1212.24
1214.241+
+MS, 0.0‐0.8min #2‐50
0
1000
2000
3000
4000
5000
6000
Intens.
1210.0 1212.5 1215.0 1217.5 m/z
1212.241+
1214.241+
C₅₉H₄₈Cl₂N₇O₁₈, , 1212.24
0
1000
2000
3000
4000
5000
Intens.
1210.0 1212.5 1215.0 1217.5 m/z
1226.261+
1228.261+
+MS, 0.0‐0.7min #2‐44
0
250
500
750
1000
1250
1500
Intens.
1225.0 1227.5 1230.0 1232.5 m/z
1226.261+
1228.261+
C₆₀H₅₀Cl₂N₇O₁₈, M, 1226.26
0
250
500
750
1000
1250
1500
Intens.
1225.0 1227.5 1230.0 1232.5 m/z
1238.261240.26
1+ +MS, 0.1‐0.8min #3‐50
0.0
0.5
1.0
1.5
2.0
4x10Intens.
1236 1238 1240 1242 1244 m/z
1238.261+
1240.261+
C₆₁H₅₀Cl₂N₇O₁₈, , 1238.26
0.0
0.5
1.0
1.5
2.0
4x10Intens.
1236 1238 1240 1242 1244 m/z
A
B
C
D
Page 16
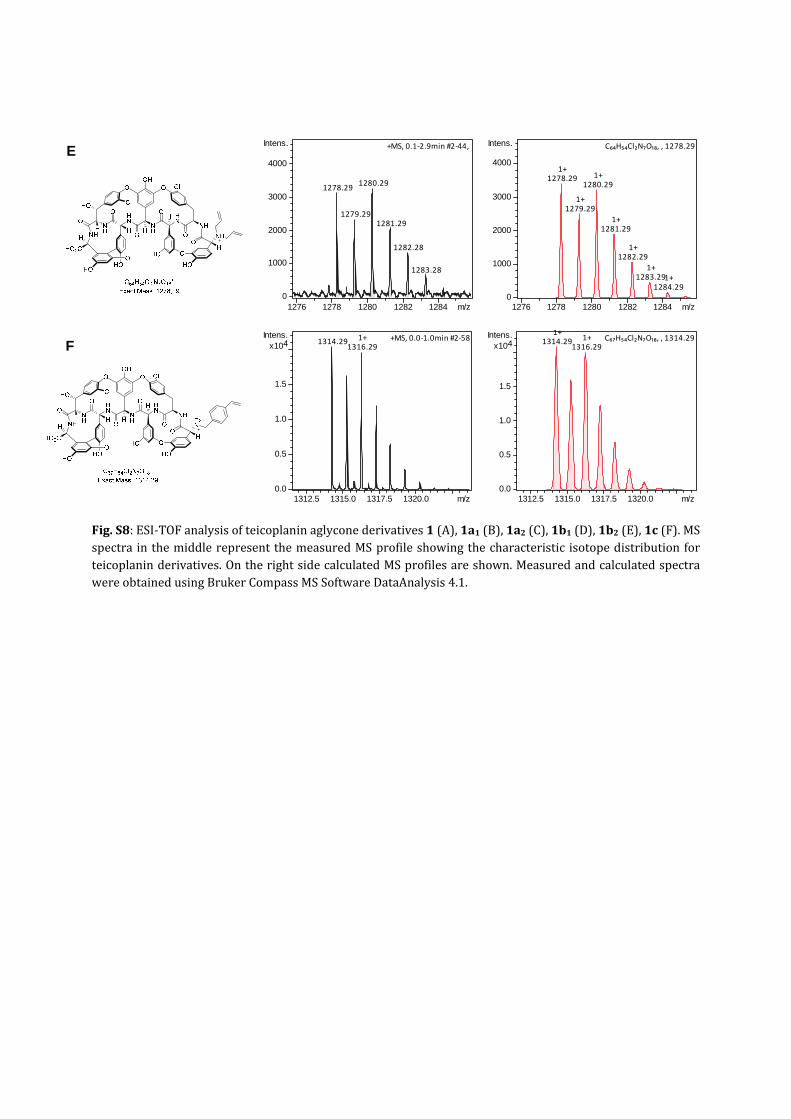
Fig.S8:ESI‐TOFanalysisofteicoplaninaglyconederivatives1(A),1a1(B),1a2(C),1b1(D),1b2(E),1c(F).MSspectra inthemiddlerepresentthemeasuredMSprofileshowingthecharacteristic isotopedistributionforteicoplaninderivatives.OntherightsidecalculatedMSprofilesareshown.MeasuredandcalculatedspectrawereobtainedusingBrukerCompassMSSoftwareDataAnalysis4.1.
1278.29
1279.29
1280.29
1281.29
1282.28
1283.28
+MS, 0.1‐2.9min #2‐44,
0
1000
2000
3000
4000
Intens.
1276 1278 1280 1282 1284 m/z
1278.291+
1279.291+
1280.291+
1281.291+
1282.291+
1283.291+
1284.291+
C₆₄H₅₄Cl₂N₇O₁₈, , 1278.29
0
1000
2000
3000
4000
Intens.
1276 1278 1280 1282 1284 m/z
1314.291316.29
1+ +MS, 0.0‐1.0min #2‐58
0.0
0.5
1.0
1.5
4x10Intens.
1312.5 1315.0 1317.5 1320.0 m/z
1314.291+
1316.291+ C₆₇H₅₄Cl₂N₇O₁₈, , 1314.29
0.0
0.5
1.0
1.5
4x10Intens.
1312.5 1315.0 1317.5 1320.0 m/z
E
F
Page 18
NH
HN
NH
HN
NH
O
O
O
O
O O Cl
ClHO
H
H
O
HNH
O
HOOH
HO2C
H
HO
H
OH
HO
HO OH
NH
HN
NH
HN
NH
O
O
O
O
O O Cl
ClHO
H
H
O
HNH
O
HOOH
HO2C
H
HO
H
O
HO O
H
NH
HN
NH
HN
NH
O
O
O
O
O O Cl
ClHO
H
H
O
HNH
O
HOOH
H
HO
H
OH
HO
HO OH
NH3
NH
HN
NH
HN
NH
O
O
O
O
O O Cl
ClHO
H
H
O
HNH
O
HOOH
H
HO
H
OH
HO
HO OH
NH2
H2O
NH
HN
NH
HN
NH
O
O
O
O
O O Cl
ClHO
H
H
O
HNH
O
HOOH
H
HO
H
HO
HO OH
NH2
NH
HN
NH
HN
NH
O
O
O
O
O O Cl
ClHO
H
H
O
HNH
O
HOOH
H
HO
H
OH
HO
HO OH
NH
+ H2O
NH
HN
NH
HN
NH
O
O
O
O
O O Cl
ClHO
H
H
O
HNH
O
HOOH
H
HO
H
OH
HO
HO OH
HN
HO2C
NH
HN
NH
HN
NH
O
O
O
O
O O Cl
ClHO
H
H
O
HNH
O
HOOH
HO2C
H
HO
H
OH
HO
HO OH
NH
NH
HN
NH
HN
NH
O
O
O
O
O O Cl
ClHO
H
H
O
HNH
O
HOOH
H
HO
H
OH
HO
HO OH
NH2
NH
HN
NH
HN
NH
O
O
O
O
O O Cl
ClHO
H
H
O
HNH
O
HOOH
H
HO
H
OH
HO
HO OH
NH
NH
HN
NH
HN
NH
O
O
O
O
O O Cl
ClHO
H
H
O
HNH
O
HOOH
HO2C
H
HO
H
OH
HO
HO OH
HN
C58H41Cl2N6O17+
Exact Mass: 1163,19
C58H43Cl2N6O18+
Exact Mass: 1181,20
C57H46Cl2N7O172+
Exact Mass: 1170,23
C57H45Cl2N7O16•+
Exact Mass: 1153,23
C57H43Cl2N7O15•+
Exact Mass: 1135,22
C60H50Cl2N7O17+
Exact Mass: 1210,26
C62H52Cl2N7O18+
Exact Mass: 1252,27
C60H47Cl2N7O18•+
Exact Mass: 1223,23
C65H50Cl2N7O18+
Exact Mass: 1286,26
C66H53Cl2N7O16•+
Exact Mass: 1269,29
C64H49Cl2N7O16•+
Exact Mass: 1241,26
m/z: 1286.28
m/z: 1269.25
m/z: 1252.26
m/z: 1241.25
m/z: 1223.20
m/z: 1210.25
m/z: 1181.20
m/z: 1170.24
m/z: 1163.20
m/z: 1153.23
m/z: 1135.23
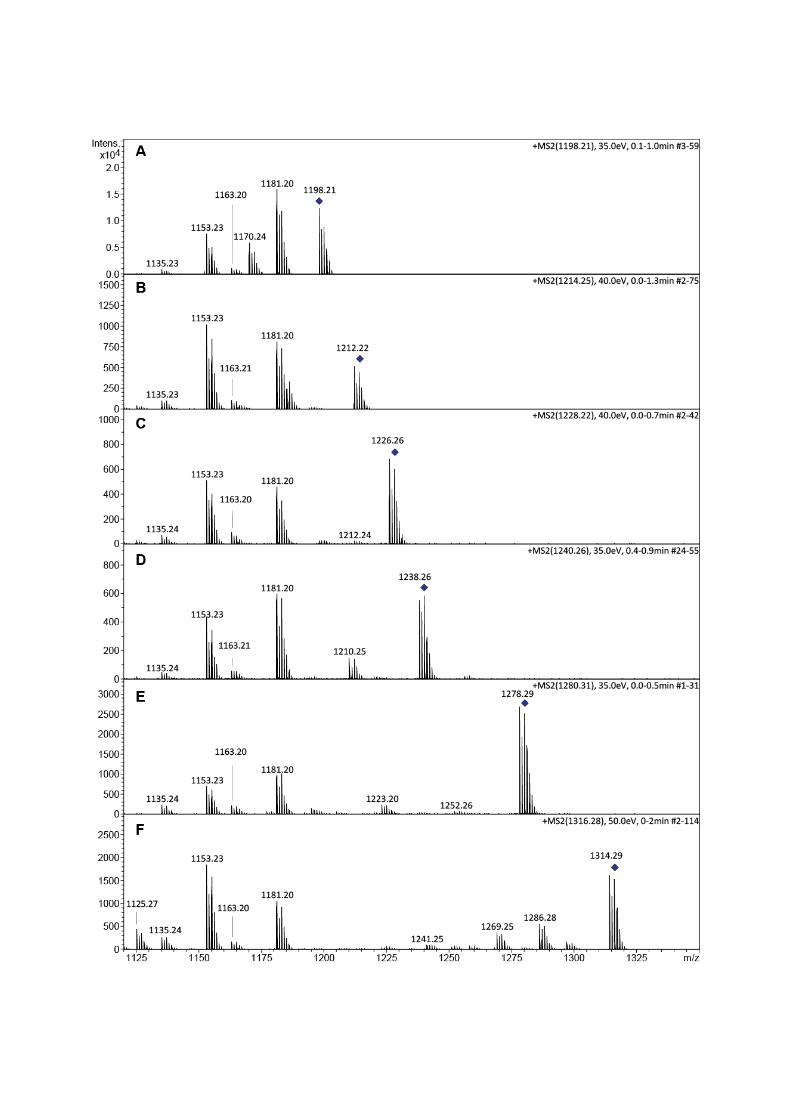
Fig.S9:ESI‐MS/MSanalysisofteicoplaninaglyconederivatives1(A),1a1(B),1a2(C),1b1(D),1b2(E),1c(F).Datawereobtained inpositivemode.G)Proposed structures for characteristic fragments observedduringtandemmassspectrometry.
G
Page 19
FigS10:ESI‐TOFanalysisoflabeledteicoplaninaglyconederivatives8(A)and9(B).Left:measuredspectrashowing the characteristic isotope distribution for teicoplanin derivatives; on the right side calculatedMSprofiles are shown. Measured and calculated spectra were obtained using Bruker Compass MS SoftwareDataAnalysis4.1.
949.262+
949.762+
950.262+
950.762+
951.262+
951.762+
952.26
+MS, 0.0‐1.0min #1‐58
0.0
0.5
1.0
1.5
2.05x10
Intens.
949 950 951 952 m/z
949.262+ 949.76
2+950.262+
950.762+
951.262+
951.762+
952.262+
C₁₀₂H₈₄Cl₂N₁₂O₂₂, , 949.2595
0.0
0.5
1.0
1.5
5x10Intens.
949 950 951 952 m/z
972.792+973.29
2+
973.792+
974.292+
974.792+
975.292+
975.792+
+MS, 0.1‐0.6min #3‐33
0.0
0.2
0.4
0.6
0.8
4x10Intens.
973 974 975 976 m/z
972.792+973.29
2+973.792+
974.292+
974.792+
975.292+
975.792+
C₉₇H₉₇Cl₂N₁₃O₂₅S, , 972.7903
0.0
0.2
0.4
0.6
0.8
4x10Intens.
973 974 975 976 m/z
A
B
Page 20
NH
HN
NH
HN
NH
O
O
O
O
O O Cl
ClHO
H
H
O
HNH
O
OHOH
H
HO
H
OH
HOHO O
H
HN
NN
NHO
O NHN
C101H82Cl2N12O202+
Exact Mass: 1852,51
O
O
H3N
NN
NHO
O NN
O
O
C44H41N6O4+
Exact Mass: 717,32
NH
HN
NH
HN
NH
O
O
O
O
O O Cl
ClHO
H
H
O
HNH
O
OHOH
H
HO
H
HOHO O
H
H2N
O
HO
NN
NHO
O NH3N
O
O
C100H80Cl2N12O222+
Exact Mass: 1870,49
NH
HN
NH
HN
NH
O
O
O
O
O O Cl
ClHO
H
H
O
HNH
O
OHOH
H
HO
H
HOHO O
H
H2N
O
NN
NHO
O NN
O
O
C102H82Cl2N12O212+
Exact Mass: 1880,51
OH
OH
m/z = 926,26
m/z = 935,25
m/z = 940,26
m/z = 717,32
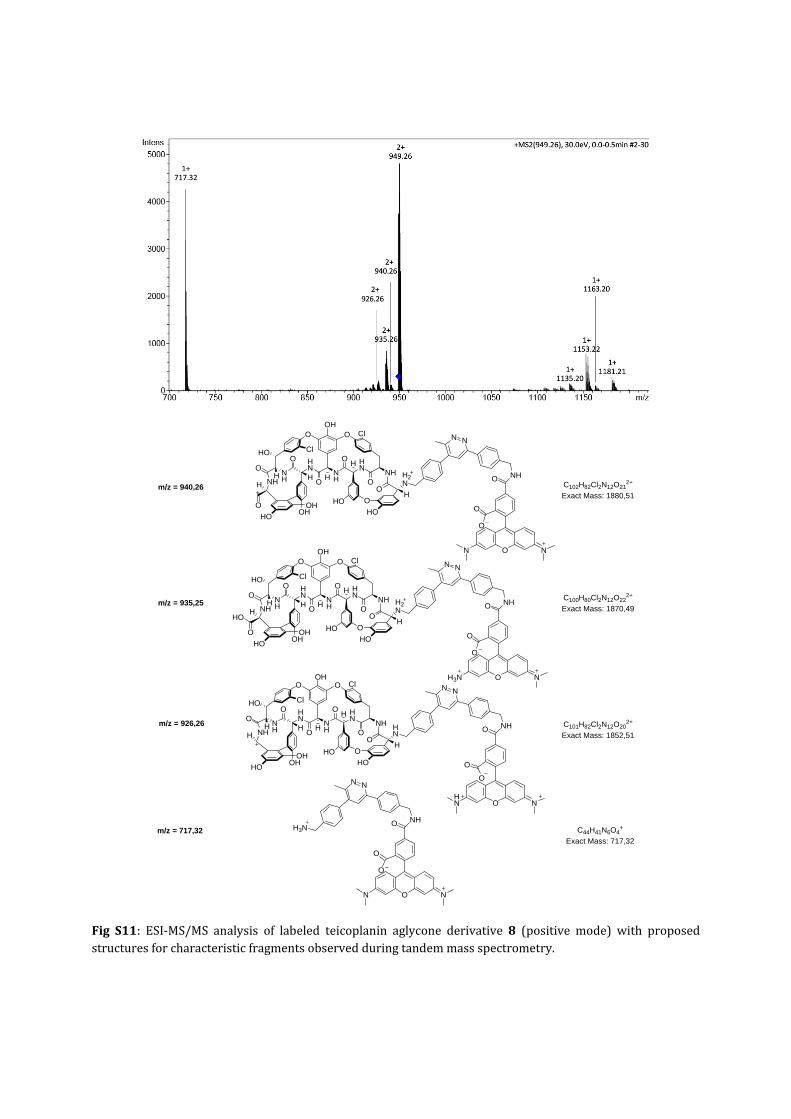
Fig S11: ESI‐MS/MS analysis of labeled teicoplanin aglycone derivative 8 (positive mode) with proposedstructuresforcharacteristicfragmentsobservedduringtandemmassspectrometry.
Page 21
Fig S12: ESI‐MS/MS analysis of labeled teicoplanin aglycone derivative 9 (positive mode) with proposedstructuresforcharacteristicfragmentsobservedduringtandemmassspectrometry.
Page 22
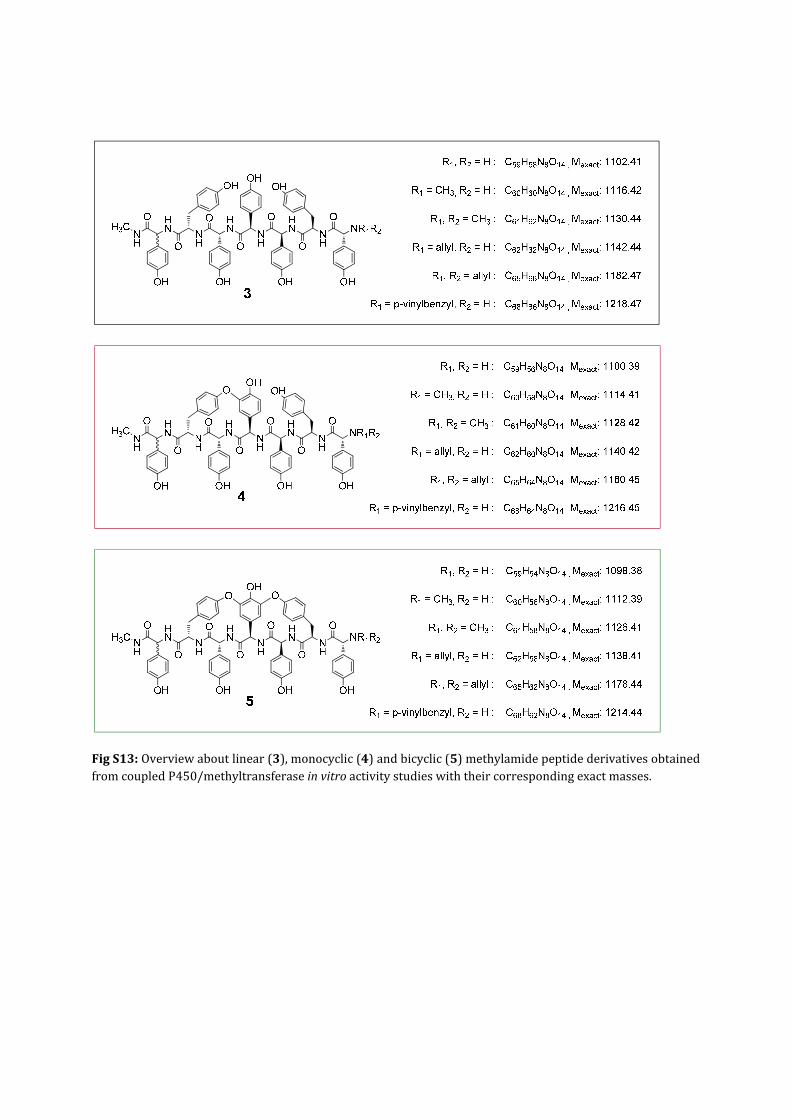
FigS13:Overviewaboutlinear(3),monocyclic(4)andbicyclic(5)methylamidepeptidederivativesobtainedfromcoupledP450/methyltransferaseinvitroactivitystudieswiththeircorrespondingexactmasses.
Page 23
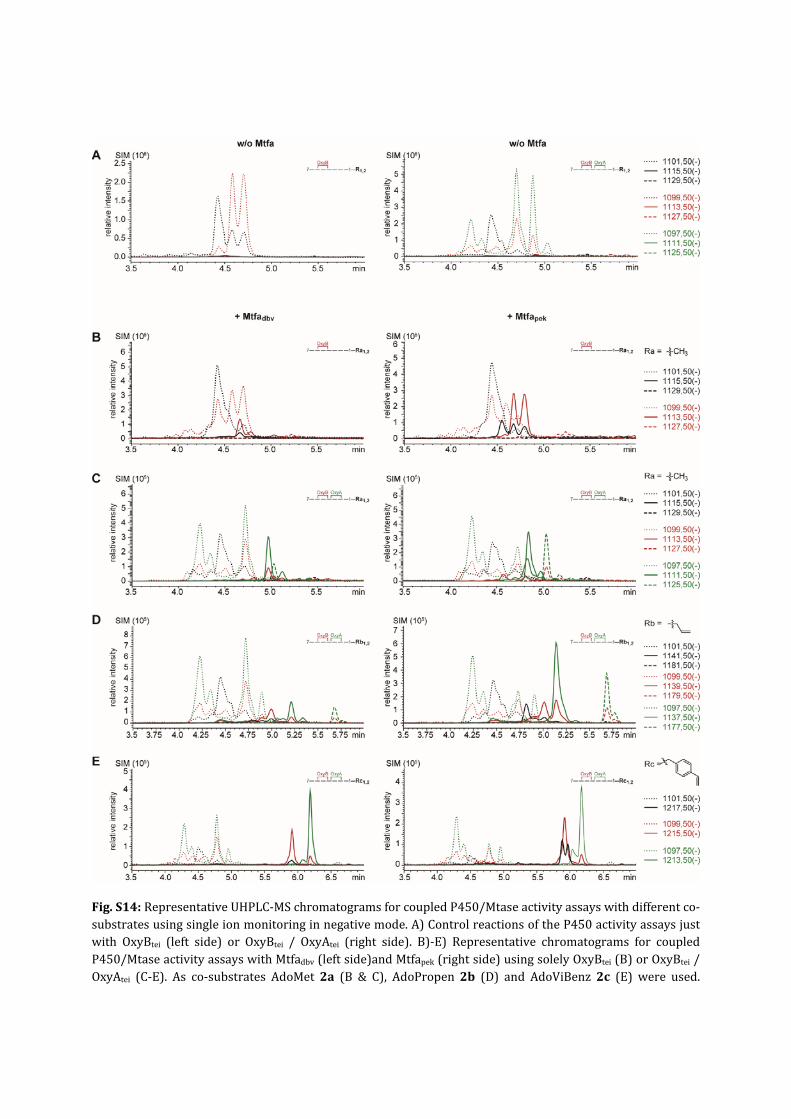
Fig.S14:RepresentativeUHPLC‐MSchromatogramsforcoupledP450/Mtaseactivityassayswithdifferentco‐substratesusingsingleionmonitoringinnegativemode.A)ControlreactionsoftheP450activityassaysjustwith OxyBtei (left side) or OxyBtei / OxyAtei (right side). B)‐E) Representative chromatograms for coupledP450/MtaseactivityassayswithMtfadbv(leftside)andMtfapek(rightside)usingsolelyOxyBtei(B)orOxyBtei/OxyAtei (C‐E). As co‐substrates AdoMet 2a (B & C), AdoPropen 2b (D) and AdoViBenz 2c (E) were used.
Page 24
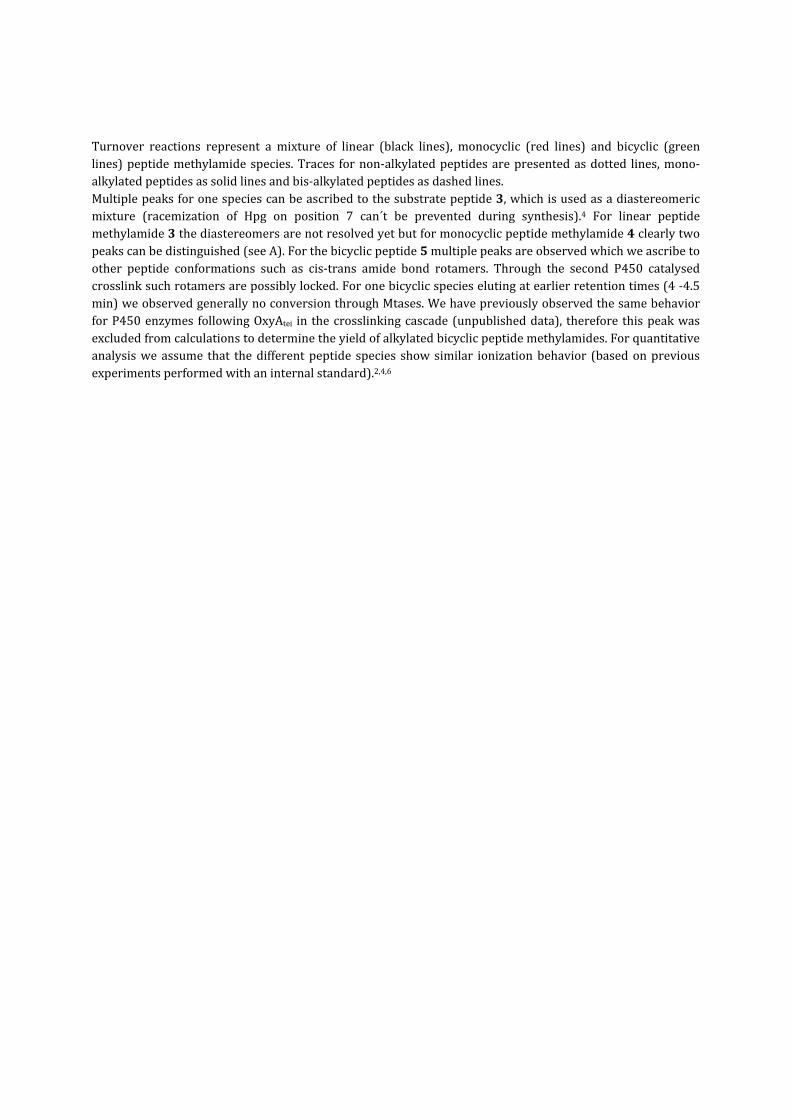
Turnover reactions represent a mixture of linear (black lines), monocyclic (red lines) and bicyclic (greenlines)peptidemethylamidespecies.Traces fornon‐alkylatedpeptidesarepresentedasdotted lines,mono‐alkylatedpeptidesassolidlinesandbis‐alkylatedpeptidesasdashedlines.Multiplepeaksforonespeciescanbeascribedtothesubstratepeptide3,whichisusedasadiastereomericmixture (racemization of Hpg on position 7 can´t be prevented during synthesis).4 For linear peptidemethylamide3thediastereomersarenotresolvedyetbutformonocyclicpeptidemethylamide4clearlytwopeakscanbedistinguished(seeA).Forthebicyclicpeptide5multiplepeaksareobservedwhichweascribetoother peptide conformations such as cis‐trans amide bond rotamers. Through the second P450 catalysedcrosslinksuchrotamersarepossiblylocked.Foronebicyclicspecieselutingatearlierretentiontimes(4‐4.5min)weobservedgenerallynoconversionthroughMtases.WehavepreviouslyobservedthesamebehaviorforP450enzymes followingOxyAtei in thecrosslinkingcascade(unpublisheddata), thereforethispeakwasexcludedfromcalculationstodeterminetheyieldofalkylatedbicyclicpeptidemethylamides.Forquantitativeanalysiswe assume that thedifferentpeptide species showsimilar ionizationbehavior (basedonpreviousexperimentsperformedwithaninternalstandard).2,4,6
Page 26
NH
HN
NH
HN
NH
O
O
O
O
O
O
O
OH
O
HN
O
OH
NH
OH OH
H2N
C68H62N8O13•+
Exact Mass: 1198,44
NH
HN
NH
HN
NH
O
O
O
O
O
O
OOH
OH
O
HN
O
OH OH OH
NH C64H59N7O14•+
Exact Mass: 1149,41
NH
HN
NH
HN
NH
O
O
O
O
O
O
OOH
OH
O
HN
O
OH
H2N
OH OH
NH C64H61N8O14+
Exact Mass: 1165,43
NH
HN
NH
HN
NH
O
O
O
O
O
O
OOH
OH
O
HN
O
OH
NH
OH OH
C59H52N7O14+
Exact Mass: 1082,36
NH
HN
NH
HN
NH
O
O
O
O
O
O
O
OH
O
HN
O
OH
NH
OH OH
C59H51N7O13•+
Exact Mass: 1065,35
NH
HN
NH
HN
NH
O
O
O
O
OO
OOH
OH
O
N
O
HO
OH OH
C58H47N6O14+
Exact Mass: 1051,31
NH
HN
NH
HN
NH
O
O
O
O
O
O
O
OH
O
N
OH OH OH
H2N C58H51N7O12
•+
Exact Mass: 1037,36
NH
HN
NH
HN
NH
O
O
O
O
O
O
OOH
OH
O
N
OH OH OH
C57H47N6O13+
Exact Mass: 1023,32
NH
HN
NH
HN
NH
O
O
O
O
O
OOH
OH
O
HN
O
OH
NH2
OH
C51H47N7O12•+
Exact Mass: 949,33
HN
NH
HN
NH
O
O
O
O
O
OOH
OH
O
HN
O
OH
NH
OH
C51H45N6O12+
Exact Mass: 933,31
NH
HN
NH
HN
NH
O
O
O
O
O
O
OOH
OH
O
H2N
OH OH
C50H43N6O12+
Exact Mass: 919,29
NH
HN
NH
HNN
O
O
O
OOO
OOH
OH
O
OH OH
C50H40N5O12+
Exact Mass: 902,27
NH
HN
NH
HNN
O
O
O
OOO
O
OH
O
OH OH
C50H39N5O11•+
Exact Mass: 885,26
HN
NH
HN
NH
O
O
O
O
O
OOH
OH
O
N
OH OH
C49H40N5O11+
Exact Mass: 874,27
NH
HN
NH
HN
N
O
O
O
O
O
OOH
OH
O
OH OH
C49H40N5O11+
Exact Mass: 874,27
NH
HN
NH
HN
N
O
O
O
O
O
O
OH
O
OH OH
C49H39N5O10•+
Exact Mass: 857,27
m/z: 1198.42
m/z: 1165.34
m/z: 1149.36
m/z: 1082.36
m/z: 1065.33
m/z: 1051.31
m/z: 1037.33
m/z: 1023.32
m/z: 949.31
m/z: 933.31
m/z: 919.29
m/z: 902.27
m/z: 885.25
m/z: 874.27
m/z: 874.27
m/z: 857.25
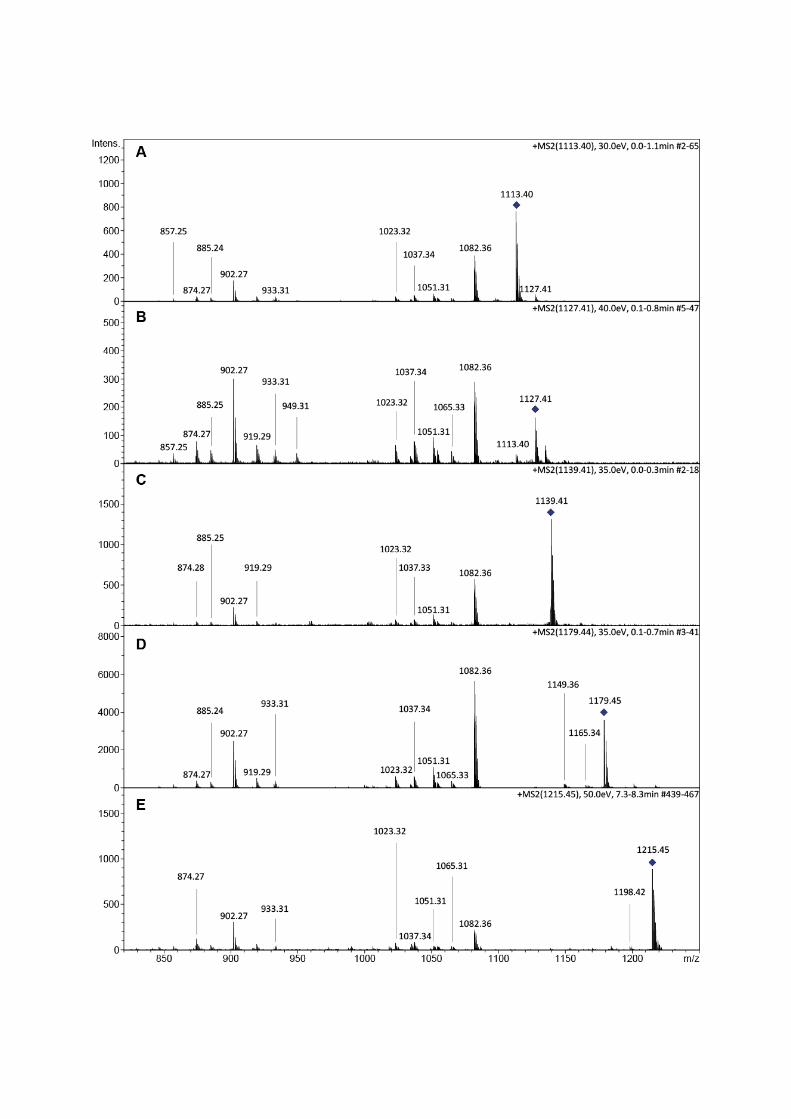
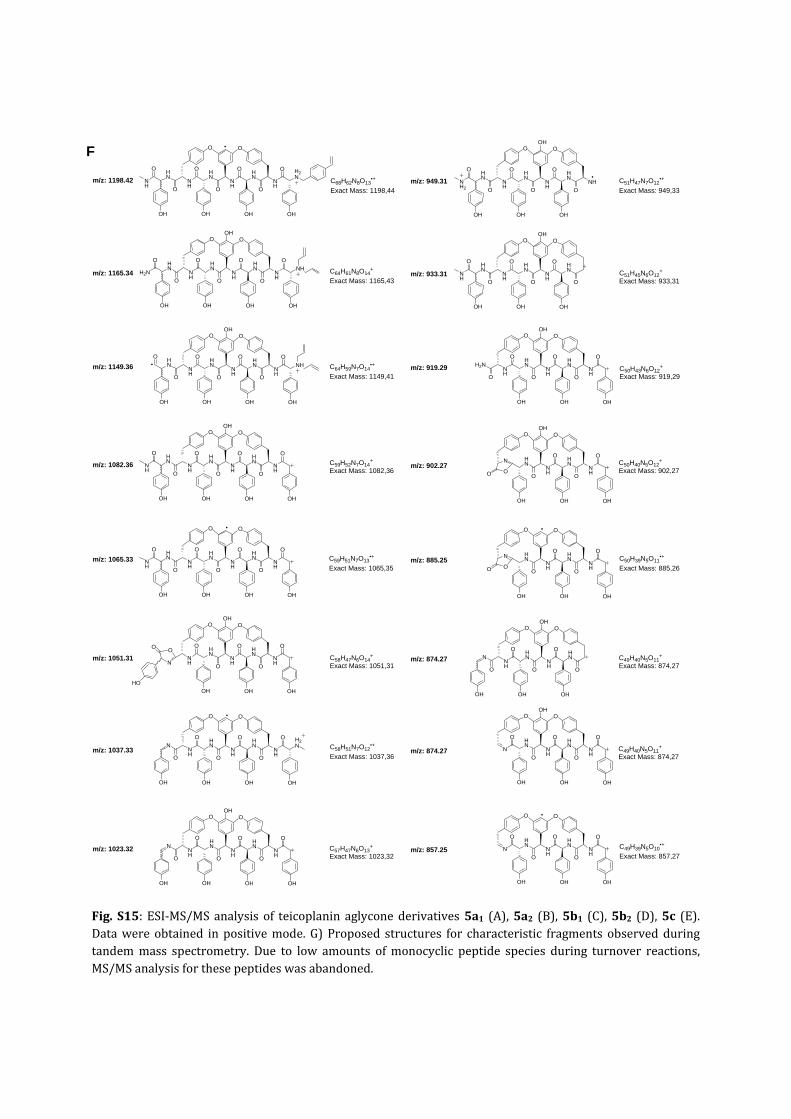
Fig.S15: ESI‐MS/MSanalysis of teicoplanin aglyconederivatives5a1 (A),5a2 (B),5b1 (C),5b2 (D),5c (E).Datawereobtained inpositivemode.G)Proposed structures for characteristic fragments observedduringtandemmass spectrometry. Due to low amounts ofmonocyclic peptide species during turnover reactions,MS/MSanalysisforthesepeptideswasabandoned.
F
Page 27
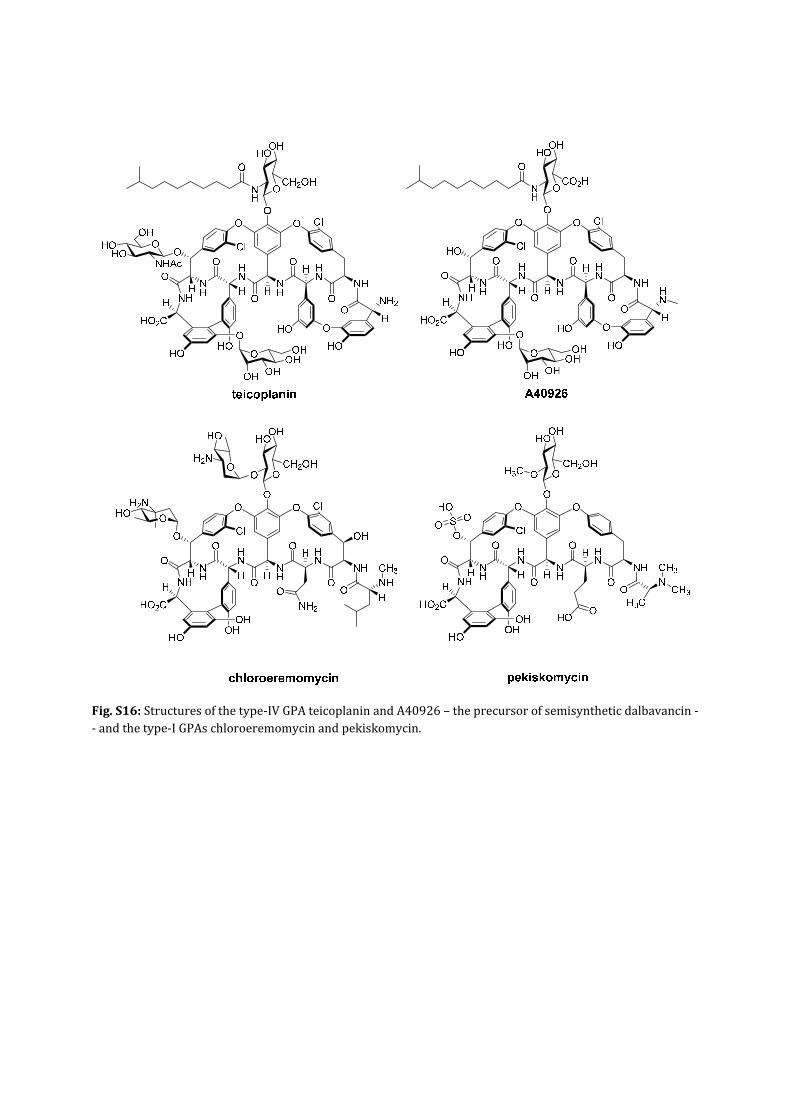
Fig.S16:Structuresofthetype‐IVGPAteicoplaninandA40926–theprecursorofsemisyntheticdalbavancin‐‐andthetype‐IGPAschloroeremomycinandpekiskomycin.
Page 28
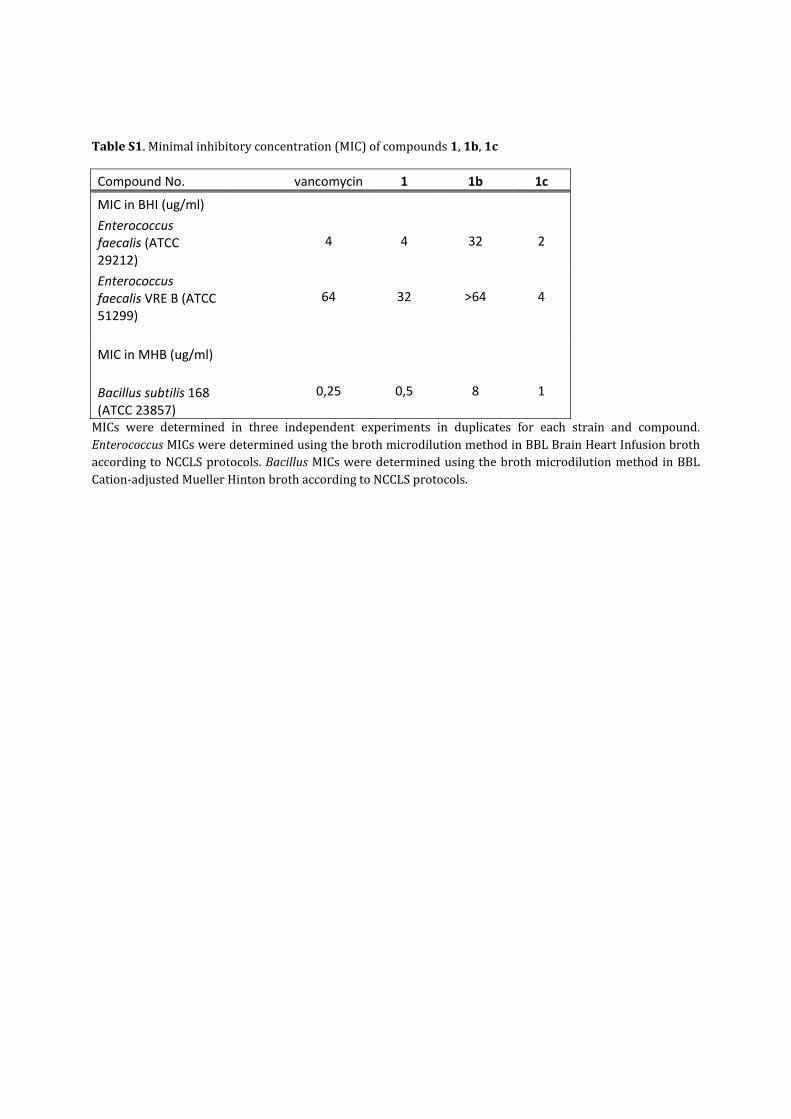
TableS1.Minimalinhibitoryconcentration(MIC)ofcompounds1,1b,1c
Compound No. vancomycin 1 1b 1c
MIC in BHI (ug/ml)
Enterococcus faecalis (ATCC 29212)
4 4 32 2
Enterococcus faecalis VRE B (ATCC 51299)
64 32 >64 4
MIC in MHB (ug/ml)
Bacillus subtilis 168 (ATCC 23857)
0,25 0,5 8 1
MICs were determined in three independent experiments in duplicates for each strain and compound.EnterococcusMICsweredeterminedusingthebrothmicrodilutionmethodinBBLBrainHeartInfusionbrothaccordingtoNCCLSprotocols.BacillusMICsweredeterminedusingthebrothmicrodilutionmethodinBBLCation‐adjustedMuellerHintonbrothaccordingtoNCCLSprotocols.
Page 29
Fig.S17:1H‐NMRofteicoplaninaglycone1
1HNMR(500MHz,1H‐1H‐COESY,1H‐1H‐ROESY,DMSO‐d6)δ=9.70(s,1H,OH),9.56(s,1H,OH),9.51(s,1H,OH),9.39(s,1H,OH),9.17(s,1H,OH),8.85(s,1H,OH),8.46(d,J=5.2Hz,1H,Hpg5‐NH),8.41(d,J=6.0Hz,1H,Dpg7‐NH),8.16(s,1H),7.78(d,J=1.9Hz,1H,Tyr6‐Har),7.71–7.67(m,2H,Hpg4‐NH,Har),7.60(d,J=8.4Hz,1H,Dpg3‐NH),7.55(m,1H,Tyr2‐NH),7.44(dd,J=8.3,2.0Hz,1H,Har),7.25(d,J=3.2Hz,1H,Har),7.24(d,J=3.3Hz,1H,Har),7.22(d,J=1.9Hz,1H,Har),7.14–7.07(m,2H,Har),6.94(d,J=8.3Hz,1H,Har),6.73(d,J=11.8Hz,1H,Tyr6‐NH),6.71–6.57(m,4H,Har),6.38(m,2H,Har),6.34–6.31(m,2H,Har),6.24(d,J=2.3Hz,1H,Har),5.89(d,J=6.6Hz,1H,β‐OH),5.66(d,J=8.2Hz,1H,Dpg3‐Hα),5.50(d,J=2.1Hz,1H,Hpg4‐Har),5.33(d,J=10.4Hz,1H,Hpg4‐Hα),5.13–5.05(m,2H,Tyr6‐Hβ,Hpg4‐Har),4.97(m,1H,Tyr2‐Hα),4.77(bs,1H,Hpg1‐Hα),4.40(d,J=5.8Hz,1H,Dpg7‐Hα),4.33(d,J=5.5Hz,1H,Hpg5‐Hα),4.12(d,J=11.8Hz,1H,Tyr6‐Hα),3.35(m,underwatersignal,1H,Tyr2‐Hβ1),2.84(m,1H,Tyr2‐Hβ2)ppm.
Page 30
Fig.S18:1H‐NMRofteicoplaninaglyconederivative1b
1HNMR(500MHz,1H‐1H‐COESY,DMSO‐d6)δ9.69(d,J=5.1Hz,1H,OH),9.56(s,1H,OH),9.42–9.37(m,2H,OH),9.17(s,1H,OH),8.87(s,1H,OH),8.44(m,2H,Hpg5‐NH,Dpg7‐NH),8.13(s,1H),7.78(d,J=1.9Hz,1H,Tyr6‐Har),7.70–7.61(m,3H,Hpg4‐NH,Dpg3‐NH,Har),7.55(m,1H,Tyr2‐NH),7.45(dd,J=8.4,2.0Hz,1H,Har),7.25–7.15(m,3H,Har),7.12–7.06(m,2H,Har),6.95(m,1H,Har),6.91–6.85(m,1H),6.77–6.61(m,3H,Har,Tyr6‐NH),6.50–6.43(m,1H),6.41–6.34(m,3H,Har),6.27–6.21(1H),5.93–5.84(m,2H,allyl‐H),5.67–5.62(m,1H,Dpg3‐Hα),5.47(m,1H,Hpg4‐Har),5.39–5.20(m,4H,Hpg4‐Hα,allyl‐H),5.13‐5.04(m,2H,Tyr6‐Hβ,Hpg4‐Har),4.91(m,1H,Tyr2‐Hα),4.41(m,1H,Dpg7‐Hα),4.32(d,J=5.5Hz,1H,Hpg5‐Hα),4.10(d,J=11.4Hz,1H,Tyr6‐Hα),3.35(m,underwatersignal,1H,Tyr2‐Hβ1),2.87(m,1H,Tyr2‐Hβ2)ppm.
Page 31
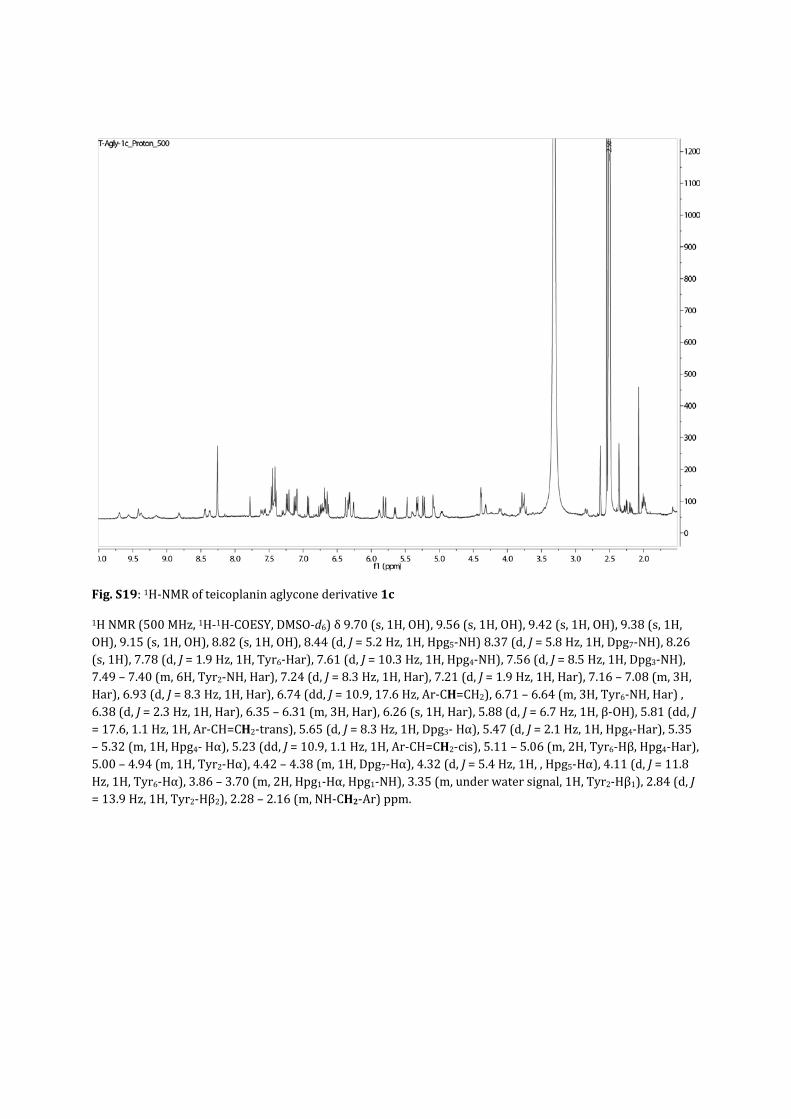
Fig.S19:1H‐NMRofteicoplaninaglyconederivative1c
1HNMR(500MHz,1H‐1H‐COESY,DMSO‐d6)δ9.70(s,1H,OH),9.56(s,1H,OH),9.42(s,1H,OH),9.38(s,1H,OH),9.15(s,1H,OH),8.82(s,1H,OH),8.44(d,J=5.2Hz,1H,Hpg5‐NH)8.37(d,J=5.8Hz,1H,Dpg7‐NH),8.26(s,1H),7.78(d,J=1.9Hz,1H,Tyr6‐Har),7.61(d,J=10.3Hz,1H,Hpg4‐NH),7.56(d,J=8.5Hz,1H,Dpg3‐NH),7.49–7.40(m,6H,Tyr2‐NH,Har),7.24(d,J=8.3Hz,1H,Har),7.21(d,J=1.9Hz,1H,Har),7.16–7.08(m,3H,Har),6.93(d,J=8.3Hz,1H,Har),6.74(dd,J=10.9,17.6Hz,Ar‐CH=CH2),6.71–6.64(m,3H,Tyr6‐NH,Har),6.38(d,J=2.3Hz,1H,Har),6.35–6.31(m,3H,Har),6.26(s,1H,Har),5.88(d,J=6.7Hz,1H,β‐OH),5.81(dd,J=17.6,1.1Hz,1H,Ar‐CH=CH2‐trans),5.65(d,J=8.3Hz,1H,Dpg3‐Hα),5.47(d,J=2.1Hz,1H,Hpg4‐Har),5.35–5.32(m,1H,Hpg4‐Hα),5.23(dd,J=10.9,1.1Hz,1H,Ar‐CH=CH2‐cis),5.11–5.06(m,2H,Tyr6‐Hβ,Hpg4‐Har),5.00–4.94(m,1H,Tyr2‐Hα),4.42–4.38(m,1H,Dpg7‐Hα),4.32(d,J=5.4Hz,1H,,Hpg5‐Hα),4.11(d,J=11.8Hz,1H,Tyr6‐Hα),3.86–3.70(m,2H,Hpg1‐Hα,Hpg1‐NH),3.35(m,underwatersignal,1H,Tyr2‐Hβ1),2.84(d,J=13.9Hz,1H,Tyr2‐Hβ2),2.28–2.16(m,NH‐CH2‐Ar)ppm.
Page 32
References
1 C.BriekeandM.J.Cryle,Org.Lett.,2014,16,2454–2457.2 C.Brieke,V.Kratzig,K.Haslinger,A.WinklerandM.J.Cryle,Org.Biomol.Chem.,2015,13,2012–2021.3 K.Haslinger,E.Maximowitsch,C.Brieke,A.KochandM.J.Cryle,ChemBioChem,2014,15,2719–2728.4 C.Brieke,M.Peschke,K.HaslingerandM.J.Cryle,Angew.Chem.Int.Ed.,2015,54,15715–15719.5 J.Bogomolovas,B.Simon,M.SattlerandG.Stier,ProteinExpr.Purif.,2009,64,16–23.6 K.Haslinger,M.Peschke,C.Brieke,E.MaximowitschandM.J.Cryle,Nature,2015,521,105–109.7 S.G.Bell,A.B.H.Tan,E.O.D.JohnsonandL.‐L.Wong,Mol.Biosyst.,2010,6,206–214.8 F.Sievers,A.Wilm,D.Dineen,T.J.Gibson,K.Karplus,W.Li,R.Lopez,H.McWilliam,M.Remmert,J.Soding,
J.D.ThompsonandD.G.Higgins,Mol.Syst.Biol.,2014,7,539–539.9 H.Shimamura,S.P.Breazzano,J.Garfunkle,F.S.Kimball,J.D.TrzupekandD.L.Boger,J.Am.Chem.Soc.,
2010,132,7776–7783.10C.Dalhoff,G.Lukinavičius,S.KlimašauskasandE.Weinhold,Nat.Protoc.,2006,1,1879–1886.11B.J.C.Law,A.‐W.Struck,M.R.Bennett,B.WilkinsonandJ.Micklefield,Chem.Sci.,2015,6,2885–2892.12M.Sunbul,N.J.Marshall,Y.Zou,K.ZhangandJ.Yin,J.Mol.Biol.,2009,387,883–898.


![0DWHULDO (6, IRU&KHP&RPP 7KLV Organoruthenium Catalysts ... · Formic acid catalyzed by ruthenium catalyst Figure S8. [(p-cymene)Ru(NH3)]Cl2 catalytic activity of different concentrations](https://static.documents.pub/doc/80x56/5f52044563954a6e4212b854/0dwhuldo-6-irukhprpp-7klv-organoruthenium-catalysts-formic-acid.jpg)
