50
1 Slide Descriptive Statistics: Numerical Measures Location and Variability Chapter 3 BA 201
| Date post: | 31-Dec-2015 |
| Category: |
Documents |
| Upload: | lindsay-barton |
| View: | 217 times |
| Download: | 0 times |
1 1 Slide Slide
Descriptive Statistics: Numerical Measures
Location and Variability
Chapter 3BA 201
2 2 Slide Slide
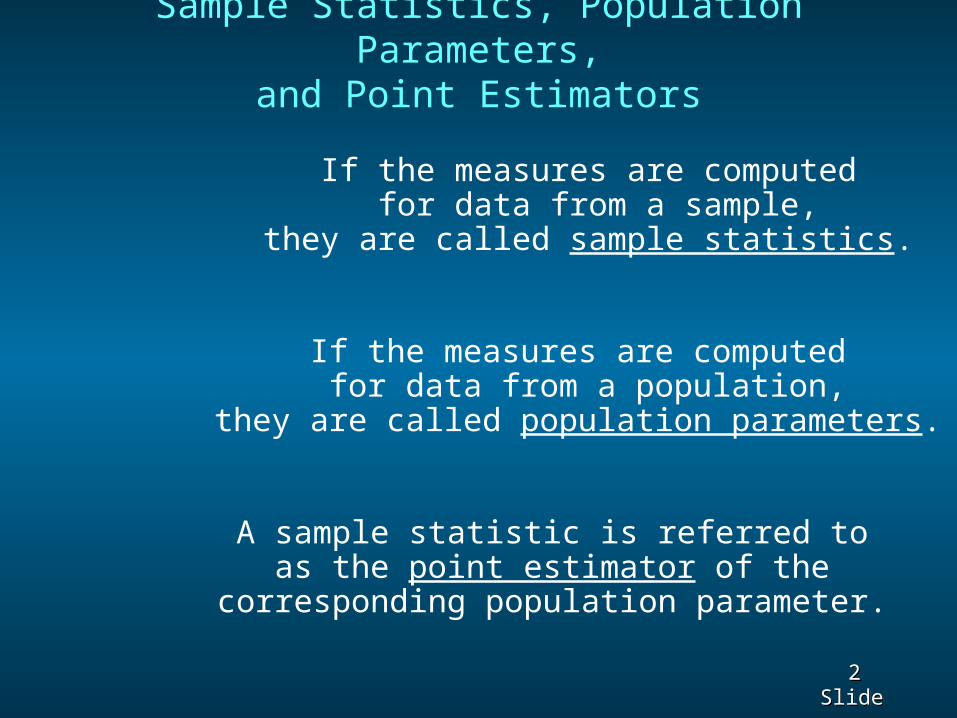
Sample Statistics, Population Parameters,and Point Estimators
If the measures are computed for data from a sample,
they are called sample statistics.
If the measures are computed for data from a population,
they are called population parameters.
A sample statistic is referred toas the point estimator of the
corresponding population parameter.

3 3 Slide Slide
LOCATION
4 4 Slide Slide
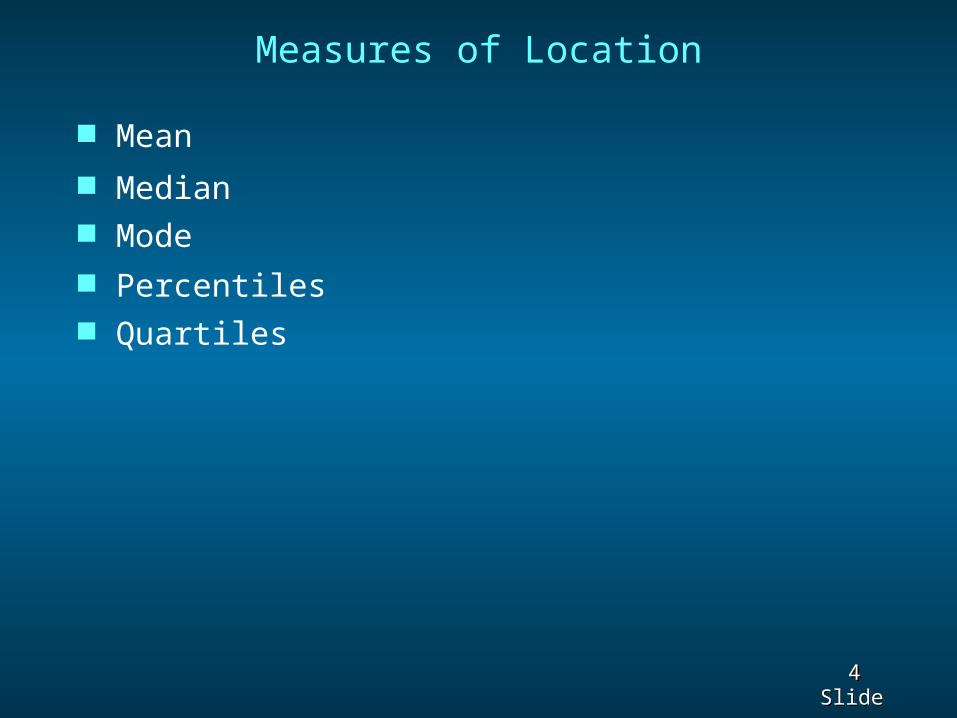
Measures of Location
Mean Median Mode Percentiles Quartiles

5 5 Slide Slide
Mean
The mean of a data set is the average of all the data values.
x The sample mean is the point estimator of the population mean m.
The mean provides a measure of central location.

6 6 Slide Slide
Mean
ixx
n ix
N
Sample Population
7 7 Slide Slide
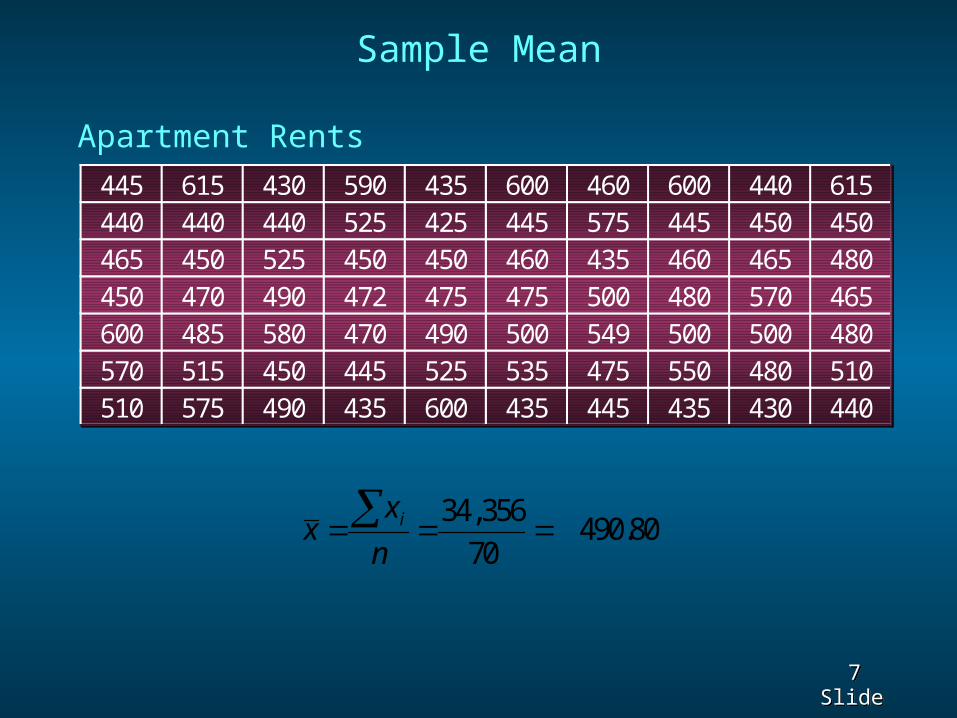
Sample Mean
Apartment Rents445 615 430 590 435 600 460 600 440 615440 440 440 525 425 445 575 445 450 450465 450 525 450 450 460 435 460 465 480450 470 490 472 475 475 500 480 570 465600 485 580 470 490 500 549 500 500 480570 515 450 445 525 535 475 550 480 510510 575 490 435 600 435 445 435 430 440
34,356 490.80
70ix
xn
8 8 Slide Slide
Trimmed Mean
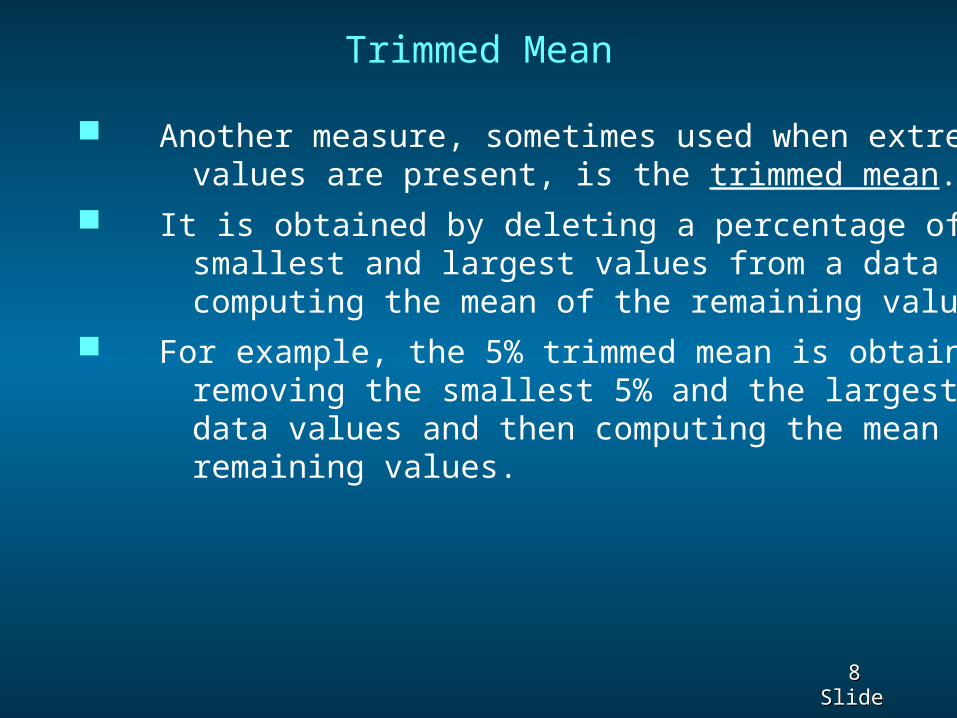
It is obtained by deleting a percentage of the smallest and largest values from a data set and then computing the mean of the remaining values. For example, the 5% trimmed mean is obtained by removing the smallest 5% and the largest 5% of the data values and then computing the mean of the remaining values.
Another measure, sometimes used when extreme values are present, is the trimmed mean.
9 9 Slide Slide
Median
Whenever a data set has extreme values, the median is the preferred measure of central location.
The median of a data set is the value in the middle when the data items are arranged in ascending order.
10 10 Slide Slide
Median
12 14 19 26 2718 27
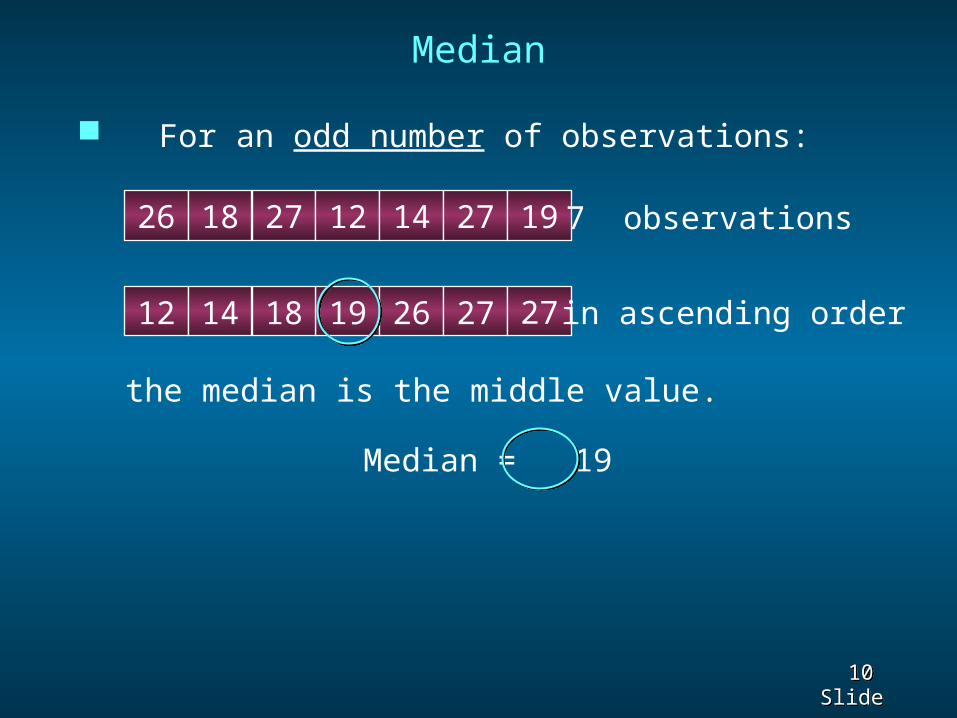
For an odd number of observations:
in ascending order
26 18 27 12 14 27 19 7 observations
the median is the middle value.
Median = 19
11 11 Slide Slide
12 14 19 26 2718 27
Median
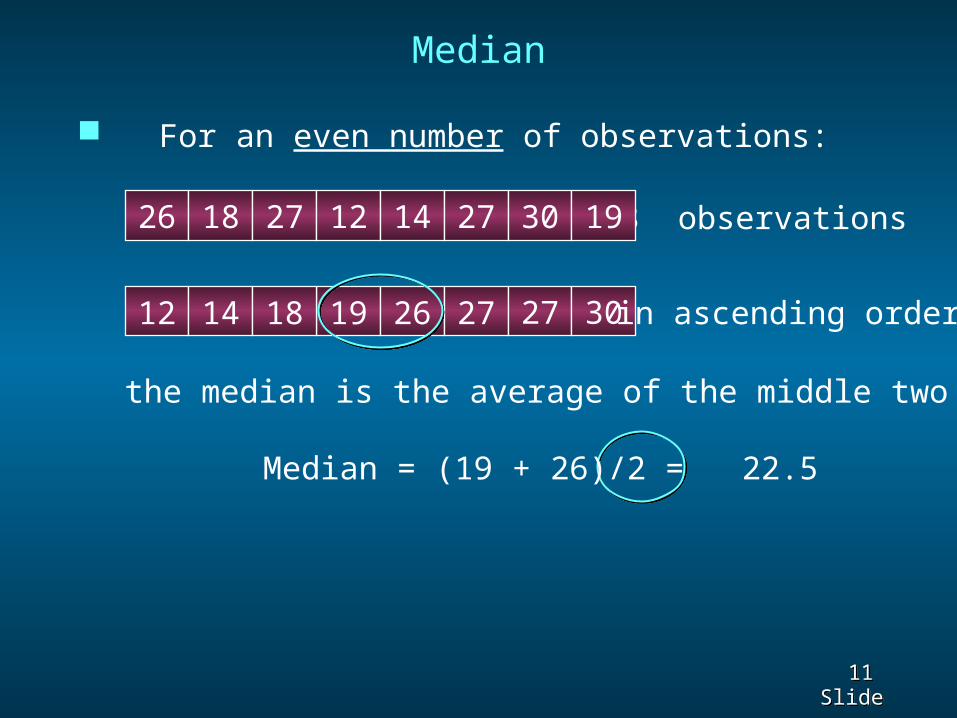
For an even number of observations:
in ascending order
26 18 27 12 14 27 30 8 observations
the median is the average of the middle two values.
Median = (19 + 26)/2 = 22.5
19
30
12 12 Slide Slide
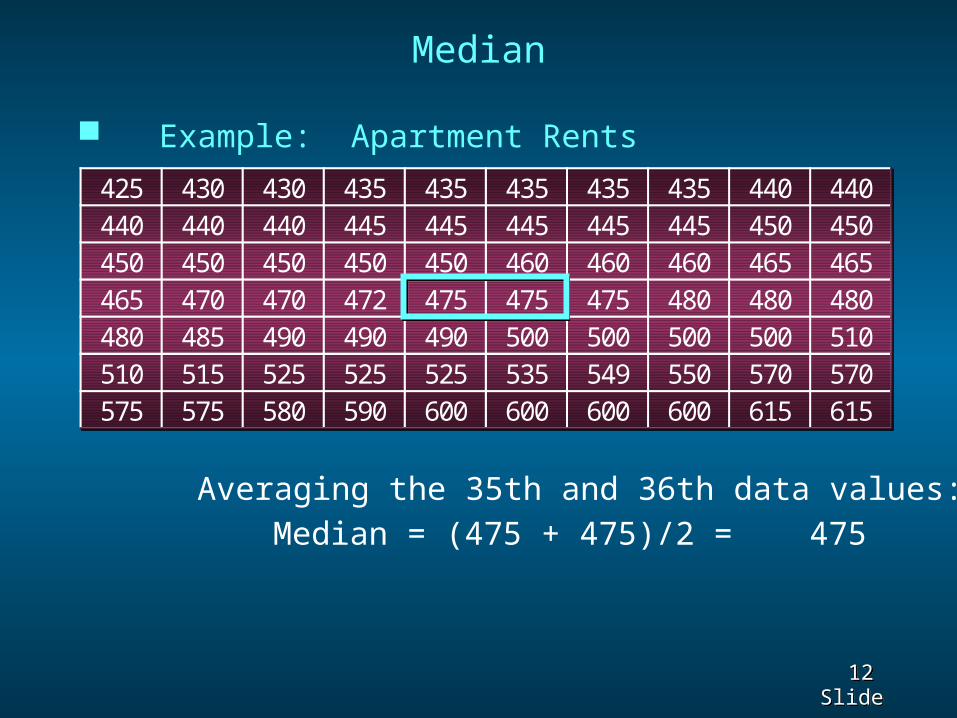
Median
Averaging the 35th and 36th data values:Median = (475 + 475)/2 = 475
425 430 430 435 435 435 435 435 440 440440 440 440 445 445 445 445 445 450 450450 450 450 450 450 460 460 460 465 465465 470 470 472 475 475 475 480 480 480480 485 490 490 490 500 500 500 500 510510 515 525 525 525 535 549 550 570 570575 575 580 590 600 600 600 600 615 615
Example: Apartment Rents
13 13 Slide Slide
Mode
The mode of a data set is the value that occurs with greatest frequency. The greatest frequency can occur at two or more different values. If the data have exactly two modes, the data are bimodal.
If the data have more than two modes, the data are multimodal.
14 14 Slide Slide
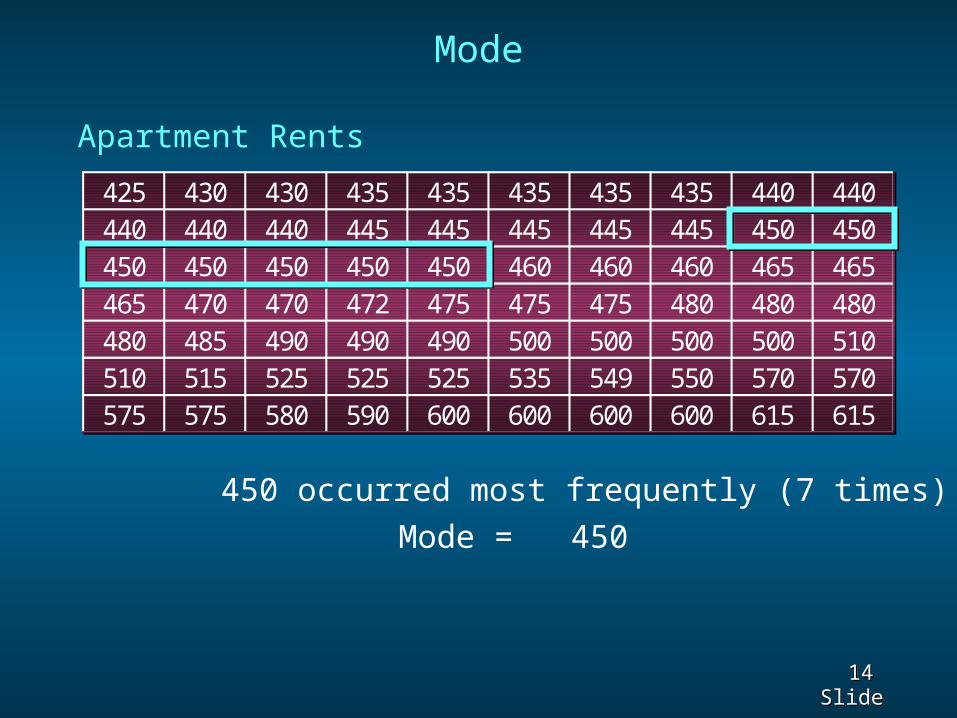
Mode
450 occurred most frequently (7 times)
Mode = 450
425 430 430 435 435 435 435 435 440 440440 440 440 445 445 445 445 445 450 450450 450 450 450 450 460 460 460 465 465465 470 470 472 475 475 475 480 480 480480 485 490 490 490 500 500 500 500 510510 515 525 525 525 535 549 550 570 570575 575 580 590 600 600 600 600 615 615
Apartment Rents

15 15 Slide Slide
PRACTICE
16 16 Slide Slide
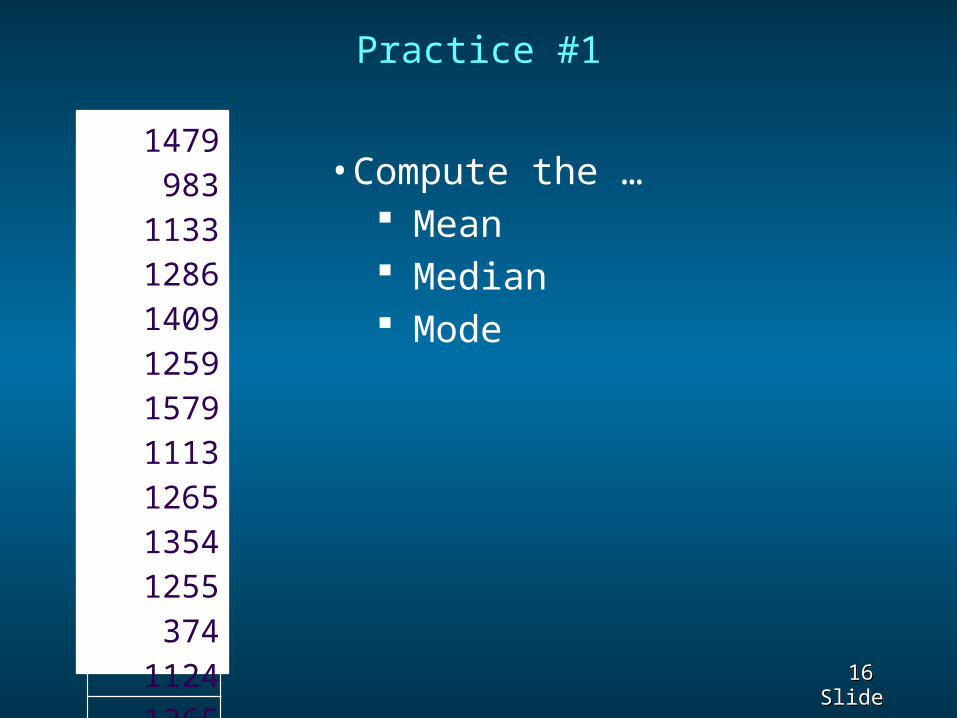
Practice #1
1479983
113312861409125915791113126513541255
37411241265
• Compute the … Mean Median Mode
18 18 Slide Slide
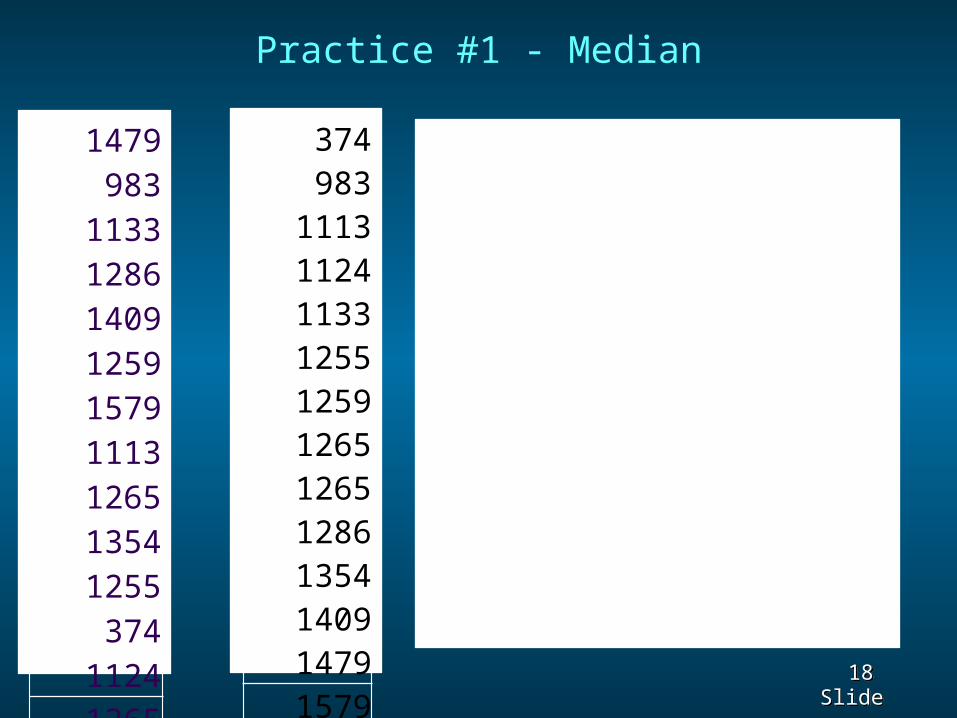
Practice #1 - Median
1479983
113312861409125915791113126513541255
37411241265
374983
111311241133125512591265126512861354140914791579
19 19 Slide Slide
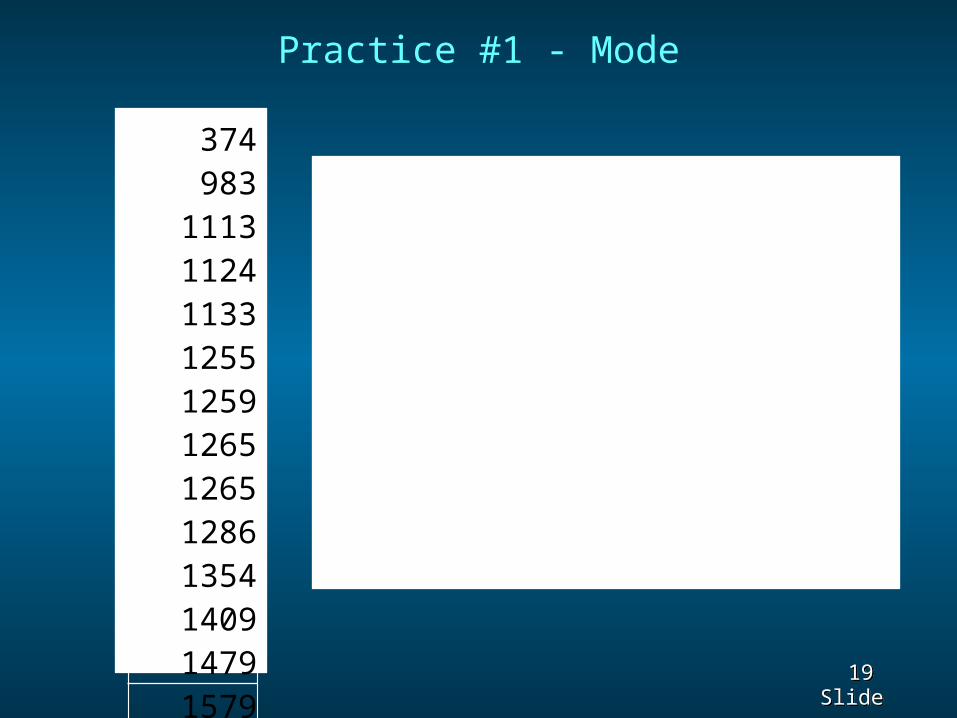
Practice #1 - Mode
374983
111311241133125512591265126512861354140914791579

20 20 Slide Slide
Percentiles
A percentile provides information about how the data are spread over the interval from the smallest value to the largest value. The pth percentile of a data set is a value such
that at least p percent of the items take on this value or less and at least (100 - p) percent of the items take on this value or more.
21 21 Slide Slide
Percentiles
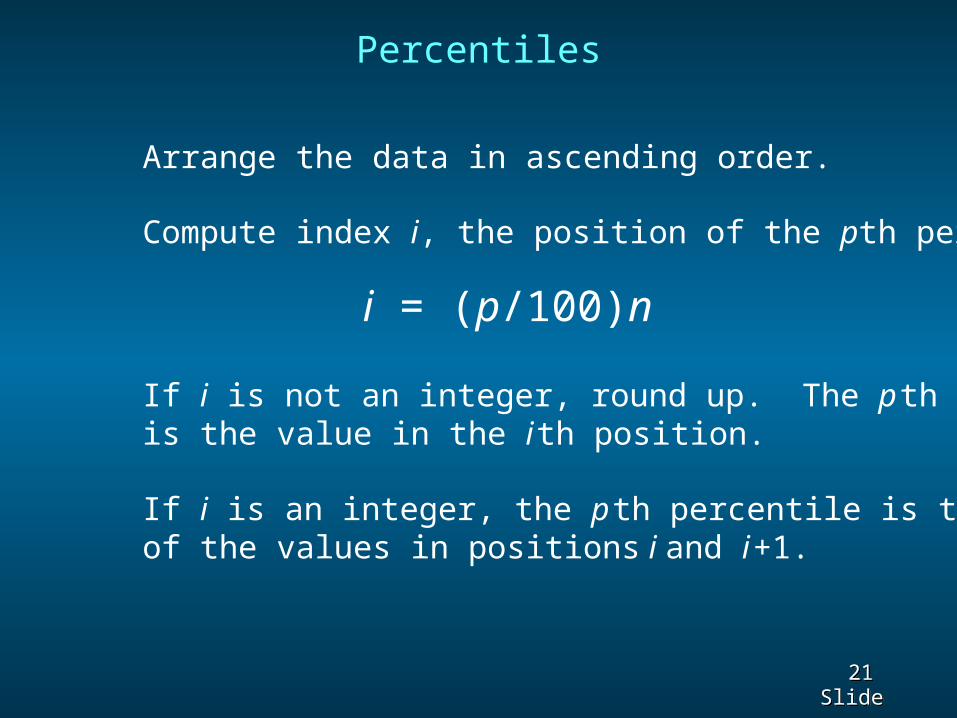
Arrange the data in ascending order.
Compute index i, the position of the pth percentile.
i = (p/100)n
If i is not an integer, round up. The p th percentile is the value in the i th position.
If i is an integer, the p th percentile is the average of the values in positions i and i +1.
22 22 Slide Slide
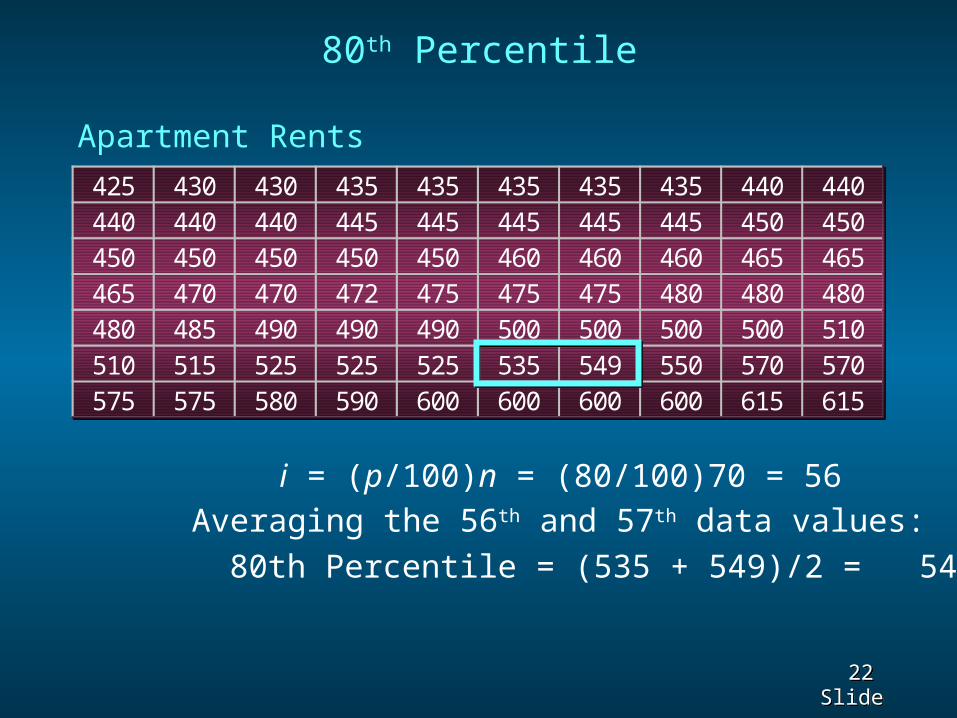
80th Percentile
i = (p/100)n = (80/100)70 = 56Averaging the 56th and 57th data values:80th Percentile = (535 + 549)/2 = 542
425 430 430 435 435 435 435 435 440 440440 440 440 445 445 445 445 445 450 450450 450 450 450 450 460 460 460 465 465465 470 470 472 475 475 475 480 480 480480 485 490 490 490 500 500 500 500 510510 515 525 525 525 535 549 550 570 570575 575 580 590 600 600 600 600 615 615
Apartment Rents
23 23 Slide Slide
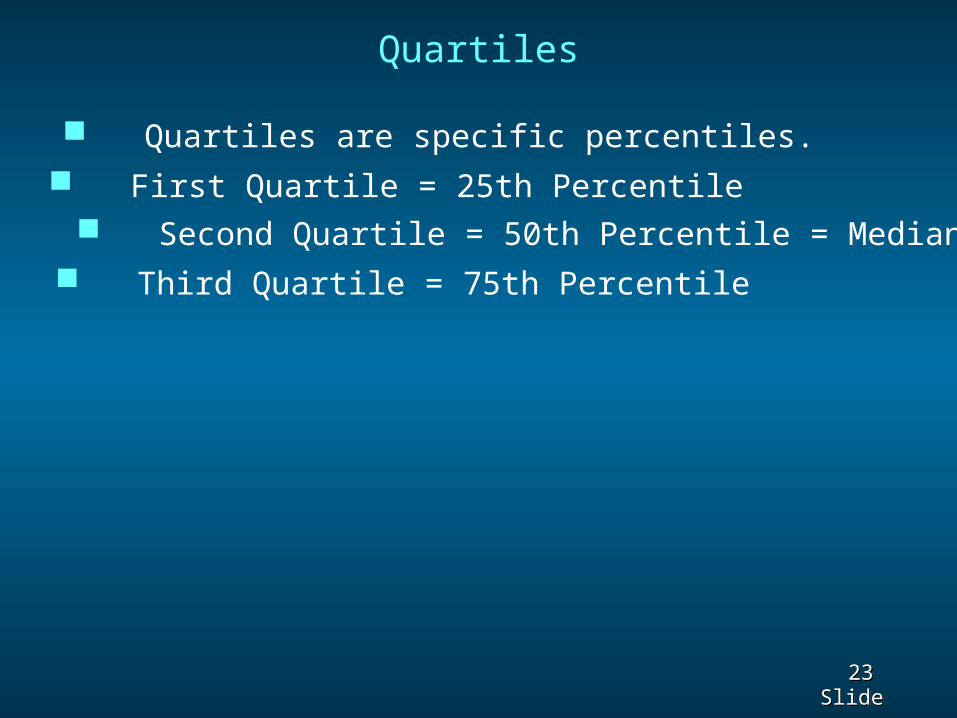
Quartiles
Quartiles are specific percentiles. First Quartile = 25th Percentile
Second Quartile = 50th Percentile = Median Third Quartile = 75th Percentile
24 24 Slide Slide
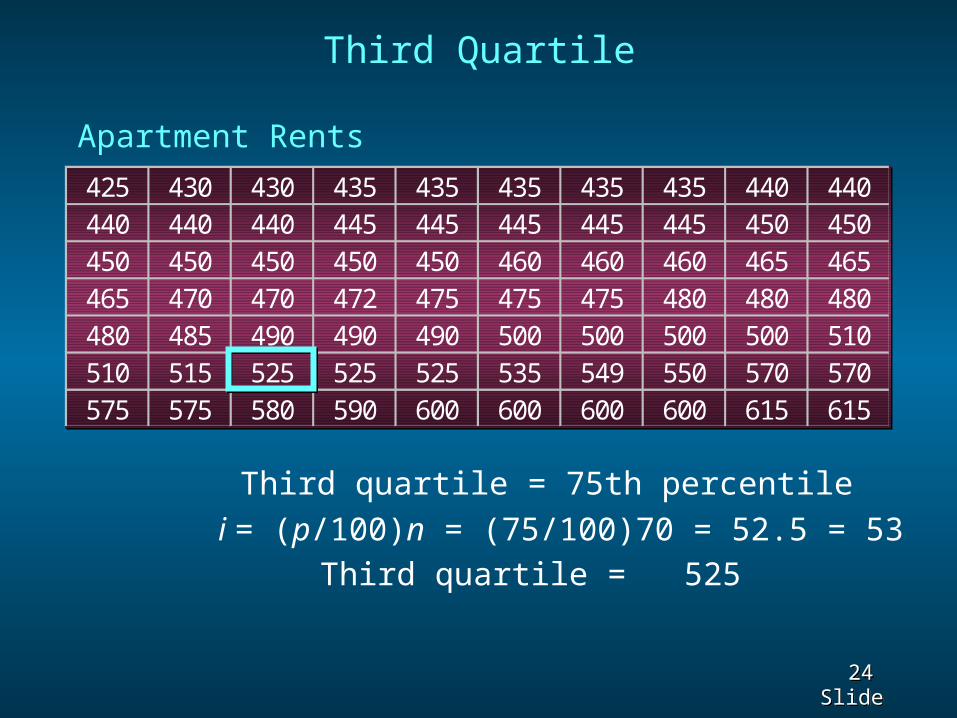
Third Quartile
Third quartile = 75th percentilei = (p/100)n = (75/100)70 = 52.5 = 53
Third quartile = 525
425 430 430 435 435 435 435 435 440 440440 440 440 445 445 445 445 445 450 450450 450 450 450 450 460 460 460 465 465465 470 470 472 475 475 475 480 480 480480 485 490 490 490 500 500 500 500 510510 515 525 525 525 535 549 550 570 570575 575 580 590 600 600 600 600 615 615
Apartment Rents

25 25 Slide Slide
PRACTICE
26 26 Slide Slide
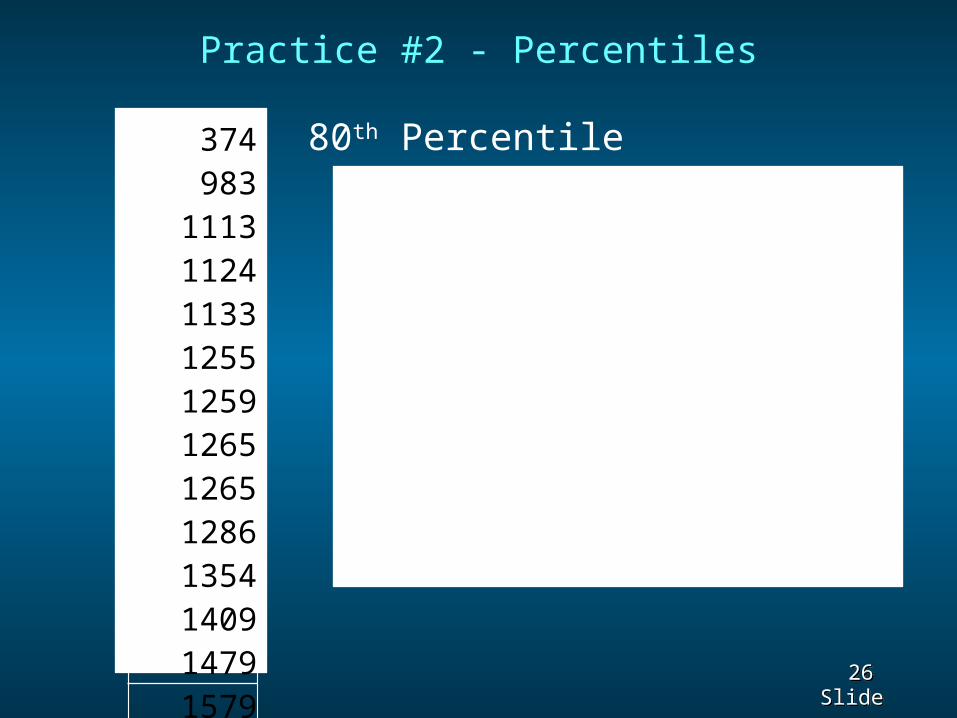
Practice #2 - Percentiles
374983
111311241133125512591265126512861354140914791579
80th Percentile

27 27 Slide Slide
VARIABILITY
28 28 Slide Slide
Measures of Variability
Range
Interquartile Range
Variance
Standard Deviation
Coefficient of Variation

29 29 Slide Slide
Range
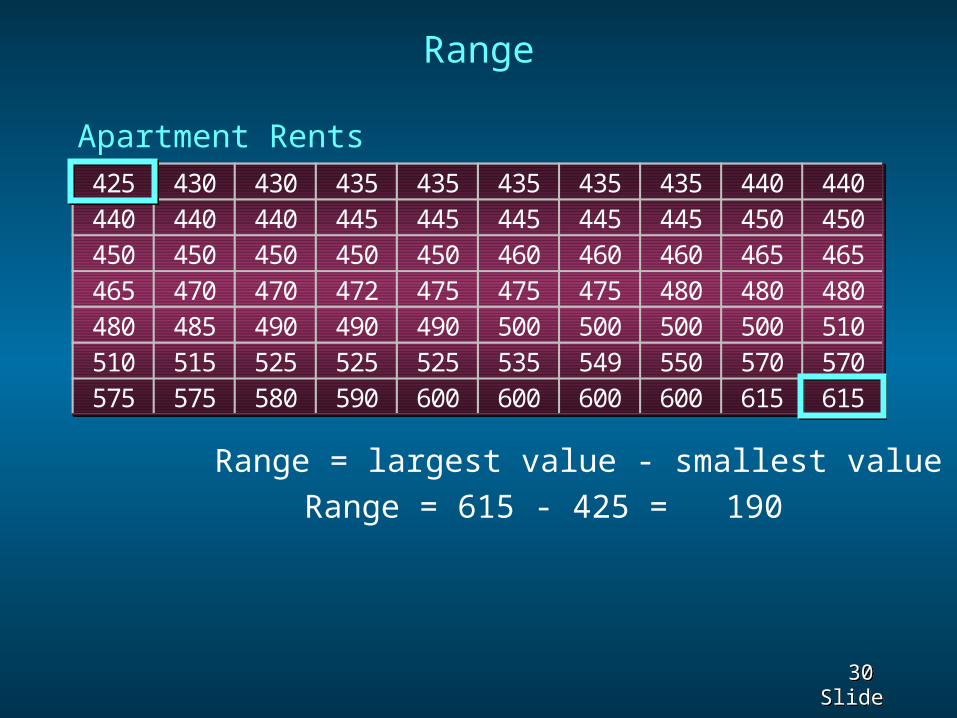
The range of a data set is the difference between the largest and smallest data values.
30 30 Slide Slide
Range
Range = largest value - smallest valueRange = 615 - 425 = 190
425 430 430 435 435 435 435 435 440 440440 440 440 445 445 445 445 445 450 450450 450 450 450 450 460 460 460 465 465465 470 470 472 475 475 475 480 480 480480 485 490 490 490 500 500 500 500 510510 515 525 525 525 535 549 550 570 570575 575 580 590 600 600 600 600 615 615
Apartment Rents

31 31 Slide Slide
Interquartile Range
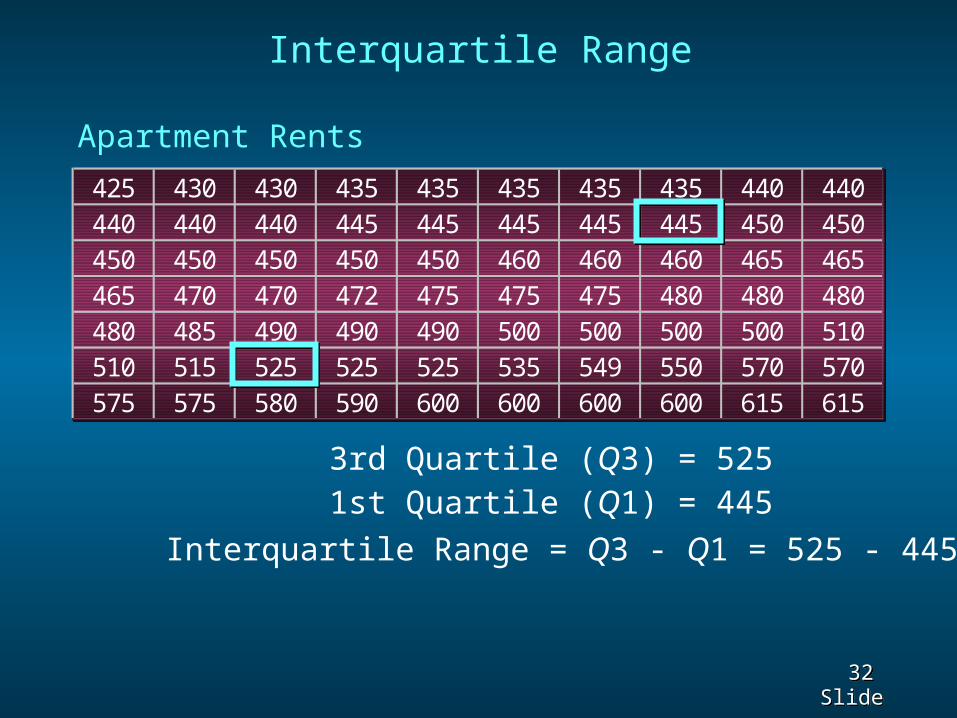
The interquartile range of a data set is the difference between the third quartile and the first quartile. It is the range for the middle 50% of the data.
It overcomes the sensitivity to extreme data values.
32 32 Slide Slide
425 430 430 435 435 435 435 435 440 440440 440 440 445 445 445 445 445 450 450450 450 450 450 450 460 460 460 465 465465 470 470 472 475 475 475 480 480 480480 485 490 490 490 500 500 500 500 510510 515 525 525 525 535 549 550 570 570575 575 580 590 600 600 600 600 615 615
Interquartile Range
3rd Quartile (Q3) = 5251st Quartile (Q1) = 445
Interquartile Range = Q3 - Q1 = 525 - 445 = 80
Apartment Rents

33 33 Slide Slide
PRACTICERANGE
34 34 Slide Slide
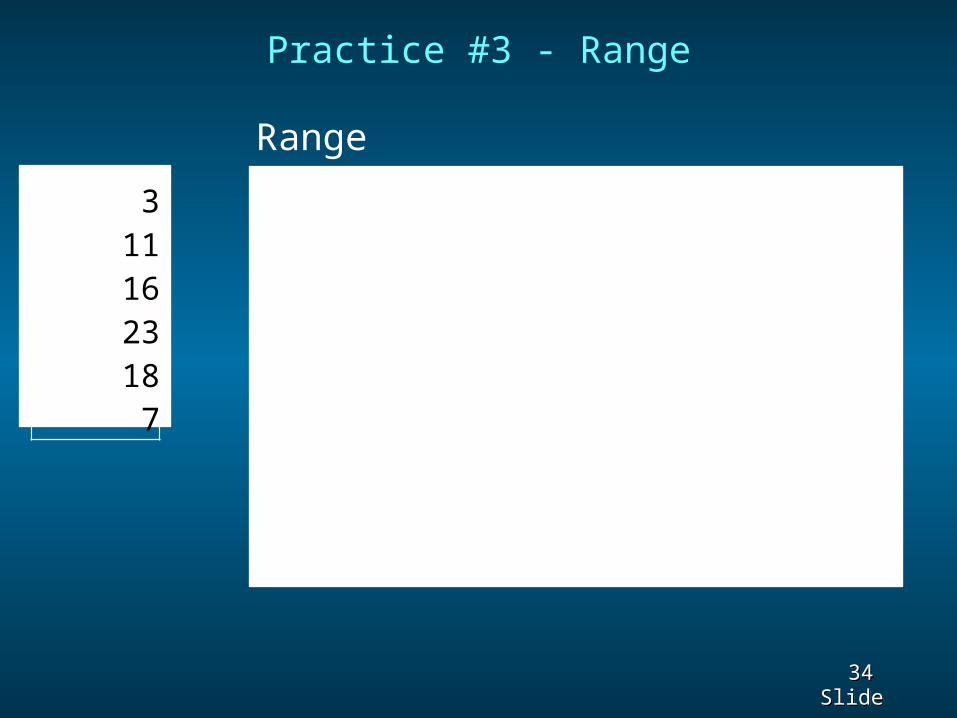
Practice #3 - Range
311162318
7
Range

35 35 Slide Slide
VARIANCE
36 36 Slide Slide
The variance is a measure of variability that utilizes all the data.
Variance
It is based on the difference between the value of each observation (xi) and the mean ( for a sample, m for a population).
x
The variance is useful in comparing the variability of two or more variables.
37 37 Slide Slide
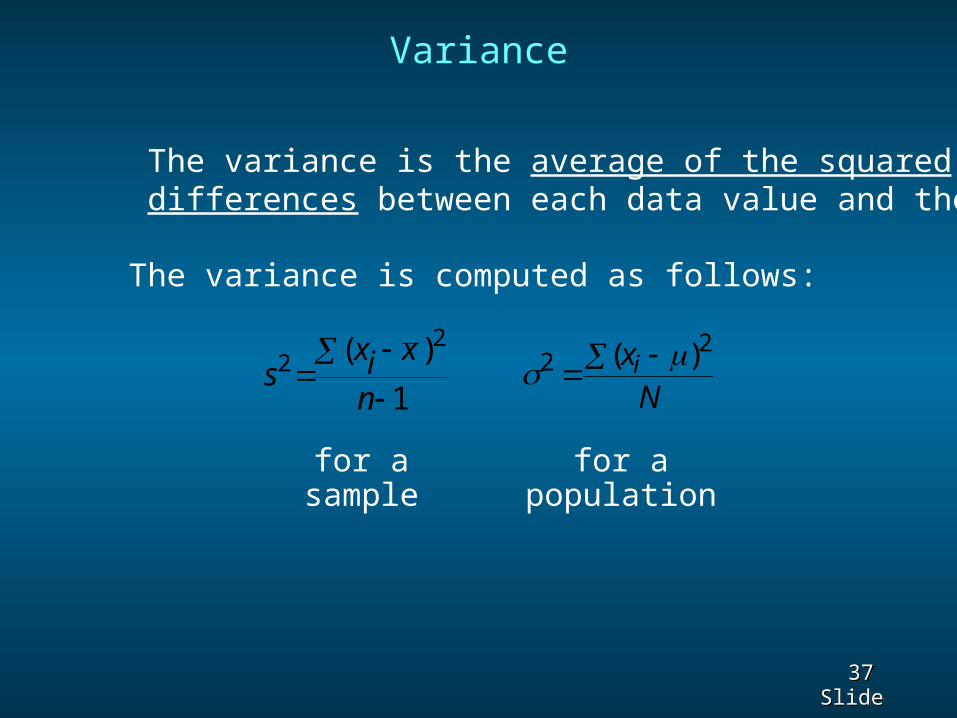
Variance
The variance is computed as follows:
The variance is the average of the squared differences between each data value and the mean.
for asample
for apopulation
22
( )xNis
xi x
n2
2
1
( )

38 38 Slide Slide
• Variance
Sample Variance
Apartment Rents
22 ( )
2,996.161
ix xs
n
39 39 Slide Slide
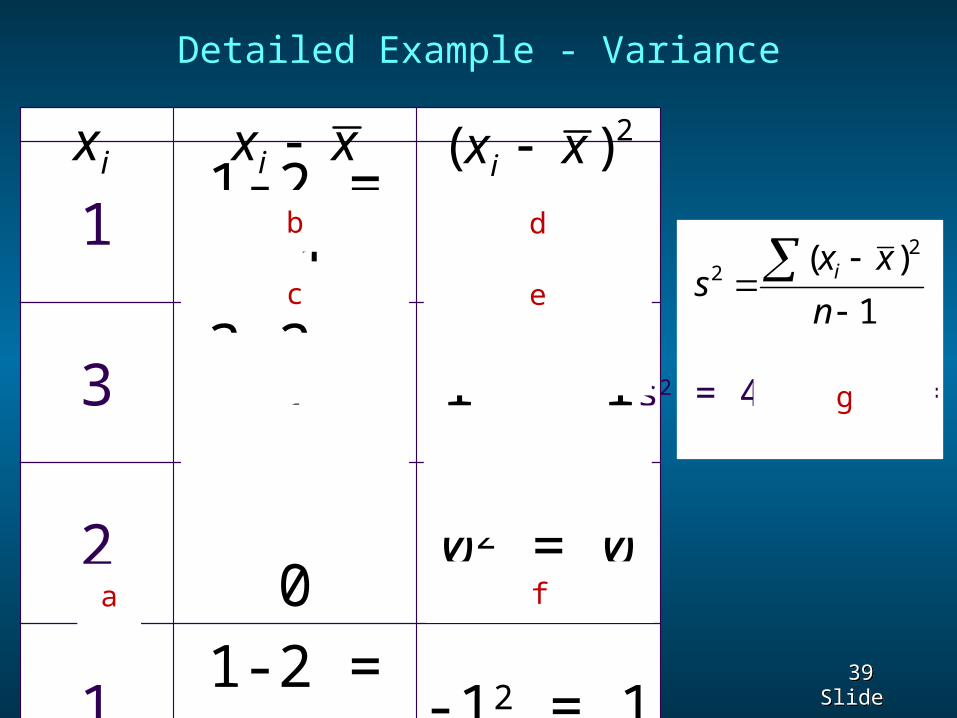
Detailed Example - Variance
1 1-2 = -1 -12 = 13 3-2 = 1 12 = 12 2-2 = 0 02 = 01 1-2 = -1 -12 = 13 3-2 = 1 12 = 1
2 4
ix xxi 2)( xxi
1
)( 22
n
xxs i
s2 = 4/(5-1) = 1
b
c
d
e
f
g
a

40 40 Slide Slide
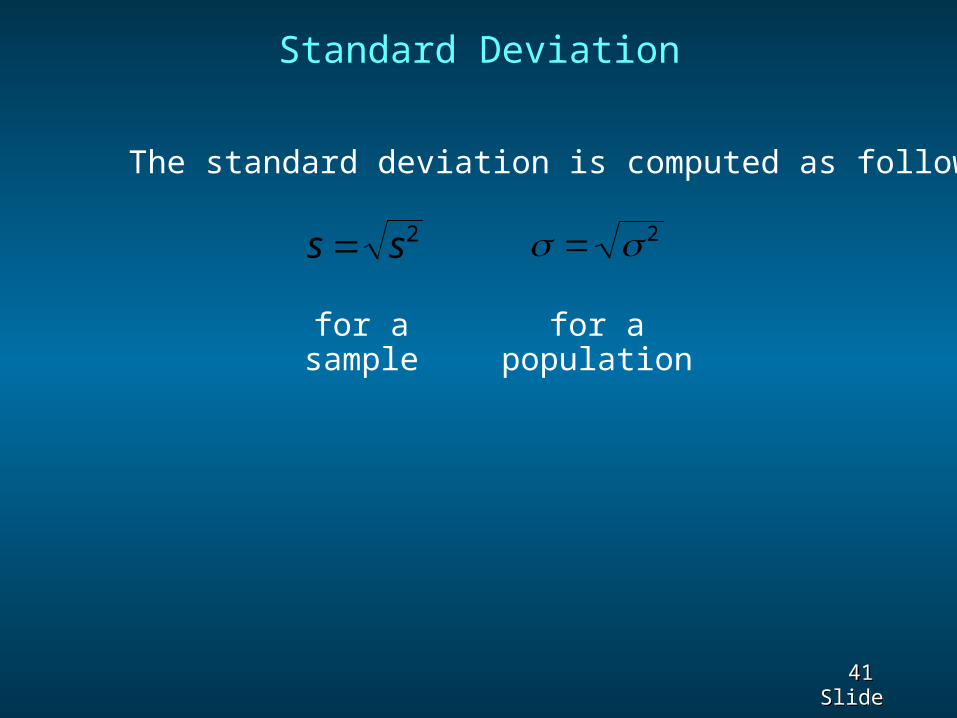
Standard Deviation
The standard deviation of a data set is the positive square root of the variance.
It is measured in the same units as the data, making it more easily interpreted than the variance.
41 41 Slide Slide
The standard deviation is computed as follows:
for asample
for apopulation
Standard Deviation
s s 2 2

42 42 Slide Slide
• Standard Deviation
Standard Deviation
Apartment Rents
2 2996.16 54.74s s
22 ( )
2,996.161
ix xs
n

43 43 Slide Slide
Detailed Example – Standard Deviation
1
)( 22
n
xxs i
s2 = 4/(5-1) = 1
2ss
11s a

44 44 Slide Slide
PRACTICEVARIANCE AND STANDARD DEVIATION

45 45 Slide Slide
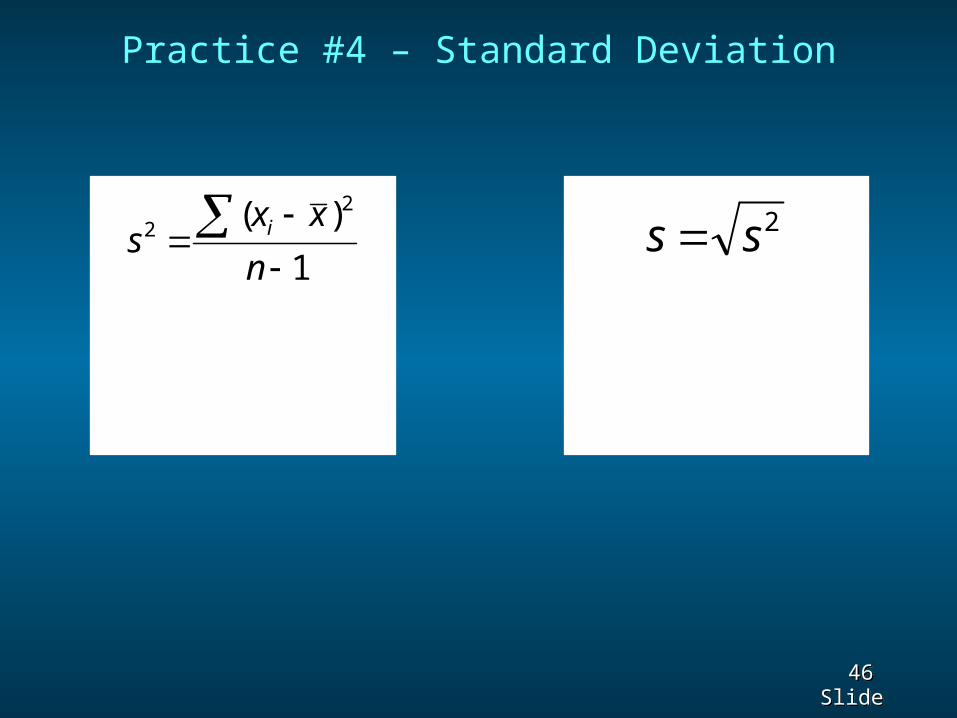
Practice #4 – Variance
3
7
11
16
18
23
ix xxi 2)( xxi
1
)( 22
n
xxs i
46 46 Slide Slide
Practice #4 – Standard Deviation
1
)( 22
n
xxs i 2ss
47 47 Slide Slide
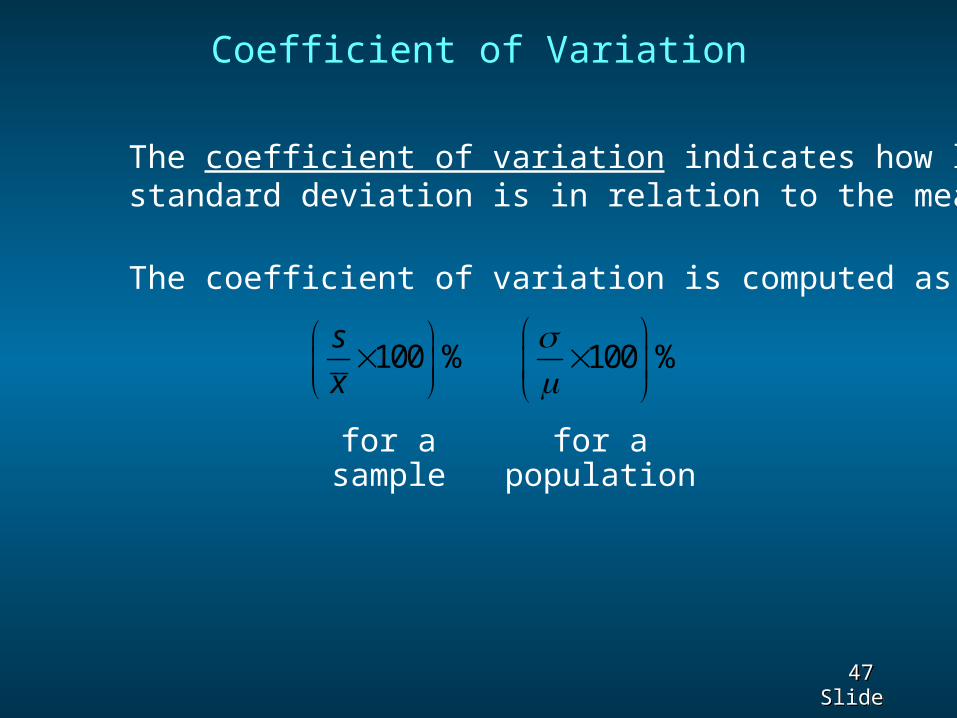
The coefficient of variation is computed as follows:
Coefficient of Variation
100 %s
x
The coefficient of variation indicates how large the standard deviation is in relation to the mean.
for asample
for apopulation
100 %

48 48 Slide Slide
54.74100 % 100 % 11.15%
490.80sx
2 2996.16 54.74s s
22 ( )
2,996.161
ix xs
n
the standard
deviation isabout 11%
of the mean
• Variance
• Standard Deviation
• Coefficient of Variation
Sample Variance, Standard Deviation,And Coefficient of Variation
Apartment Rents

49 49 Slide Slide
PRACTICECOEFFICIENT OF VARIATION
50 50 Slide Slide
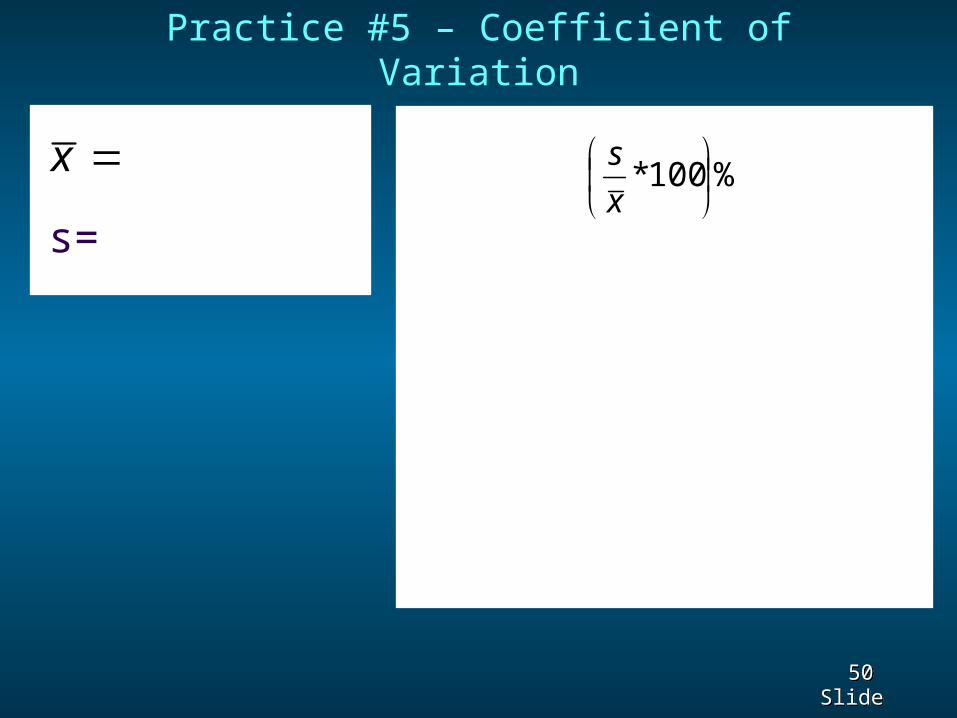
Practice #5 – Coefficient of Variation
x
s=
%100*
x
s

51 51 Slide Slide


