Annual Meeting 36 Transportation Research Board 37
Washington, D.C. 38
November 15, 2009 39 40
41 Word Count: 42 5,642 words + 4 figures + 3 tables = 7,392 43
44
1 Corresponding author
K. Sivakumaran, X.Y. Lu, M. Hanson 2
1
2
3 ABSTRACT 4
5 As demand for air cargo movement rises, so does truck traffic on California’s roads. In 6
turn, traffic congestion, harmful emissions, maintenance costs, and accidents all increase. One 7 potential alternative to truck transport of goods is mixed passenger-goods movement on urban 8
rail networks, a concept motivated by several potential benefits to involved parties. These 9 benefits include additional revenue to rail operators, more reliable travel times, reductions in 10 harmful trucking externalities, and more efficient usage of existing facilities. 11
As a case study, the use of the Bay Area Rapid Transit (BART) system for FedEx 12
Express cargo movement is examined in the following paper. FedEx Express was particularly 13 selected due to the location of the company’s major hub at Oakland International Airport (OAK). 14
To analyze the potential costs and benefits of the use of BART for FedEx transport, two 15
alternatives are compared against the status quo of truck-only transport. The first alternative 16 assumes only minor capital investment, while the second assumes far greater capital investment, 17
including a jointly operated BART/FedEx facility at OAK. Truck VMT, FedEx operating costs, 18 BART operating costs, and CO2 emissions are determined for the status quo and each alternative. 19 Analysis shows that significant truck VMT savings can be accrued from mixed-goods service, as 20
well as that given sufficient demand, such service can both be profitable for passenger rail 21 systems and cost-effective for air cargo carriers. This study can provide motivation for similarly 22
analyzing other metropolitan areas with major transit systems, such as Los Angeles, Washington 23 D.C., and New York. 24
25
K. Sivakumaran, X.Y. Lu, M. Hanson 3
1 INTRODUCTION 1 As demand for air freight movement increases, so does truck traffic on California’s roads. 2
As truck transport grows, so do the problems attached with it, including traffic congestion, 3 harmful emissions, maintenance costs, and accidents. There exists an imperative to explore 4
alternatives to truck transport for freight movement, specifically the potential for existing 5 passenger rail networks to operate as a mode of freight transport. This concept is motivated by 6 several potential benefits to all parties. A passenger rail network offering service to both 7 passengers and air freight carriers can provide itself with a) a more efficient use of its existing 8 capacity, particularly during the off-peak periods, b) an additional source of revenue, and c) 9
potential source of cross-subsidization, where revenue from freight revenue can be reinvested 10 into improved passenger movement. The freight carrier, by shifting goods from truck transport 11 to rail transport, can potentially benefit from a) more reliable travel times for goods movement, 12 particularly during periods of non-recurrent congestion, b) fewer truck accidents, and c) cheaper 13
transport costs. Society, as a whole, may benefit from reduced truck traffic through reductions 14 in a) harmful emissions and GHGs, b) truck-induced delay, c) road maintenance costs, and d) 15
other negative externalities, such as noise and truck-related accidents. 16 With this concept in mind, this paper provides a case study of the potential for the use of 17
transit systems such as BART (the Bay Area Rapid Transit), in the movement of air cargo. The 18 economic feasibility of such a system is presented from a purely operational perspective. A later 19 report will include the required capital costs, but for the purposes of this paper, capital 20
investments are considered sunk costs. Clearly, if mixed-goods service is found to be fiscally 21 infeasible from an operational perspective, there will be no need to examine the required capital 22
expenditure. The paper is structured as follows. Section 2 describes the critical characteristics 23 of the system under analysis. Section 3 outlines the assumptions and methodology of the 24 economic feasibility model. This model explores three different operation scenarios: the status 25
quo, an alternative requiring minimal capital expenditure (Alternative A), and an alternative 26
requiring significant capital expenditure (Alternative B). Section 4 discusses the quantitative 27 results of the economic feasibility study. Section 5 discusses how this type of service might be 28 further investigated. 29
30
2 SYSTEM CHARACTERISTICS 31 This section describes the characteristics of the system under analysis, specifically that of 32
the major passenger rail operator in the Bay Area, BART, as well as one of the area’s major air 33
cargo carriers, FedEx Express. These two parties present unique capabilities and restrictions 34 which must be considered for accurate cost-benefit analysis. 35 36
2.1 Characteristics of the BART System 37 BART is the Bay Area’s primary passenger rail transit system which connects more than 38
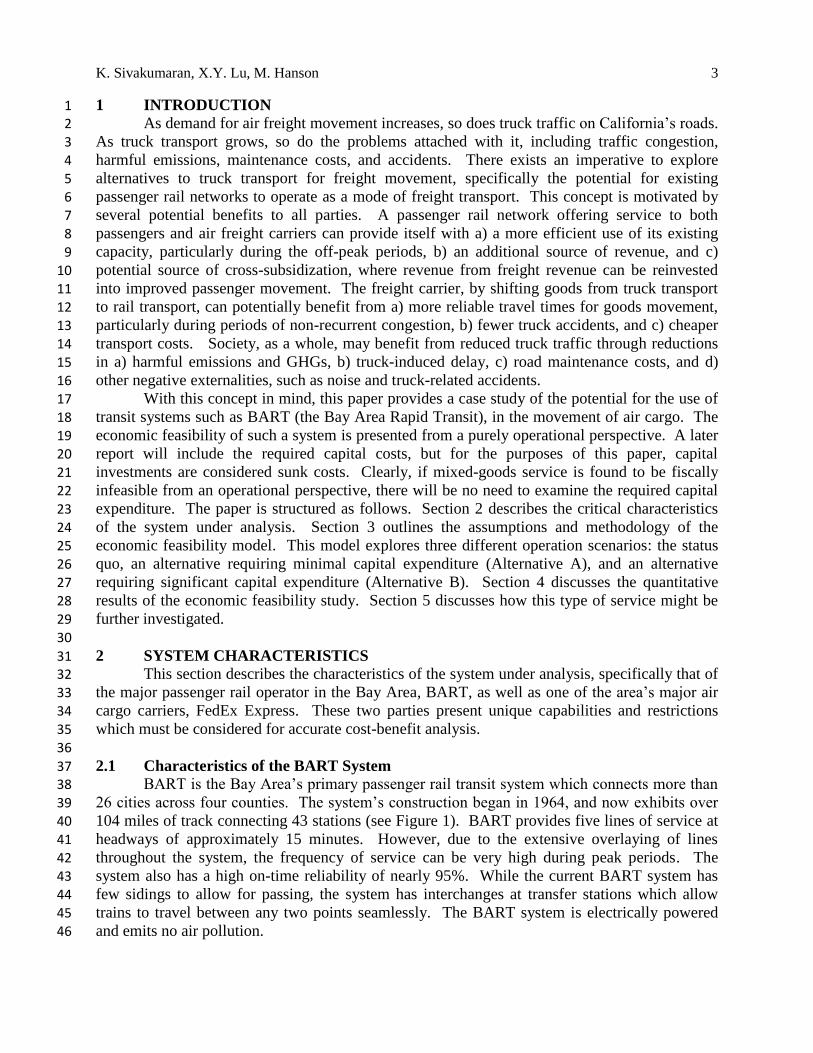
26 cities across four counties. The system’s construction began in 1964, and now exhibits over 39 104 miles of track connecting 43 stations (see Figure 1). BART provides five lines of service at 40
headways of approximately 15 minutes. However, due to the extensive overlaying of lines 41 throughout the system, the frequency of service can be very high during peak periods. The 42 system also has a high on-time reliability of nearly 95%. While the current BART system has 43 few sidings to allow for passing, the system has interchanges at transfer stations which allow 44 trains to travel between any two points seamlessly. The BART system is electrically powered 45 and emits no air pollution. 46
K. Sivakumaran, X.Y. Lu, M. Hanson 4
Unlike many other urban passenger rail systems, BART utilizes a nonstandard gauge of 5 1
ft 6 in; the standard gauge most commonly found in the U.S. is 4 ft 8.5 in. Consequently, the 2 system relies on custom-made rolling stock, which totals 669 cars. The dimensions for the 3 vehicles currently used by BART are 70 ft X 10.5 ft X 7 ft (length X width X height). Door 4
dimensions are approximately 4.5 ft X 6.5 ft (width X height). Due to each BART station’s 5 length (~710 ft), BART typically does not operate trains longer than 10 cars. Each BART car 6 has a load capacity of 30,000 lbs. BART trains are also able to operate in both directions without 7 the need to turn around. During a typical morning peak-hour commute, 541 cars are in service, 8 while the remainder are either used to build spare trains, in repair, or involved with other 9
maintenance work. In lieu of the increased stress being placed on BART’s current vehicles, the 10 transit agency is looking to purchase 700 new cars in an effort to upgrade its entire fleet by 2024. 11 Future planned BART extensions include a track extension of the Fremont line southward to San 12 Jose (scheduled for construction by 2018), and potentially a connection to the Oakland 13
International Airport (OAK). 14 These future projects have the potential to strengthen the viability of mixed-goods service 15
by BART. Retired BART cars could be retrofitted and used for freight movement. If the 16 Oakland Airport Connector project can accommodate existing BART vehicles, a truck 17
transshipment link between OAK and the existing BART network could be eliminated for 18 mixed-goods service. Currently, BART uses 30% of its capacity on average for daily passenger 19 movement with the other 70% unused. Here, the capacity calculated is based on current 20
operation with 15 minute headways and ten-car consists. However, if BART system adopts 21 modern technologies in communication and control systems, the operation headway could be 22
greatly reduced and the capacity could be doubled, or even tripled. 23 24
25 FIGURE 1 BART System Map 26
27
K. Sivakumaran, X.Y. Lu, M. Hanson 5
2.2 Characteristics of the Air Freight Carrier: FedEx Express 1 Air freight carriers, such as FedEx, DHL, and UPS all have a strong need for frequent, 2
reliable, and cost-effective chain of transportation. With the recent withdrawal of DHL from the 3 U.S. air and ground carrier markets, a significant portion of carrier market share will likely be 4
subsumed by FedEx and UPS, which will further stress their existing transport chains. 5 Furthermore, the overall market volume is expected to increase with the growing number of 6 imports from rapidly emerging regions such as the Pacific Rim. 7
FedEx Express presents itself as a particularly promising participant in an economic 8 feasibility study due to its strong presence in the Bay Area. The FedEx Western Regional Hub at 9
OAK acts as a sorting and distribution center to seven states on the West Coast. Smaller 10 distribution centers are scattered throughout the Bay Area, in cities such as Concord, Dublin, and 11 San Jose. FedEx Express also maintains flights to and from the San Francisco International 12 Airport (SFO). As traffic congestion continues to increase along the Bay Area’s urban corridors, 13
FedEx has been exploring service alternatives which provide greater reliability. 14 All FedEx container types, other than the standard USPS container type, are transported 15
throughout the FedEx transport chain using ball-bearings; that is, items are not lifted onto pallets 16 in order to be loaded onto trucks. Rather, containers are simply slid across platforms and aboard 17
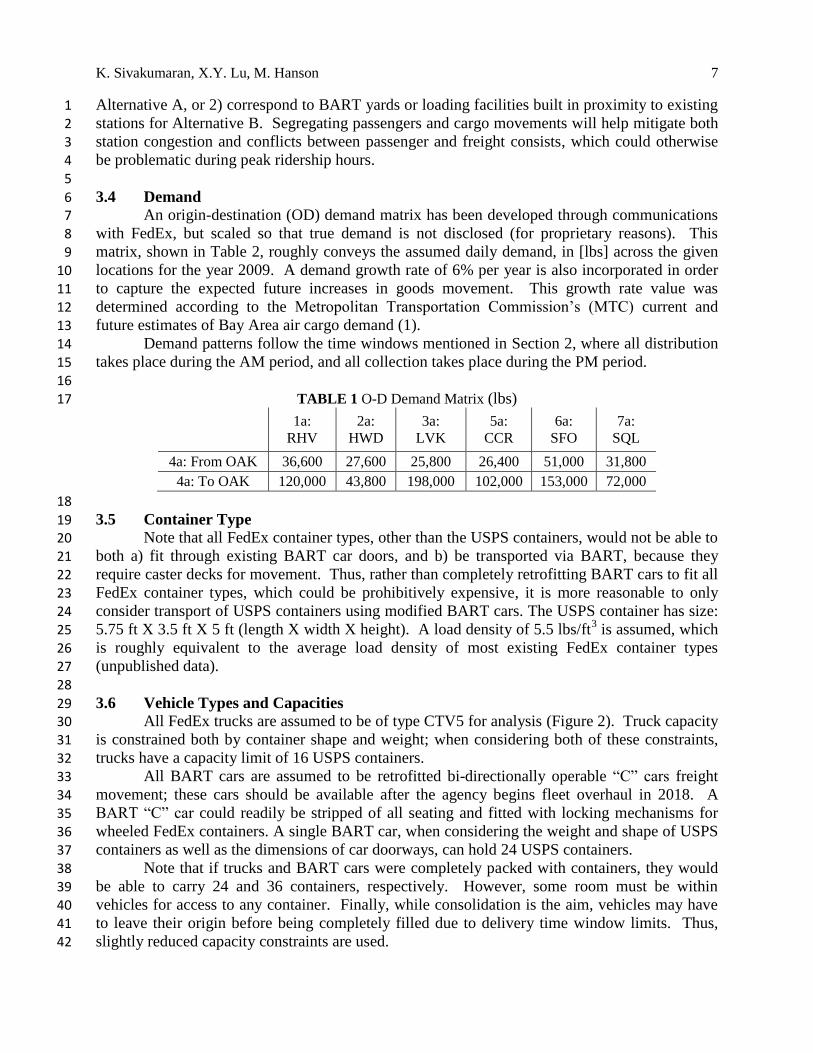
trucks via the casters mounted throughout loading platforms. 18 FedEx utilizes two truck types, CTV4 and CTV5 (Figure 2), which differ in truck length 19
(unpublished data – Michael Graham, FedEx). The CTV4 is approximately 45 feet long, and the 20
CTV5 is approximately 53 feet long. Both trucks are 10.5 ft wide. As mentioned, truck beds are 21 retrofitted with ball-bearings to allow for seamless loading and unloading of FedEx containers. 22
It is also important to note that FedEx containers operate within a “closed loop” for security 23 purposes – that is, once a container is initially filled and closed before distribution, it remains 24 closed until it reaches its final local sorting center. 25
26
27 FIGURE 2 FedEx Long-Haul Truck, type CTV5 (unpublished data – Michael Graham, FedEx) 28
29 FedEx Express demand is time dependent. FedEx packages originating from locations 30 outside the Bay Area and destined for the Bay Area are distributed in the morning between 3:00 31
AM and 7:00 AM. FedEx Express packages originating from the Bay Area and destined for 32 locations outside the Bay Area are collected between 5:00 PM and 9:00 PM. 33
34 3 MODEL ASSUMPTIONS AND METHODOLOGY 35
This section outlines the assumptions used for this economic feasibility study. 36 37
3.1 Case Study Alternatives 38 This analysis examines two alternatives for BART mixed-goods service over the 20-year 39 period between 2021 and 2040. Both will be compared against the status quo (SQ), where only 40
K. Sivakumaran, X.Y. Lu, M. Hanson 6
trucks will be used for transport of FedEx products. Alternative A will consider a scenario 1
where little capital investment is required; only existing BART yards, maintenance areas, and 2 those stations with adequate room for additional track siding (Milpitas and Dublin/Pleasanton), 3 will be used as FedEx transfer terminals. Note that Alternative A requires FedEx truck 4
transshipments at both ends. For Alternative B, a jointly operated BART/FedEx facility at the 5 FedEx Oakland Regional Hub is assumed. This would require a connection between OAK and 6 the existing BART network. The MTC, the Bay Area’s regional planning commission, has been 7 considering a connection between OAK and the BART system; if BART freight trains could be 8 accommodated along this connection, a truck transshipment link could be eliminated. Alternative 9
B also includes sufficient capital investment to allow for retrofitting of existing BART stations, 10 specifically the Glen Park and South San Francisco stations, so that these stations can adequately 11 facilitate FedEx goods movement. Note that for all alternatives, only operating cost expenditures 12 are considered (note also that all costs are expressed in 2008 $). Both alternatives will require 13
certain capital expenditure towards loading/unloading platforms for containers, stripping and 14 retrofitting of BART cars, and other station modifications to ensure segregation between 15
passengers and FedEx containers. A future report is expected to outline the necessary capital 16 expenditures for both alternatives in order to fully determine overall economic feasibility. 17
18
3.2 Exclusive Rights by FedEx Express to BART Freight Movement Services 19 Here, economic analysis only considers the transport of FedEx Express products. It may 20
be beneficial to also consider UPS products, since inclusion of additional products could lead to 21 the critical demand threshold for economic feasibility being passed. However, considering this 22
additional demand source would require further inspection into UPS container types and 23 handling requirements. 24
Interestingly, UPS actively participated in feasibility studies in 2008, and they maintain 25
interest in the possibility of goods movement using BART. They are particularly interested in 26
freight movement between SFO and OAK since they do not operate flights from SFO; all their 27 products from the San Francisco area have to be transferred to OAK for air transport. However, 28 due to limited data availability, economic analysis at this stage will focus on FedEx products. 29
30
3.3 Locations 31 A simple graphical depiction of the network for each alternative is shown in Figure 3. 32
There are six FedEx Express distribution centers in the Bay Area (listed in the “Key” to the 33
figure) which are located near the following existing/future BART facilities: Oakland, Concord, 34 Hayward, Dublin, downtown San Francisco, South San Francisco, and Milpitas. The BART 35 Milpitas station is scheduled for construction in 2018. The lone exception is node 4b in 36 Alternative A; while there is no BART station at this location, there is a small BART 37 maintenance facility known as the Oakland Annex Shop, where there is a spur track and 38
adequate room for truck loading/offloading. Note also that node 4ab acts jointly as a BART 39 station and FedEx center in Alternative B. 40
BART stations such as Colma, Union City, and Concord are of particular interest due to 41 their proximity to BART maintenance yards, which are completely separated from passenger 42 movements. Subsequently, these yards will behave as “depots” for freight consists in 43 Alternatives A and B, meaning that all trains must be assembled in one of these yards before 44 serving a particular route. Furthermore, while some node names correspond to BART station 45 names, it is emphasized that the nodes themselves either 1) correspond to BART yards for 46
K. Sivakumaran, X.Y. Lu, M. Hanson 7
Alternative A, or 2) correspond to BART yards or loading facilities built in proximity to existing 1
stations for Alternative B. Segregating passengers and cargo movements will help mitigate both 2 station congestion and conflicts between passenger and freight consists, which could otherwise 3 be problematic during peak ridership hours. 4
5
3.4 Demand 6 An origin-destination (OD) demand matrix has been developed through communications 7
with FedEx, but scaled so that true demand is not disclosed (for proprietary reasons). This 8 matrix, shown in Table 2, roughly conveys the assumed daily demand, in [lbs] across the given 9
locations for the year 2009. A demand growth rate of 6% per year is also incorporated in order 10 to capture the expected future increases in goods movement. This growth rate value was 11 determined according to the Metropolitan Transportation Commission’s (MTC) current and 12 future estimates of Bay Area air cargo demand (1). 13
Demand patterns follow the time windows mentioned in Section 2, where all distribution 14 takes place during the AM period, and all collection takes place during the PM period. 15
16 TABLE 1 O-D Demand Matrix (lbs)
17
1a:
RHV
2a:
HWD
3a:
LVK
5a:
CCR
6a:
SFO
7a:
SQL
4a: From OAK 36,600 27,600 25,800 26,400 51,000 31,800
4a: To OAK 120,000 43,800 198,000 102,000 153,000 72,000
18
3.5 Container Type 19 Note that all FedEx container types, other than the USPS containers, would not be able to 20
both a) fit through existing BART car doors, and b) be transported via BART, because they 21
require caster decks for movement. Thus, rather than completely retrofitting BART cars to fit all 22 FedEx container types, which could be prohibitively expensive, it is more reasonable to only 23
consider transport of USPS containers using modified BART cars. The USPS container has size: 24 5.75 ft X 3.5 ft X 5 ft (length X width X height). A load density of 5.5 lbs/ft
3 is assumed, which 25
is roughly equivalent to the average load density of most existing FedEx container types 26
(unpublished data). 27 28
3.6 Vehicle Types and Capacities 29 All FedEx trucks are assumed to be of type CTV5 for analysis (Figure 2). Truck capacity 30
is constrained both by container shape and weight; when considering both of these constraints, 31 trucks have a capacity limit of 16 USPS containers. 32 All BART cars are assumed to be retrofitted bi-directionally operable “C” cars freight 33
movement; these cars should be available after the agency begins fleet overhaul in 2018. A 34 BART “C” car could readily be stripped of all seating and fitted with locking mechanisms for 35
wheeled FedEx containers. A single BART car, when considering the weight and shape of USPS 36 containers as well as the dimensions of car doorways, can hold 24 USPS containers. 37
Note that if trucks and BART cars were completely packed with containers, they would 38 be able to carry 24 and 36 containers, respectively. However, some room must be within 39 vehicles for access to any container. Finally, while consolidation is the aim, vehicles may have 40 to leave their origin before being completely filled due to delivery time window limits. Thus, 41 slightly reduced capacity constraints are used. 42
K. Sivakumaran, X.Y. Lu, M. Hanson 8
43 FIGURE 3 System networks under consideration for Alternatives A and B. 44
45
K. Sivakumaran, X.Y. Lu, M. Hanson 9
3.7 Empty Container Returns 46 Empty container returns must also be considered, since the demand O-D table is likely to 47 be unbalanced (Table 1). The number of empty containers which must be transported to/from a 48 given location is simply the difference between the location’s outgoing and incoming demand. 49
50
3.8 Freight Car Storage Areas and Empty Train Travels 51 For Alternative A, it is assumed that there is no storage space for BART cars at the 52 Oakland Annex Shop; thus, all freight consists must be assembled at one of BART’s four yards 53 before leaving for a particular route. During AM operations, since all movement is from OAK, 54
the Union City BART yard is assumed to supply freight consists to the Oakland Annex Shop 55 station. After unloading all goods at a final destination, the empty train will then depart for the 56 nearest yard. During PM operations, each route’s origin (node 1b, 3b, 5b, 6b/7b, or 7b) will have 57 trains supplied from the nearest yard. After unloading goods at OAK, each empty train will 58
return to the Union City yard. However, a new train must then be assembled which returns 59 empty containers to a given location (trains may be either originating from or destined for OAK). 60
Empty container returns simultaneously help ensure that the same number of freight cars will be 61 in each yard at the beginning of each day. 62
For Alternative B, it is assumed that there is adequate BART car storage at the jointly-63 operated FedEx/BART facility at node 4ab. Thus, this facility will assume the role played by the 64 Union City yard in Alternative A. All other procedures from Alternative A are adopted for 65
Alternative B. 66
68 3.9 Link Travel Times 69
In order to determine the operating costs incurred for BART cars, the travel times across 70 the system network must be considered. Since it is infeasible for a single train to transport all 71
goods throughout the network due to FedEx delivery time window, particular routes have been 72
assigned for BART freight trains, as seen in Table 2. Route travel times were approximated 73 from BART schedules (2). However, those provided times include the dwell times across 74 intermittent stops; thus, an assumed 40 second dwell time per stop has been subtracted from the 75
provided BART trip times. Furthermore, the aforementioned empty train travel times (from/to 76 the yards corresponding to the beginning and end of a particular route) should be added to all 77
route travel times in order to calculate the true cost of service. The resulting total service times, 78 as well as the route travel times, are given in Table 2. 79
80 TABLE 2 BART Travel Times for Alternatives A and B 81
82
Route
Route Travel Time
[hrs]
Total Service Time
[hrs]
AL
T. A
1b 2b 4b 0.66 1.33
3b 4b 0.51 1.34
5b 4b 0.52 0.92
6b/7b 4b 0.56 0.96
AL
T.
B 1b 2b 4ab 0.66 0.93
3b 4ab 0.46 0.90
5b 4ab 0.65 0.65
7b 6b 4ab 0.72 0.77
K. Sivakumaran, X.Y. Lu, M. Hanson 10
83 It is also necessary to determine the link travel distances and times across the road 84
network for truck transport of FedEx goods. Travel distances for all links are determined 85
according to the locations of BART stations and FedEx distribution centers. These distances are 86 listed in Table 3. While it can safely be assumed that transshipment travel times between local 87 FedEx distribution centers and BART stations will remain constant, the line-haul travel times in 88 the Status Quo might be expected to change over time due to rising freeway demand over time 89 (and subsequently, reduced travel speeds). Thus, analysis makes use of the predicted inter-90
regional travel speeds given by the Bay Area Metropolitan Transportation Commission (3). 91 92
93 TABLE 3 Truck Travel Distances for Various Alternatives 94
95
Link
Truck Travel
Distance [mi]
ST
AT
US
QU
O 4a 1a 33.1
4a 2a 15.5
4a 3a 20.9
4a 5a 31.6
4a 6a 22.4
4a 7a 28.6
AL
TE
RN
AT
IVE
A 1b 1a 3
2b 2a 4
3b 3a 3.6
5b 5a 4
6b/7b 6a 8.6
6b/7b 7a 4.9
4a 4b 8.8
AL
TE
RN
AT
IVE
B
1b 1a 3
2b 2a 4
3b 3a 2.6
5b 5a 4
6b 6a 3.8
7b 7a 3.4
96
3.10 Handling 97 A handling time of 0.025 hrs (1.5 minutes) per container is assumed. This handling time 98
is defined as the time to move one container from a BART vehicle across a station platform and 99 secure the container onto a FedEx truck (and vice-versa). Compared to the status quo, 100 Alternative A will require two additional handling movements (one movement at all BART 101
stations connected to local distribution centers and one movement at node 4b), and Alternative B 102
K. Sivakumaran, X.Y. Lu, M. Hanson 11
will require one additional handling movement (at all BART stations connected to local 103
distribution centers). Total handling cost is estimated by simply multiplying the assumed 104 handling time per container by the number of containers handled, the number of handling 105 movements, and the handler costs. Regardless of how responsibility is allocated for 106
loading/offloading items at BART stations, BART must still incur some labor cost, since BART 107 operators will be standing by until trains are loaded. Similarly, FedEx truck operators will at 108 least be on standby while trucks are being offloaded. Therefore, this total handling time cost is 109 assumed to be incurred by both FedEx and BART. 110 111
3.11 Truck VMT Estimation 112
The number of trucks required between any two points can be approximated as nij =D ij
K, 113
where Dij = demand originating from location i and destined for location j, in [containers], and 114
K = truck capacity, in [containers]. With these capacity considerations, the demand matrix 115 provided earlier can be readily converted into a “Truck Trips” matrix. From the number of truck 116
trips, the annual truck VMT, external social costs, and total truck operating costs can be 117
calculated for each alternative. All trucks are assumed to travel round-trip. 118 119
3.12 External/Social Costs 120 There are four key external social costs that arise from heavy-duty truck VMT: 1) 121 congestion/delay costs, 2) emissions costs, 3) accident costs, and 4) infrastructure maintenance 122
costs. 123 The delay savings which arise from reduced truck VMT are difficult to estimate, given 124
that the savings depend on the freeway’s total demand. While it should be noted that there may 125 be some delay reduction from the proposed mixed-goods service, no quantification of these 126 savings are included here. 127
To quantify reductions in harmful GHG’s, a CO2 emissions rate of 22.2 lbs/gallon diesel 128
fuel is used (4). A constant fuel economy of 10 mpg has been assumed over the analysis period. 129 By reducing truck VMT, the number of freeway accidents will likely be reduced. To 130 quantify this cost, a truck accident rate is used. This rate is derived from 2006 statistics for the 131
United States (5). The average cost of all heavy truck accidents in 2005 was $91,112 (6). The 132 annual accident cost is given by the product of these two factors together with the annual truck 133
VMT. Half of this resulting cost is allocated to FedEx annual operating cost, and half to society. 134 The road damage unit cost due to urban truck travel is taken as $0.074 per truck-mile (7). 135 136
3.13 Operating and Labor Costs 137 Truck operating costs per-mile were given as $3.28/mile in an unpublished report by R. 138
Rai (whose previous work is continued in this study), but because this per-mile cost included 139
driver costs, a lower value of $2.70 is used so that the per-mile trucking cost only includes fuel, 140
maintenance, and ownership/depreciation costs. The diesel fuel cost component is assumed to 141 follow the same trend as gasoline costs, rising to roughly $7.50/gal by 2035 (8). The per-hour 142 cost includes FedEx driver wages, which are taken as $22/hr (9), and both health insurance and 143 worker’s compensation, leading to an hourly cost of $31 (10). Hourly handling labor cost is 144 assumed to be the same as FedEx driver costs ($31/hr). Other components of driving cost 145
include $8 bridge tolls, a $0.25/mile congestion charge, and a 20% carbon tax on all VMT 146 traveled. All three of these charges are expected to be implemented by 2035 in the Bay Area (3). 147 The congestion charge is only applied to the freeway travel component of each truck trip, and the 148
K. Sivakumaran, X.Y. Lu, M. Hanson 12
bridge toll cost only to those trucks which utilize links 4a6a and 4a7a (only these two 149
links require travel across the Bay Bridge). 150 Difficulties arise in approximating BART operating cost due to data limitations; through 151
communications with BART’s Financial Planning Office, an operating cost of $250/per car-hr, 152
was obtained. This value is simply the total annual operating cost by the total annual car-hours. 153 However, the operating cost for trains, which possess economies of scale, is required. Therefore, 154 rather than directly apply the given operating cost per car-hr, the following methodology is 155 applied for cost estimation. First, using BART’s weekly operating schedule and each route’s 156 roundtrip travel time (2), the total number of trains required for each route during a given time 157
period can be given by the equation: # 𝑜𝑓 𝑡𝑟𝑎𝑖𝑛𝑠 = 𝑟𝑜𝑢𝑛𝑑 𝑡𝑟𝑖𝑝 𝑡𝑖𝑚𝑒
ℎ𝑒𝑎𝑑𝑤𝑎𝑦. This number is then 158
multiplied against the length of the service time period and then summed over all time periods to 159 eventually obtain the total train-hours accumulated over the week. Dividing BART’s weekly 160 operating cost (11) by the total weekly train-hrs, the hourly train operating cost is found to be 161
roughly $1,500/train-hr. By dividing the hourly train operating cost by the hourly car operating 162 cost, the average train length is found to be six cars. Assuming that BART freight trains will not 163 require the same level of amenities, e.g. air conditioning, as BART passenger trains, a reduced 164
operating cost value of $1,250/hr is used for a six-car train. Because the relationship between 165
train length 𝑛 and cost should show economies of scale, it is assumed that the hourly operating 166
cost can be expressed as the concave function 1000𝑛1/8 , where 2 ≤ 𝑛 ≤ 10 . Using this 167 function, the hourly freight train operating cost ranges from $1,090 for a 2-car train to $1,330 for 168
a 10-car train. 169 Total BART train hours are determined similar to total truck VMT. The number of 170
BART cars required is simply given by nk = Dk
KBART, where D = demand for route k , in 171
[containers], and KBART = BART car capacity, in [containers]. From the number of cars required, 172
one can determine the number of trains required by dividing the required number of cars by the 173
10-car limit; the appropriate operating cost value (according to the function above) is then 174 assigned to the required trains and their respective lengths. A single train’s daily operating cost 175
is given by the product of its hourly operating cost and its total time in service. The annual 176 operating cost is found by summing the operating cost over all trains and working days for the 177 year. 178 179
3.14 Security 180 All FedEx goods, once containerized at their origin distribution center, are not opened 181
until reaching their destination distribution center. Furthermore, all FedEx goods leaving the 182 Oakland Regional Hub must pass airport security. Thus, it is reasonable to expect that FedEx 183 containers, which meet stringent airport security requirements, will satisfy any requirements 184
imposed by BART. 185
186
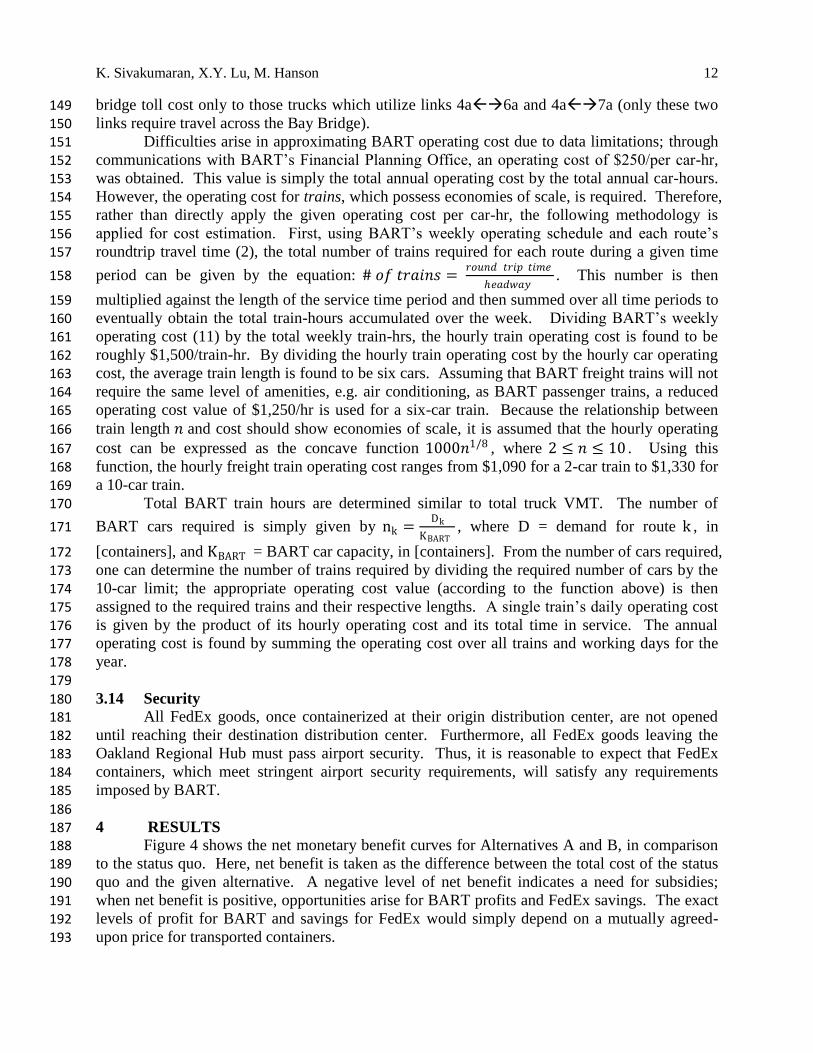
4 RESULTS 187 Figure 4 shows the net monetary benefit curves for Alternatives A and B, in comparison 188
to the status quo. Here, net benefit is taken as the difference between the total cost of the status 189 quo and the given alternative. A negative level of net benefit indicates a need for subsidies; 190 when net benefit is positive, opportunities arise for BART profits and FedEx savings. The exact 191 levels of profit for BART and savings for FedEx would simply depend on a mutually agreed-192 upon price for transported containers. 193
K. Sivakumaran, X.Y. Lu, M. Hanson 13
For Alternative A, which requires minimal capital investment, some subsidy is required 194
throughout most of the timeline. However, after 2035, the simulation suggests mixed-goods 195 service can become profitable, and remain that way, as container demand grows. Furthermore, 196 tremendous savings in truck VMT can be achieved; the cumulative truck VMT savings over the 197
analysis period amounts to nearly 70 million VMT. This translates to nearly 80,000 tons of CO2 198 emission savings, as well as nearly $6M in accident savings and more than $5M in maintenance 199 savings. 200
For Alternative B, which requires larger capital investment but eliminates one of the 201 transshipments required in Alternative A, even greater savings in truck VMT are achieved. The 202
cumulative VMT savings amount to more than 120 million VMT, which translates to nearly 203 140,000 tons of CO2 emission savings. Accident and maintenance savings totaled more than 204 $10M and $9M, respectively. Perhaps most interestingly, no subsidy is ever required for 205 Alternative B. Thus, if container demand is sufficient, BART mixed-goods service can both be 206
profitable for BART and beneficial for FedEx from solely a fiscal perspective. Assuming a 207 discount rate of 5%, the accumulated amount of total cost savings compared to the status quo 208
amounts to nearly $100M. Some of these savings can be channeled towards recovering the 209 initial capital investment, as well as towards improvements in passenger service, which can 210
further incentivize transit ridership. Note that a clear trend is established in the results: the 211 higher the demand level, the more profitable mixed-goods operation becomes. 212
213
214 FIGURE 4 Net benefit curves for Alternatives A and B, in comparison to the Status Quo. 215 216
However, note that there exist other social benefits not included here, such as reductions 217 in noise and particulate matter as well as more economic land use. Furthermore, improvements 218 to BART, such as side tracks for train bypass and adoption of new control technologies, could 219 benefit both cargo movers and passengers by increasing system capacity and reducing travel time. 220 Transit ridership could rise as a result. Government agencies must weigh all of these benefits 221
-4,000
-2,000
0
2,000
4,000
6,000
8,000
2020 2025 2030 2035 2040
Mon
etary
Ben
efit
s ($
1,0
00)
Year
Net Benefit, Alt. A
Net Benefit, Alt. B
K. Sivakumaran, X.Y. Lu, M. Hanson 14
against any required subsidies or start-up costs in order to determine whether or not mixed-goods 222
service is worthy of fiscal support. 223 224
5 CONCLUDING REMARKS 225 The presented economic feasibility study shows significant promise for exploring the 226 possibility of mixed-goods service on passenger-rail systems. Both service alternatives show a 227 trend suggesting that the higher the demand, the lower the level of subsidy required. 228 Furthermore, with significant capital investment, BART can actually derive profit from this 229 service while the air freight carrier (FedEx, in this case study) can derive savings. The fact that 230
economic feasibility is so closely linked to demand should motivate researchers to explore ways 231 to tap into other demand sources so that mixed-goods service can become both profitable and 232 environmentally sustainable. 233
There are several future extensions to this study which will be pursued. Given the high 234
capital costs required for Alternative B, the government may be unwilling to fully cover capital 235 expenditures for a service that primarily benefits a single private company, such as FedEx. Thus, 236
it is of critical importance to determine a valid estimate of initial capital and other “start-up” 237 costs, such that all future benefits can be discounted and compared against the full costs of the 238
project. Furthermore, future studies should also consider latent demand, perhaps by assuming 239 that cars fill the available road space left by the removal of trucks from freeway corridors; doing 240 so would provide a more valid estimate of social benefits. For the preceding analysis, latent 241
demand was assumed negligible because the daily truck flows were found to utilize a marginal 242 percentage of freeway capacity (~1%). Future studies should also examine in greater detail the 243
logistical issues inherent in mixed-goods service, including non-interference with existing 244 passenger transport operations and routine maintenance activities. For example, because 245 morning freight service would fall outside of current BART operating hours, analysis should also 246
include the additional overhead and logistical costs required during this time period. 247
There are also other elements not included thus far that can contribute to the success of 248 mixed-goods service. One such critical element is the inclusion of other cargo movers besides 249 FedEx as BART “customers”. Once other customers have been identified, overlaps in demand 250
patterns across different customers can lead to even greater economies of scale for BART cargo 251 transport, particularly in comparison with truck transport. Some other potential demand sources 252
in the Bay Area include UPS containers, produce from farmers, and containerized/non-253 containerized products from the Port of Oakland. However, there will also be additional costs 254
when accommodating various demand sources due to their different characteristics. Another 255 element not quantified here is the higher level of reliability afforded by rail transport in 256 comparison to truck transport. Including this benefit to cargo movers may further skew the 257 results in favor of mixed-goods service. 258 Note that the objective of this paper is not to make a case for implementation of mixed-259
goods service, but rather to make a case for analysis of mixed-goods service, and the results of 260 this initial economic feasibility study make a strong case for future research in this area. The 261
results should be of particular interest to other urban areas across the U.S., such as Los Angeles, 262 Washington D. C., New York, and Chicago, where passenger rail systems exist in proximity to 263 major air cargo terminals. Some of these systems may possess particularly favorable 264 characteristics towards mixed-goods movement, such as intermodal transfer stations, containers 265 which can interface between multiple modes, and standard gauge rails. 266
267
K. Sivakumaran, X.Y. Lu, M. Hanson 15
ACKNOWLEDGEMENT 268 This project is sponsored by UCTC (University of California Transportation Center) and 269
the State of California Business, Transportation and Housing Agency, Department of 270 Transportation. The contents of this report reflect the views of the authors who are responsible 271
for the facts and the accuracy of the data presented herein. The contents do not necessarily reflect 272 the official views or policies of the State of California. This paper does not constitute a standard, 273 specification, or regulation. All the ideas presented here are for research purposes. Neither 274 BART nor FedEx carries any commitment or liability for any content of this paper. 275
Active participation of BART Engineer Richard Lu, FedEx Express Managers Faisal 276
Zaman and Michael Graham, Engineer Run Zhou, as well as support from Tom Messer, Michele 277 Fell, and Marcus Evans of Caltrans Goods Movement and Colette Armao of Caltrans 278 Aeronautics is gratefully acknowledged. The demand data used in all calculations has been 279 scaled, and is not true FedEx demand data. 280
284 285 286
REFERENCES 287
288
1. Metropolitan Transportation Commission (MTC). Regional Goods Movement Study for 289
the San Francisco Bay Area: Final Summary Report. 2004. 290
2. Bay Area Rapid Transit (BART). BART Trip Planner. www.bart.gov/. Accessed April 291
19, 2009. 292
3. Metropolitan Transportation Commission (MTC). Change In Motion: Transportation 293
2035 Plan for the Bay Area. 2008. 294
4. Office of Transportation and Air Quality. Calculating Greenhouse Gas Emissions: Key 295
Facts and Figures. United States Environmental Protection Agency. 2008. 296
5. Federal Motor Carrier Safety Administration (FMCSA). Motor Carrier Safety Progress 297