35
1 2007 English Language Arts (ELA)
| Date post: | 03-Jan-2016 |
| Category: |
Documents |
| Upload: | gwendolyn-mccoy |
| View: | 224 times |
| Download: | 1 times |

1
2007 English Language Arts (ELA)
2
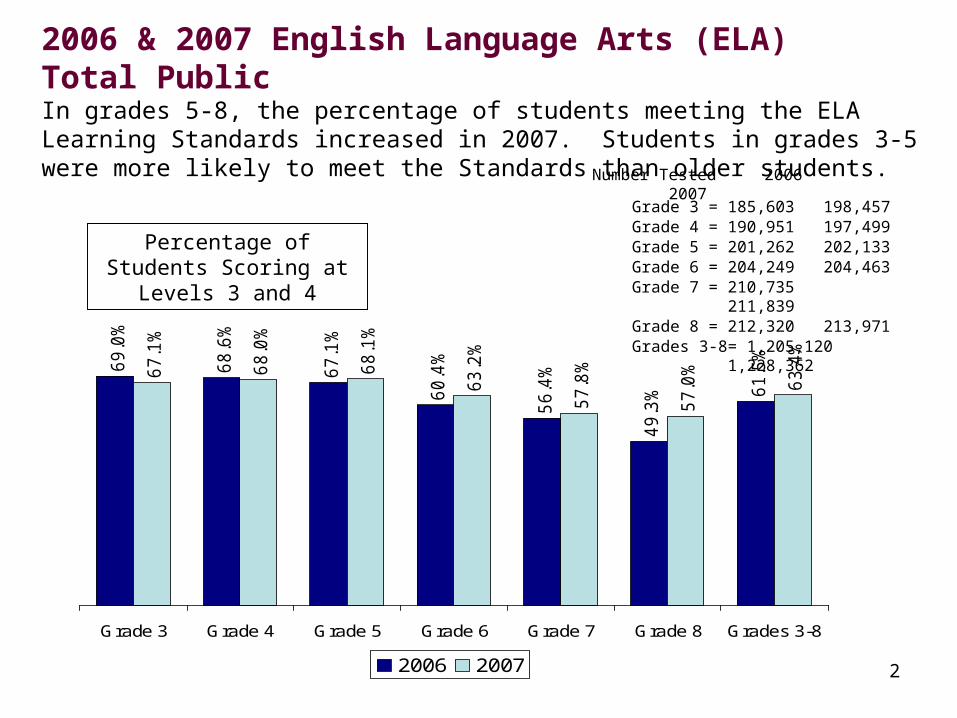
2006 & 2007 English Language Arts (ELA) Total Public In grades 5-8, the percentage of students meeting the ELA Learning Standards increased in 2007. Students in grades 3-5 were more likely to meet the Standards than older students.
69
.0%
68
.6%
67
.1%
60
.4%
56
.4%
49
.3% 6
1.5
%
67
.1%
68
.0%
68
.1%
63
.2%
57
.8%
57
.0%
63
.4%
Grade 3 Grade 4 Grade 5 Grade 6 Grade 7 Grade 8 Grades 3-8
2006 2007
Percentage of Students Scoring at Levels 3 and 4
Grade 3 = 185,603 198,457Grade 4 = 190,951 197,499Grade 5 = 201,262 202,133Grade 6 = 204,249 204,463Grade 7 = 210,735 211,839Grade 8 = 212,320 213,971Grades 3-8= 1,205,120 1,228,362
Number Tested 2006 2007
3
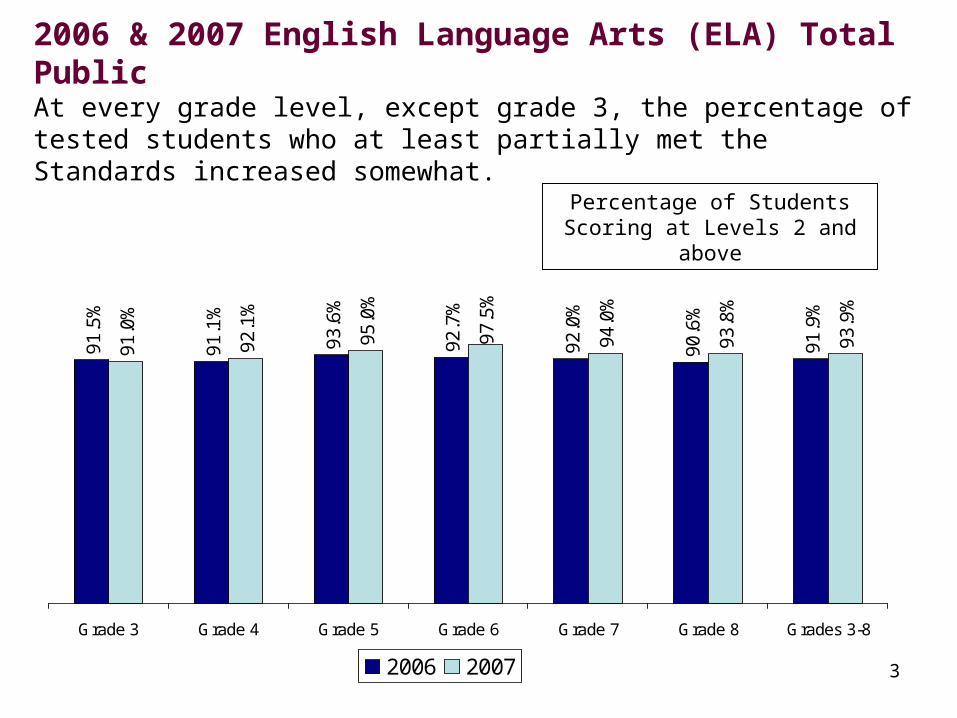
2006 & 2007 English Language Arts (ELA) Total PublicAt every grade level, except grade 3, the percentage of tested students who at least partially met the Standards increased somewhat.
91
.5%
91
.1%
93
.6%
92
.7%
92
.0%
90
.6%
91
.9%
91
.0%
92
.1%
95
.0%
97
.5%
94
.0%
93
.8%
93
.9%
Grade 3 Grade 4 Grade 5 Grade 6 Grade 7 Grade 8 Grades 3-8
2006 2007
Percentage of Students Scoring at Levels 2 and above
4
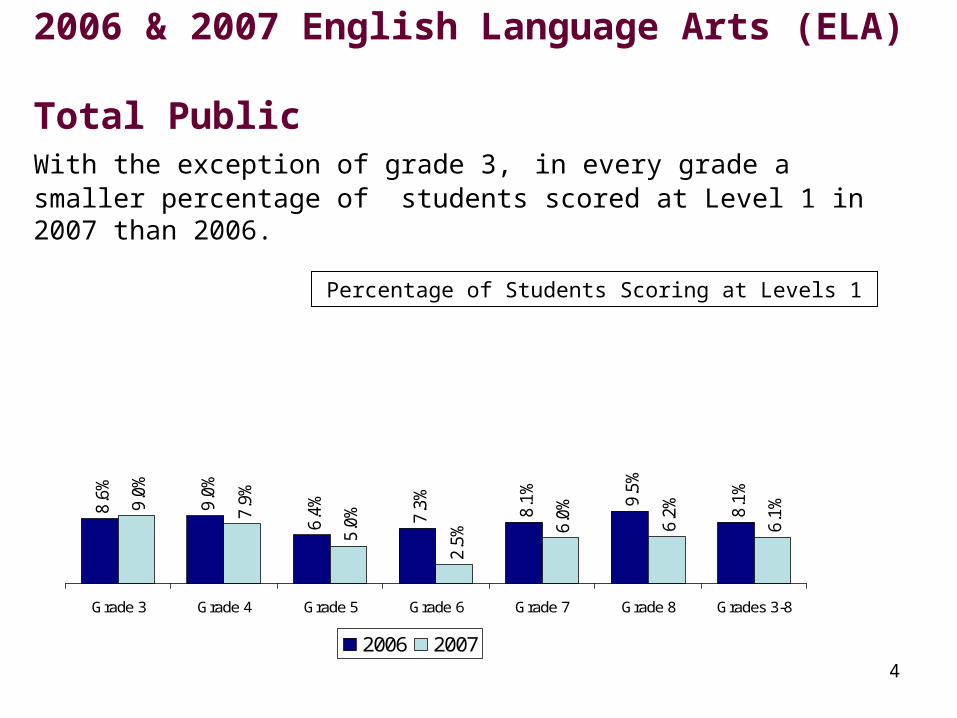
2006 & 2007 English Language Arts (ELA) Total PublicWith the exception of grade 3, in every grade a smaller percentage of students scored at Level 1 in 2007 than 2006.
8.6
%
9.0
%
6.4
%
7.3
%
8.1
%
9.5
%
8.1
%
9.0
%
7.9
%
5.0
%
2.5
% 6.0
%
6.2
%
6.1
%
Grade 3 Grade 4 Grade 5 Grade 6 Grade 7 Grade 8 Grades 3-8
2006 2007
Percentage of Students Scoring at Levels 1
5
669
666
663
656
650667
665
661
655
655
652665
Grade 3 Grade 4 Grade 5 Grade 6 Grade 7 Grade 8
2006 2007
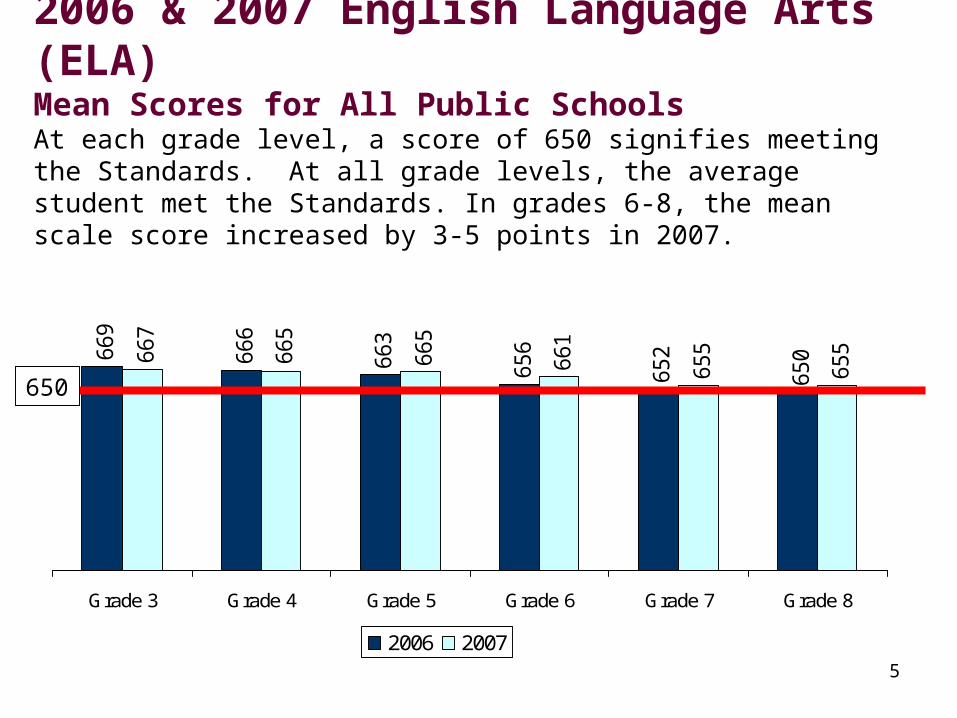
2006 & 2007 English Language Arts (ELA)Mean Scores for All Public SchoolsAt each grade level, a score of 650 signifies meeting the Standards. At all grade levels, the average student met the Standards. In grades 6-8, the mean scale score increased by 3-5 points in 2007.
650

6
2006 & 2007 English Language Arts
The effect of increased participation of LEP students is illustrated by removing LEP students
from the analyses for 2006 and 2007
7
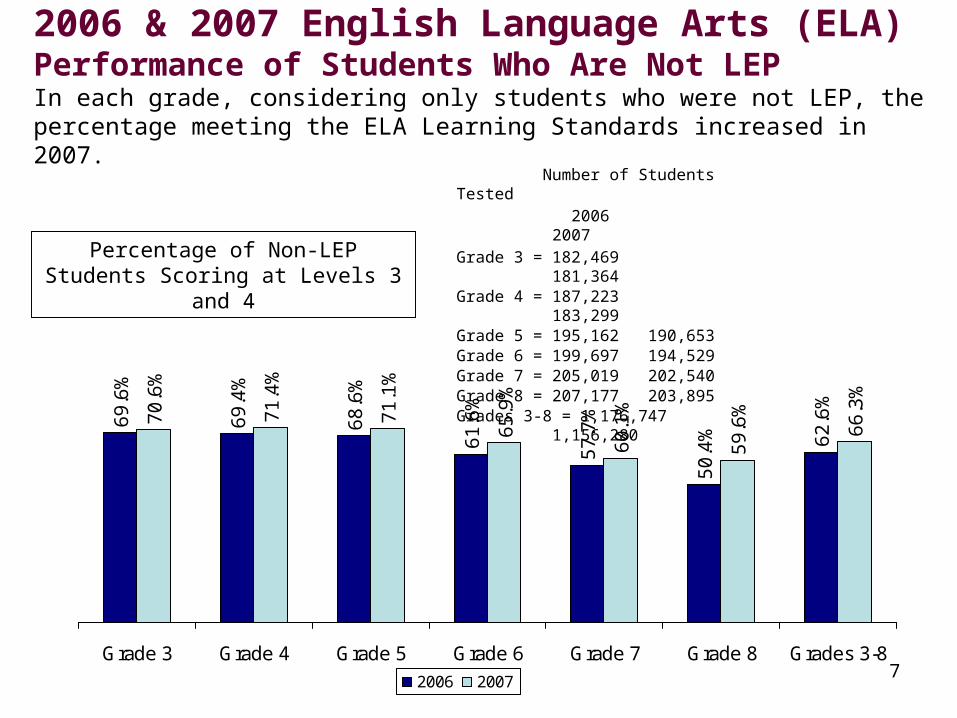
2006 & 2007 English Language Arts (ELA) Performance of Students Who Are Not LEPIn each grade, considering only students who were not LEP, the percentage meeting the ELA Learning Standards increased in 2007.
69
.6%
69
.4%
68
.6%
61
.6%
57
.7%
50
.4% 62
.6%
70
.6%
71
.4%
71
.1%
65
.9%
60
.1%
59
.6%
66
.3%
Grade 3 Grade 4 Grade 5 Grade 6 Grade 7 Grade 8 Grades 3-8
2006 2007
Percentage of Non-LEP Students Scoring at Levels 3 and 4
Number of Students Tested 2006 2007Grade 3 = 182,469 181,364Grade 4 = 187,223 183,299Grade 5 = 195,162 190,653Grade 6 = 199,697 194,529Grade 7 = 205,019 202,540Grade 8 = 207,177 203,895Grades 3-8 = 1,176,747 1,156,280
8
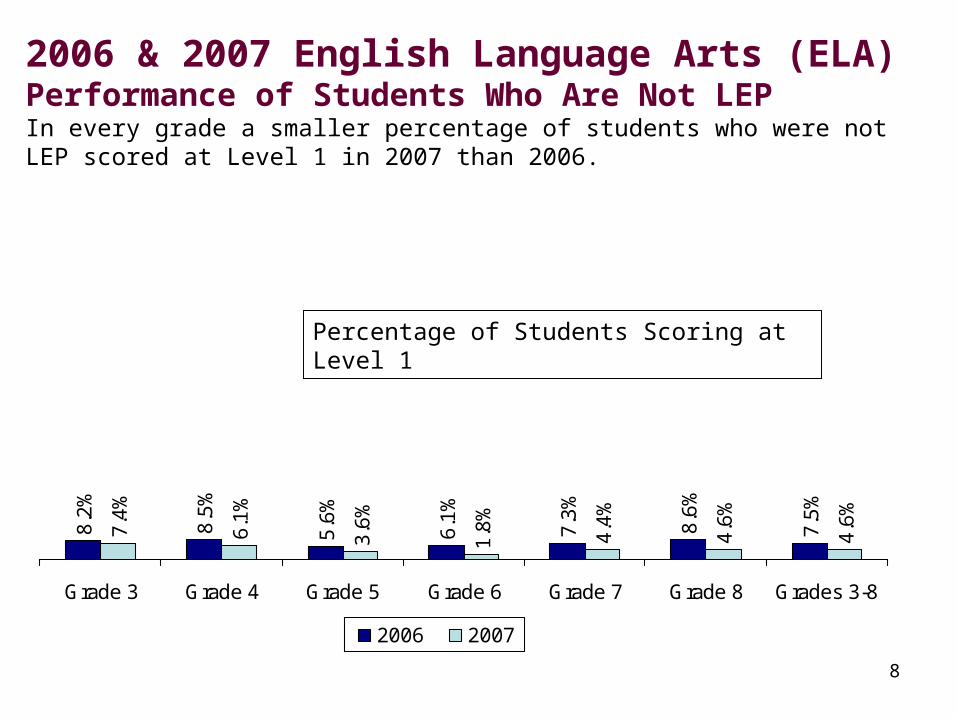
2006 & 2007 English Language Arts (ELA) Performance of Students Who Are Not LEP In every grade a smaller percentage of students who were not LEP scored at Level 1 in 2007 than 2006.
7.4
%
6.1
%
3.6
%
1.8
%
4.4
%
4.6
%
4.6
%
7.5
%
8.6
%
7.3
%
6.1
%
5.6
%
8.5
%
8.2
%
Grade 3 Grade 4 Grade 5 Grade 6 Grade 7 Grade 8 Grades 3-8
2006 2007
Percentage of Students Scoring at Level 1
9
669
666
670
668
664
664
651
658
654
658
657
668
Grade 3 Grade 4 Grade 5 Grade 6 Grade 7 Grade 8
2006 2007
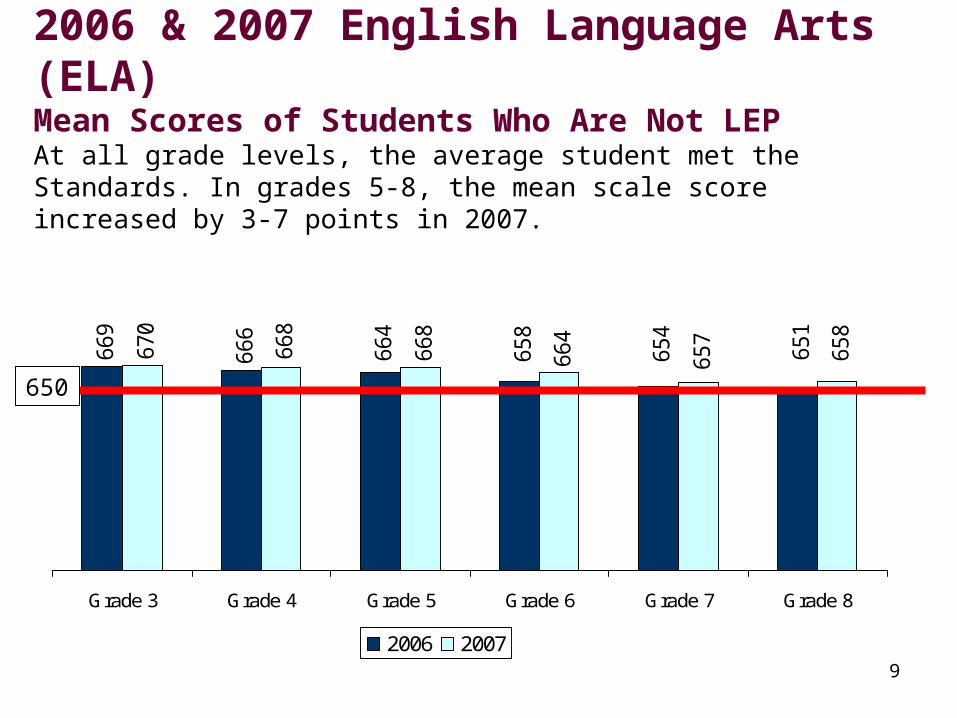
2006 & 2007 English Language Arts (ELA)Mean Scores of Students Who Are Not LEPAt all grade levels, the average student met the Standards. In grades 5-8, the mean scale score increased by 3-7 points in 2007.
650
10
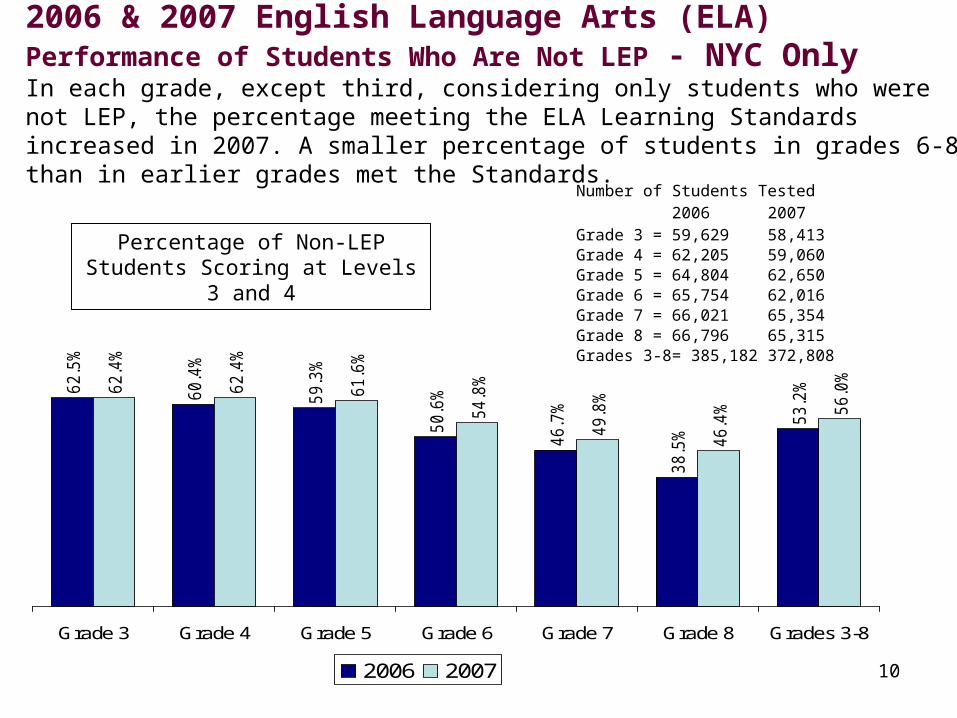
2006 & 2007 English Language Arts (ELA) Performance of Students Who Are Not LEP - NYC OnlyIn each grade, except third, considering only students who were not LEP, the percentage meeting the ELA Learning Standards increased in 2007. A smaller percentage of students in grades 6-8 than in earlier grades met the Standards.
62.5
%
60.4
%
59.3
%
50.6
%
46.7
%
38.5
%
53.2
%62.4
%
62.4
%
61.6
%
54.8
%
49.8
%
46.4
% 56.0
%
Grade 3 Grade 4 Grade 5 Grade 6 Grade 7 Grade 8 Grades 3-8
2006 2007
Percentage of Non-LEP Students Scoring at Levels 3 and 4
Number of Students Tested2006 2007
Grade 3 = 59,629 58,413Grade 4 = 62,205 59,060Grade 5 = 64,804 62,650Grade 6 = 65,754 62,016Grade 7 = 66,021 65,354Grade 8 = 66,796 65,315Grades 3-8= 385,182 372,808
11
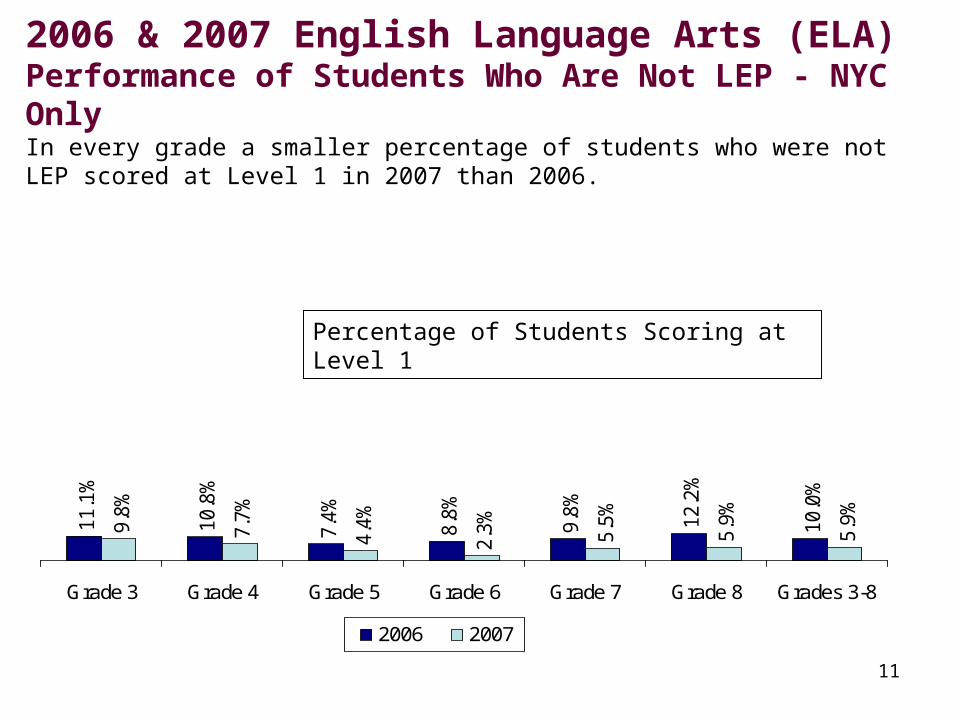
2006 & 2007 English Language Arts (ELA) Performance of Students Who Are Not LEP - NYC Only In every grade a smaller percentage of students who were not LEP scored at Level 1 in 2007 than 2006.
9.8
%
7.7
%
4.4
%
2.3
%
5.5
%
5.9
%
5.9
%
10.0
%
12.2
%
9.8
%
8.8
%
7.4
%
10.8
%
11.1
%
Grade 3 Grade 4 Grade 5 Grade 6 Grade 7 Grade 8 Grades 3-8
2006 2007
Percentage of Students Scoring at Level 1
12
662
658
662
661
656
656
641
648
644
648
650
660
Grade 3 Grade 4 Grade 5 Grade 6 Grade 7 Grade 8
2006 2007
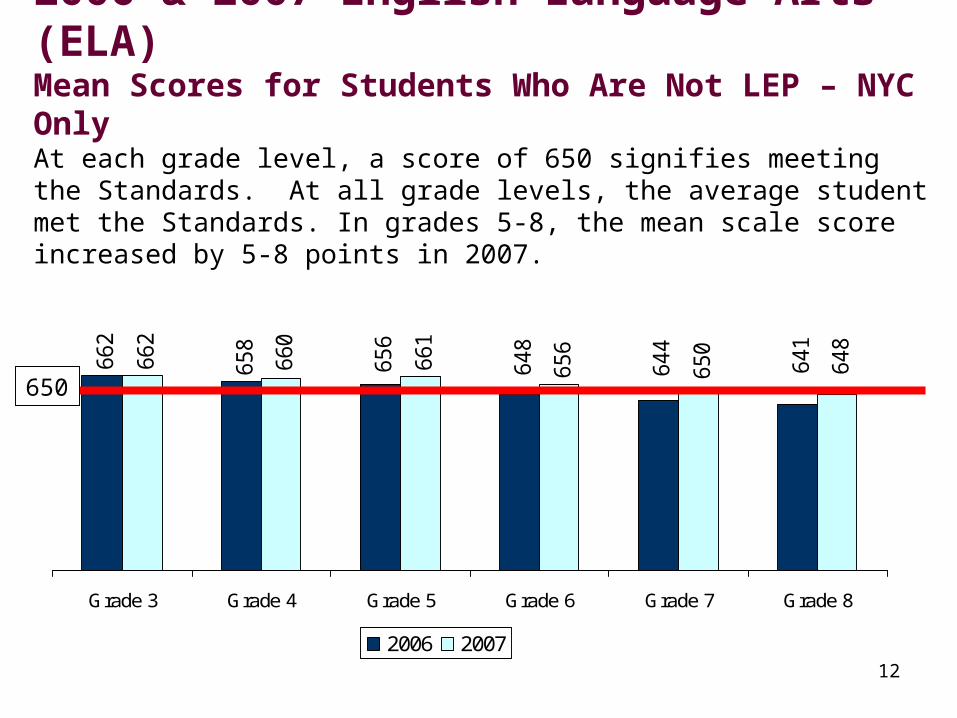
2006 & 2007 English Language Arts (ELA)Mean Scores for Students Who Are Not LEP – NYC OnlyAt each grade level, a score of 650 signifies meeting the Standards. At all grade levels, the average student met the Standards. In grades 5-8, the mean scale score increased by 5-8 points in 2007.
650

13
2006 & 2007 English Language Arts
Performance of Limited English Proficient Students
14
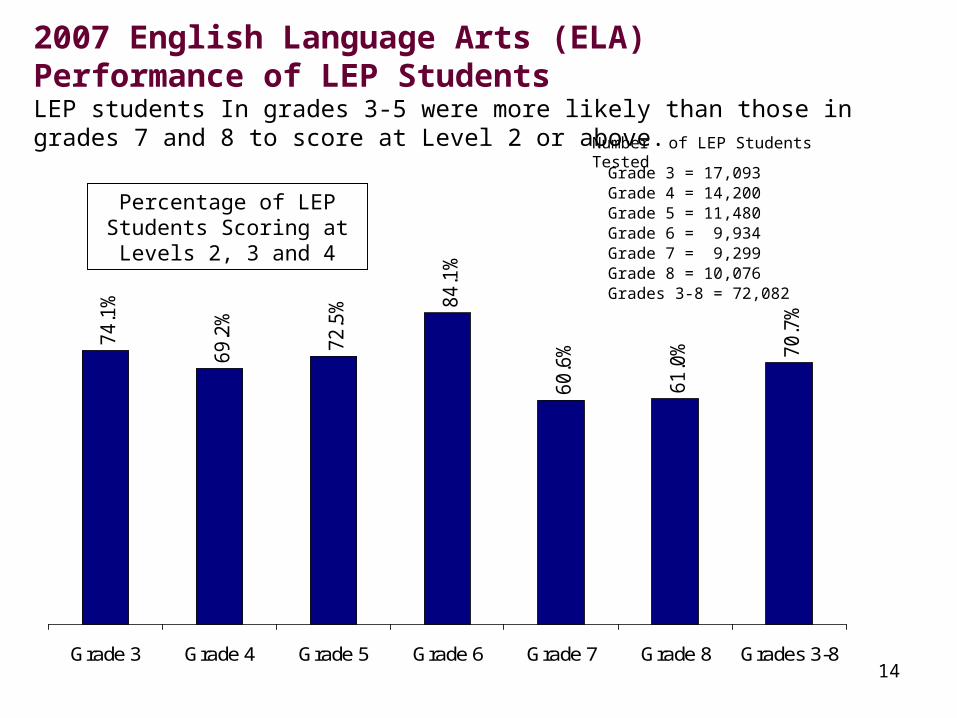
2007 English Language Arts (ELA) Performance of LEP StudentsLEP students In grades 3-5 were more likely than those in grades 7 and 8 to score at Level 2 or above.
74.1
%
69.2
%
72.5
% 84.1
%
60.6
%
61.0
% 70.7
%
Grade 3 Grade 4 Grade 5 Grade 6 Grade 7 Grade 8 Grades 3-8
Percentage of LEP Students Scoring at Levels
2, 3 and 4
Grade 3 = 17,093Grade 4 = 14,200Grade 5 = 11,480Grade 6 = 9,934Grade 7 = 9,299Grade 8 = 10,076Grades 3-8 = 72,082
Number of LEP Students Tested

15
2006 & 2007 English Language Arts
Results by Gender
16
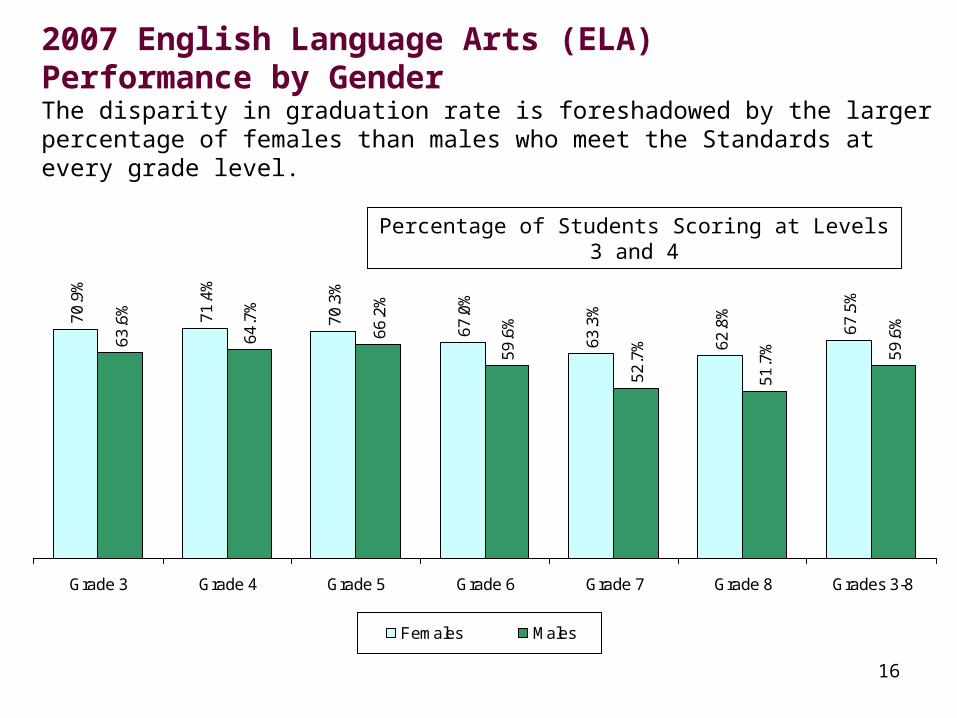
2007 English Language Arts (ELA) Performance by GenderThe disparity in graduation rate is foreshadowed by the larger percentage of females than males who meet the Standards at every grade level.
70
.9%
71
.4%
70
.3%
67
.0%
63
.3%
62
.8%
67
.5%
63
.6%
64
.7%
66
.2%
59
.6%
52
.7%
51
.7% 59
.6%
Grade 3 Grade 4 Grade 5 Grade 6 Grade 7 Grade 8 Grades 3-8
Females Males
Percentage of Students Scoring at Levels 3 and 4
17
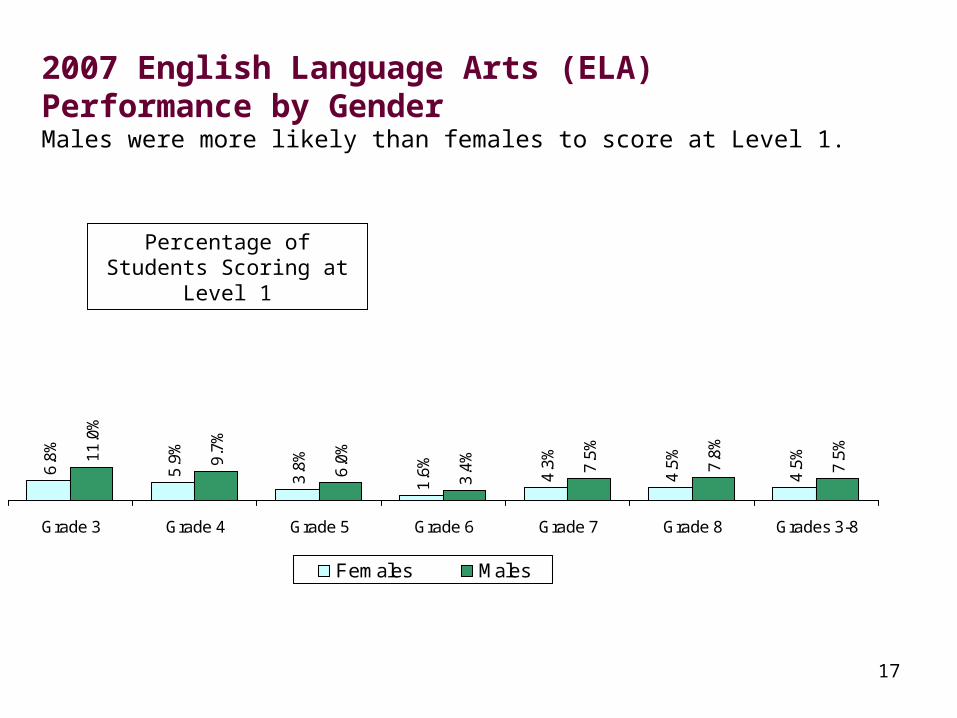
2007 English Language Arts (ELA) Performance by GenderMales were more likely than females to score at Level 1.
6.8
%
5.9
%
3.8
%
1.6
%
4.3
%
4.5
%
4.5
%11
.0%
9.7
%
6.0
%
3.4
%
7.5
%
7.8
%
7.5
%
Grade 3 Grade 4 Grade 5 Grade 6 Grade 7 Grade 8 Grades 3-8
Females Males
Percentage of Students Scoring at Level 1

18
2006 & 2007English Language Arts
Results by
Need/Resource Capacity Category
19
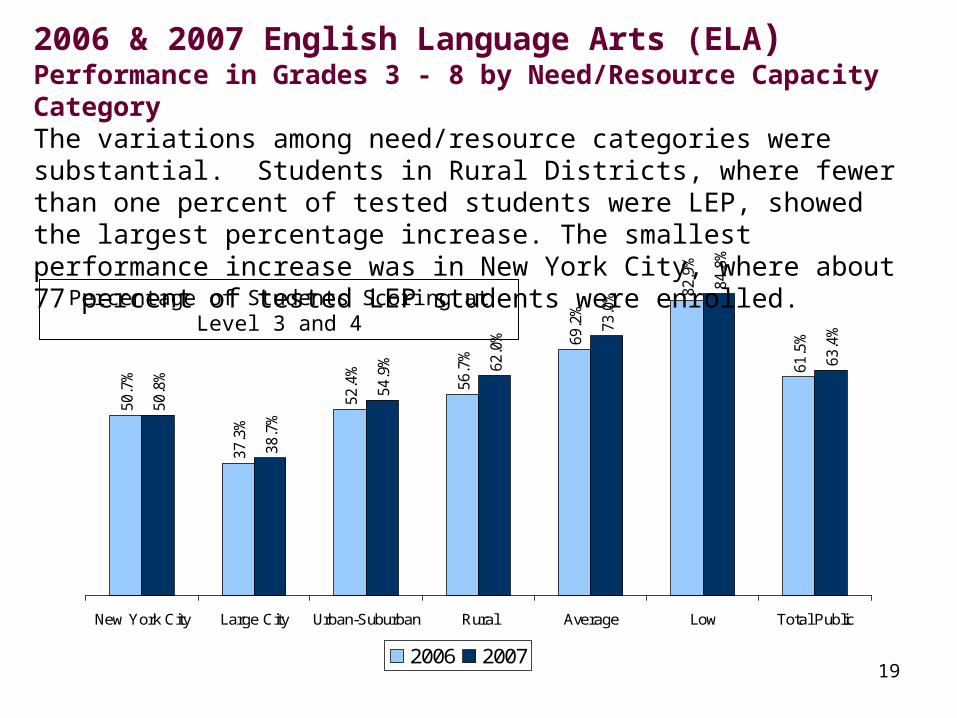
50.7
%
37.3
%
52.4
%
56.7
%
69.2
%
82.9
%
61.5
%
50.8
%
38.7
%
54.9
% 62.0
%
73.0
%
84.8
%
63.4
%
New York City Large City Urban-Suburban Rural Average Low Total Public
2006 2007
Percentage of Students Scoring at Level 3 and 4
2006 & 2007 English Language Arts (ELA)Performance in Grades 3 - 8 by Need/Resource Capacity CategoryThe variations among need/resource categories were substantial. Students in Rural Districts, where fewer than one percent of tested students were LEP, showed the largest percentage increase. The smallest performance increase was in New York City, where about 77 percent of tested LEP students were enrolled.
20
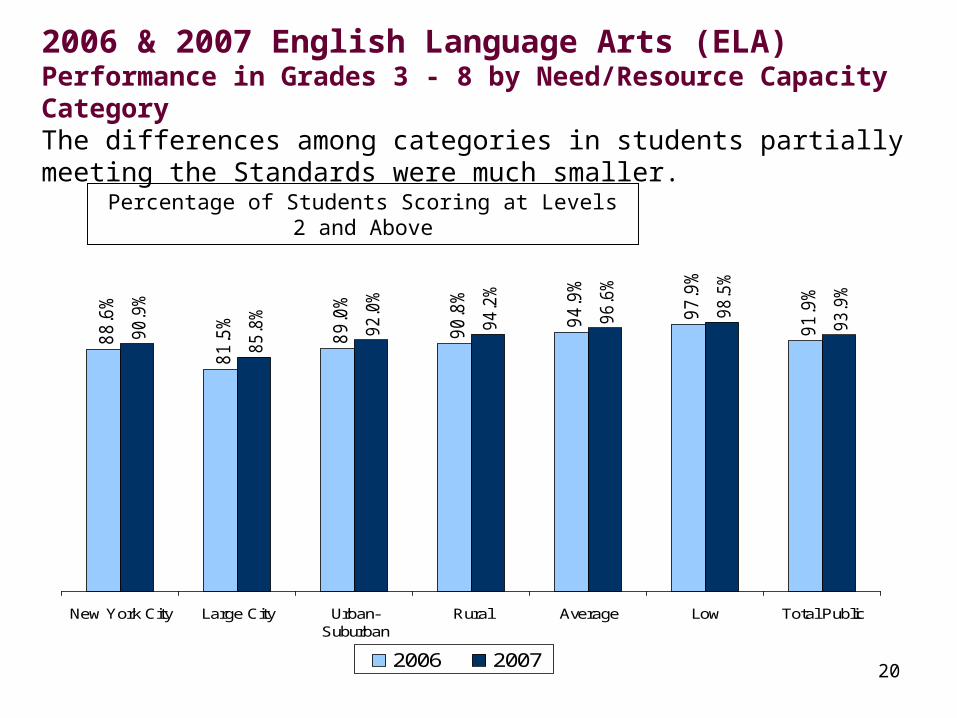
88.6
%
81.5
%
89.0
%
90.8
%
94.9
%
97.9
%
91.9
%
90.9
%
85.8
%
92.0
%
94.2
%
96.6
%
98.5
%
93.9
%
New York City Large City Urban-Suburban
Rural Average Low Total Public
2006 2007
Percentage of Students Scoring at Levels 2 and Above
2006 & 2007 English Language Arts (ELA)Performance in Grades 3 - 8 by Need/Resource Capacity CategoryThe differences among categories in students partially meeting the Standards were much smaller.
21
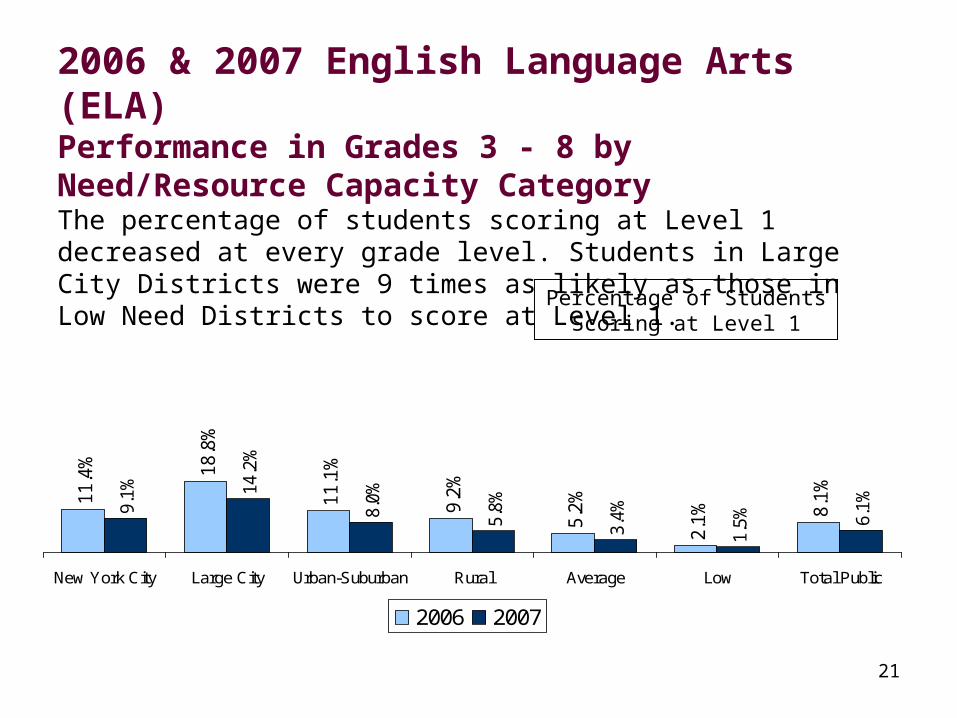
11.4
% 18.8
%
11.1
%
9.2
%
5.2
%
2.1
% 8.1
%
9.1% 14
.2%
8.0%
5.8%
3.4%
1.5% 6.
1%
New York City Large City Urban-Suburban Rural Average Low Total Public
2006 2007
Percentage of Students Scoring at Level 1
2006 & 2007 English Language Arts (ELA)Performance in Grades 3 - 8 by Need/Resource Capacity CategoryThe percentage of students scoring at Level 1 decreased at every grade level. Students in Large City Districts were 9 times as likely as those in Low Need Districts to score at Level 1.
22
2006 & 2007 English Language Arts
Results by
Racial/Ethnic Group
23
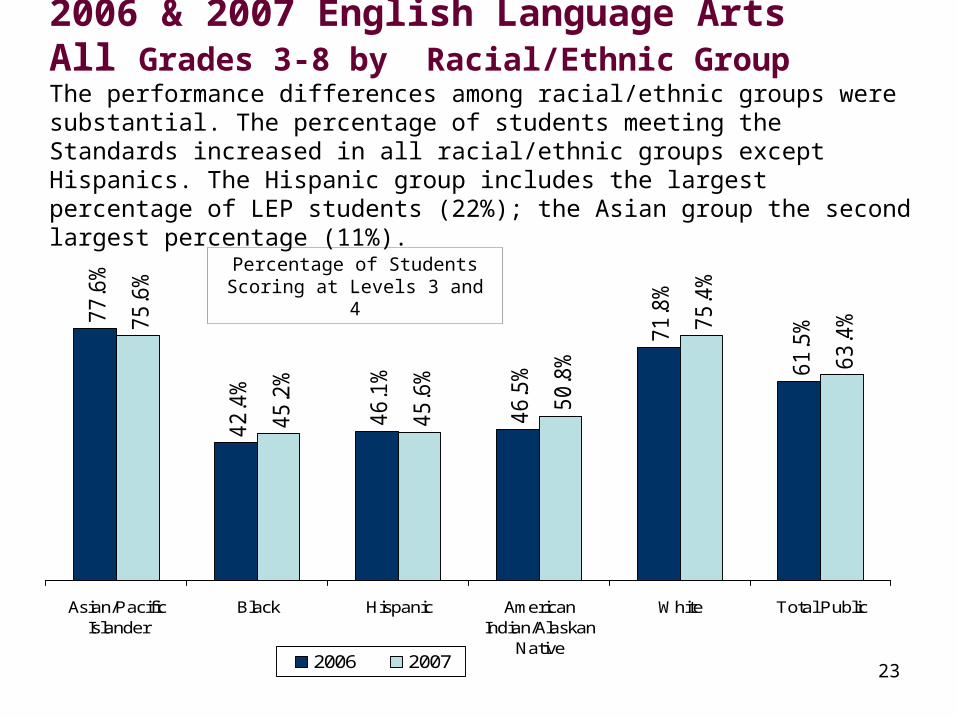
2006 & 2007 English Language Arts All Grades 3-8 by Racial/Ethnic Group The performance differences among racial/ethnic groups were substantial. The percentage of students meeting the Standards increased in all racial/ethnic groups except Hispanics. The Hispanic group includes the largest percentage of LEP students (22%); the Asian group the second largest percentage (11%).
77.6
%
42.4
%
46.1
%
46.5
%
71.8
%
61.5
%75.6
%
45.2
%
45.6
%
50.8
%
75.4
%
63.4
%
Asian/PacificIslander
Black Hispanic AmericanIndian/Alaskan
Native
White Total Public
2006 2007
Percentage of Students Scoring at Levels 3 and 4
24
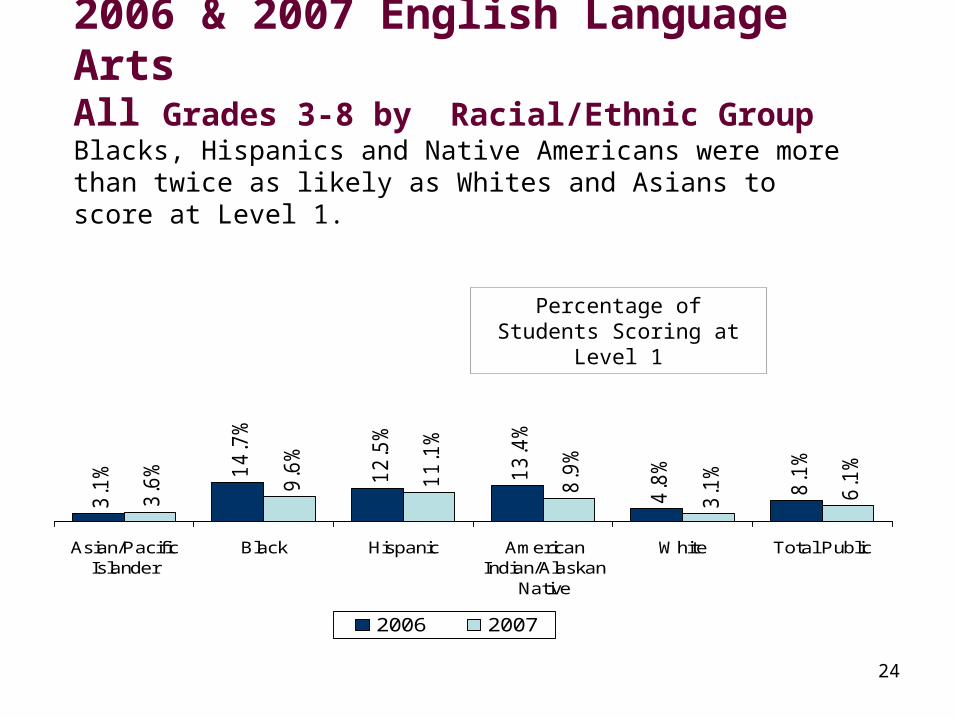
2006 & 2007 English Language Arts All Grades 3-8 by Racial/Ethnic Group Blacks, Hispanics and Native Americans were more than twice as likely as Whites and Asians to score at Level 1.
3.1
% 14
.7%
12
.5%
13
.4%
4.8
%
8.1
%
3.6
%
9.6
%
11
.1%
8.9
%
3.1
%
6.1
%
Asian/PacificIslander
Black Hispanic AmericanIndian/Alaskan
Native
White Total Public
2006 2007
Percentage of Students Scoring at Level 1

25
2006 & 2007 English Language Arts
Results for the Big 5 Cities
26
50.7
%
30.1
% 38.4
%
34.0
%
51.1
% 61.5
%
50.8
%
34.5
%
38.4
%
37.3
% 46.7
%
63.4
%
New York City Buffalo Rochester Syracuse Yonkers Total Public
2006 2007
Percentage of Students Scoring at Levels 3 and 4
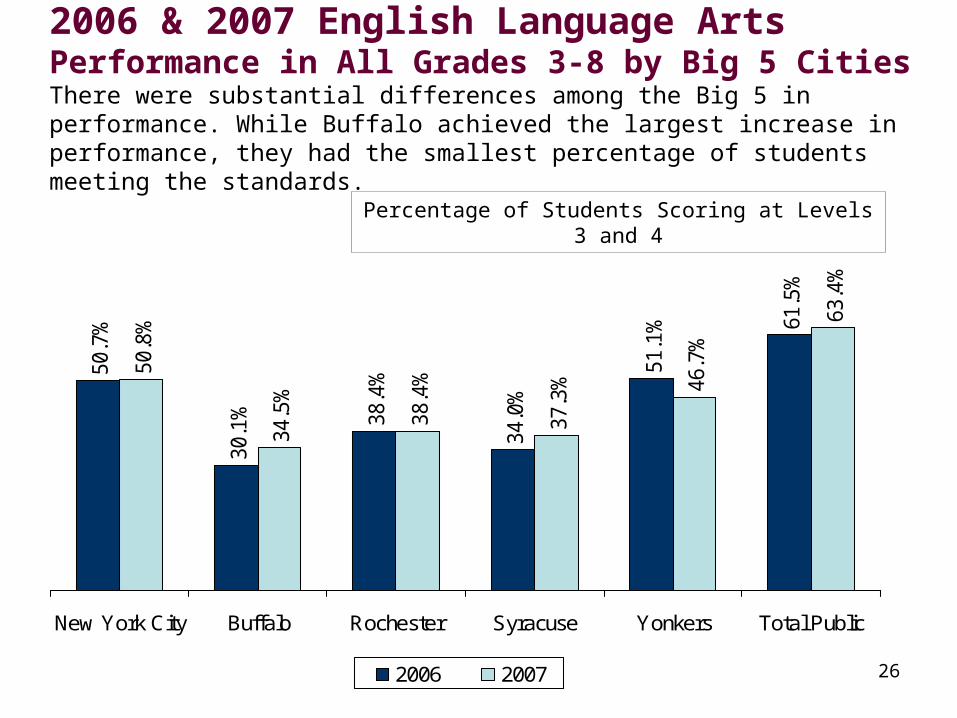
2006 & 2007 English Language ArtsPerformance in All Grades 3-8 by Big 5 CitiesThere were substantial differences among the Big 5 in performance. While Buffalo achieved the largest increase in performance, they had the smallest percentage of students meeting the standards.
27
11
.4% 2
3.6
%
16
.3%
21
.8%
11
.7%
8.1
%
9.1
% 16
.7%
13
.7%
14
.8%
10
.4%
6.1
%
New York City Buffalo Rochester Syracuse Yonkers Total Public
2006 2007
Percentage of Students Scoring at Level 1
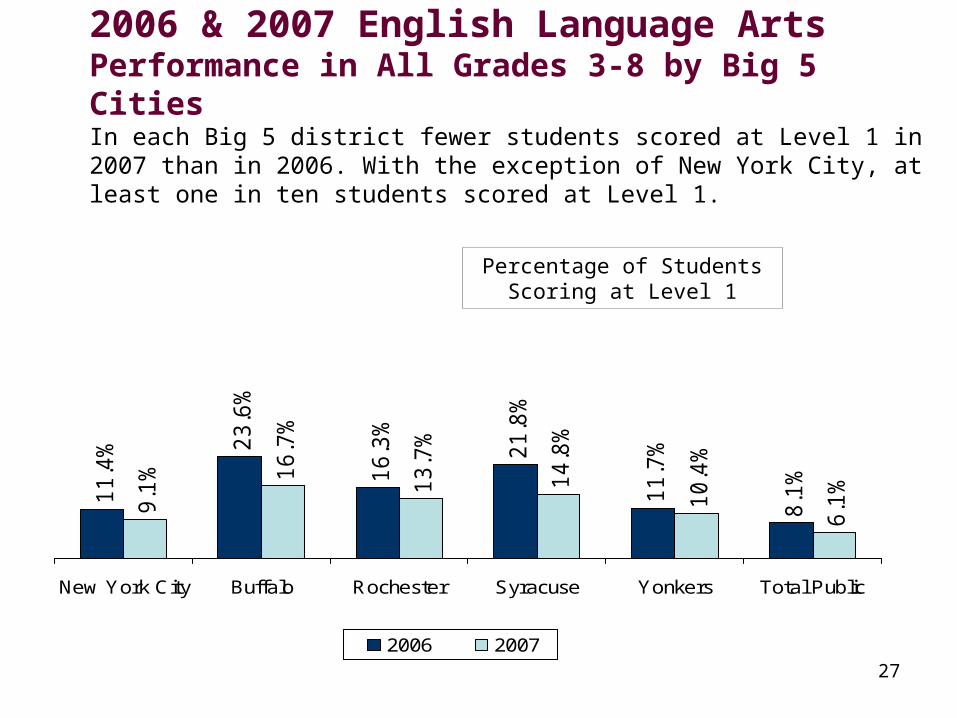
2006 & 2007 English Language ArtsPerformance in All Grades 3-8 by Big 5 CitiesIn each Big 5 district fewer students scored at Level 1 in 2007 than in 2006. With the exception of New York City, at least one in ten students scored at Level 1.
28
2006 & 2007 English Language Arts
Results by Students with Disabilities
29
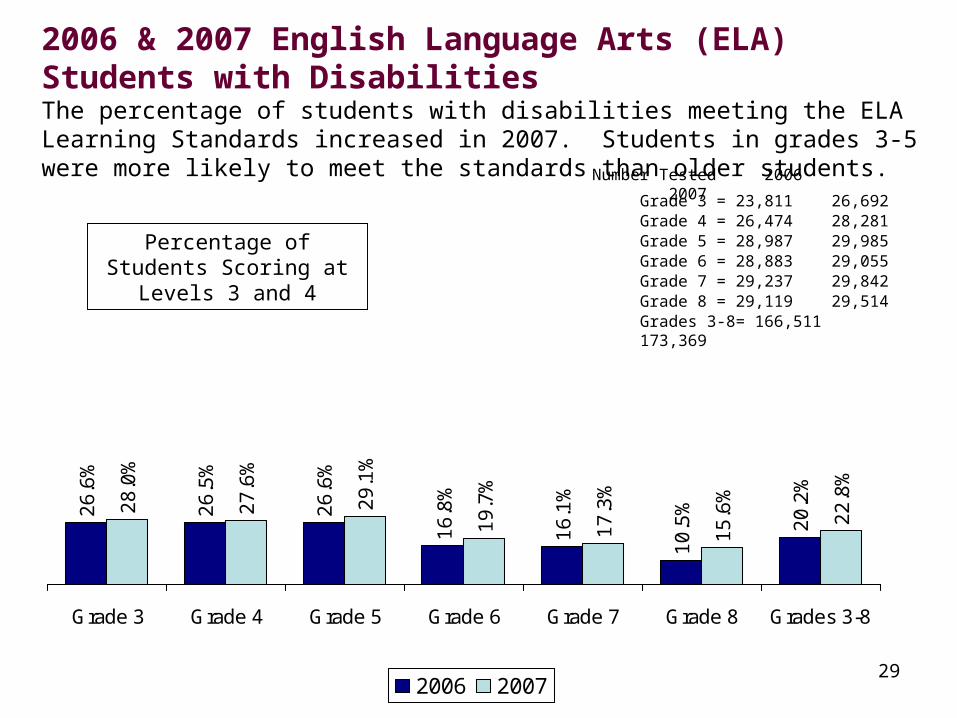
2006 & 2007 English Language Arts (ELA)Students with DisabilitiesThe percentage of students with disabilities meeting the ELA Learning Standards increased in 2007. Students in grades 3-5 were more likely to meet the standards than older students.
26
.6%
26
.5%
26
.6%
16
.8%
16
.1%
10
.5%
20
.2%
28
.0%
27
.6%
29
.1%
19
.7%
17
.3%
15
.6%
22
.8%
Grade 3 Grade 4 Grade 5 Grade 6 Grade 7 Grade 8 Grades 3-8
2006 2007
Percentage of Students Scoring at Levels 3 and 4
Grade 3 = 23,811 26,692Grade 4 = 26,474 28,281Grade 5 = 28,987 29,985Grade 6 = 28,883 29,055Grade 7 = 29,237 29,842Grade 8 = 29,119 29,514Grades 3-8= 166,511 173,369
Number Tested 2006 2007
30
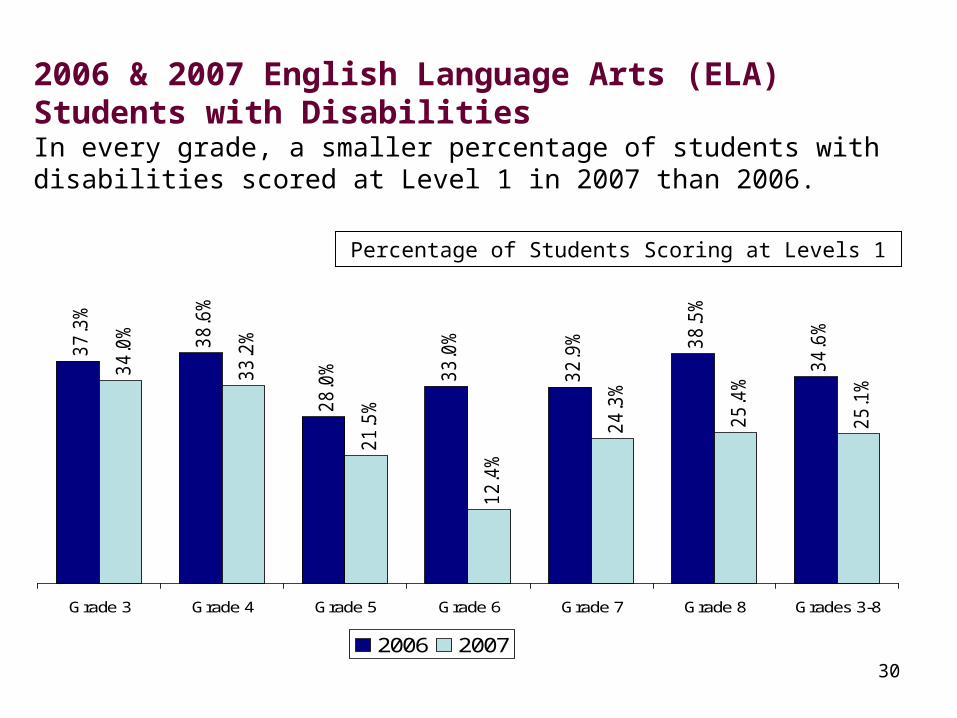
2006 & 2007 English Language Arts (ELA)Students with DisabilitiesIn every grade, a smaller percentage of students with disabilities scored at Level 1 in 2007 than 2006.
37.3
%
38.6
%
28.0
% 33.0
%
32.9
% 38.5
%
34.6
%
34.0
%
33.2
%
21.5
%
12.4
%
24.3
%
25.4
%
25.1
%
Grade 3 Grade 4 Grade 5 Grade 6 Grade 7 Grade 8 Grades 3-8
2006 2007
Percentage of Students Scoring at Levels 1
31
621
622
612
6086
28
631
628
617
618628
6106
25
Grade 3 Grade 4 Grade 5 Grade 6 Grade 7 Grade 8
2006 2007
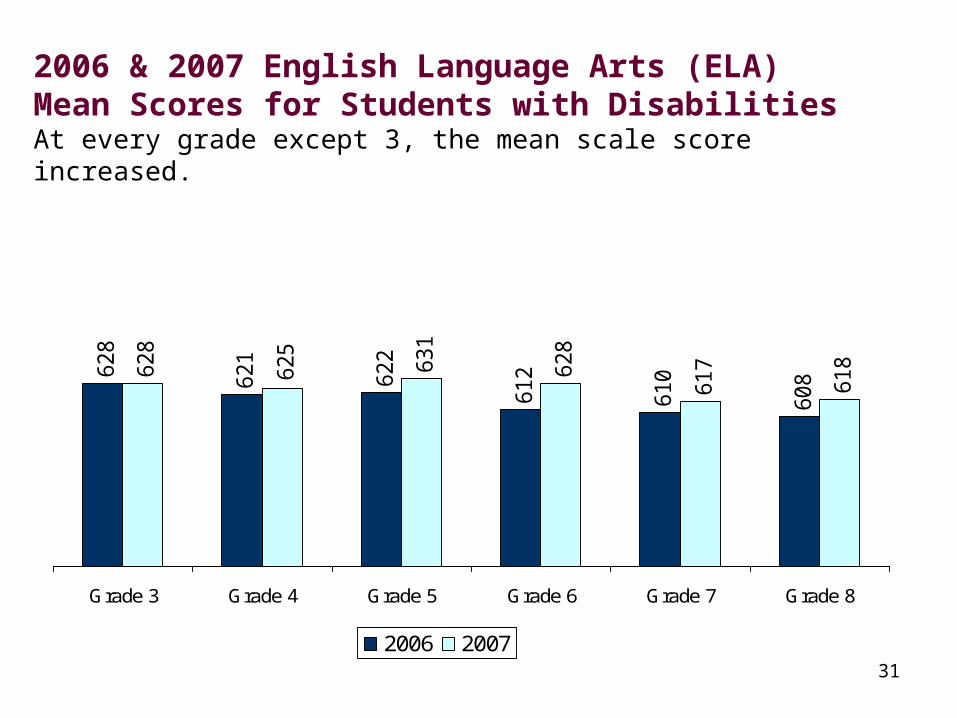
2006 & 2007 English Language Arts (ELA)Mean Scores for Students with DisabilitiesAt every grade except 3, the mean scale score increased.
32
15
.2%
12
.6%
15
.1%
13
.5% 2
2.6
%
40
.3%
20
.2%
17
.5%
10
.6% 17
.1%
17
.0% 2
6.0
%
44
.5%
22
.8%
New York City Large City Urban-Suburban
Rural Average Low Total Public
2006 2007
Percentage of Students Scoring at Level 3 and 4
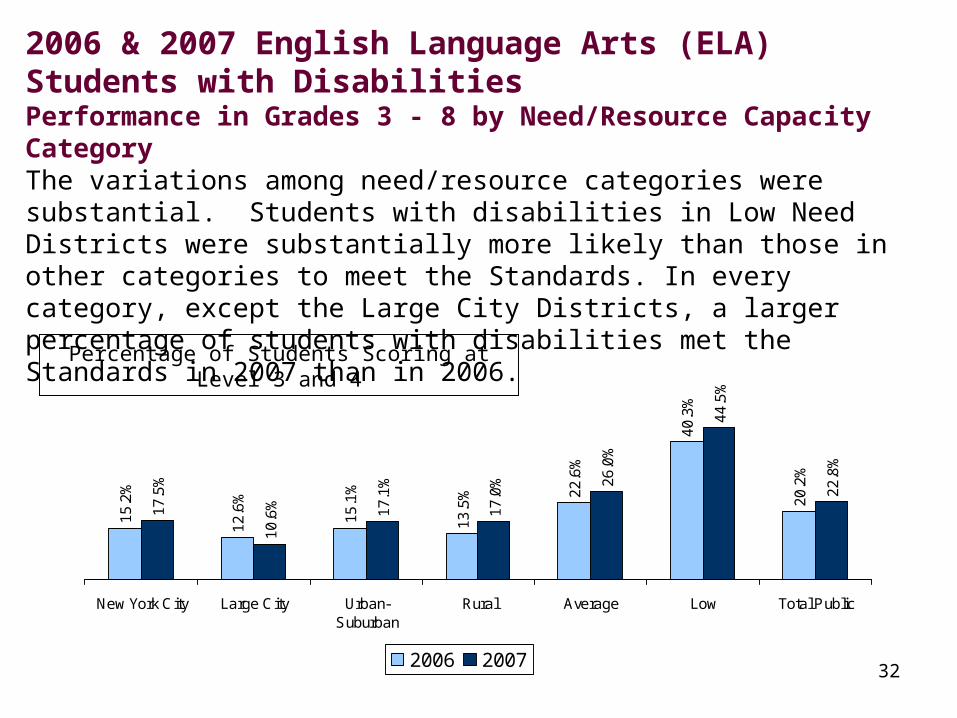
2006 & 2007 English Language Arts (ELA)Students with DisabilitiesPerformance in Grades 3 - 8 by Need/Resource Capacity CategoryThe variations among need/resource categories were substantial. Students with disabilities in Low Need Districts were substantially more likely than those in other categories to meet the Standards. In every category, except the Large City Districts, a larger percentage of students with disabilities met the Standards in 2007 than in 2006.
33
40
.8%
45
.8%
40
.8%
40
.4%
28
.5%
14
.5%
34
.6%
30.6
% 39.2
%
30.3
%
27.2
%
19.3
%
9.7%
25.1
%
New York City Large City Urban-Suburban Rural Average Low Total Public
2006 2007
Percentage of Students Scoring at Level 1
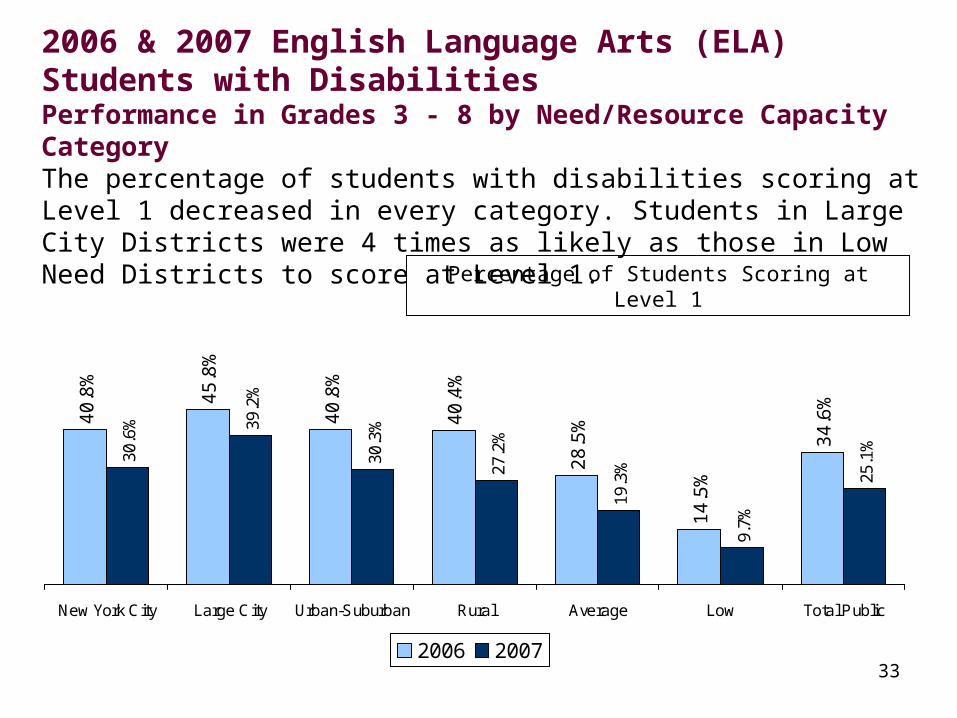
2006 & 2007 English Language Arts (ELA)Students with DisabilitiesPerformance in Grades 3 - 8 by Need/Resource Capacity CategoryThe percentage of students with disabilities scoring at Level 1 decreased in every category. Students in Large City Districts were 4 times as likely as those in Low Need Districts to score at Level 1.
34
15
.2%
8.4
%
19
.5%
10
.3%
9.3
%
20
.2%
17
.5%
10
.0%
9.6
%
12
.1%
11
.5% 2
2.8
%
New York City Buffalo Rochester Syracuse Yonkers Total Public
2006 2007
Percentage of Students Scoring at Levels 3 and 4
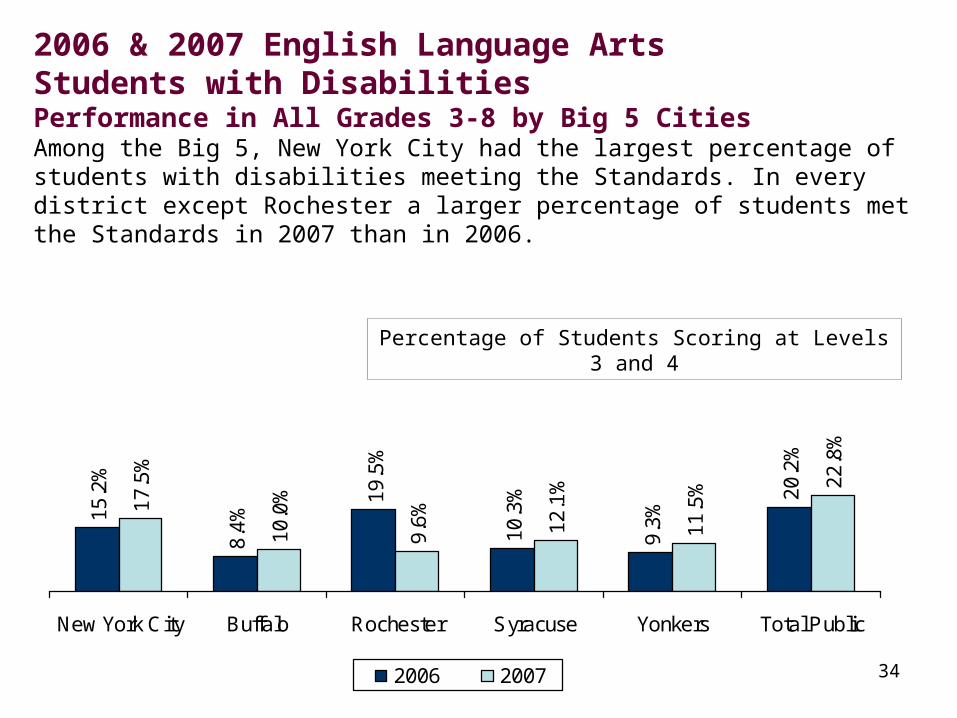
2006 & 2007 English Language ArtsStudents with DisabilitiesPerformance in All Grades 3-8 by Big 5 CitiesAmong the Big 5, New York City had the largest percentage of students with disabilities meeting the Standards. In every district except Rochester a larger percentage of students met the Standards in 2007 than in 2006.
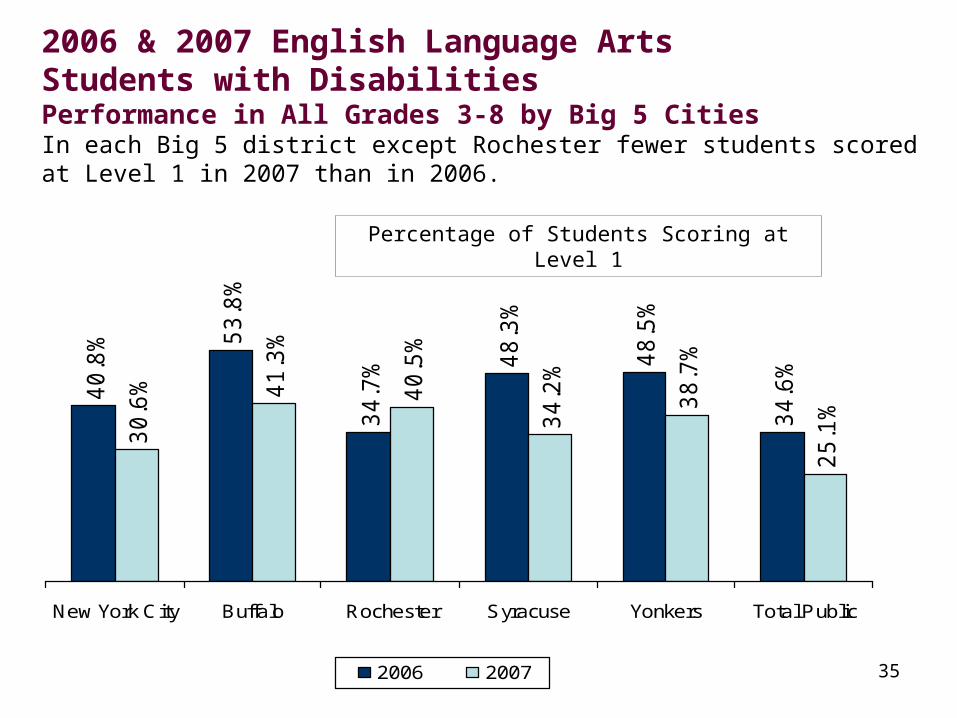
35
40
.8% 5
3.8
%
34
.7% 4
8.3
%
48
.5%
34
.6%
30
.6% 41
.3%
40
.5%
34
.2%
38
.7%
25
.1%
New York City Buffalo Rochester Syracuse Yonkers Total Public
2006 2007
Percentage of Students Scoring at Level 1
2006 & 2007 English Language ArtsStudents with DisabilitiesPerformance in All Grades 3-8 by Big 5 CitiesIn each Big 5 district except Rochester fewer students scored at Level 1 in 2007 than in 2006.


