2011 Updated Arkansas Global Rice Model 1 By Eric J. Wailes and Eddie Chavez 2 SP 01 2011 April 2011 Department of Agricultural Economics and Agribusiness Division of Agriculture Room 217, Agriculture Building University of Arkansas Fayetteville, AR 72701 1 Update of Revised Arkansas Global Rice Model by Eric Wailes and Eddie Chavez, July 2010. 2 Respectively, are L.C. Carter Professor, and Research Associate at the Department of Agricultural Economics, the University of Arkansas. This updated document benefitted from the assistance of Ranjit Mane and Deborah Brown, graduate students in the Public Policy Ph.D. program at the University of Arkansas.
Transcript
2011 Updated Arkansas Global Rice Model1
By
Eric J. Wailes and Eddie Chavez2
SP 01 2011 April 2011
Department of Agricultural Economics and Agribusiness
Division of Agriculture Room 217, Agriculture Building
University of Arkansas Fayetteville, AR 72701
1 Update of Revised Arkansas Global Rice Model by Eric Wailes and Eddie Chavez, July 2010. 2 Respectively, are L.C. Carter Professor, and Research Associate at the Department of Agricultural Economics, the University of Arkansas. This updated document benefitted from the assistance of Ranjit Mane and Deborah Brown, graduate students in the Public Policy Ph.D. program at the University of Arkansas.
1
Abstract
The Arkansas Global Rice Model is based on a multi-country statistical simulation and
econometric framework. The model is disaggregated by five world regions: Africa, the Americas, Asia,
Europe, and Oceania. Each region includes country models which have a supply sector, a demand sector,
a trade, stocks and price linkage equations. All equations used in this model are estimated using
econometric procedures or identities. Estimates are based upon a set of explanatory variables including
exogenous macroeconomic factors such as income, population, inflation rate, technology development,
and especially, government determined policy variables which reflect the various mechanisms by which
countries intervene in their rice sector economy. Individual country models are linked through net trade
to recognize the interdependence of countries in the world rice economy.
2
Table of Contents Abstract ......................................................................................................................................................................... 1 Structure of the Arkansas Global Rice Model ............................................................................................................... 4 Theoretical Structure of the Model ................................................................................................................................ 5
General Equations of the Model .................................................................................................................................... 8 U.S Rice Model ......................................................................................................................................................... 8
U.S. Model Aggregate ........................................................................................................................................... 8 ARKANSAS SUB MODEL ................................................................................................................................ 11 CALIFORNIA SUB MODEL ............................................................................................................................ 12 LOUISIANA SUB MODEL ............................................................................................................................... 12 MISSISSIPPI SUB MODEL .............................................................................................................................. 13 MISSOURI SUB MODEL ................................................................................................................................. 14 TEXAS SUB MODEL ....................................................................................................................................... 14 U.S. POLICY VARIABLES ............................................................................................................................... 15
AUSTRALIA MODEL ........................................................................................................................................... 15 BANGLADESH Model Aggregate ......................................................................................................................... 16 INDIA Model .......................................................................................................................................................... 17 INDONESIA Model ................................................................................................................................................ 18 MALAYSIA Model ................................................................................................................................................. 18 MYANMAR Model Aggregate ............................................................................................................................... 19 PHILIPPINES Model .............................................................................................................................................. 20 THAILAND Model ................................................................................................................................................. 20 VIETNAM Model Aggregate .................................................................................................................................. 21 CAMBODIA Model Aggregate .............................................................................................................................. 22 CHINA Model ......................................................................................................................................................... 23 HONG KONG Model .............................................................................................................................................. 25 JAPAN Model ......................................................................................................................................................... 25 SOUTH KOREA Model .......................................................................................................................................... 27 TAIWAN Model...................................................................................................................................................... 27 ARGENTINA MODEL ........................................................................................................................................... 28 BRAZIL MODEL .................................................................................................................................................... 29 CANADA Model ..................................................................................................................................................... 30 MEXICO Model ...................................................................................................................................................... 30 URUGUAY Model .................................................................................................................................................. 31 IRAN Model ............................................................................................................................................................ 31 IRAQ Model ............................................................................................................................................................ 32 PAKISTAN Model .................................................................................................................................................. 33 SAUDI ARABIA Model ......................................................................................................................................... 33 EGYPT Model ......................................................................................................................................................... 34 SOUTH AFRICA Model ......................................................................................................................................... 35 COTE D’ IVOIRE Model ........................................................................................................................................ 35 NIGERIA Model ..................................................................................................................................................... 36 SENEGAL Model .................................................................................................................................................... 36 GHANA Model ....................................................................................................................................................... 37 CAMEROON Model ............................................................................................................................................... 38 MOZAMBIQUE Model .......................................................................................................................................... 38 GUINEA Model ...................................................................................................................................................... 39 KENYA Model ........................................................................................................................................................ 39 TANZANIA Model ................................................................................................................................................. 40 SIERRA LEONE Model.......................................................................................................................................... 40 MALI Model ........................................................................................................................................................... 41
3
EUROPEAN UNION-27 Model ............................................................................................................................. 42 TURKEY Model...................................................................................................................................................... 43 FIVE (5) REST-OF-THE-WORLD (ROW) REGIONAL MODELS: .................................................................... 44 REST-OF-AFRICA MODEL .................................................................................................................................. 44 REST-OF-AMERICAS MODEL ............................................................................................................................ 45 REST-OF-ASIA MODEL ....................................................................................................................................... 45 REST-OF-EUROPE MODEL ................................................................................................................................. 46 REST-OF-OCEANIA MODEL ............................................................................................................................... 46 TOTAL WORLD .................................................................................................................................................... 47
Senegal, Sierra Leone, South Africa, Tanzania and Rest-of Africa;
AMERICAS: Argentina, Brazil, Canada, Mexico, United States, Uruguay and Rest-of Americas;
5
ASIA: Bangladesh, Cambodia, China, Hong Kong, India, Indonesia, Iran, Iraq, Japan, Malaysia,
Myanmar, Pakistan, the Philippines, Saudi Arabia, South Korea, Taiwan, Thailand, Turkey, Vietnam and
Rest-of-Asia;
EUROPE: EU 27 and Rest-of Europe; and
OCEANIA: Australia and Rest-of-Oceania
The Arkansas Rice Model has been used to provide baseline projections for the international
FAPRI model as well as examine a variety of market and policy scenarios related to world, regional, and
U.S. rice economies. The model has been extended and revised to provide more detailed information on
the implications of global and individual country agricultural policy reforms such as trade liberalization
and food security.. The model is now further developed to examine the influence of a wider range of
countries and rice policies that affect international rice trade. The model is continually updated with
respect to data and model specifications.
Theoretical Structure of the Model Major components of a country or regional model include a supply sector, a demand sector, trade,
stocks and price linkage equations. Computationally, the simulation model solves for the set of farm
level, retail level, and export (import) prices that simultaneously clears all markets (long and medium
grain) in a given year for a given set of exogenous factors. Due to the dynamics of supply and demand,
such market clearing prices must be obtained recursively for each future year simulated.
Supply Sector This study assumes that the rice supply determines by profit-maximizing producers i.e., rice
producers maximize their net revenue received subject to the technical and regulatory constraints imposed
by their production function. Solving the producer's problem yields first-order conditions identifying the
optimal level of inputs such that the value of the marginal product of the input will be equal to the price of
the input. The relationships are expressed as functions of expected output prices and expected input
prices. The input demand relationships can be aggregated without specification bias, if each individual
farmer faces the same price. Under such an assumption, the industry equation describing planted acreage
is a function of the expected output and inputs price. Since for most countries in most years there is little
difference between planted acreage and harvested acreage, a function for harvested acreage is specified
and estimated in this model. Hence, the generalized relationship specifying harvested acreage is expressed
as:
HAt = f1(HAt-1, Pte, Wt
e, e1t),
6
where HAt is harvested acreage, Pte is expected price received by producers, Wt
e is expected input price,
and e1t is the error term. One would anticipate positive coefficients for lagged acreage and expected price
of rice and negative coefficients for input price.
Yield is generally specified as a function of expected output, input prices, and technological
change.
Yt = f2(Pte, Wt
e, Tt, e2t).
Demand Sector This study assumes that rice demand determines by utility-maximizing consumers. Rice
consumers maximize their utility subject to their budget constraint. Solving the consumer's problem
yields first-order conditions identifying the optimal level of commodities they buy. Therefore, the per
capita rice demand is generally specified as:
Dt = f3(Mt, RPt, WPt, et3),
where Dt is total rice demand on a per capita basis, Mt is per capita income in real terms, RPt is rice retail
price (weighted average of free market price and government ration price), and WPt is wheat price.
The demand for exports is a function of the difference between domestic production and
consumption and export price (FOB)
EXPt = f5(RESDt, FOBt, et5),
where EXPt is exports, RESDt is residual of total production net of total consumption, and FOBt is free on
board export price measured in local currency.
Price Linkages Farm price, Pt is generally modeled as a function of retail price.
Pt = f6(RPt, et6).
Retail price is generally a function of deflated FOB price and a time trend that captures the
improvement in marketing efficiency.
RPt = f7(FOBt, et7).
where FOBt is export price.
Export price is generally modeled as a function of Thai price (5% broken).
FOBt = f8(THAIFOBt, et8).
Market Clearance
7
This study typically treats ending stocks as residual to close the model. Ending stocks are a
residual of total supply (production and beginning stocks) net of total demand (total domestic demand and
exports).
St = PRODt +St-1 - TDt - EXPt.
where PRODt is total production defined as total harvested area multiplied by yield, St-1 is beginning
stocks, and TDt is per capita demand multiplied by population .
8
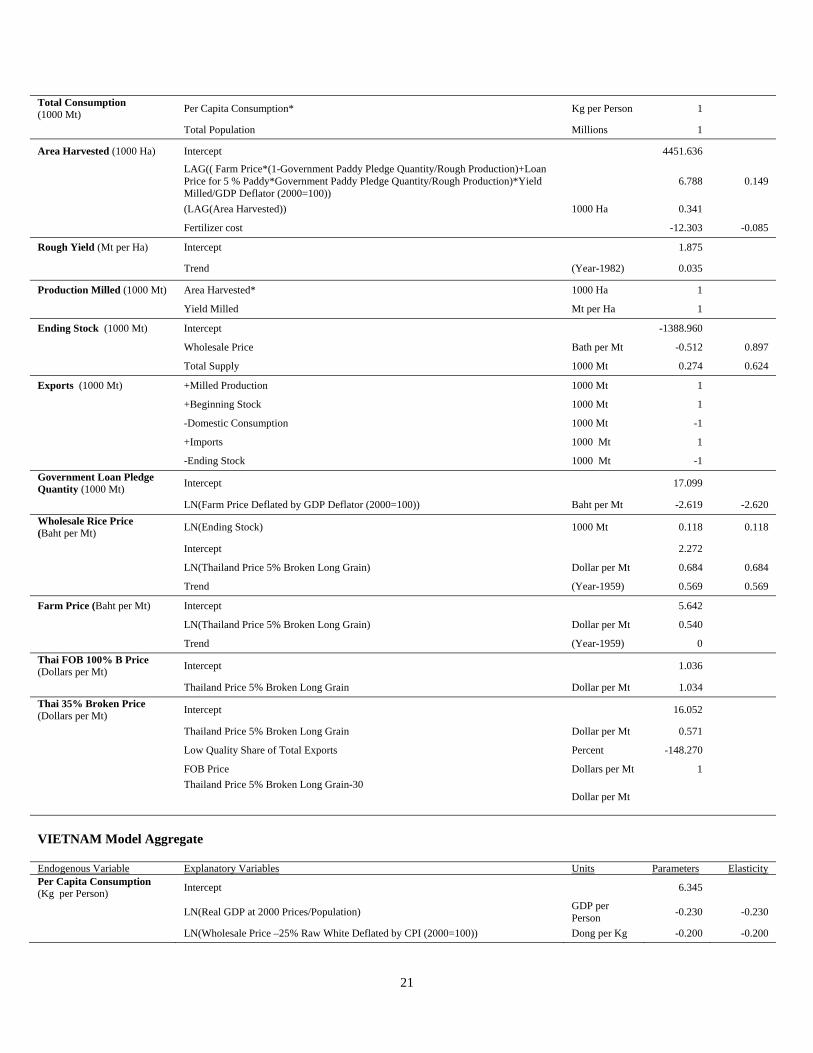
General Equations of the Model
U.S Rice Model U.S. Model Aggregate Endogenous Variable Explanatory Variables Units Parameters Elasticity Per Capita Food Demand (Rough) (Pounds per Person) Intercept 1.059
LN(Retail Price Deflated by CPI (2000 =100)) US Cents per Pound -0.046 -0.047
LN(Real GDP at 2000 Prices/U.S Population) US$ per Person 0.206 0.207 LN Trend (Year-1982) 0.257 0.258 Total Food Consumption (Million Cwt.) Per Capita Food Demand/100* Cwt/ person 1
Population Million 1 Seed Use Demand (Rough) (Million Cwt.) Intercept -0.202
Area Harvested* Conversion Parameter 1000 Acres
Trend (Year -1959)
Brewer Demand (Rough) Intercept 11.033
US Price for Rice for Brewing – Arkansas Deflated by CPI (2000 =100) US$ per Cwt. -22.779 -0.120
Real GDP at 2000 Prices/ Population US$ per Person 0.000 0.350
Trend (Year-1981) -0.047 Total Domestic Use (Million Cwt.) Food Use (Rough) Million Cwt. 1
Use for Brewing (Rough) Million Cwt. 1
Seed Use (Rough) Million Cwt. 1
Residual Use (Rough) Million Cwt. 1
Total Rice Area Harvested Long Grain Area Harvested 1000 Acres 1
(1000 Acres) Medium and Short Grain Rice Area Harvested 1000 Acres 1 Total Rough Rice Production (Million Cwt.) Long Grain Rice Production Million Cwt. 1
Medium and Short Grain Rice Production Million Cwt. 1 US Average Rough Rice Yield (Pounds per Acre) US Production (Rough) divided by Million Cwt. 1
Area Harvested*10000 1000 Acres 1 Total Rough Rice Stocks (Million Cwt.) +US Production (Rough) Million Cwt. 1
+Beginning Stock (Rough) Million Cwt. 1
+Import (Rough) Million Cwt. 1
-US Exports Total LG & MG Million Cwt. -1
-Domestic Consumption (Rough) Million Cwt. -1 Total Rice Exports (Rough Equivalent) (Million Cwt.) Long Grain Rice Exports (Rough) Million Cwt. 1
Medium & Short Grain Rice Export (Rough) Million Cwt. 1 Long Grain Rice Imports (Rough Equivalent) (Million Cwt.)
Intercept -4.020
LN((Thai Price 100 % Long Grain)*(1+ MFN Tariff/100))/GDP Deflator US$ per Mt -0.239 -0.239 LN(LAG(Long Grain Rice Domestic Consumption + Residual (Rough))) Million Cwt. 1.469 1.469 Medium and Short Grain Rice Imports (Rough) (Million Cwt.)
Intercept -14.397
9
LN((Ex Milled California Price for Medium & Short Grain)*(1+MFN Tariff/100))/GDP Deflator US$ per Cwt. -1.698 -1.698
LN(LAG(Medium & Short Grain Rice Domestic Consumption + Residual (Rough))) Million Cwt. 3.317 3.317 Endogenous Variable Explanatory Variables Units Parameters Elasticity Total Rice Imports (LG+MG Rough Equivalent) (Million Cwt.)
Long Grain Rice Imports (Rough) Million Cwt. 1
Medium & Short Grain Rice Imports (Rough) Million Cwt. 1 Long Grain Rice Domestic Per Capita Consumption (Rough) (Pounds per Person)
Intercept -8.890
LN(Retail Price Deflated by CPI (2000=100) for US) Dollars per Cwt. -0.185 -0.185
LN(Deflated by GDP Deflator (2000=100)/Population*1000) US$ per Person 1.157 1.157 Medium & Short Grain Rice Domestic Per Capita Consumption (Rough) (Pounds per Person)
Intercept
4.382
LN(LAG (Per Capita Medium Grain Domestic Consumption)) Pounds per Person 0.629 0.629
LN(Ex Milled California Price for Medium & Short Grain Deflated by CPI (2000=100)
Dollars per Cwt.
-0.421 -0.421
LN(Deflated by GDP Deflator(2000=100) /Population*1000) GDP per Person -0.392 -0.392
Rice Per Capita Domestic Consumption (LG+MG) (Pounds per Person)
Per Capita LG Domestic Consumption Pounds per Person 1 0.741
Per Capita MG Domestic Consumption Pounds per Person 1 0.275
Total Long Grain Area Harvested (1000 Acres) Long Grain Rice Area Harvested – AR 1000 Acres 1
Long Grain Rice Area Harvested – LA 1000 Acres 1
Long Grain Rice Area Harvested – MS 1000 Acres 1
Long Grain Rice Area Harvested – MO 1000 Acres 1
Long Grain Rice Area Harvested – TX 1000 Acres 1 Rough Long Grain Production (Million Cwt.) Long Grain Rice Production (Rough) – AR Million Cwt. 1
Long Grain Rice Production (Rough) – LA Million Cwt. 1
Long Grain Rice Production (Rough) – MS Million Cwt. 1
Long Grain Rice Production (Rough) – MO Million Cwt. 1
Long Grain Rice Production (Rough) – TX Million Cwt. 1 Rough Long Grain Yield (Rough) (Pounds per Acre) (Rough Long Grain Production / Million Cwt. 1
Total Long Grain Area Harvested)*100000 1000 Acres 1 Rough Long Grain Ending Stocks (Million Cwt.) +Long Grain Rice Production (Rough) Million Cwt. 1
+Long Grain Rice Beginning Stock (Rough) Million Cwt. 1
+Long Grain Rice Imports (Rough) Million Cwt. 1
-Long Grain Rice Exports (Rough) Million Cwt. -1
-Long Grain Rice Domestic Consumption + Residual (Rough) Million Cwt. -1 Total Medium & Short Grain Area Harvested (Million Cwt.)
Medium & Short Grain Rice Area Harvested - AR
Million Cwt.
1
Medium & Short Grain Rice Area Harvested - CA Million Cwt. 1
10
Medium & Short Grain Rice Area Harvested - LA Million Cwt. 1 Rough Medium & Short Grain Production (Million Cwt.)
Medium & Short Grain Rice Production - AR Million Cwt. 1
Medium & Short Grain Rice Production - CA Million Cwt. 1
Medium & Short Grain Rice Production - LA Million Cwt. 1
Rough Medium & Short Grain Yield (Pounds per Acre)
Medium & Short Grain Rice Production (Rough)/ Million Cwt. 1
Medium & Short Grain Area Harvested*1000 Million Cwt. 1 Rough Medium & Short Grain Ending Stocks (Million Cwt.)
+Medium & Short Grain Rice Production (Rough) Million Cwt. 1
+Medium & Short Grain Beginning Stocks Million Cwt. 1
+Medium & Short Grain Rice Imports (Rough) Million Cwt. 1
-Medium & Short Grain Rice Exports (Rough) Million Cwt. -1
-Medium & Short Grain Rice Domestic Consumption + Residual (Rough) Million Cwt. -1 Long Grain Rice Exports (Rough Equivalents) (Million Cwt.)
Intercept -0.619
LN(Thai Price 100 % Long Grain / US Long Grain farm price (Rough)) Dollars per Mt 0.305 0.305
LN(Long Grain Rice Production-Long Grain Domestic Consumption + Residual (Rough)+ Long Grain Rice Beginning Stocks) Million Cwt. 0.858 0.858
Medium & Short Grain Rice Exports (Rough Equivalents) (Million Cwt.)
Intercept 0.757 0.757
LN(Ex Milled California Price for Medium & Short Grain Deflated by CPI(2000=100))
Dollars per Cwt. 0.172 0.172
LN(Medium & Short Grain Rice Production- Medium & Short Grain Domestic Consumption + Residual (Rough)+ Medium & Short Grain Rice Beginning Stocks) Million Cwt. 0.475 0.475
Average Long Grain Farm Price (Dollars per Cwt.) Intercept 0.129 0.129
LN(Rice Price FOB Houston Deflated by GDP Deflator (2000=100)) Dollars per Cwt. 1.336 1.336
LN(Long Grain Rice Beginning Stocks (Rough)) Million Cwt. -0.145 -0.145 Average Medium & Short Grain Farm Price (Dollars per Cwt.)
Intercept -0.057
LN(Ex Milled California Price for Medium & Short Grain Deflated by GDP Deflator (2000=100))
Dollars per Cwt. 1.083 1.083
LN(US Long Grain Farm Price Deflated by GDP Deflator (2000=100)) Dollars per Cwt. 0.257 0.257
LN(Medium & Short Grain Beginning Stocks (Rough)) Million Cwt. -0.044 -0.044 U.S. Average Farm Price (Dollars per Cwt.)
(1/ US Production (Rough)*US Long Grain Farm Price (Rough)* Long Grain Rice Production (Rough) US$ Cwt.
(1/ US Production (Rough)*US Medium Grain Farm Price (Rough)* Medium & Short Grain Rice Production (Rough) US$ Cwt.
U.S. Retail Farm Price (Dollars per Cwt.) Intercept -0.026
LN LAG(Retail Price Deflated by CPI (2000=100)) Cents per Lb. 0.794 0.794
LN(FOB Houston Deflated by CPI(2000=100)) Dollars per Cwt. 0.062 0.062
Arkansas Brewer Price (Dollars per Cwt.) Intercept 0.040
LN(U.S. Avg. Farm Price (Rough) Deflated by GDP Deflator (2000=100)) Dollars per Cwt. 1.023 1.023
Houston Export Price (FOB Intercept 2.006
11
Gulf) (Dollars per Cwt.)
LN( Thailand Price100% Long Grain Deflated by GDP Deflator (2000=100)) Dollars per Mt 0.600 0.600 LN(LAG(Long Grain Rice Exports (Rough)) Million Cwt. 0.492 0.492 California Medium Grain Ex-Mill Price (Dollars per Cwt.)
Intercept
ARKANSAS SUB MODEL Endogenous Variable Explanatory Variables Units Parameters Elasticity Arkansas Long Grain Area Harvested (1000Acres) Intercept 493.702
LAG(Long Grain Area Harvested - AR) 1000 Acres 0.537 0.541 LAG ( Long Grain Rice Net Returns AR / Soybean Net Returns- AR) 27.533 0.035 Arkansas Long Grain Rice Production (Rough) (Million Cwt)
Long Grain Area Harvested, AR* 1000 Acres 1
Long Grain Rice Yield (Rough) - AR Cwt. per Acre 1 Arkansas Long Grain Yield (Rough) (Pound per Acre) Intercept 4688.034
LAG (UREA price Deflated by CPI(2000=100)) Dollars per Ton -56.901 -0.021
Trend (Year - 1982) 90.619 0.263 Arkansas Medium & Short Grain Area Harvested Intercept 53.342
(1000 Acres) LAG( Medium & Short Grain Rice Net Returns/Cotton Net Returns - AR) Dollars per Acre 3.803 0.010
LAG(Medium & Short Grain Rice Area Harvested - AR ) 1000 Acres 0.624 0.582 Arkansas Medium & Short Grain Production (Rough) (Medium & Short Grain Rice Area Harvested – AR * 1000 Acres 1
(Million Cwt) Medium & Short Grain Rice Yield (Rough) – AR Cwt. per Acre 1 Arkansas Medium & Short Grain Yield (Rough) Intercept 8.465 (Pound per Acre) LN (Trend) (Year - 1982) 0.104 0.104 Arkansas Total Rice Area (1000 Acres) Medium & Short Grain Rice Area Harvested – AR 1000 Acres 1
Long Grain Rice Area Harvested – AR 1000 Acres 1 Arkansas Total Rice Production (Rough)(Cwt.) Medium & Short Grain Rice Production (Rough) - AR + Million Cwt. 1
Long Grain Rice Production (Rough) – AR Million Cwt. 1 Arkansas Average Yield (Rough)(Pounds per Acre) Rough Production – AR Cwt. 1
Area Harvested - AR*100000 1000 Acres 1 Arkansas Long Grain Farm Price (Dollars per Cwt.) Intercept -0.484
US Long Grain Farm Price (Rough) Dollars per Cwt. 1.065 1.074
Arkansas Medium & Short Grain Farm Price (Dollars per Cwt.)
Intercept -0.362
US Medium Grain Farm Price (Rough) Dollars per Cwt. 1.046 1.057
Arkansas Long Grain Net Returns (Dollars per Acre)
+Rice Loan Deficiency Payments per Acre Dollars per Acre 1
-Average Variable Cost per Acre – AR Dollars per Acre -1
12
Arkansas Medium & Short Grain Net Returns (Dollars per Acre)
+Arkansas Medium Grain Market Price (Rough)* Medium & Short Grain Rice Yield (Rough)- AR/100 1
+Rice Loan Deficiency Payments per Acre Dollars per Acre 1
-Average Variable Cost per Acre – AR Dollars per Acre -1
CALIFORNIA SUB MODEL Endogenous Variable Explanatory Variables Units Parameters Elasticity California Medium & Short Grain Area Harvested (1000 Acres)
Intercept 280.888
LAG( Medium & Short Grain Rice Net Returns Deflated by GDP Deflator (2000=100))
Dollars per Acre 6.140 0.016
LAG(Corn Net Returns – CA Deflated by GDP Deflator (2000=100)) Dollars per Acre -25.110 -0.161
LAG (Medium & Short Grain Rice Area Harvested – CA) 1000 Acres 0.562 0.559 California Medium & Short Grain Production (Rough) (Million Cwt.)
(Medium & Short Grain Rice Area Harvested – CA* 1000 Acres 1
Medium & Short Grain Rice Yield (Rough) – CA / 100000 Pounds per Acre 1
California Medium & Short Grain Yield (Rough) (Pounds per Acre)
Intercept 8.857
LN (Trend) (Year - 1982) 0.044 0.044 California Medium & Short Grain Farm Price (Dollars per Cwt.)
Intercept -0.893
US Medium Grain Farm Price (Rough) Dollars per Cwt. 1.115 1.105
California Medium & Short Grain Net Returns (Dollars per Acre)
+California Medium Grain Market Price (Rough)* Medium & Short Grain Rice Yield (Rough)- CA/100 1
+Rice Loan Deficiency Payments per Acre Dollars per Cwt 1
-Average Variable Cost per Acre – CA Dollars per Acre -1
LOUISIANA SUB MODEL Louisiana Long Grain Area Harvested (1000 Acres) Intercept 71.198
LAG (Long Grain Rice Net Returns Deflated by GDP Deflator(2000=100)) Dollars per Acre 44.305 0.092
LAG(Soybean Net Returns - LA Deflated by GDP Deflator(2000=100)) Dollars per Acre -86.159 -0.196
LAG(Long Grain Rice Area Harvested – LA) 1000 Acres 0.846 0.887 Louisiana Long Grain Production (Rough) (Million Cwt.)
(Long Grain Area Harvested - LA* 1000 Acres 1
Long Grain Rice Yield (Rough) – LA) /100000 Pounds per Acre 1
Louisiana Long Grain Yield (Rough) (Pounds per Acre)
Intercept
8.120 LN (Trend) (Year - 1982) 0.162 0.162 Louisiana Medium & Short Grain Area Harvested (Million Cwt.)
Intercept -8.201
LAG( Medium & Short Grain Rice Net Returns/ Corn Net Returns - LA Dollars per 2.282 0.074
13
Acre
LAG(Medium & Short Grain Rice Net Returns /Cotton Net Returns – LA) Dollars per Acre 3.348 0.033
LAG (Medium & Short Grain Rice Area Harvested – LA) 1000 Acres 0.932 1.191 Louisiana Medium & Short Grain Production (Rough) (Million Cwt.)
(Medium & Short Grain Area Harvested - LA* 1000 Acres 1
Medium & Short Grain Rice Yield (Rough) – LA) /100000 Pounds per Acre 1
Louisiana Medium & Short Grain Yield (Rough) (Pounds per Acre)
Intercept 8.312
LAG (UREA Price Deflated by CPI (2000=100)) Dollars per Ton -0.030 -0.030
Trend (Year - 1982) 0.073 0.073 Louisiana Total Rice Area (1000 Acres) Medium & Short Grain Area Harvested - LA 1000 Acres
Long Grain Area Harvested - LA 1000 Acres
Endogenous Variable Explanatory Variables Units Parameters Elasticity
Louisiana Long Grain Net Returns (Dollars per Acre)
+Arkansas Long Grain Farm Market Price (Rough)* Long Grain Rice Yield (Rough) - LA/100
Dollars per Cwt
1
+Rice Loan Deficiency Payments per Acre Dollar per Acre 1
-Average Variable Cost per Acre - LA Dollars per Acre -1
Louisiana Medium & Short Grain Net Returns (Dollars per Acre)
+Arkansas Medium Grain Market Price (Rough)* Medium & Short Grain Rice Yield (Rough) - LA/100
Dollars per Cwt 1
+Rice Loan Deficiency Payments per Acre Dollar per Acre 1
-Average Variable Cost per Acre - LA Dollars per Acre -1
MISSISSIPPI SUB MODEL Mississippi Long Grain Area Harvested (1000 Acres) Intercept 59.076
LAG (Long Grain Rice Net Returns/Corn Net Returns- MS) 4.814 0.030 LAG (Long Grain Rice Net Returns/Cotton Net Returns- MS) 2.385 0.005 LAG (Long Grain Rice Area Harvested – MS) 1000 Acres 0.697 0.714 Mississippi Long Grain Production (Rough) (Million Cwt.)
(Long Grain Area Harvested - MS* 1000 Acres 1
Long Grain Rice Yield (Rough) - MS) Pounds per Acre 1
Mississippi Long Grain Yield (Rough) (Pounds per Acre)
Intercept 4837.109
LAG (UREA Price Deflated by CPI(2000=100)) Dollars per Ton -108.312 -0.041
Trend (Year - 1982) 94.279 Mississippi Long Grain Farm Price (Dollars per Cwt.)
Intercept
0.047
US Long Grain Farm Price (Rough) Dollars per Cwt. 1.009 1.017
Mississippi Long Grain Net Returns (Dollars per Acre)
+Mississippi Long Grain Farm Market Price (Rough)* Long Grain Rice Yield (Rough) - MS/100 1
14
+Rice Loan Deficiency Payments per Acre Dollar per Acre 1
-Average Variable Cost per Acre - MS Dollars per Acre -1
MISSOURI SUB MODEL Missouri Long Grain Area Harvested (1000 Acres) Intercept -4.646
LAG (Long Grain Area Harvested – MO) 1000 Acres 0.996 0.893
LAG (Long Grain Rice Net Returns/ Soybean Net Returns – Missouri) 8.092 0.039
Missouri Long Grain Production (Rough) (Million Cwt.)
Long Grain Area Harvested – MO* 1000 Acres 1
Long Grain Rice Yield(Rough) – MO/100000 Pounds per Acre 1
Missouri Long Grain Yield (Rough) (Pounds per Acre) Intercept 4368.271
Trend (Year - 1982) 81.910 Missouri Long Grain Farm Price (Dollars per Cwt.) Intercept -0.498
US Long Grain Farm Price (Rough) Dollars per Cwt. 1.055 1.086
Missouri Long Grain Net Returns (Dollars per Acre)
+Mississippi Long Grain Farm Market Price (Rough)* Long Grain Rice Yield (Rough) - MO/100 1
+Rice Loan Deficiency Payments per Acre Dollars per Acre 1
-Average Variable Cost per Acre - MO Dollars per Acre -1
TEXAS SUB MODEL Texas Long Grain Area Harvested (1000 Acres) Intercept 32.823
LAG (Long Grain Rice Net Returns Deflated by GDP Deflator(2000=100)) Dollars per Acre 14.958 0.062
LAG (Corn Net Returns Deflated by GDP Deflator(2000=100)) Dollars per Acre -23.709 -0.119
LAG(Cotton Net Returns Texas Deflated by GDP Deflator(2000=100)) Dollars per Acre -9.668 -0.110
LAG( Long Grain Rice Area Harvested - TX) 1000 Acres 0.860 0.928 Texas Long Grain Production (Rough) (Million Cwt.)
Long Grain Area Harvested - TX* 1000 Acres 1
Long Grain Rice Yield (Rough) - TX/100000 Pounds per Acre 1
Texas Long Grain Yield (Rough) (Pounds per Acre) Intercept 5314.478 Trend (Year -1982) 66.655 0.183 Texas Long Grain Farm Price (Dollars per Cwt.) Intercept 0.447
US Long Grain Farm Price (Rough) Dollars per Cwt. 0.984 1.118
Texas Long Grain Net Returns (Dollars per Acre)
+Texas Long Grain Farm Market Price (Rough)* Long Grain Rice Yield (Rough) - TX/100
1
+Rice Loan Deficiency Payments per Acre Dollars per Acre 1
-Average Variable Cost per Acre – TX Dollars per Acre -1
15
U.S. POLICY VARIABLES Announced World Average Price (Dollars per Cwt.) Intercept -3.805
LN(Thailand Price 100% Long Grain Deflated by GDP Deflator) Dollars per Ton 1.020 1.020
LN(U.S. Export Price Houston Gulf FOB Deflated by GDP Deflator) Dollars per Ton 0.250
LN(Beginning Stocks (Rough)) Million Cwt. -0.130 Loan Deficiency Payments ($Millions)
MAX(Loan Rate - Index of Monthly Announced Price Relative to Average Annual Announced Price (1995-1998) *Average World Price, 0)* Monthly Average Share of Annual Rice Marketings (1995-1998) *Average Rice Marketings Divided by Average Rice Production (1995-1998)*U.S. Production (Rough)
Counter Cyclical Payment (Per Cwt.) +Rice Target Price Dollar per
Cwt. 1
-Rice PFC payment per Acre Dollar per Acre -1
-Max (Loan Rate - Average World Price) Dollar per Cwt. -1
AUSTRALIA MODEL Endogenous Variable Explanatory Variables Units Parameters Elasticity Per Capita Consumption (Kg per Person) Intercept -12.461
(Ex-mill California Price Medium and Short Grain* Exchange Rate Deflated by CPI (2000=100)* 22.0462)
Australian $ per Mt -1.113 -0.443
(Real GDP at 2000 Prices/Population*1000) AUS$ per Person 0.001 2.306
Total Consumption (1000 Mt) Consumption Per Capita* Kg per Person 1
Total Population Millions 1 Area Harvested (1000 Ha) Intercept 3.568
LAG( Ex-Mill California Price for Medium and Short Grain Rice--4% Broken* Exchange Rate/CPI (2000=100)*22.0462
Australian Dollar per Mt 3.977 0.191
LAG(Area Harvested)+ 1000 Ha 0.450
Trend (Year-1959) 0.000
Yield Milled (Mt per Ha) Intercept 2.645
Area Harvested 1000 Ha -0.004 -0.108
Trend (Year-1959) 0.111 Production Milled (1000 Mt) Area Harvested* 1000 Ha 1
+Imports 1000 Mt 1 Import Price (Thai 35% LG FOB used as Proxy) (US Dollars per Mt)
Intercept 0
Thailand Price 35% Broken Long Grain*(1+Import Tax (Milled)/100)*(1+Value Added Tax/100) Dollar per Mt 1 1.000
Export Price (Thai 35% LG FOB used as Proxy) (US Dollars per Mt)
Intercept 0
Thailand Price 35% Broken Long Grain(1+Export Tax/100) Dollar per Mt 1 1.000
CHINA Model Per Capita Consumption Intercept 4.631 (Kg per Person) LN(Average Retail Price Deflated by CPI (2000=100)) Yuan per Mt -0.100 -0.100 LN(Wheat Farm Price (Mixed Average) Deflated by CPI(2000=100)) Yuan per Mt 0.050 0.050
LN( Real Private Consumption Expenditure 1995 Price/ Population) Yuan per Person -0.140 -0.140
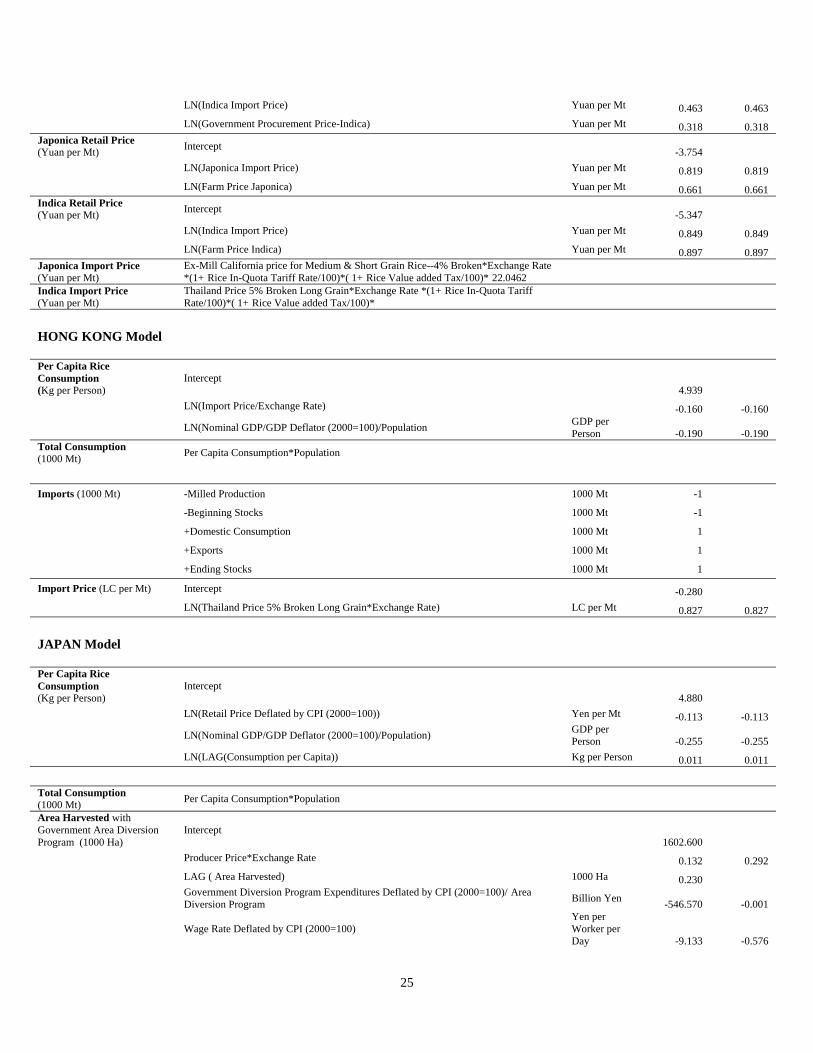
LN(Indica Import Price) Yuan per Mt 0.463 0.463 LN(Government Procurement Price-Indica) Yuan per Mt 0.318 0.318 Japonica Retail Price (Yuan per Mt) Intercept -3.754 LN(Japonica Import Price) Yuan per Mt 0.819 0.819 LN(Farm Price Japonica) Yuan per Mt 0.661 0.661 Indica Retail Price (Yuan per Mt) Intercept -5.347 LN(Indica Import Price) Yuan per Mt 0.849 0.849 LN(Farm Price Indica) Yuan per Mt 0.897 0.897 Japonica Import Price (Yuan per Mt)
Ex-Mill California price for Medium & Short Grain Rice--4% Broken*Exchange Rate *(1+ Rice In-Quota Tariff Rate/100)*( 1+ Rice Value added Tax/100)* 22.0462
Indica Import Price (Yuan per Mt)
Thailand Price 5% Broken Long Grain*Exchange Rate *(1+ Rice In-Quota Tariff Rate/100)*( 1+ Rice Value added Tax/100)*
HONG KONG Model Per Capita Rice Consumption (Kg per Person)
Intercept 4.939
LN(Import Price/Exchange Rate) -0.160 -0.160
LN(Nominal GDP/GDP Deflator (2000=100)/Population GDP per Person -0.190 -0.190
Total Consumption (1000 Mt) Per Capita Consumption*Population
Imports (1000 Mt) -Milled Production 1000 Mt -1
-Beginning Stocks 1000 Mt -1
+Domestic Consumption 1000 Mt 1
+Exports 1000 Mt 1
+Ending Stocks 1000 Mt 1
Import Price (LC per Mt) Intercept -0.280 LN(Thailand Price 5% Broken Long Grain*Exchange Rate) LC per Mt 0.827 0.827
JAPAN Model Per Capita Rice Consumption (Kg per Person)
Intercept 4.880
LN(Retail Price Deflated by CPI (2000=100)) Yen per Mt -0.113 -0.113
LN(Nominal GDP/GDP Deflator (2000=100)/Population) GDP per Person -0.255 -0.255
LN(LAG(Consumption per Capita)) Kg per Person 0.011 0.011 Total Consumption (1000 Mt) Per Capita Consumption*Population
Area Harvested with Government Area Diversion Program (1000 Ha)
Intercept 1602.600
Producer Price*Exchange Rate 0.132 0.292 LAG ( Area Harvested) 1000 Ha 0.230
Government Diversion Program Expenditures Deflated by CPI (2000=100)/ Area Diversion Program Billion Yen -546.570 -0.001
Wage Rate Deflated by CPI (2000=100) Yen per Worker per Day -9.133 -0.576
26
Area Diversion Program 1000 Ha 1602.600 Japanese Government Area Diversion Program (1000 Ha)
+LAG( Area Harvested*Yield Milled) 1
-Total Consumption 1000 Mt -1
+Imports 1000 Mt 1
+Beginning Stocks 1000 Mt 1
-Government desired stock level 1000 Mt -1
Rough Yield (Mt per Ha) Intercept 5.030 Producer Price Deflated by CPI (2000=100) Yen per Mt 0.000 0.198 Fertilizer Price Paid by Farmers (Urea) Deflated by CPI (2000=100) Yen per Mt -0.001 -0.042 Trend (Year -1959) 0.023 0.143 Milled Yield (Mt per Ha) Yield Rough* Milling Yield
Rough Production (1000 Mt) Area Harvested* Yield Rough
Milled Production (1000 Mt) Area Harvested* Yield Milled
Ending Stocks (1000 Mt) +Milled Production 1000 Mt 1
-Domestic Consumption 1000 Mt -1
+Imports 1000 Mt 1
-Exports 1000 Mt -1
+Beginning Stocks 1000 Mt 1
Imports (1000 Mt) IF (Year < 1999, Minimum Access Import Level + Japan Import Error)
ELSE MIN ((LAG(Imports)*( CIF Import Prices/LAG (CIF Import Prices))**(Intercept + Japan Import Error) -2.960
(WTO Dummy Variable) 0.253 Rice Import Price (Won per Mt)
Ex-Mill California Price for Medium and Short Grain Rice--4% Brokens* 22.0462 *Exchange Rate*(1+In-Quota Tariff Rate/100)
TAIWAN Model Endogenous Variable Explanatory Variables Units Parameters Elasticity Per Capita Consumption (Kg per Person) Intercept 5.923
LN(Retail Price Deflated by CPI (2000=100)) New Taiwan Dollars per Mt -0.163 -0.016
LN(Real GDP at 2000 Prices/Population) GDP per Person -0.289 -0.289
LN(LAG(Per Capita Consumption) Kg per Person 0.000 0.000 Total Consumption (1000 Mt) (Per Capita Consumption* Total Population) Kg per Person
Area Harvested (1000 Ha) Intercept 3.700
28
LN(Producer Price* (1-Quantity Share of Production Procured)+Government Purchase Price*Quantity Share of Production Procured) 0.166 0.007
LN(LAG(Area Harvested)) 1000 Ha 0.350
LN Trend (Year-1959) -0.337
Rough Yield (Mt per Ha) Intercept 3.282
(Producer Price*(1-Quantity Share of Production Procured)+Government Purchase Price*Quantity Share of Production Procured)
0.000
Trend (Year-1959) 0.035
Production Milled (1000 Mt) (Area Harvested* Yield Milled)
Imports (1000 Mt) Minimum Access 1000 Mt 1
Ending Stock (1000 Mt) +Milled Production 1000 Mt 1
+Beginning Stock 1000 Mt 1
+Imports 1000 Mt 1
-Domestic Consumption 1000 Mt -1
-Exports 1000 Mt -1
Import Price (NT per Mt) Ex-Mill California Price for Medium and Short Grain Rice--4% Broken*Exchange Rate*22.0462+Import Mark-Up
Retail Price (NT per Mt) Intercept 0.281
LN(Producer Price) New Taiwan Dollars per Mt 0.600
LN(Import Price) New Taiwan Dollars per Mt 0.435
Producer Price (NT per Mt) Intercept 0.935
LN(Government Purchase Price) New Taiwan Dollars per Mt 0.959
LN(Beginning Stocks) 1000 Mt -0.118
ARGENTINA MODEL Endogenous Variable Explanatory Variables Units Parameters Elasticity Per Capita Consumption (Kg per Person) Intercept 1.636 LN (Producers Price* Exchange Rate Deflated by CPI (Year 2000=100)) LC per Mt -0.071 -0.071
LN(Real GDP at 2000 Prices/Population) GDP per Person 0.111 0.111
Total Consumption (1000 Mt) Per Capita Consumption* Kg per Person 1
Population Millions 1
Area Harvested (1000 Ha) Intercept -1.887
LN(LAG(Producer Price* Rough Yield* Exchange Rate Deflated by GDP Deflator (2000=100)) LC per Mt 0.142 0.237
LN(LAG(Area Harvested) 1000 Ha 0.400 0.400 LN (Fertilizer Cost Deflated by CPI (2000=100)) LC per Ha -0.042 Rough Yield (Mt per Ha) Intercept 0.384 LAG(Producer Price* Exchange Rate Deflated by GDP Deflator (2000=100)) LC per Mt 0.045 0.015 Trend (Year-1959) 0.119 Production Milled (1000 Mt) Area Harvested* 1000 Ha 1
LN(Import Price* Exchange rate Deflated by GDP Deflator (2000=100)) LC per Mt 0.263
LN(Production Milled +Beginning Stocks- Domestic Consumption) 1000 Mt 1.329 Producer Price (US Dollars per Mt) Intercept 2.647 LN(Import Price) LC per Mt 0.447 0.447 Export Price (LC per Mt) Intercept 20.706 Thailand Price 5 % Broken Long Grain Dollars per Mt 1.154 0.569
BRAZIL MODEL Per Capita Consumption (Kg per Person) Intercept 4.111 LN (Import Price* Exchange rate Deflated by CPI (Year 2000=100)) LC per Mt -0.100 -0.100 LN(Wheat Retail Price Deflated by CPI (Year 2000=100)) 0.070 0.070
LN(Real GDP at 2000 Prices* Population) GDP per Person -0.050 -0.050
Total Consumption (1000 Mt) Per Capita Consumption* Kg per Person 1
Population Millions 1
Area Harvested (1000 Ha) Intercept 2.395
LN(LAG(Import Price* Rough Yield* Exchange Rate Deflated by GDP Deflator (2000=100)) LC per Mt 0.050 0.077
LN(LAG(Area Harvested)) 1000 Mt 0.350 0.350
LN(LAG (Soybean Farm Price*Exchange Rate Deflated by GDP Deflator (2000=100)) ) LC per Mt -0.040 -0.062
LN(Trend) (Year-1959) -0.200 Rough Yield (Mt per Ha) Intercept 0.767 Trend (Year-1959) 0.050 Production Milled (1000 Mt) Area Harvested* 1000 Ha 1
+Ending Stocks 1000 Mt 1 Import Price (Dollars per Mt) Intercept -0.553 LN(Import Price) LC per Mt 0.492 0.492 LN(Thailand Price 5 % Broken Long Grain( 1+ Import Tariff/100) Dollars per Mt 0.603 0.603
30
CANADA Model Per Capita Consumption (Kg per Person) Intercept 0.759 LN(Import Price Deflated by CPI (2000=100)) LC per Mt -0.211 -0.211
LN(Real GDP at 2000 Prices/Population) GDP per Person 0.466 0.466
Total Consumption (1000 Mt) Per Capita Consumption* Kg per Person 1
Population Millions 1
Imports (1000 Mt) -Production Milled 1000 Mt -1
-Beginning Stocks 1000 Mt -1
+Domestic Consumption 1000 Mt 1
+Exports 1000 Mt 1
+Ending Stocks 1000 Mt 1
Import Price (LC per Mt) Intercept 0.829 LN(Thailand Price 5 % Broken Long Grain*Exchange Rate) LC per Mt 0.862 0.862
Endogenous Variable Explanatory Variables Units Parameters Elasticity
MEXICO Model Per Capita Consumption (Kg per Person) Intercept 1.899 LN(Retail Price/Exchange Rate) Dollars per Mt -0.050 -0.050 LN(Wheat Producer Price/ Exchange Rate) Dollars per Mt 0.027 0.027
LN(Real GDP at 2000 Prices/Population) GDP per Person 0.459 0.459
Total Consumption (1000 Mt) Per Capita Consumption* Kg per Person 1
Population Millions 1
Area Harvested (1000 Ha) Intercept 2.756 LN( LAG(Producer Price*Rough Yield Deflated by GDP Deflator(2000=100))) LC per Mt 0.097 0.097
LN(LAG(Wheat Producer Price* Wheat Yield Deflated by GDP Deflator (2000=100))) LC per Mt -0.039 -0.039
LN(LAG(Area Harvested)) 1000 Ha 0.300 Rough Yield (Mt per Ha) Intercept 0.953
Producer Price Deflated by GDP Deflator (2000=100) LC per Mt 0.032
Trend (Year- 1959) 0.072
Production Milled (1000 Mt) Area Harvested* 1000 Ha 1
Yield Milled Mt per Ha 1
Ending Stocks (1000 Mt) Intercept 4.078
LN(Producer Price Deflated by GDP Deflator (2000=100)) LC per Mt -0.420
LN(Production Milled) 1000 Mt 0.676
Imports (1000 Mt) -Production Milled 1000 Mt -1
-Beginning Stocks 1000 Mt -1
+Domestic Consumption 1000 Mt 1
+Exports 1000 Mt 1
+Ending Stocks 1000 Mt 1
Producer Price (LC per Mt) Intercept -0.405
31
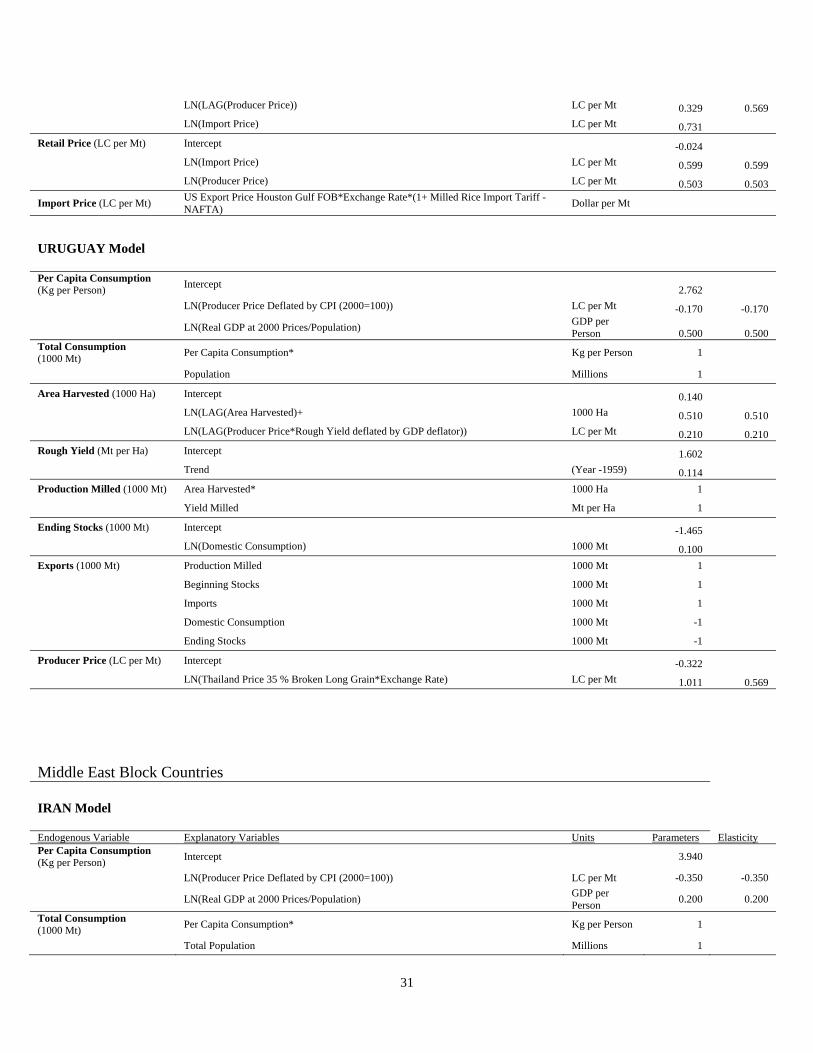
LN(LAG(Producer Price)) LC per Mt 0.329 0.569 LN(Import Price) LC per Mt 0.731 Retail Price (LC per Mt) Intercept -0.024 LN(Import Price) LC per Mt 0.599 0.599 LN(Producer Price) LC per Mt 0.503 0.503
Import Price (LC per Mt) US Export Price Houston Gulf FOB*Exchange Rate*(1+ Milled Rice Import Tariff - NAFTA) Dollar per Mt
URUGUAY Model Per Capita Consumption (Kg per Person) Intercept 2.762 LN(Producer Price Deflated by CPI (2000=100)) LC per Mt -0.170 -0.170
LN(Real GDP at 2000 Prices/Population) GDP per Person 0.500 0.500
Total Consumption (1000 Mt) Per Capita Consumption* Kg per Person 1
Population Millions 1
Area Harvested (1000 Ha) Intercept 0.140 LN(LAG(Area Harvested)+ 1000 Ha 0.510 0.510 LN(LAG(Producer Price*Rough Yield deflated by GDP deflator)) LC per Mt 0.210 0.210 Rough Yield (Mt per Ha) Intercept 1.602
Trend (Year -1959) 0.114
Production Milled (1000 Mt) Area Harvested* 1000 Ha 1
Yield Milled Mt per Ha 1
Ending Stocks (1000 Mt) Intercept -1.465
LN(Domestic Consumption) 1000 Mt 0.100
Exports (1000 Mt) Production Milled 1000 Mt 1
Beginning Stocks 1000 Mt 1
Imports 1000 Mt 1
Domestic Consumption 1000 Mt -1
Ending Stocks 1000 Mt -1
Producer Price (LC per Mt) Intercept -0.322 LN(Thailand Price 35 % Broken Long Grain*Exchange Rate) LC per Mt 1.011 0.569
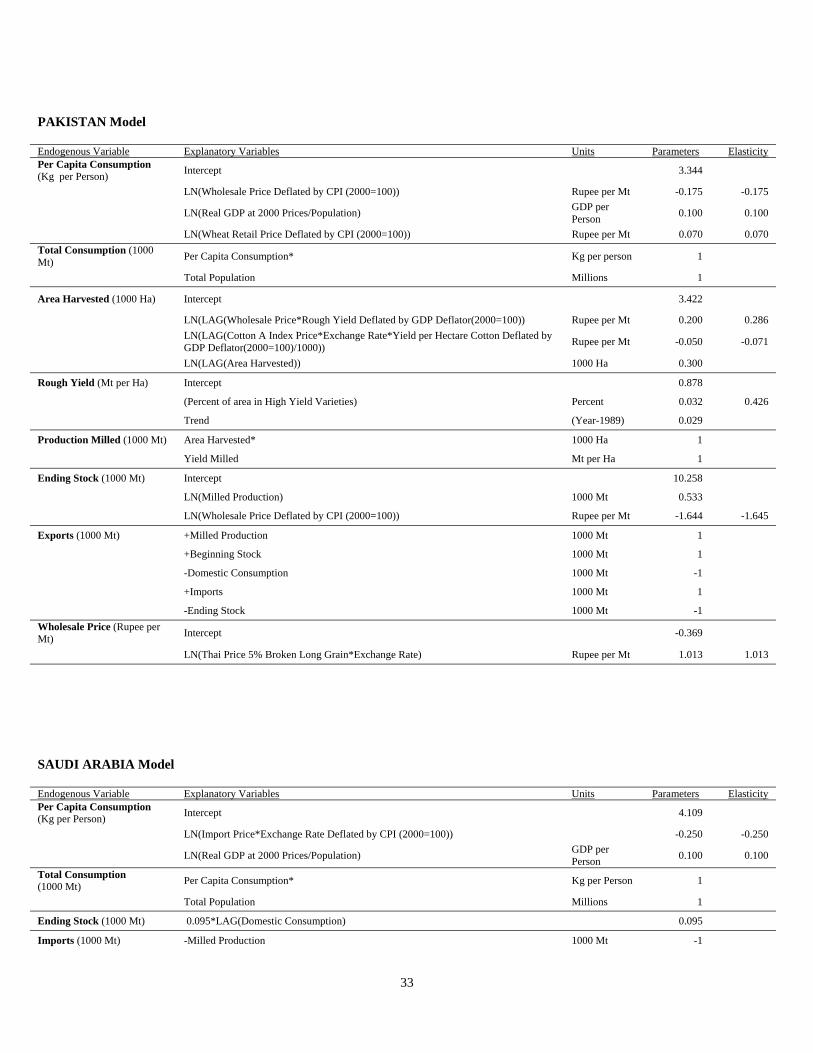
Middle East Block Countries IRAN Model Endogenous Variable Explanatory Variables Units Parameters Elasticity Per Capita Consumption (Kg per Person) Intercept 3.940
LN(Producer Price Deflated by CPI (2000=100)) LC per Mt -0.350 -0.350
LN(Real GDP at 2000 Prices/Population) GDP per Person 0.200 0.200
Total Consumption (1000 Mt) Per Capita Consumption* Kg per Person 1
Total Population Millions 1
32
Area Harvested (1000 Ha) Intercept 0.893
LN(LAG (Producer Price *Rough Yield Deflated by CPI (2000=100)) LC per Mt 0.050 0.001
LN(LAG(Area Harvested)) 1000 Ha 0.700
Rough Yield (Mt per Ha) Intercept 2.701
Trend (Year-1959) 0.038
Production Milled (1000 Mt) Area Harvested* 1000 Ha 1
LN(Thailand Price 5% Broken Long Grain*(1+Import Tax for Whole Rice/100) Dollars per Mt 2.264 2.265
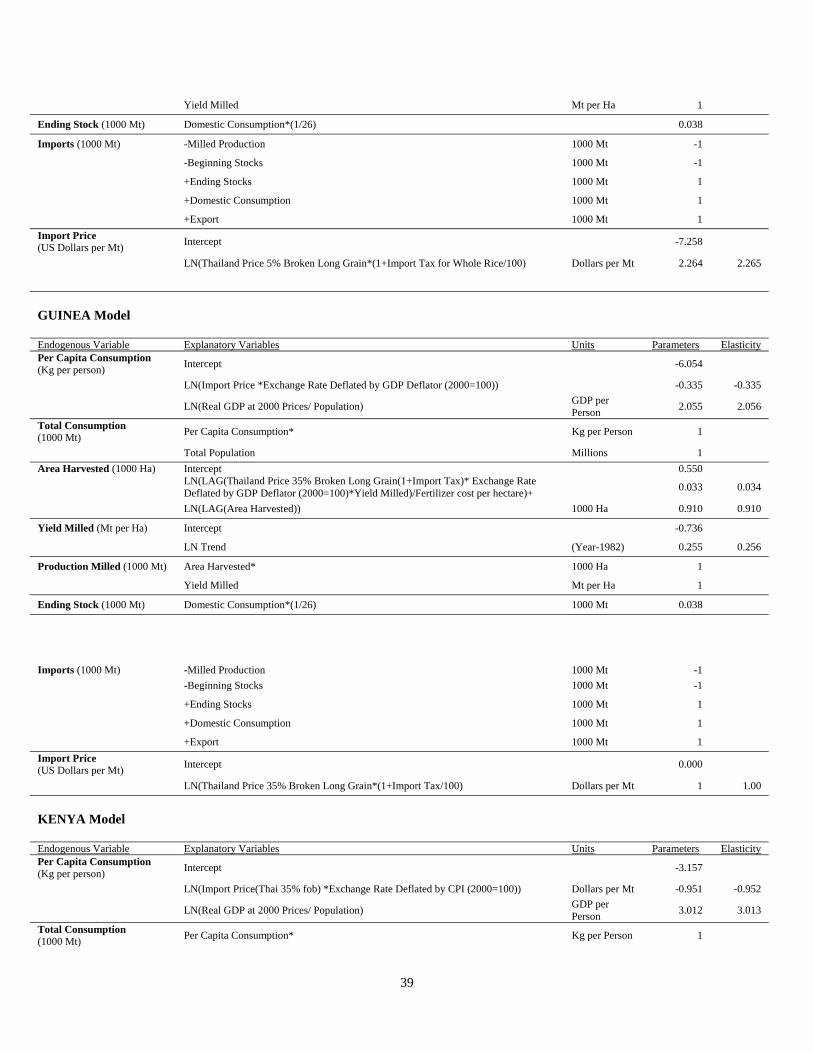
GUINEA Model Endogenous Variable Explanatory Variables Units Parameters Elasticity Per Capita Consumption (Kg per person) Intercept -6.054
LN(Import Price *Exchange Rate Deflated by GDP Deflator (2000=100)) -0.335 -0.335
LN(Real GDP at 2000 Prices/ Population) GDP per Person 2.055 2.056
Total Consumption (1000 Mt) Per Capita Consumption* Kg per Person 1
Total Population Millions 1 Area Harvested (1000 Ha) Intercept 0.550
LN(LAG(Thailand Price 35% Broken Long Grain(1+Import Tax)* Exchange Rate Deflated by GDP Deflator (2000=100)*Yield Milled)/Fertilizer cost per hectare)+ 0.033 0.034
LN(LAG(Area Harvested)) 1000 Ha 0.910 0.910
Yield Milled (Mt per Ha) Intercept -0.736
LN Trend (Year-1982) 0.255 0.256
Production Milled (1000 Mt) Area Harvested* 1000 Ha 1
+Export 1000 Mt 1 Import Price (US Dollar per Mt) Intercept 0
LN(Thailand Price 5% Broken Long Grain*(1+Import Tax/100) Dollar per Mt 1.000 1.000
Farm Price (LC per Mt) Intercept 6.843
LN(Thailand Price 35% Broken Long Grain*(1+Import Tax/100)* Exchange Rate Deflated by CPI (2000=100)) Dollar per Mt 0.643 0.644
EUROPEAN UNION-27 Model Average Per Capita Rice Consumption (Kg per Person)
Intercept -13.933
LN(Average Import Price (Tariff inclusive)/Exchange Rate) Euro per Mt -0.081 -0.081
LN(Real GDP at 2000 Prices/Population*1000) GDP per Person 1.631 1.631
Per Capita Japonica Rice Consumption (Kg per Person)
Intercept -8.200
LN(Ex-Mill California Price for Medium & Short Grain Rice –4% Broken Deflated by CPI (2000=100))
Dollar per Cwt. -0.167 -0.167
LN(Real GDP at 2000 Prices/Population*1000) GDP per Person 0.930 0.930
Per Capita Indica Consumption (Kg per Person)
Average Per Capita Rice Consumption - Per Capita Japonica Rice Consumption
Total Consumption (1000 Mt) Average Per Capita Rice Consumption*Population
Total Area Harvested (1000 Ha) Intercept 5.756
LN(LAG(EU Average Farm Price*Yield Milled + Rice Compensatory Payment)/Exchange Rate)) Euro per Mt 0.102 0.102
LN( Fertilizer Cost per Ha Deflated by CPI (2000=100)) Euro per Ha -0.018 Japonica Harvested Area (1000 Ha) Intercept 304.599
LAG(CIF Rotterdam Price (Medium & Short Grain)* Japonica Average Yield/ CIF Rotterdam Price (Long Grain)* Indica Average Yield) 20.540 0.074
LN( Fertilizer Cost per ha Deflated by CPI (2000=100)) Euro per Ha -46.168 -0.183 Indica Harvested Area (1000 Ha)
Area Harvested -
1000 Ha
1
Japonica Area Harvested 1000 Ha -1 Japonica Average Yield (Mt per Ha) Intercept 4.083
Trend (Year – 1990) 0.005 Indica Average Yield (Mt per Ha) Intercept 3.994 Trend (Year – 1990) 0.045 0.093 Japonica Production (1000 Mt) Japonica Area Harvested* 1000 Ha 1
Japonica Average Yield Mt per Ha 1 Indica Production (1000 Mt) Indica Area Harvested* 1000 Ha 1
Indica Average Yield Mt per Ha 1
Total Production (1000 Mt) Indica Milled Production 1000 Mt 1
Japonica Milled Production 1000 Mt 1
Ending Stocks (1000 Mt) Intercept 9.063 LN(EU Average Farm Price Deflated by GDP Deflator (2000=100)) Euro per Mt -0.630 -0.630 LN(Rice Intervention Price) Euro per Mt -0.764 -0.764
43
Total Rice Imports (Extra – EU Trade) (1000 Mt) Intercept 7.971 LN(Average Import Price (Tariff Inclusive)/EU Average Farm Price) -1.000 -1.000 LN(Domestic Consumption-Milled Production) 1000 Mt 0.100 0.100 Japonica Rice Imports (Extra – EU Trade ) (1000 Mt)
0.04*LAG(Imports) 1000 Mt
Japonica Consumption - Japonica Milled Production 1000 Mt Indica Rice Imports (Extra – EU Trade ) (1000 Mt)
Imports – Japonica Imports
Total Rice Exports (Extra _ EU Trade) (1000 Mt) Japonica Exports 1000 Mt. 1
Total Rice Exports - Food Aid Shipments – Rice Maximum Subsidized Exports 1000 Mt Indica Rice Exports (1000 Mt) Intercept 3.111 LN(Thailand Price 5 % Broken Long Grain* Exchange Rate/EU Average Farm Price ) 0.750 0.750 LN(Trend) (Year 1989) 0.050 CIF Rotterdam Import Price (Long Grain) (Euro per Mt)
Intercept 0.354
LN(Thailand Price 5 % Broken Long Grain*Exchange Rate) Euro per Mt 0.906 1.143
LN(LAG(Basmati Rice Imports from India + Basmati Rice Imports from Pakistan)/Imports*100) 1000 Mt 0.207
CIF Rotterdam Import Price (Short & Medium Grain) (Euro per Mt)
Intercept -2.724
LN(Ex-Mill California Price for Medium & Short Grain Rice –4% Brokens/0.0220462*Exchange Rate Euro per Mt 1.266 1.143
LN(LAG(CIF Rotterdam Import Price (Short & Medium Grain))) Euro per Mt 0.000 Endogenous Variable Explanatory Variables Units Parameters Elasticity
TURKEY Model Per Capita Consumption (Kg per Person) Intercept 1.303
LN(Real GDP at 2000 Prices/Population) GDP per Person 1.413 1.413
LN(Import Price Deflated by CPI (2000=100)) LC per Kg -0.010 -0.010 LN(FOB Price*Exchange Rate Deflated by CPI (2000=100)) LC per Mt 0.115 Total Consumption (1000 Mt) Per Capita Consumption Kg per Person 1
Population Millions 1
Area Harvested (1000 Ha) Intercept 1.792 LN(LAG(Area Harvested) 1000 Ha 0.493 0.091 LN(LAG(Import Price Deflated by GDP deflator (2000=100)) LC per Kg 0.046 Yield Milled (Mt per Ha) Intercept 0.600
Year (Year -1959) 0.063
44
Production Milled (1000 Mt) Area Harvested 1000 Ha 1
Yield Milled Mt per Ha 1
Imports (1000 Mt) -Production Milled 1000 Mt -1
-Beginning Stocks 1000 Mt -1
+Domestic Consumption 1000 Mt 1
+Exports 1000 Mt 1
+Ending Stocks 1000 Mt 1
Ending Stocks (1000 Mt) Intercept -13.219
LN(Domestic Consumption) 1000 Mt 2.979
TOTAL MODELED COUNTRIES BY WORLD REGION:
Total Modeled AFRICA = Cameroon + Cote D’Ivoire + Egypt + Ghana + Guinea + Kenya + Mali +
Mozambique + Nigeria + Senegal + Sierra Leone + South Africa + Tanzania
Total Modeled AMERICAS = Argentina + Brazil + Canada + Mexico + United States + Uruguay
Total Modeled ASIA = Bangladesh + Cambodia + China + Hong Kong + India + Indonesia + Iran + Iraq
+ Japan + Malaysia + Myanmar + Pakistan + the Philippines + Saudi Arabia + South Korea + Taiwan +
Thailand + Turkey + Vietnam
Total Modeled EUROPE=EU 27
Total Modeled OCEANIA=Australia
FIVE (5) REST-OF-THE-WORLD (ROW) REGIONAL MODELS:
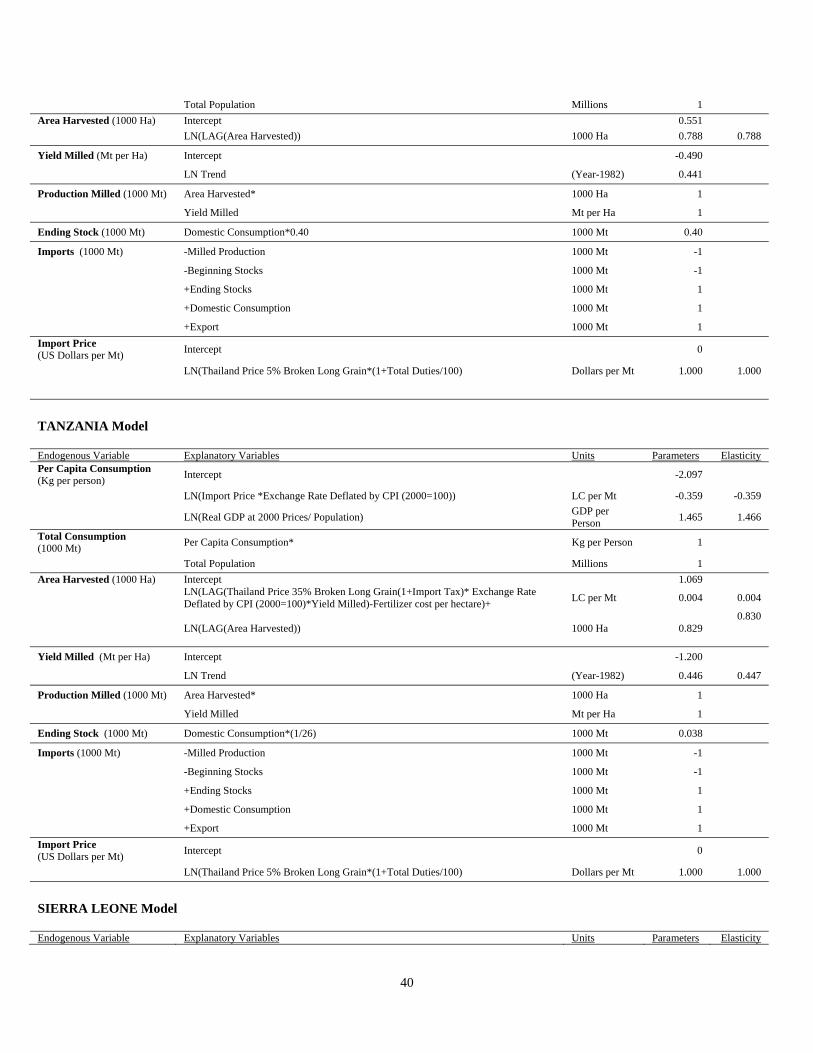
REST-OF-AFRICA MODEL Per Capita Consumption (Kg per Person) Intercept -4.008
LN(Thailand Price 5% Broken Long Grain Deflated by GDP Deflator (2000=100)) US Dollars per Mt -0.110 -0.110
LN(Real GDP at 2000 Prices/Population) US Dollars per Person 0.946 0.946
Total Consumption (1000 Mt) Per Capita Consumption* Kg per Person 1
Population Millions 1
45
Area Harvested (1000 Ha) Intercept 0.529
LN[LAG(Thailand Price 5% Broken Long Grain Deflated by GDP Deflator (2000=100)) US Dollars 0.040 0.040
LN[LAG(Area Harvested)] 1000 Ha 0.460 0.460
Milled Yield (Mt per Ha) Intercept -0.584
LN(Trend) (Year -1982) 0.135 0.135
Milled Production (1000 Mt) Total Area Harvested* 1000 Ha 1
Yield Milled Mt per Ha 1
Ending Stocks (1000 Mt) Total Consumption *(1/52) 1000 Mt 0.0192
Net Imports (1000 Mt)
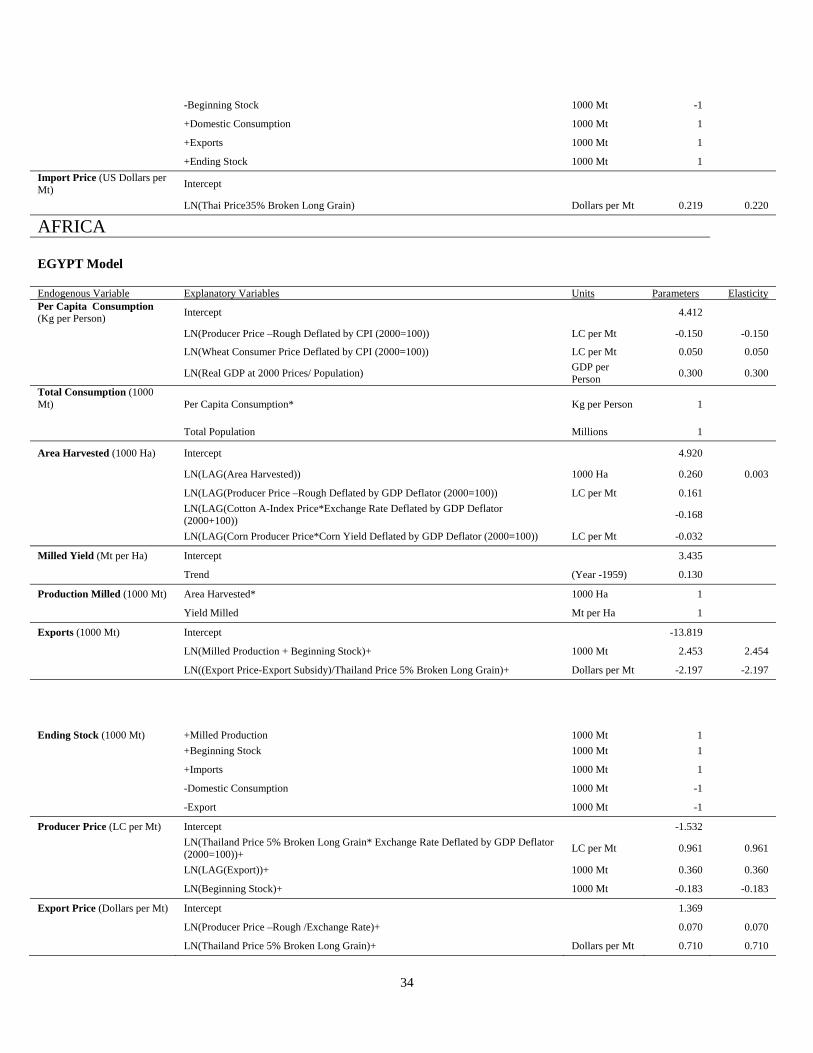
+Milled Production +Beginning Stocks
1000 Mt 1000 Mt
+1
+1
- Ending Stocks 1000 Mt -1
-Domestic Consumption 1000 Mt -1
REST-OF-AMERICAS MODEL Per Capita Consumption (Kg per Person) Intercept -3.074
LN(Thailand Price 5% Broken Long Grain Deflated by GDP Deflator (2000=100)) US Dollars per Mt -0.201 -0.201
LN(Real GDP at 2000 Prices/Population) US Dollars per Person 0.828 0.828
Total Consumption (1000 Mt) Per Capita Consumption* Kg per Person 1
Population Millions 1
Area Harvested (1000 Ha) Intercept 0.916
LN[LAG(Fertilizer Price Deflated by GDP Deflator (2000=100)) US Dollars -0.021 -0.021
LN[LAG(Area Harvested)] 1000 Ha 0.445 0.445 Milled Yield (Mt per Ha)
Intercept 0.267
LN[LAG(Fertilizer Price Deflated by GDP Deflator (2000=100)) LN(Trend)
(Year -1982)
-0.055 0.144
-0.055 0.144
Milled Production (1000 Mt) Total Area Harvested* 1000 Ha 1
Yield Milled Mt per Ha 1
Ending Stocks (1000 Mt) Total Consumption *(0.20) 1000 Mt 0.200
Net Imports (1000 Mt)
+Milled Production +Beginning Stocks
1000 Mt 1000 Mt
+1
+1
- Ending Stocks 1000 Mt -1
-Domestic Consumption 1000 Mt -1
REST-OF-ASIA MODEL Per Capita Consumption (Kg per Person) Intercept 2.230
LN(Thailand Price 5% Broken Long Grain Deflated by GDP Deflator (2000=100)) US Dollars per Mt -0.144 -0.144
LN(Real GDP at 2000 Prices/Population) US Dollars per Person 0.219 0.219
46
Total Consumption (1000 Mt) Per Capita Consumption* Kg per Person 1
Population Millions 1
Area Harvested (1000 Ha) Intercept 1.605
LN[LAG(Area Harvested)] 1000 Ha 0.403 0.403
Milled Yield (Mt per Ha) Intercept -0.029
LN(Trend) (Year -1982) 0.127 0.127
Milled Production (1000 Mt) Total Area Harvested* 1000 Ha 1
Yield Milled Mt per Ha 1
Ending Stocks (1000 Mt) Total Consumption *(1/52) 1000 Mt 0.0192
Net Imports (1000 Mt)
+Milled Production +Beginning Stocks
1000 Mt 1000 Mt
+1
+1
- Ending Stocks 1000 Mt -1
-Domestic Consumption 1000 Mt -1
REST-OF-EUROPE MODEL Per Capita Consumption (Kg per Person) Intercept -3.880
LN(Thailand Price 5% Broken Long Grain Deflated by GDP Deflator (2000=100)) US Dollars per Mt -0.342 -0.342
LN(Real GDP at 2000 Prices/Population) US Dollars per Person 0.640 0.640
Total Consumption (1000 Mt) Per Capita Consumption* Kg per Person 1
Population Millions 1
Area Harvested (1000 Ha) Intercept 1.996
LN[LAG(Thailand Price 5% Broken Long Grain Deflated by GDP Deflator (2000=100)) US Dollars 0.059 0.059
LN[LAG(Area Harvested)] 1000 Ha 0.297 0.297
Milled Yield (Mt per Ha) Intercept -0.923
LN(Trend) (Year -1982) 0.299 0.299
Milled Production (1000 Mt) Total Area Harvested* 1000 Ha 1
Yield Milled Mt per Ha 1
Ending Stocks (1000 Mt) Total Consumption *(1/6) 1000 Mt 0.167
Net Imports (1000 Mt)
+Milled Production +Beginning Stocks
1000 Mt 1000 Mt
+1
+1
- Ending Stocks 1000 Mt -1
-Domestic Consumption 1000 Mt -1
REST-OF-OCEANIA MODEL Per Capita Consumption (Kg per Person) Intercept 0.300
LN(Real GDP at 2000 Prices/Population) US Dollars per Person 0.000 0.000
47
Total Consumption (1000 Mt) Per Capita Consumption* Kg per Person 1
Population Millions 1
Area Harvested (1000 Ha) Intercept 0.715
LN[LAG(Area Harvested)] 1000 Ha 0.318 0.318
Milled Yield (Mt per Ha) Intercept 0.536
LN[(LAG(Fertilizer Price Deflated by GDP Deflator, (2000=100))] LN(Trend)
(Year -1982)
-0.110 0.114
-0.110 0.114
Milled Production (1000 Mt) Total Area Harvested* 1000 Ha 1
Yield Milled Mt per Ha 1
Ending Stocks (1000 Mt) Total Consumption *(1/52) 1000 Mt 0.0192
Net Imports (1000 Mt)
+Milled Production +Beginning Stocks
1000 Mt 1000 Mt
+1
+1
- Ending Stocks 1000 Mt -1
-Domestic Consumption 1000 Mt -1
TOTAL REST-OF-THE-WORLD (ROW) TOTAL ROW = Rest-of-Africa + Rest-of-Americas + Rest-of-Asia + Rest-of- Europe + Rest-of- Oceania
TOTAL WORLD BY REGION Total AFRICA = Total Modeled Africa + Rest-of- Africa Total AMERICAS = Total Modeled Americas + Rest-of- Americas
Total ASIA = Total Modeled Asia + Rest-of- Asia Total EUROPE = Total Modeled Europe + Rest-of- Europe Total OCENIA = Total Modeled Oceania + Rest-of- Oceania
TOTAL WORLD
TOTAL WORLD = Total AFRICA + Total AMERICAS + Total ASIA + Total EUROPE + Total OCEANIA
Japonica Net Import Share for ROW Intercept -1.640
LN(Ex-Mill California Price for Medium & Short Grain Rice, 4% Brokens*22.04622/Thailand Price 100% Long Grain)
US Dollars per Mt -0.500 -0.500
48
References Agcaoili-Sombilla and Rosegrant. “International Trade in a Differentiated good: Trade
Elasticities in the World Rice Market.” Agricultural Economics 10 (1994):257-267. Cramer, Gail L., Eric J. Wailes, and Shangnan Shui. “Impacts of Liberalizing Trade in the
World rice Market.” American Journal of Agricultural Economics 75 (February 1993):219-226.
Falcon, Walter P. and Eric A. Monke. “International Trade in Rice.” Food Research Institutes
Studies. 17(1979-80):279-306. FAO. “The rice market on the EEC.” Document CCP:RI 94/CRS 2, 37h Session of the
Intergovernmental Group on Rice, 1994 Karp, Larry S. and Jeffrey M. Perloff. “Dynamic Oligopoly in the Rice Export Market.” The
Review of Economics and Statistics. 71(1989):462-470. Jayne, T.S. “Source and Effects of Instability in the World Rice Market.” MSU (Michigan State
University) International Development Paper No. 13, 1993. Petzel, Todd Z. and Eric A. Monke. “The Integration of the International Rice Market.” Food
Research Institutes Studies. 17(1979-80):307-326. Rastegari-Henneberry, Shida. “The World Rice Market.” Giannini Foundation Information
Series. University of California at Davis, No. 85-2, 1985. Siamwalla, Ammar and Stephen Haykin. “The World Rice Market: Structure, Conduct, and
Performance.” Research Report, International Food Policy Research Institute. No.39, June 1983.
Song, JooHo and Colin A. Carter. “Rice Trade Liberalization and Implications for U.S. Policy.”
American Journal of Agricultural Economics, 78 (Nov. 1996): 891-905 Sullivan, John, Vernon Roningen, Susan Leetmaa, and Denice Gray. “A 1989 Global Database
for the Static World Policy Simulation (SWOPSIM) Modeling Framework.” USDA, ERS, 1992.
United States Naval Oceanographic Office. Distances between ports. Washington, U.S.
Government Printing Office, 1965. Wailes, Eric. 1998. The World Rice Market and Medium Term Outlook. OECD. Directorate
for Food, Agriculture and Fisheries, Committee for Agriculture. Group on Cerals, Animal Feeds and Sugar. AGR/CA/APM/CFS(98)3
49
Yap, C. L. “Supply and Demand for Rice in the Medium and Longer Term.” Document IRC
94/4, 18th Session of the International Rice Commission, 1994. Yap, C. L. “The Impact of Regional Trade Agreements in Latin America on Rice Trade.”
Document CCP: RI 96/INF.3, FAO, 1996 Yap, C. L. “Supply and Demand for Mediterranean Rice.” 2nd Technical Consultation of the
International Cooperative Research Network on Rice, FAO, 1996 Yap, C. L. “China: Rice Market Reforms.” Food Policy. 19(1994):367-379. Yap, C. L. “Implications of the Uruguay Round on the World Rice Economy.” Food Policy.
21(1996):377-399. Yumkella, K.K., L. J. Unnevehr and P. Garcia. “Noncompetitive Pricing and Exchange Rate
Pass-Through in Selected U.S. and Thai Rice Markets.” Journal of Agricultural and Applied Economics 26 (December 1994):406-416.
Zhang, Mei Miranda. Competitiveness in United States Grain Exports, Cost-effective Shipping
Patterns in International Rice Marketing. New York: Garland Publishing, Inc., 1996