286
1
| Date post: | 24-Dec-2015 |
| Category: |
Documents |
| Upload: | annabel-bridges |
| View: | 234 times |
| Download: | 12 times |

1

22
Abiqua Acres
WIP Units
5,000
60,000
8,000
57,000 Out
BI
IN
EI
DM
100%
100%
CC
40%
50%
WIP - $ (Wtd. Avg.)
DM $20,000.00
CC 16,000.00
DM 250,000.00
CC 450,000.00
DM $33,230.40
CC 30,557.20
$63,787.60
57,000 × $11.7932
= $672,212.40
= 8,000 × $4.1536
= 4,000 × $7.6393
E.U.
DM CC
57,000
8,000
65,000
57,000
4,000
61,000
Costs to Account For
$ 20,000
250,000
$270,000
$ 16,000
450,000
$466,000
BI
IN
Total
$/EU
$270,000 / 65,000 = $4.1538
$ 11.7932 per E.U.
OUT
EI: (DM) 8,000 × 100%
EI: (CC) 8,000 × 50%
E.U.
WEIGHTED AVERAGE METHOD
$466,000 / 61,000 = $7.6393
BIOut
IN
EI
DM
DM
CC
CC
1. 2.
5.
6.
3. 4.

33
Abiqua Acres (p. 2)WIP Units
5,000
60,000
8,000
57,000 Out
BI
IN
EI
DM
100%
100%
CC
40%
50%
WIP - $ (FIFO)
DM $ 20,000.00
CC 16,000.00
DM 250,000.00
CC 450,000.00
DM $33,333.60
CC 30,508.40
$63,842.00
$ 36,000.00 from BI
22,881.30 Finished CC 5,000×60%×$7.6271
613,277.60 S&F 52,000 × $11.7938
$672,158.90
= 8,000 × $4.1667
= 4,000 × $7.6271
E.U.
DM CC
- 0 -
52,000
8,000
60,000
3,000
52,000
4,000
59,000
Costs to Account For
DM CC
$4.00
$8.00
$ per EU
BI: (DM) 5,000× 0%
BI: (CC) 5,000×60%
Start & Finish
EI: (DM) 8,000×100%
EI: (CC) 8,000× 50%
E.U.
FIFO METHOD
$20,000 DM ÷ (5,000×100%)
$16,000 CC ÷ (5,000× 40%)
Total
$12.00
$4.1667
$7.6271
$ per EU
$250,000 DM ÷ 60,000 E.U.
$450,000 CC ÷ 59,000 E.U. $11.7938
$736,000 Costs to Account For
BI
OutIN
EI
BI
IN
1. 2.
5.
6.
3.
4.

44
Abtex Electronics
SP VC CM Mix
Wtd. Avg.
CM
TapeRecorders
$15.00 $8.00 $7.00 1/3 $2.33
Electronic
Calculators$22.50 $9.50 $13.00 2/3 $8.67
$11.00
BE(units) =FC
CM per unit=
$280,000+ $1,040,000
$11.00= 120,000 units
40,000TapeRecorders
80,000ElectronicCalculators
⅓ ⅔
1.
55
Abtex Electric (p. 2)
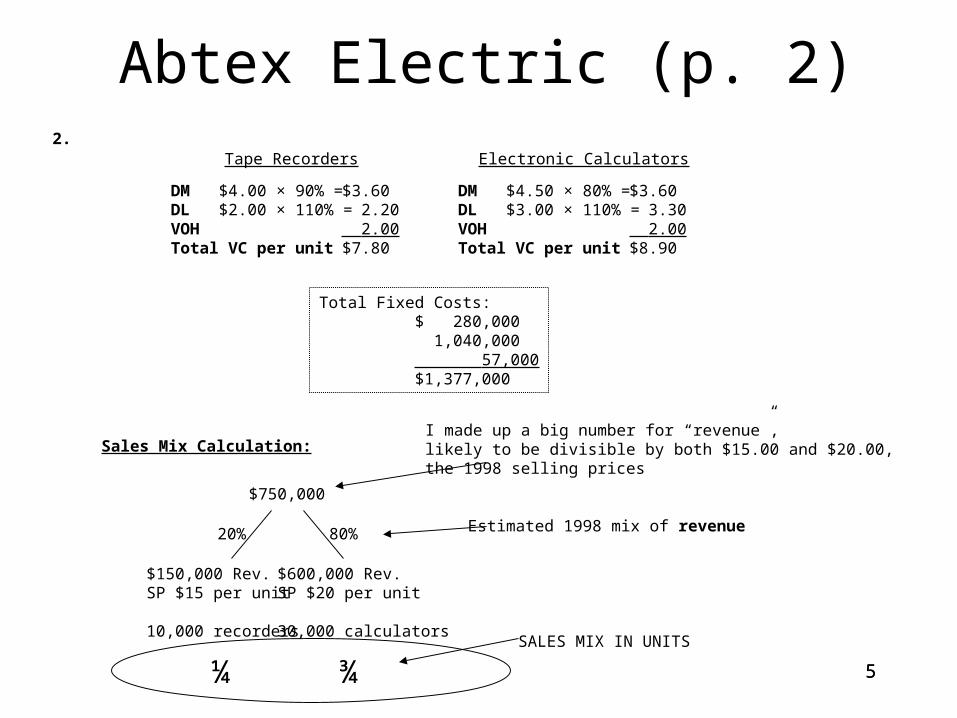
Tape Recorders Electronic Calculators
DM $4.00 × 90% =DL $2.00 × 110% =VOH Total VC per unit
DM $4.50 × 80% =DL $3.00 × 110% =VOH Total VC per unit
$3.60 2.20 2.00$7.80
$3.60 3.30 2.00$8.90
Total Fixed Costs:$ 280,000 1,040,000 57,000$1,377,000
Sales Mix Calculation:
$750,000
I made up a big number for “revenue”,likely to be divisible by both $15.00 and $20.00,the 1998 selling prices
20% 80% Estimated 1998 mix of revenue
$600,000 Rev.SP $20 per unit
30,000 calculators
$150,000 Rev.SP $15 per unit
10,000 recorders
¼ ¾SALES MIX IN UNITS
2.
66
Abtex Electric (p. 3)
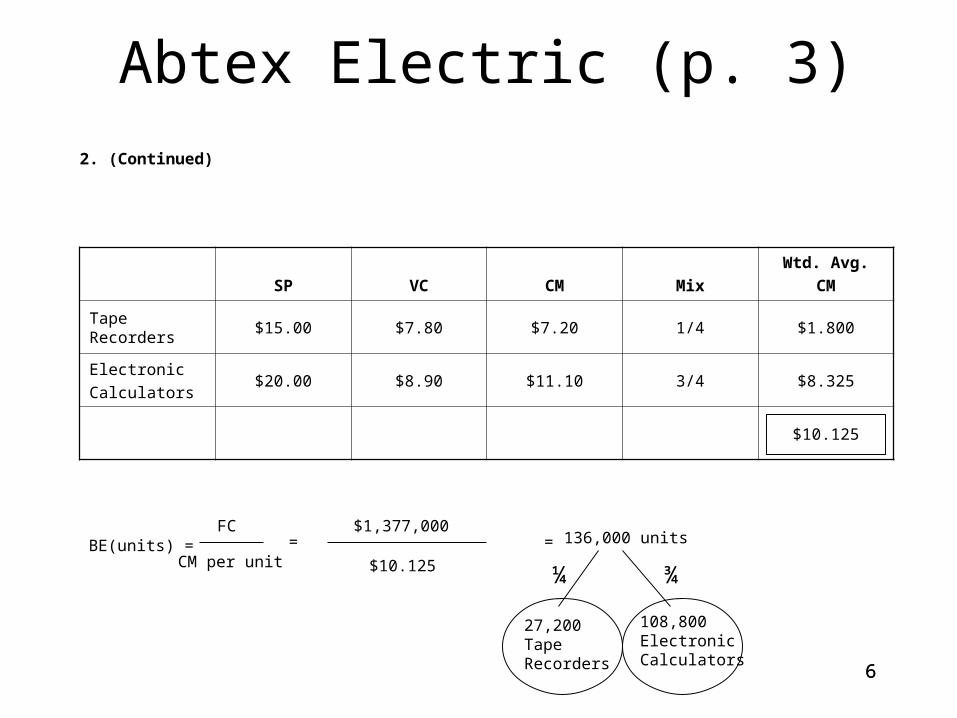
2. (Continued)
SP VC CM Mix
Wtd. Avg.
CM
TapeRecorders
$15.00 $7.80 $7.20 1/4 $1.800
Electronic
Calculators$20.00 $8.90 $11.10 3/4 $8.325
$10.125
BE(units) =FC
CM per unit=
$1,377,000
$10.125
= 136,000 units
27,200TapeRecorders
108,800ElectronicCalculators
¼ ¾
77
Adams’ Co.
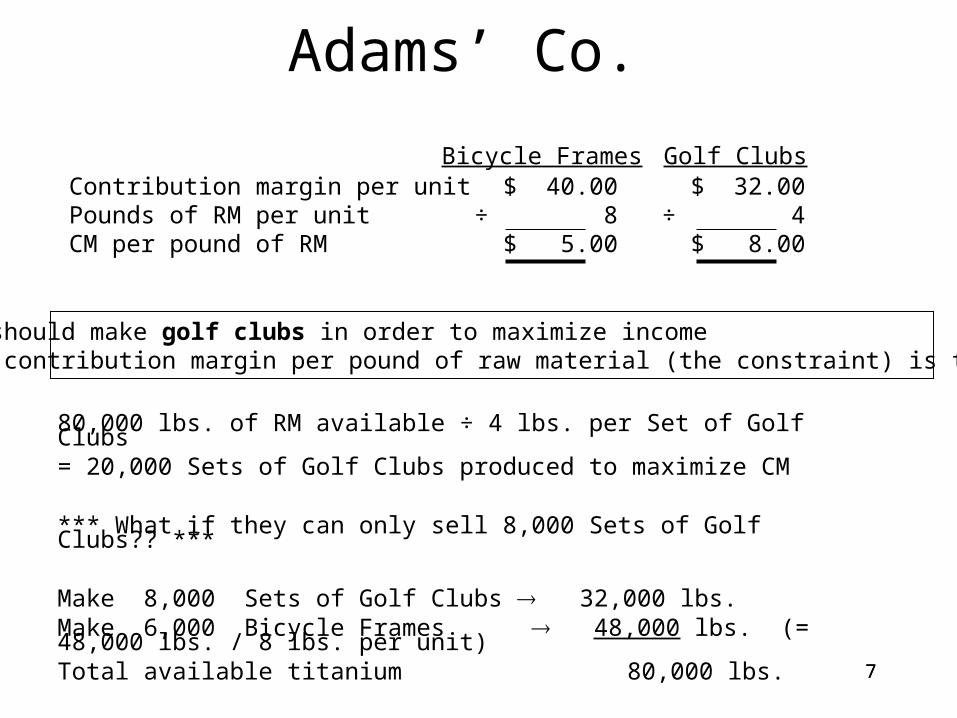
80,000 lbs. of RM available ÷ 4 lbs. per Set of Golf Clubs= 20,000 Sets of Golf Clubs produced to maximize CM *** What if they can only sell 8,000 Sets of Golf Clubs?? *** Make 8,000 Sets of Golf Clubs 32,000 lbs.Make 6,000 Bicycle Frames 48,000 lbs. (= 48,000 lbs. / 8 lbs. per unit)Total available titanium 80,000 lbs.
Contribution margin per unitPounds of RM per unitCM per pound of RM
$ 40.00÷ 8$ 5.00
$ 32.00÷ 4$ 8.00
Bicycle Frames Golf Clubs
Adams’ Co. should make golf clubs in order to maximize incomebecause the contribution margin per pound of raw material (the constraint) is the greatest.
88
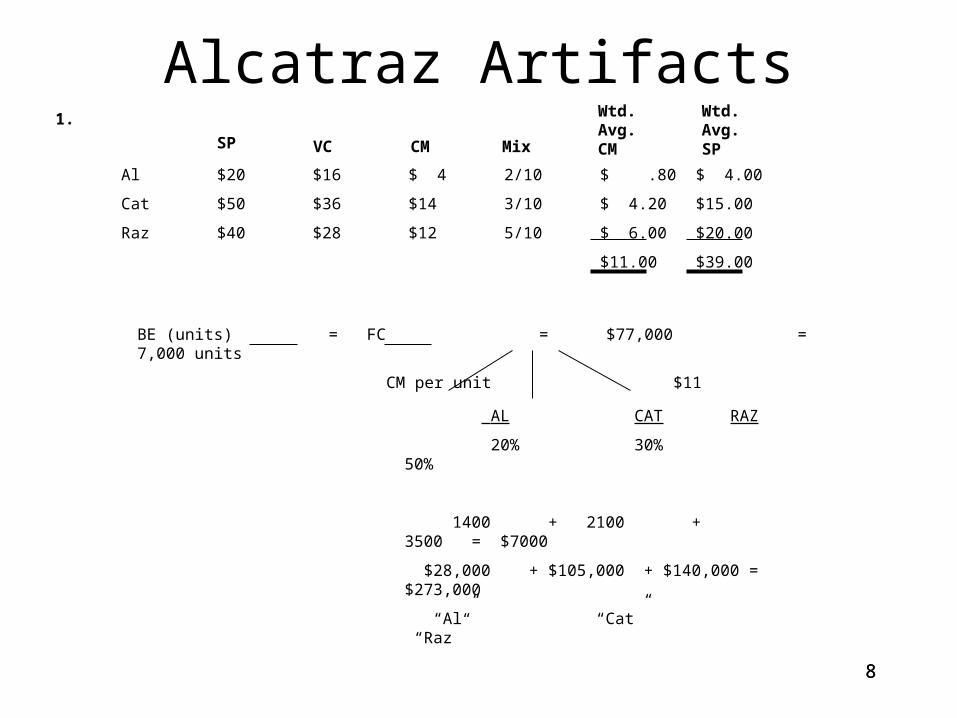
1.
Al $20 $16 $ 4 2/10 $ .80 $ 4.00
Cat $50 $36 $14 3/10 $ 4.20 $15.00
Raz $40 $28 $12 5/10 $ 6.00 $20.00
$11.00 $39.00
BE (units) = FC = $77,000 = 7,000 units
CM per unit $11
AL CAT RAZ
20% 30% 50%
1400 + 2100 + 3500 = $7000
$28,000 + $105,000 + $140,000 = $273,000
“Al” “Cat” “Raz”
Alcatraz ArtifactsSP VC CM Mix
Wtd.Avg.CM
Wtd.Avg.SP

99
2.
WTD.AVG.
SP VC CM MIX CMAl $20 $16 $ 4 .40 $1.60Cat $50 $36 $14 .40 $5.60Raz $40 $28 $12 .20 $2.40
$9.60BE (units) = FC = $77,000 = 8021 units
CM per units $9.60
Al Cat Raz
40% + 40% + 20%
3,209 + 3208 + 1,604
$64,180 + $160,400 + $64,160 = $288,740
Increased BE point because more low profit “Al’s” were sold.
Alcatraz Artifacts (p. 2)

1010
Andretti Company
Variable cost per unit:
Direct material
Direct labor
Variable OH
Variable S&A
$10.00
4.50
2.30
1.20
$18.00Total
Fixed expenses:
Fixed OH
Fixed S&A
$300,000
210,000
$510,000Total
Before increase in selling expenses:
Net Income:
Sales
Variable costs
CM
Fixed costs
$1,920,000
(1,080,000)
$840,000
$330,000Net Income
(510,000)
($32*60,000 units)
($18*60,000 units)
Variable cost per unit:
Direct material
Direct labor
Variable OH
Variable S&A
$10.00
4.50
2.30
1.20
$18.00Total
Fixed expenses:
Fixed OH
Fixed S&A
$300,000
290,000
$590,000Total
After increase in selling expenses:
Net Income:
Sales
Variable costs
CM
Fixed costs
$2,400,000
(1,350,000)
$1,050,000
$460,000Net Income
(590,000)
($32*75,000 units)
($18*75,000 units)
Andretti should increase fixed selling expenses by $80,000 because it increases net income by $130,000 ($460,000 - $330,000).
1.

1111
Andretti Company (p. 2)
Variable expenses:
Direct material
Direct labor
Variable OH
Duties
$10.00
4.50
2.30
1.70
$21.70Total
Variable S&A 3.20
Minimum selling price should be set at breakeven point.
Breakeven is when TR = TC.
Let x equal unit selling price per unit:
TR = TC
(Quantity)*(Selling Price) = (Quantity)*(Variable expenses) + Fixed Costs
Increased fixed expenses:
Permits $9,000
$9,000Total
20,000x = (20,000) * ($21.70) + $9,000
20,000x = $443,000
x = $22.15
2. 3.
The relevant cost figure is $1.20 per unit, which is thevariable selling expense per Dak. Since the irregularunits have already been produced, all production costs(including the variable production costs) are sunk. Thefixed selling expenses are not relevant since they willnot change regardless of whether or not the irregularunits are sold.
1212
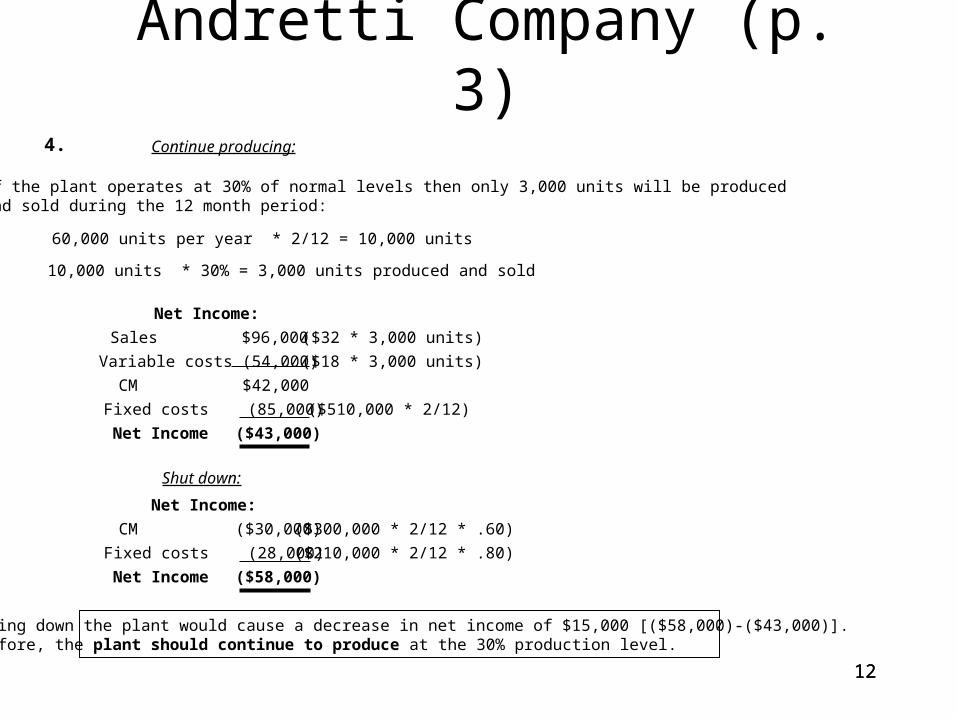
Andretti Company (p. 3)Continue producing:
If the plant operates at 30% of normal levels then only 3,000 units will be producedand sold during the 12 month period:
60,000 units per year * 2/12 = 10,000 units
10,000 units * 30% = 3,000 units produced and sold
Net Income:
Sales
Variable costs
CM
Fixed costs
$96,000
(54,000)
$42,000
($43,000)Net Income
(85,000)
($32 * 3,000 units)
($18 * 3,000 units)
($510,000 * 2/12)
Shut down:
CM
Fixed costs
($30,000)
($58,000)Net Income
(28,000)
($300,000 * 2/12 * .60)
($210,000 * 2/12 * .80)
Shutting down the plant would cause a decrease in net income of $15,000 [($58,000)-($43,000)].Therefore, the plant should continue to produce at the 30% production level.
4.
Net Income:

1313
Andretti Company (p. 4)
Relevant costs avoided by purchasingfrom outside supplier:
Direct material
Direct labor
Variable OH
Variable S&A
$10.00
4.50
2.30
0.40
$20.95Total
Fixed OH
Variable S&A
3.75
0.00
[($300,000*.75)/60,000]
[$1.20*1/3]
The outside supplier’s quote must be less than $20.95per unit in order to purchase from it.
5.
1414
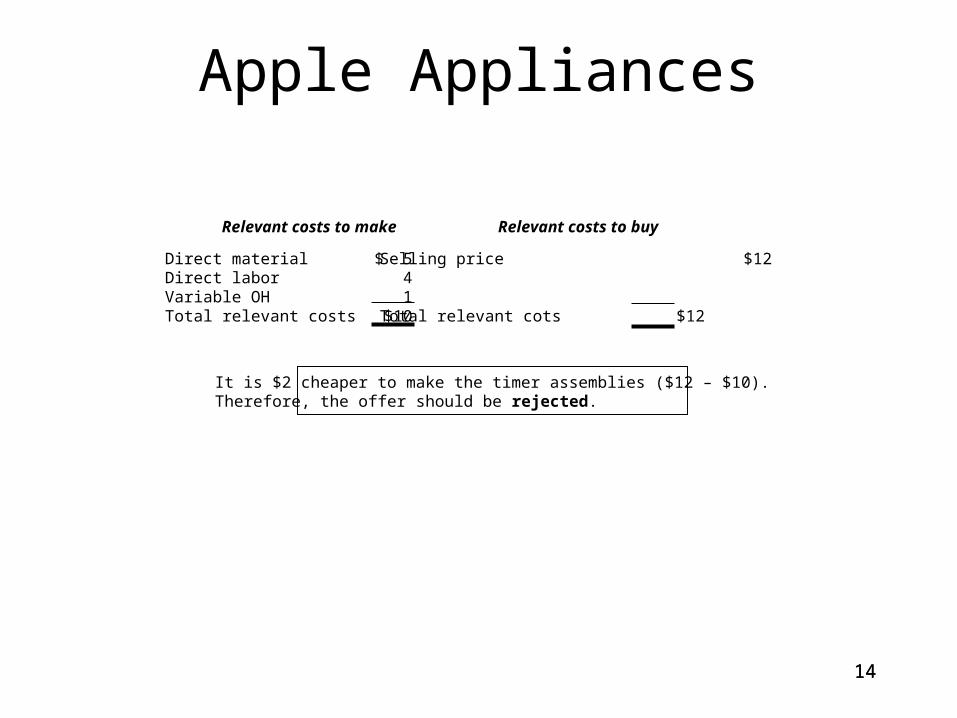
Apple Appliances
Relevant costs to make
$ 541
$10
Relevant costs to buy
Selling price $12
Total relevant cots $12
Direct materialDirect laborVariable OHTotal relevant costs
It is $2 cheaper to make the timer assemblies ($12 – $10).Therefore, the offer should be rejected.

1515
Arc Light & SoundRaw Materials
$ 32,000BI
$170,000Purch$144,000$ 36,000
$22,000EI
Work in Progress
BI
EI
$ 20,000
$700,000
Finished Goods
BI $ 48,000
$720,000
EI $28,000
$144,000
$200,000
$350,000
$700,000
$ 14,000
MOH
$ 36,000
$ 82,000
$ 65,000
$ 18,000
$153,000
$350,000
COGS
$720,000$4,000
$ 4,000
COGM
I/S
$724,000
$100,000
$ 90,000
$ 2,000
$ 27,000
$1,000,000 SalesCOGS
Adver.
Salary
Insur.
Depr.
$ 57,000 OI
IDM
IDL
Util.
Fact. Ins.
Fact. Depr.
S&A
S&A
S&A
S&A
Direct Labor
$200,000 $200,000
- 0 -
$ 4,000
- 0 -
$724,000
1.
- 0 -
1616
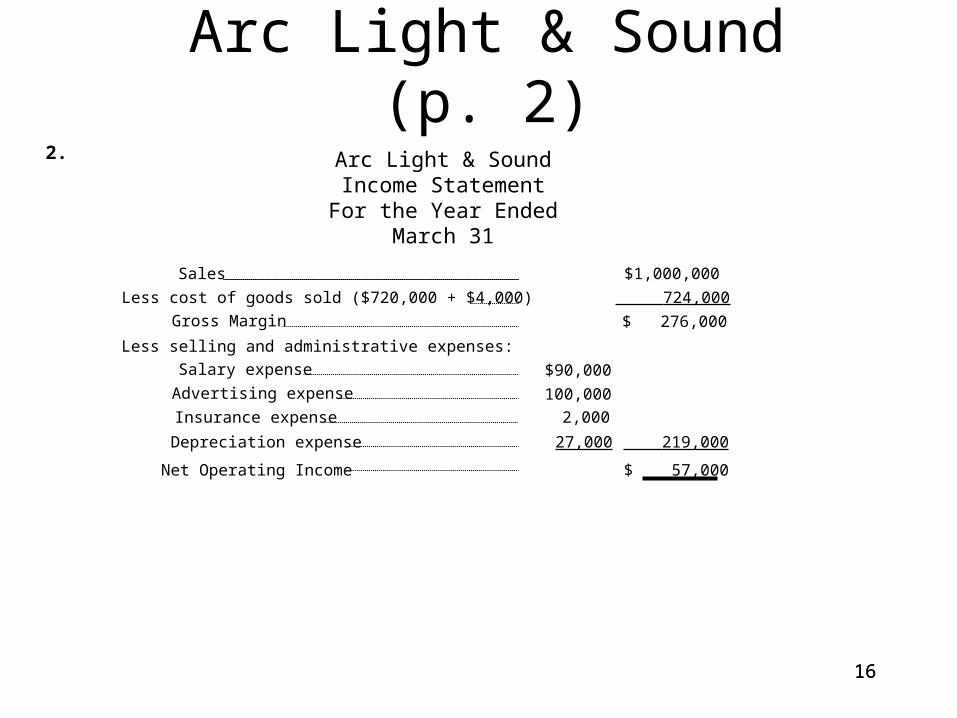
Arc Light & Sound (p. 2)Arc Light & SoundIncome Statement
For the Year Ended March 31
Sales $1,000,000
Less cost of goods sold ($720,000 + $4,000) 724,000
Gross Margin $ 276,000
Less selling and administrative expenses:
Salary expense $90,000
Advertising expense 100,000
Insurance expense 2,000
Depreciation expense 27,000 219,000
Net Operating Income $ 57,000
2.

17
Archer Company
UNITS UNITS UNITS UNITS
FG - Mar FG - April FG - May FG - June
6000
6000
32,000
8,000(20% x 40,000)
Produce30,000
BI 8000Produce 44,000 40,000
EI 12,000(20% x 60,000)
60,000
RM UNITS
RM - April
RM UNITS
RM - May
RM UNITS
FG - June
44,000 x 3
= 132,000
33,000 lbs.(25% x 132,000)
24,000 lbs.Purchase 105,000 lbs.
32,000 x 3= 96,000 lbs,
a.
b.

18
$ 9,000
$40,000
$11,000
$32,300 (85%)
$ 5,700 (15%)
RM
BI
Purch
EI
$ 20,000
32,300
45,000
64,200
$ 21,500
$140,000
BI
EI
WIP
$ 32,000
140,000
$ 42,000
$ 130,000
BI
EI
FG
$ 45,000 $ 45,000
- 0 -
DL
MOH
$ 5,700
19,100
27,000
10,000
2,400
64,200 $ 64,200
- 0 -
IDM
Mfg Utilities
Mfg Depr
IDL
Prepd Insur
COGS
I/S
$ 130,000
9,000
48,000
30,000
600
9500
$ 250,000COGS
Depr. Exp.
Adv. Exp.
Admin. Salaries
Prepaid Ins.
Misc. S&A
Sales
NI BT
$ 130,000
- 0 -
$ 130,000
COGS
Astoria Company
$ 22,900$ 4,580Inc. Tax
NI AT$ 18,320$ 18,320
- 0 -
(to R/E)
COGM
19
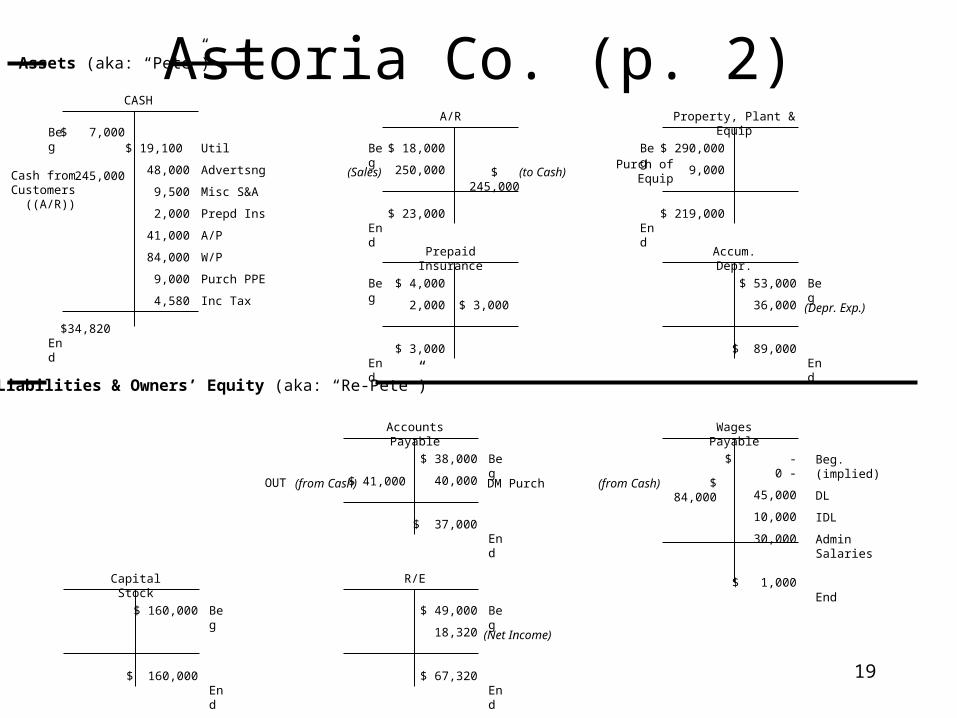
Astoria Co. (p. 2)$ 7,000
245,000
$34,820
$ 19,100
48,000
9,500
2,000
41,000
84,000
9,000
4,580
Beg
End
CASH
Assets (aka: “Pete”)
$ 18,000
250,000
$ 23,000
$ 245,000
Beg
End
A/R
$ 290,000
9,000
$ 219,000
Beg
End
Property, Plant & Equip
$ 53,000
36,000
$ 89,000
Beg
End
Accum. Depr.
Cash fromCustomers
((A/R))
Util
Advertsng
Misc S&A
Prepd Ins
A/P
W/P
Purch PPE
Inc Tax
Liabilities & Owners’ Equity (aka: “Re-Pete”)
$ 38,000
40,000
$ 37,000
Beg
End
Accounts Payable
$ - 0 -
45,000
10,000
30,000
$ 1,000
Wages Payable
$ 160,000
$ 160,000
Beg
End
Capital Stock
$ 49,000
18,320
$ 67,320
Beg
End
R/E
$ 84,000
(to Cash)(Sales)
(Depr. Exp.)
(Net Income)
$ 4,000
2,000
$ 3,000
Beg
End
Prepaid Insurance
Beg. (implied)
DL
IDL
Admin Salaries
End
(from Cash)
Purch ofEquip
$ 3,000
$ 41,000 DM Purch(from Cash)OUT

20
Astoria Company (p. 3)Cannon Beach Sand Company
Balance SheetAs of December 31, 2001
Assets CashA/RPrepd InsurPPEAccum DeprRMWIPFG
Total
$ 34,820 23,000 3,000
219,000 (89,000)11,000 21,500 42,000
$265,320
Liabilities& Owners’Equity
A/PW/PC/SR/E
Total
$ 37,000 1,000
160,000 67,320
$265,320

21
Astoria Company (p. 4)Astoria Company
Statement of Cash Flows (Indirect Method)For the Year-Ended December 31, 2001
Net Income
Depr. Exp↑ A/R (use)↓ Prepd Ins (source)↑ DM (use)↑ WIP (use)↑ FG (use)↓ A/P (use)↑ W/P (source)
Net Cash provided byOperating Activities
Purch of Equipment
Net Cash used byInvesting Activities
Net increase in cash
Beg. Cash
End Cash
$ 18,320
+ 36,000 - 5,000 + 1,000 - 2,000 - 1,500 - 10,000 - 1,000 + 1,000
$ 36,820
$ - 9,000
$ (9,000)
$ 27,820
7,000
$ 34,820
Calculation of Free Cash Flows
Cash from OperationsLess: Capital Expenditures (net)
Free Cash Flows
$36,8209,000
$27,820
Operating Activities
Investing Activities
2222
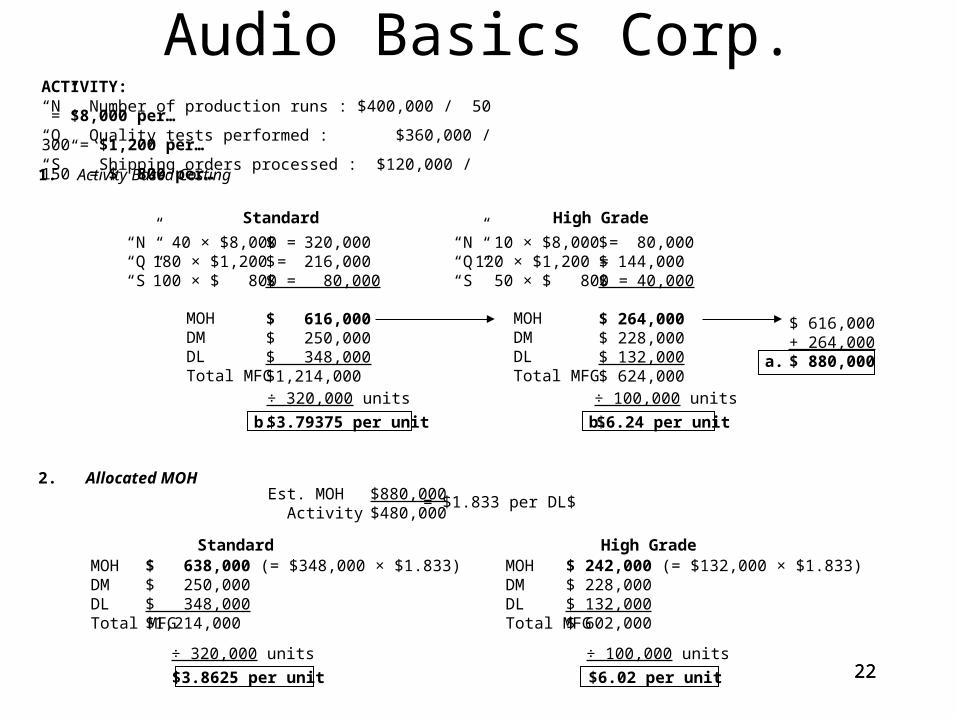
ACTIVITY:“N” Number of production runs : $400,000 / 50 = $8,000 per…“Q” Quality tests performed : $360,000 / 300 = $1,200 per…“S” Shipping orders processed : $120,000 / 150 = $ 800 per…
Audio Basics Corp.
Activity Based Costing
Standard High Grade
“N”“Q”“S”
40 × $8,000 =180 × $1,200 =100 × $ 800 =
$ 320,000$ 216,000$ 80,000
$ 616,000$ 250,000$ 348,000$1,214,000
MOHDMDLTotal MFG
÷ 320,000 units
$3.79375 per unit
“N”“Q”“S”
10 × $8,000 =120 × $1,200 = 50 × $ 800 =
$ 80,000$ 144,000$ 40,000
$ 264,000$ 228,000$ 132,000$ 624,000
MOHDMDLTotal MFG
÷ 100,000 units
$6.24 per unit
a.
b.
Allocated MOHEst. MOH Activity
$880,000$480,000
= $1.833 per DL$
$ 638,000 (= $348,000 × $1.833)$ 250,000$ 348,000$1,214,000
MOHDMDLTotal MFG
÷ 320,000 units
$3.8625 per unit
$ 242,000 (= $132,000 × $1.833)$ 228,000$ 132,000$ 602,000
MOHDMDLTotal MFG
÷ 100,000 units
$6.02 per unit
Standard High Grade
$ 616,000+ 264,000$ 880,000
1.
2.
b.
2323
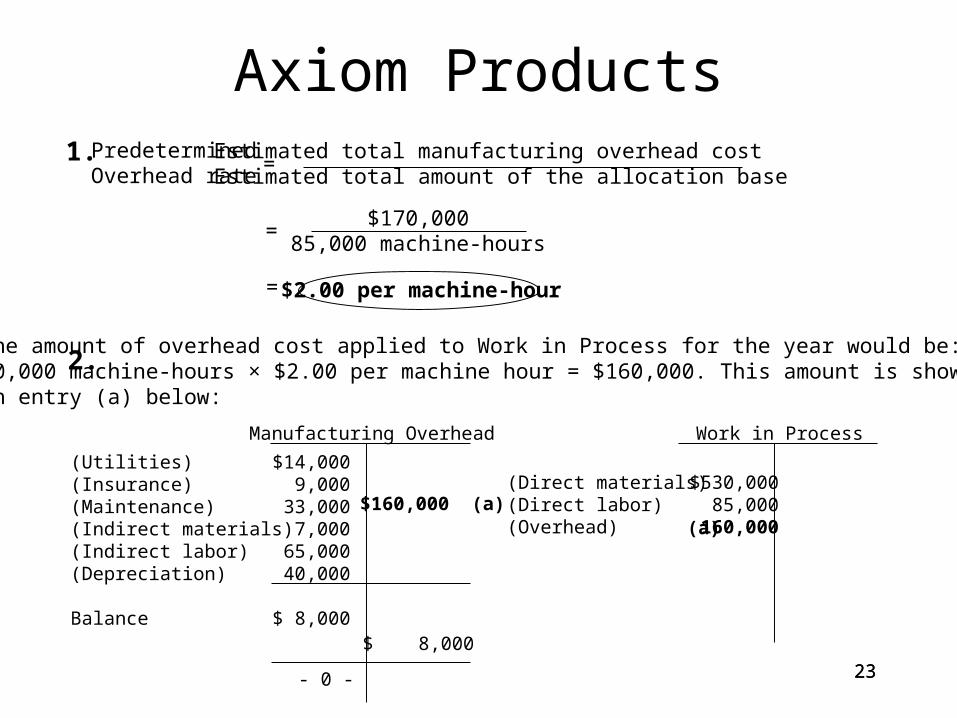
Axiom Products1. Predetermined
Overhead rate=
Estimated total manufacturing overhead costEstimated total amount of the allocation base
=$170,000
85,000 machine-hours
= $2.00 per machine-hour
2.The amount of overhead cost applied to Work in Process for the year would be:80,000 machine-hours × $2.00 per machine hour = $160,000. This amount is shownin entry (a) below:
Manufacturing Overhead
(Utilities)(Insurance)(Maintenance)(Indirect materials)(Indirect labor)(Depreciation)
Balance
$14,0009,000
33,0007,000
65,00040,000
$ 8,000
$160,000 (a)
Work in Process
(Direct materials)(Direct labor)(Overhead)
$530,00085,000
160,000 (a)
$ 8,000
- 0 -

2424
Axiom Products (p. 2)3. Overhead is underapplied by $8,000 for the year, as shown in the Manufacturing
Overhead account above. The entry to close out his balance to Cost of Goods Sold would be:
Cost of Goods Sold………………………………... Manufacturing Overhead ………………………..
8,000 8,000
4. When overhead is applied using a predetermined rate based on machine-hours, it is assumed thatoverhead cost is proportional to machine-hours. So when the actual level of activity turns out to be80,000 machine-hours, the costing system assumes that the overhead will be80,000 machine-hours × $2.00 per machine hour, or $160,000. This is a drop of $10,000 from theinitial estimated total manufacturing overhead cost of $170,000. However, the actual total manufacturingoverhead did not drop by this much. The actual total manufacturing overhead was $168,000—a drop ofonly $2,000 from the estimate. The manufacturing overhead did not decline by the full $10,000 becauseof the existence of fixed costs and/or because overhead spending was not under control.

2525
The Baize Company
PDOR = Estimated MOH
Estimated Activity=
$403,200
21,000 DLH
=
$19.20 per DLH
Applied MOH = Actual Activity × PDOR 20,000 DLH × $19.20 $384,000
MOH
$378,000
$6,000
$6,000
- 0 -to COGS
Overapplied
=
=1.
2.
3.
$384,000

2626
Bags and More
Unit cost * (1-CMR)
2a.BE (units)
FC + NI
CMU=
$360,000
$24= 15,000 units
BE ($) = $900,000FC + NI
CMR=
$360,000
0.40
$60 * (100% - 40%)
$36
Variable expenses (per unit) =
Variable expenses (per unit) =
$60 - $36 Contribution margin (per unit) =
Contribution margin (per unit) = $24
=
=
Variable expenses (per unit) =1.
2727
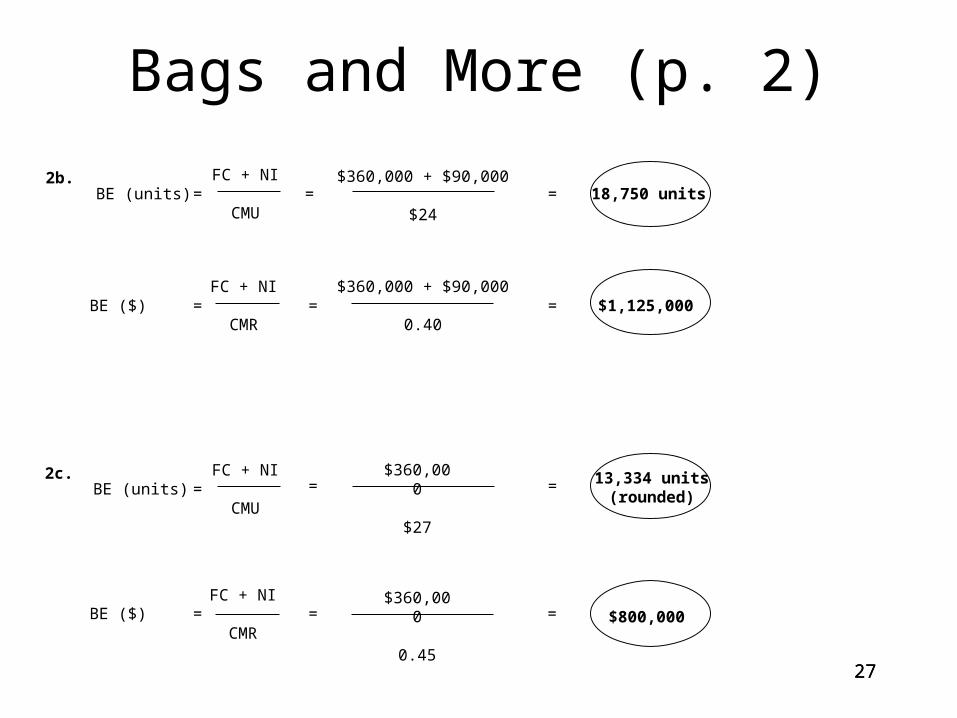
Bags and More (p. 2)
2b.BE (units)
FC + NI
CMU= = 18,750 units
BE ($) = $1,125,000
$360,000 + $90,000
$24
2c.BE (units)
FC + NI
CMU
$360,000
$27
= 13,334 units(rounded)
BE ($) $800,000=
FC + NI
CMR
$360,000 + $90,000
0.40=
$360,000
0.45
FC + NI
CMR=
=
=
=
=
=

28
1.
2.
DMPrice Qty
AQ × AC14,000 × $1.80 $25,200
AQ × SC14,000 × $1.75 $24,500
SQ × SC × $1.75
$700 U
AQ × SC13,250 × $1.75 $23,187.50
SQ × SC12,600 × $1.75 $22,050
(6300)(2)
$1137.50 U
DL
AQ × AC4,100 × $9.05 $37,105
AQ × SC4,100 × $9.00 $36,900
SQ × SC(2000)(2) × $9.00 $36,000
$205 U
Rate Efficiency
$900 U
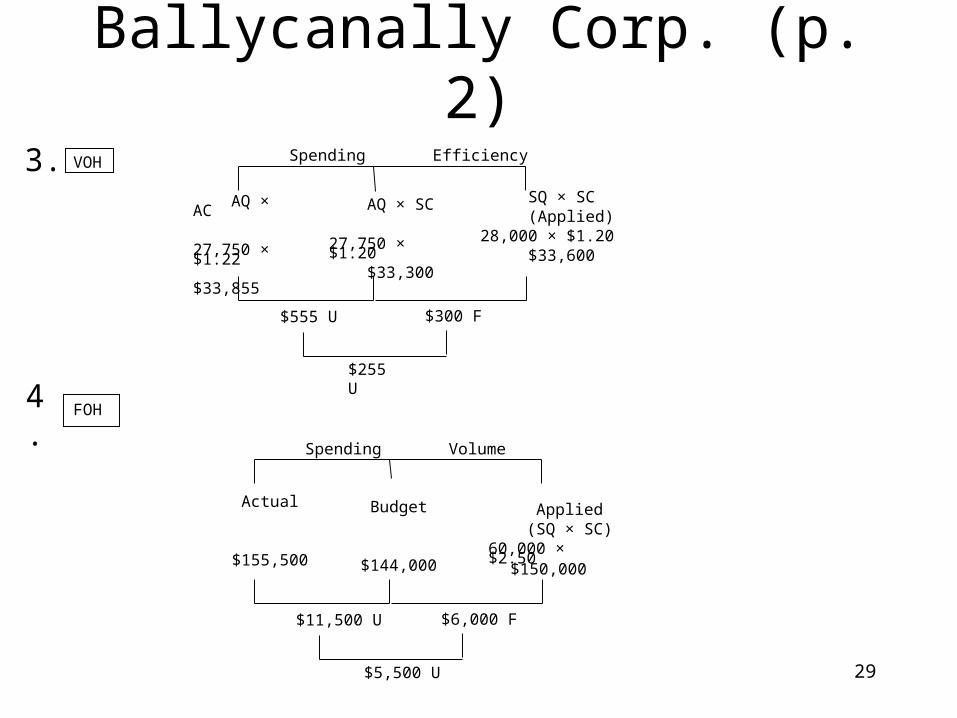
Ballycanally Corp.
29
AQ × AC
27,750 × $1.22 $33,855
AQ × SC
27,750 × $1.20 $33,300
$555 U
Spending Efficiency
$300 F
SQ × SC (Applied)28,000 × $1.20 $33,600
VOH3.
$255 U
4. FOH
Actual
$155,500
Budget
$144,000
$11,500 U
Spending Volume
$6,000 F
$5,500 U
Applied (SQ × SC)60,000 × $2.50
$150,000
Ballycanally Corp. (p. 2)

30
Barbershop Company
Rate
AQ * AP AQ * SP SQ * SP34,500 * ? 34,500 * ? 35,000 * ?
$241,500 $220,800
$3,200 / 500 hours = $6.40
Eff
$3,200 F
? = $6.40
$20,700 u
3131
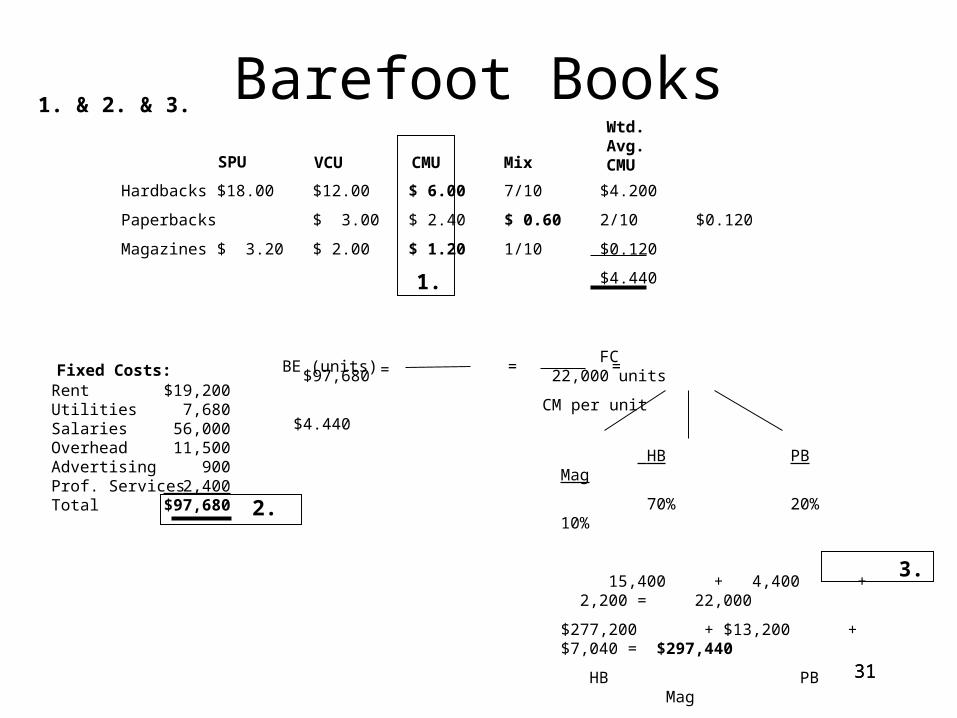
Barefoot Books
Hardbacks $18.00 $12.00 $ 6.00 7/10 $4.200
Paperbacks $ 3.00 $ 2.40 $ 0.60 2/10 $0.120
Magazines $ 3.20 $ 2.00 $ 1.20 1/10 $0.120
$4.440
SPU VCU CMU Mix
Wtd.Avg.CMU
FC $97,680 22,000 units
CM per unit $4.440
HB PB Mag
70% 20% 10%
15,400 + 4,400 + 2,200 = 22,000
$277,200 + $13,200 + $7,040 = $297,440
HB PB Mag
RentUtilitiesSalariesOverheadAdvertisingProf. ServicesTotal
$19,2007,680
56,00011,500
900 2,400
$97,680
Fixed Costs:
1. & 2. & 3.
===BE (units)
2.
1.
3.
3232
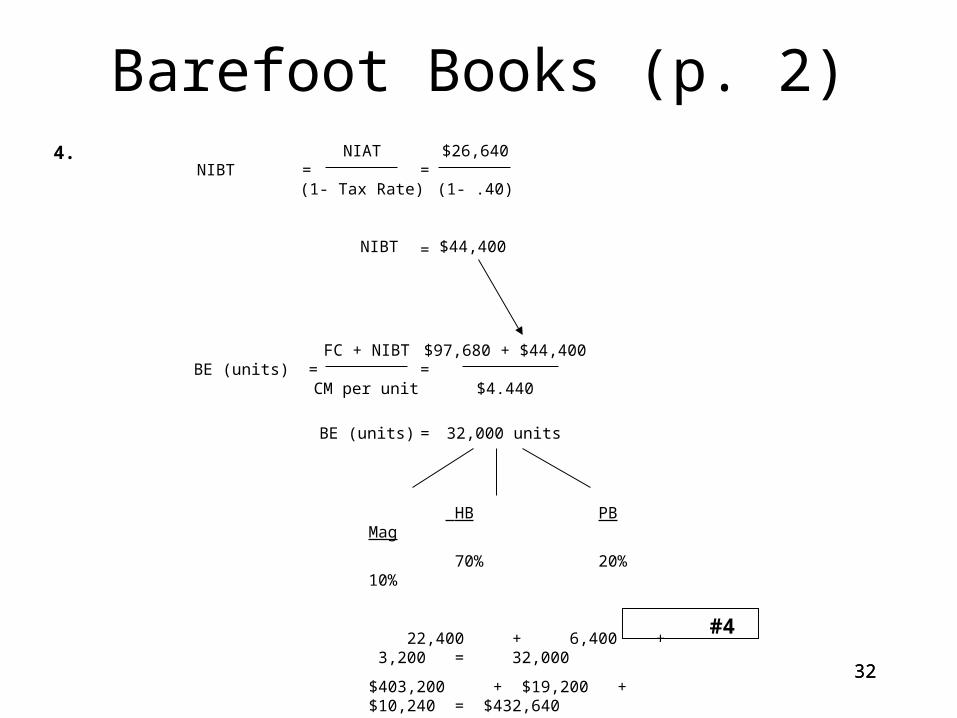
Barefoot Books (p. 2)
NIBT =NIAT
(1- Tax Rate)
4. $26,640
(1- .40)
NIBT $44,400
$97,680 + $44,400
$4.440BE (units) =
FC + NIBT
BE (units) 32,000 units=
CM per unit
HB PB Mag
70% 20% 10%
22,400 + 6,400 + 3,200 = 32,000
$403,200 + $19,200 + $10,240 = $432,640
HB PB Mag
#4
=
=
=
33
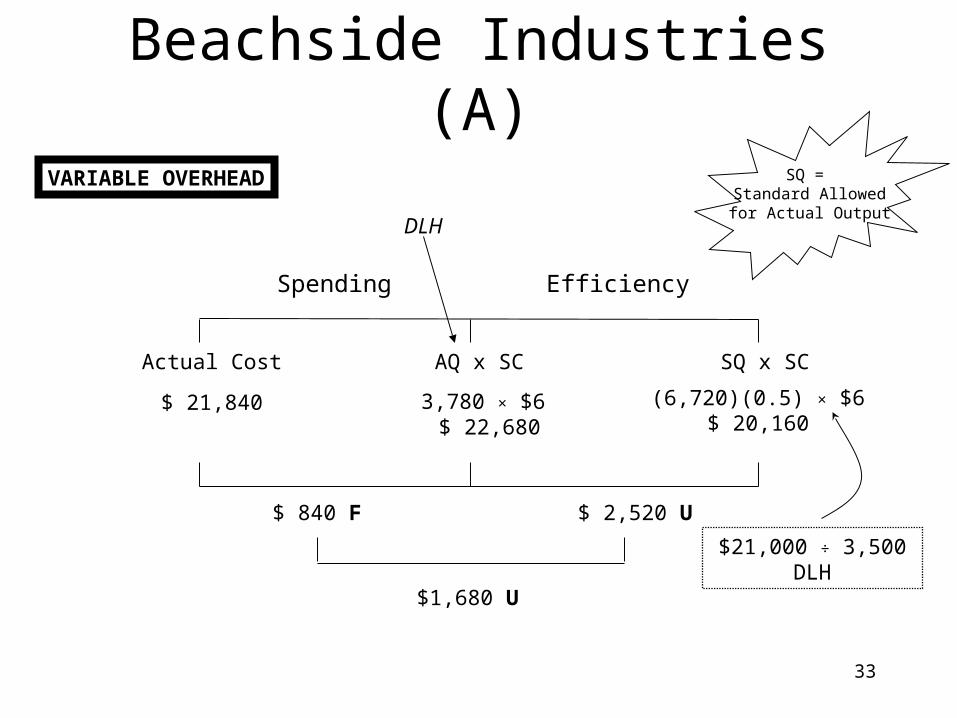
Beachside Industries (A)
Spending Efficiency
Actual Cost AQ x SC SQ x SC
$ 21,840 3,780 × $6 $ 22,680
(6,720)(0.5) × $6$ 20,160
$ 840 F $ 2,520 U
VARIABLE OVERHEAD SQ = Standard Allowedfor Actual Output
DLH
$1,680 U
$21,000 ÷ 3,500 DLH

34
Beachside Industries (B)
Actual Budgeted Applied
$ 128,800 $ 126,000 (6,720)(0.5) × $36 $ 120,960
$ 2,800 U $ 5,040 U
FIXED OVERHEAD
Spending Volume
BQ x SC SQ x SC
SQ = Standard Allowedfor Actual Output
$126,000 ÷ 3,500 DLH
$ 7,840 U
35
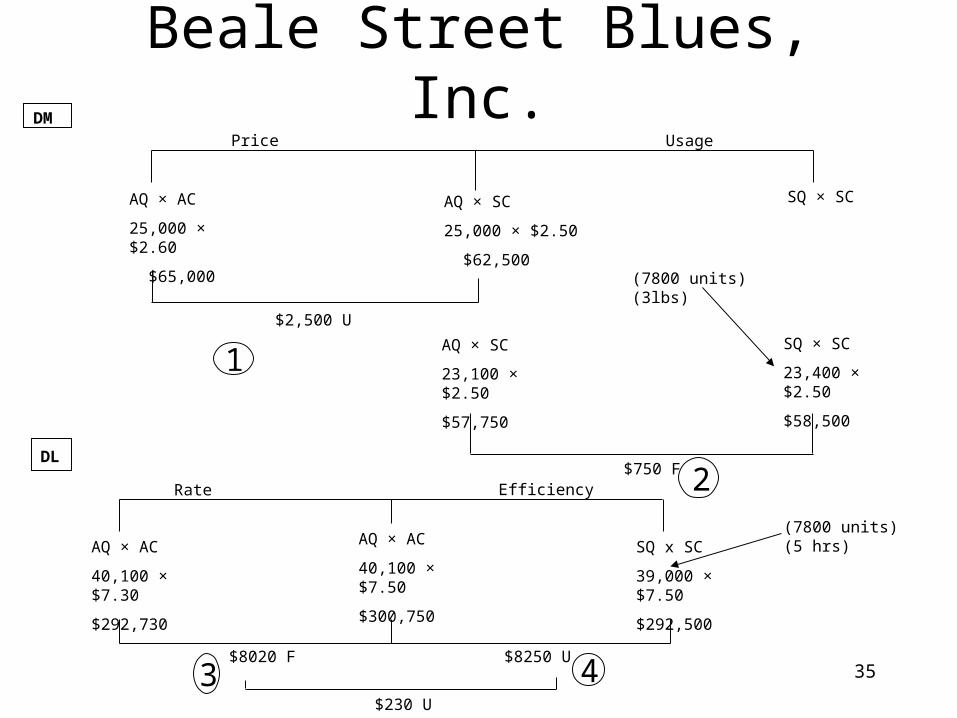
Price Usage
AQ × AC
25,000 × $2.60
$65,000
AQ × SC
25,000 × $2.50
$62,500
SQ × SC
$2,500 U
1AQ × SC
23,100 × $2.50
$57,750
SQ × SC
23,400 × $2.50
$58,500
(7800 units)(3lbs)
$750 F 2
DM
DL
Rate Efficiency
AQ × AC
40,100 × $7.30
$292,730
AQ × AC
40,100 × $7.50
$300,750
SQ x SC
39,000 × $7.50
$292,500
$8020 F $8250 U
$230 U
3 4
(7800 units)(5 hrs)
Beale Street Blues, Inc.

36
FOH
Spending Volume
Actual
AQ × AC
$170,000
Budgeted
BQ × SC
40,000 × $4.00
$160,000
$10,000 U $4,000 U
Applied
SQ x SC
(7800)(5)
39,000 × $4.00
$156,000
6
VOH
Spending Efficiency
Actual
AQ × AC
$130,000
AQ × SC
40,100 × $3.00
$120,300
$9,700 U $3,300U
5
SQ × SC
(7800)(5)
39,000 × $3.00
$117,000
Beale Street Blues (p.2)
7

37
Bee-Cee’s Guitar (A)
JAN
FEB
MAR
Dec.Jan.
Jan.Feb.
Feb.Mar.
$100,000×20%$ 60,000×80%
$ 60,000×20%$ 80,000×80%
$ 80,000×20%$ 90,000×80%
$20,000 48,000$68,000
$12,000 64,000$76,000
$16,000 72,000$88,000
JAN FEB MAR Total
$232,000
38
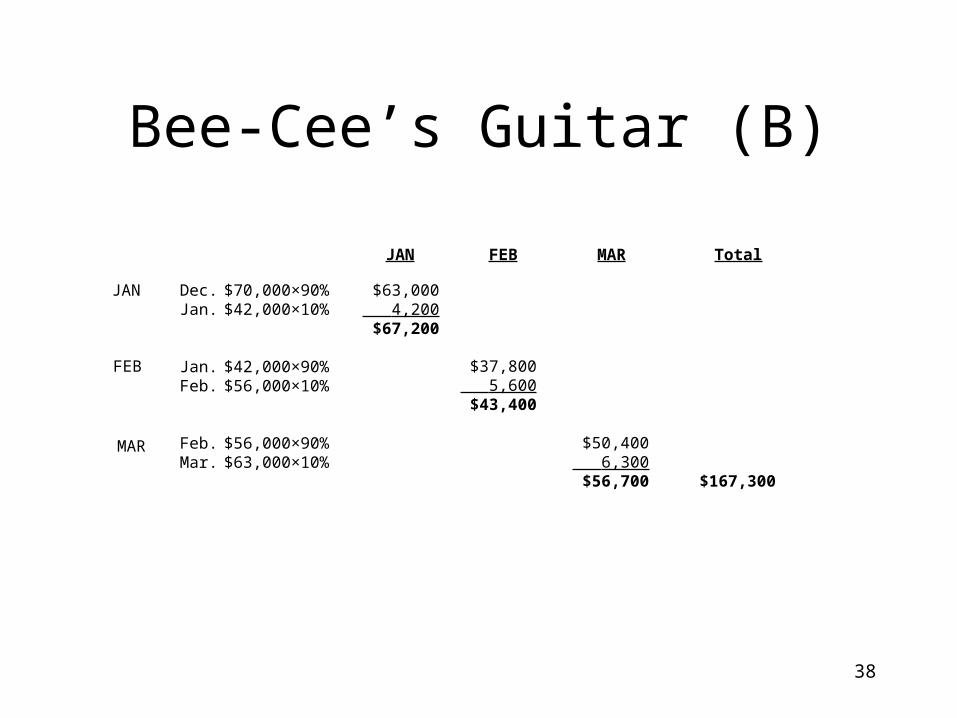
Bee-Cee’s Guitar (B)
JAN
FEB
MAR
Dec.Jan.
Jan.Feb.
Feb.Mar.
$70,000×90%$42,000×10%
$42,000×90%$56,000×10%
$56,000×90%$63,000×10%
$63,000 4,200$67,200
$37,800 5,600$43,400
$50,400 6,300$56,700
JAN FEB MAR Total
$167,300

39
Bee-Go Company
FG – Jan. FG – Mar.FG – Feb. FG – Apr.
16,500
15,650
1,650
1,600
16,250
1,850
1,650
16,450
1,600
15,600 18,50016,00016,500
15,65016,45016,250
48,350
Jan.Feb.Mar.
Total
(10%×16,500) (10%×18,500)(10%×16,000)
Units Produced
40
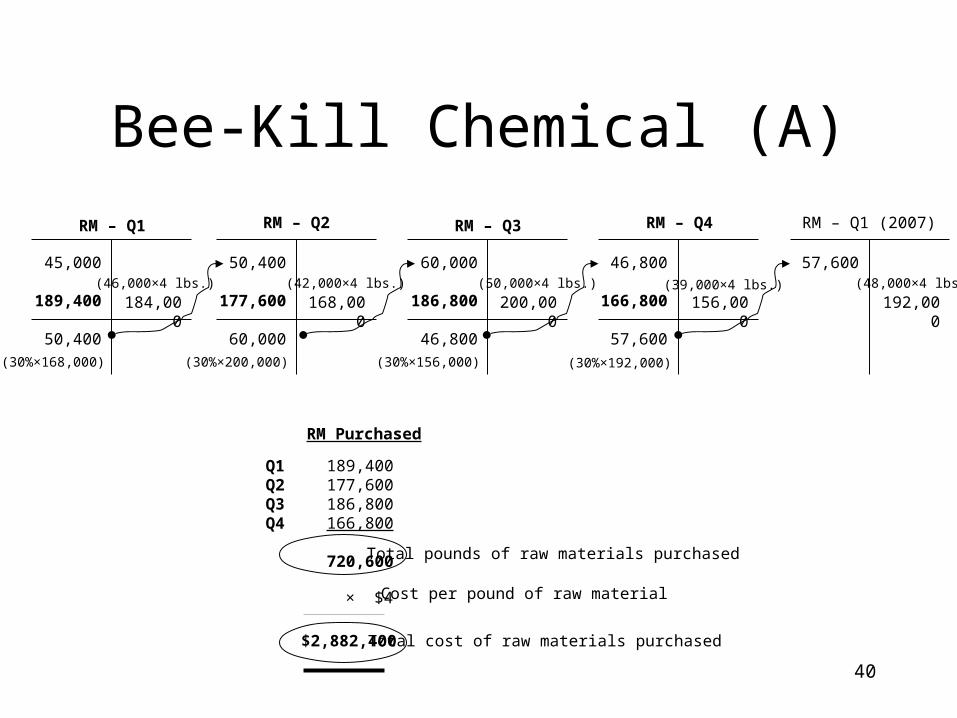
Bee-Kill Chemical (A)
RM – Q1 RM – Q3RM – Q2 RM – Q4
45,000
189,400
50,400
60,000
186,800
46,800
50,400
177,600
60,000
184,000
189,400177,600186,800166,800
720,600
Q1Q2Q3Q4
(30%×168,000) (30%×156,000)(30%×200,000)
RM – Q1 (2007)
46,800
166,800
57,600
168,000 200,000 156,000 192,000
(30%×192,000)
(46,000×4 lbs.) (48,000×4 lbs.)(39,000×4 lbs.)(50,000×4 lbs.)(42,000×4 lbs.)
57,600
× $4
$2,882,400
Total pounds of raw materials purchased
Total cost of raw materials purchased
RM Purchased
Cost per pound of raw material

41
Bee-Kill Chemical (B)
Quarter 1Quarter 2Quarter 3Quarter 4
46,00042,00050,00048,000
Units
115,000105,000125,000 97,500
442,500
DLH
× 2.5 DLH per unit =
DLH worked during 2006
× $20 DL cost per hour
$8,850,000 Cost of DLH worked during 2006
2006
Q1Q2Q3Q4
42
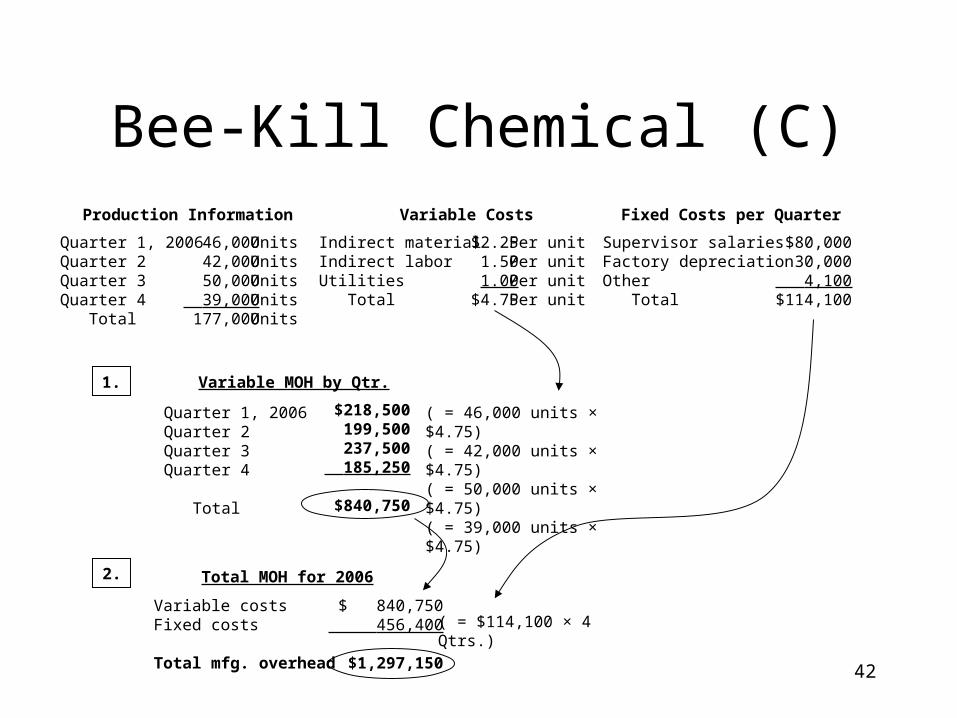
Bee-Kill Chemical (C)
Quarter 1, 2006Quarter 2Quarter 3Quarter 4 Total
46,00042,00050,000
39,000177,000
UnitsUnitsUnitsUnitsUnits
Production Information
Indirect materialIndirect laborUtilities Total
$2.251.501.00
$4.75
Per unitPer unitPer unitPer unit
Variable Costs
Supervisor salariesFactory depreciationOther Total
$80,00030,000
4,100$114,100
Fixed Costs per Quarter
1.
2.
$218,500199,500237,500
185,250
$840,750
Variable costsFixed costs
Total mfg. overhead
$ 840,750 456,400
$1,297,150
( = $114,100 × 4 Qtrs.)
Quarter 1, 2006Quarter 2Quarter 3Quarter 4
Total
Variable MOH by Qtr.
Total MOH for 2006
( = 46,000 units × $4.75)( = 42,000 units × $4.75)( = 50,000 units × $4.75)( = 39,000 units × $4.75)

43
Bee-Safe Company
First quarterSecond quarterThird quarterFourth quarter
21,00026,00025,00030,000
2004
27,30033,80032,500
39,000
132,600
2005
× 130% =
Unit sales during 2005
× $40 Selling price per unit
$5,304,000 Sales revenue during 2005
44
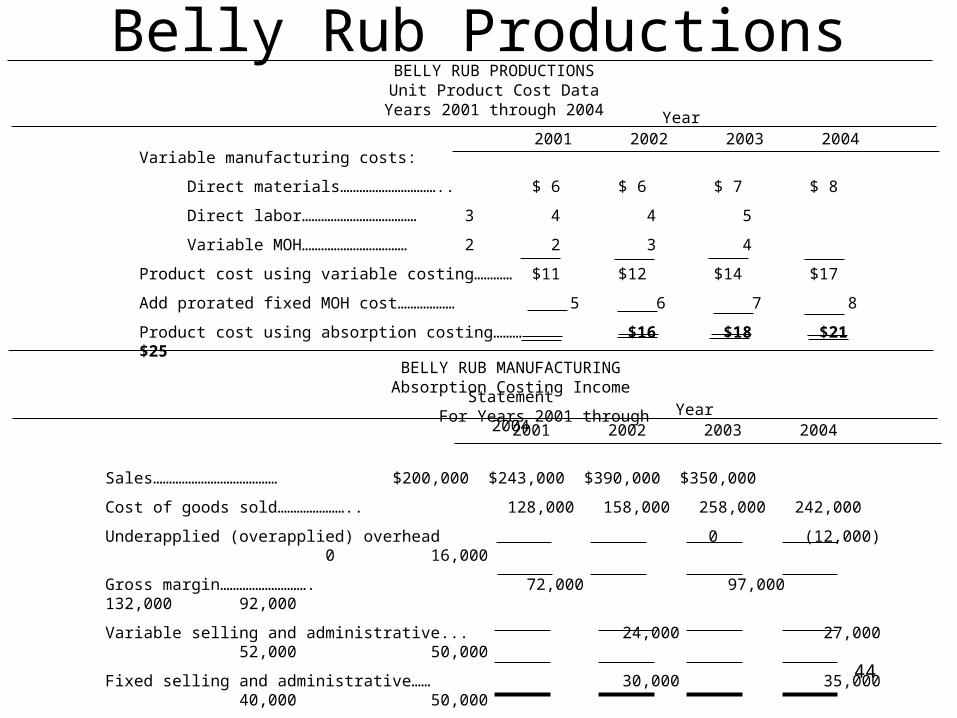
BELLY RUB PRODUCTIONSUnit Product Cost Data
Years 2001 through 2004 Year2001 2002 2003 2004
Variable manufacturing costs:
Direct materials………………………….. $ 6 $ 6 $ 7 $ 8
Direct labor……………………………… 3 4 4 5
Variable MOH…………………………… 2 2 3 4
Product cost using variable costing………… $11 $12 $14 $17
Add prorated fixed MOH cost……………… 5 6 7 8
Product cost using absorption costing……… $16 $18 $21 $25
BELLY RUB MANUFACTURINGAbsorption Costing Income Statement
For Years 2001 through 2004
Sales………………………………… $200,000 $243,000 $390,000 $350,000
Cost of goods sold………………….. 128,000 158,000 258,000 242,000
Underapplied (overapplied) overhead 0 (12,000) 0 16,000
Gross margin………………………. 72,000 97,000 132,000 92,000
Variable selling and administrative... 24,000 27,000 52,000 50,000
Fixed selling and administrative…… 30,000 35,000 40,000 50,000
Total operating expenses…………… 54,000 62,000 92,000 100,000
Net income………………………… $18,000 $35,000 $40,000 $ (8,000)
Year2001 2002 2003 2004
Belly Rub Productions

45
Belly Rub (p. 2)BELLY RUB MANUFACTURINGVariable Costing Income Statement
For Years 2001 through 2004
Sales ……………………………………….. $200,000 $243,000 $390,000 $350,000
Variable product cost ……………………. 88,000 106,000 172,000 164,000
Manufacturing contribution margin ……….. 112,000 137,000 218,000 186,000
Variable selling and administrative ……….. 24,000 27,000 52,000 50,000
Contribution margin ……………….………. 88,000 110,000 166,000 136,000
Fixed manufacturing overhead ……………. 50,000 60,000 70,000 80,000
Fixed selling and administrative…………… 30,000 35,000 40,000 50,000
Total fixed cost …………………………… 80,000 95,000 110,000 130,000
Net income ……………………………….. $ 8,000 $ 15,000 $ 56,000 $ 6,000
Year2001 2002 2003 2004
Belly Rub ProductionsSchedule of Product Costs with Absorption CostingYears 2001 through 2004
Year2001200220032004
Beginning Inventory - 0 -2,000 units @ $165,000 units @ $182,000 units @ $21
++++
Current Year Production8,000 units @ $167,000 units @ $188,000 units @ $218,000 units @ $25
Total Product Cost$128,000$158,000$258,000$242,000
Belly Rub ProductionsSchedule of Product Costs using Variable CostingYears 2001 through 2004
Year2001200220032004
Beginning Inventory - 0 -2,000 units @ $115,000 units @ $122,000 units @ $14
++++
Current Year Production8,000 units @ $117,000 units @ $128,000 units @ $148,000 units @ $17
Total Product Cost$ 88,000$106,000$172,000$164,000

46
Belly Rub (p. 3)
BELLY RUB PRODUCTIONSSchedule of Fixed Overhead Costs Included
In Beginning and Ending Inventory Under Absorption Costing
Year
2001 2002 2003 2004
Units in beginning inventory …Applied fixed MOH per unit … Equals ……………………….
Units in ending inventory ……Fixed MOH per unit …………. Equals ……………………….
Causes absorption costing NI to be …………………………
- 0 -
2,000$ 5$10,000
$10,000Higher
2,000$ 5$10,000
5,000$ 6$30,000
$20,000Higher
5,000$ 6$30,000
2,000$ 7$14,000
$16,000Lower
2,000$ 7$14,000
- 0 -
$14,000Lower
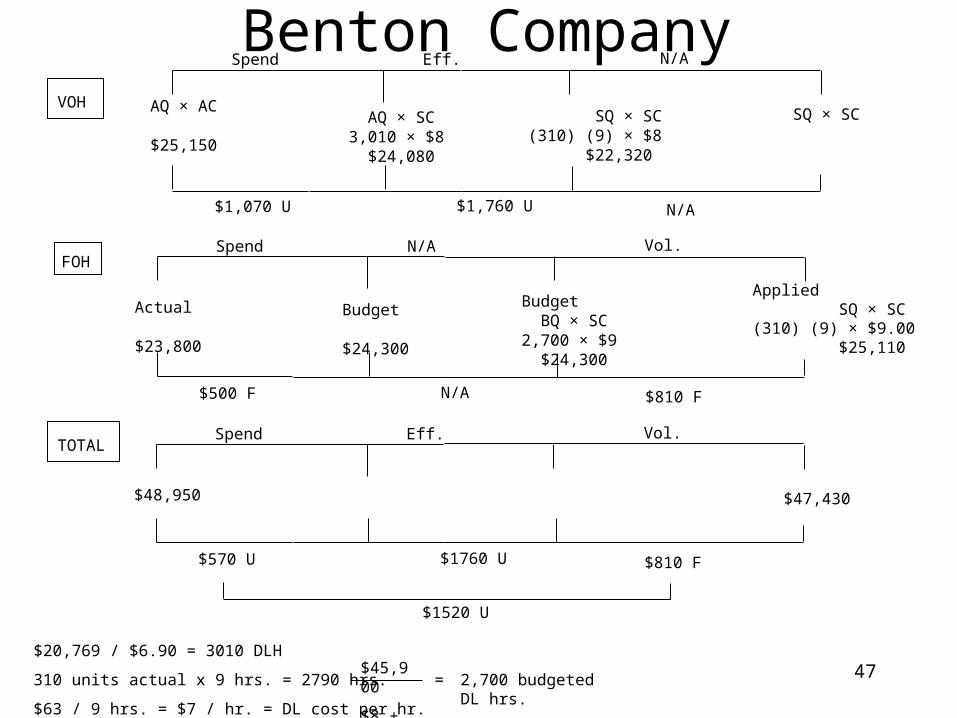
47
AQ × AC
$25,150
AQ × SC3,010 × $8 $24,080
$1,070 U
Spend Eff.
$1,760 U
N/A
N/A
SQ × SC(310) (9) × $8 $22,320
SQ × SCVOH
Actual
$23,800
Budget
$24,300
$500 F
Spend N/A
N/A
Vol.
$810 F
Budget BQ × SC2,700 × $9 $24,300
Applied SQ × SC(310) (9) × $9.00 $25,110
FOH
$48,950
$570 U
Spend Eff.
$1760 U
Vol.
$810 F
$1520 U
$20,769 / $6.90 = 3010 DLH
310 units actual x 9 hrs. = 2790 hrs.
$63 / 9 hrs. = $7 / hr. = DL cost per hr.
$45,900
$8 + $9= 2,700 budgeted DL hrs.
TOTAL
Benton Company
$47,430

4848
B.G. Wip CompanyStep 1
DM CC
100% 60% BI
100% 33% EI
WIP
2,000
9,000
3,300
7,700
Step 2Wtd. Avg. Equivalent Units
OUT
EI 3300 × 100%
3300 × 33%
E.U.
DM CC
7,700 7,700
3,300
1,100
11,000 8,800
Weighted Average MethodStep 2
BI 2,000 × 0%
2,000 × 40%
S&F
EI 3,300 × 100%
3,300 × 33%
E.U.
DM CC
- 0 -
800
5,700 5,700
3,300
1,100
9,000 7,600
FIFO Method
FIFO Equivalent Units
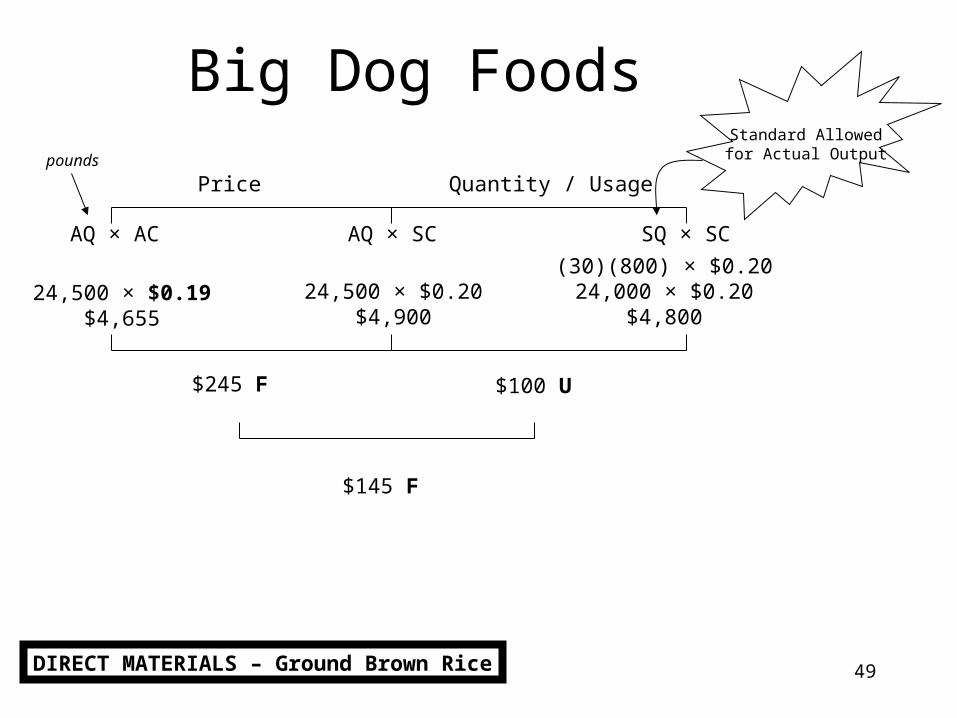
49
Big Dog FoodsStandard Allowedfor Actual Output
Price Quantity / Usage
AQ × AC AQ × SC SQ × SC
pounds
24,500 × $0.19$4,655
(30)(800) × $0.2024,000 × $0.20
$4,80024,500 × $0.20
$4,900
$245 F $100 U
$145 F
DIRECT MATERIALS – Ground Brown Rice

50
Big Dog Foods (p. 2)Standard Allowedfor Actual Output
Price Quantity / Usage
AQ × AC AQ × SC SQ × SC
pounds
5,900 × $0.41$2,419
(30)(200) × $0.406,000 × $0.40
$2,4005,900 × $0.40
$2,360
$59 U $40 F
$19 U
DIRECT MATERIALS – Chicken Meal

51
Big Dog Foods (p. 3)Standard Allowedfor Actual Output
Rate Efficiency
AQ × AC AQ × SC SQ × SC
DLH
300 × $16.00$4,800
(30)(8) × $15.00240 × $15.00
$3,600300 × $15.00
$4,500
$300 U $900 U
$1,200 U
DIRECT LABOR
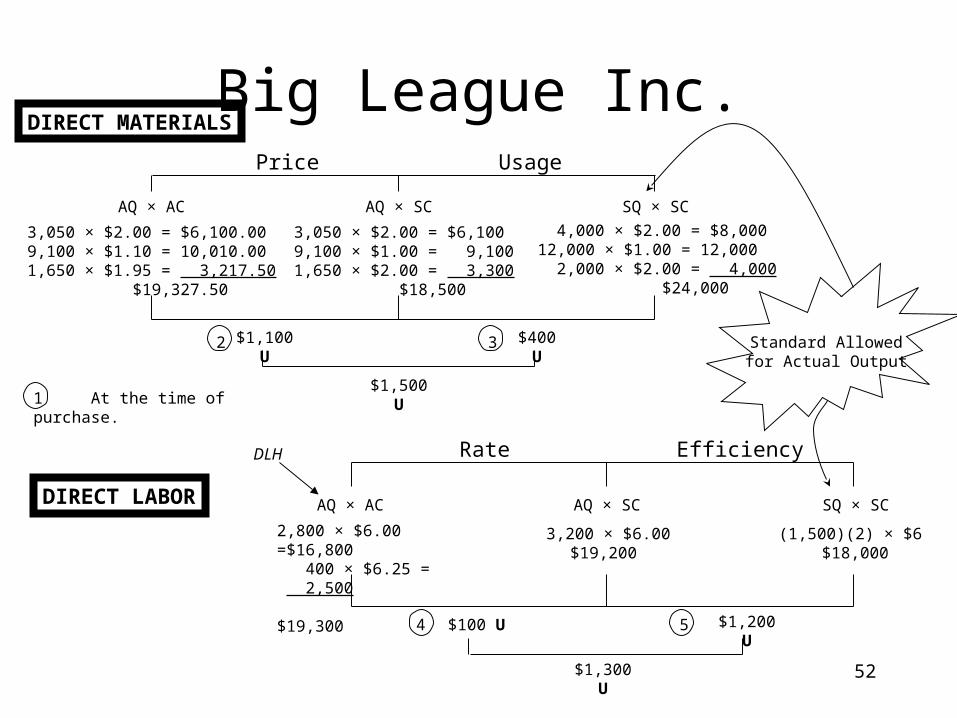
52
Big League Inc.
DIRECT LABOR
Price Usage
AQ × AC AQ × SC SQ × SC
DLH
3,050 × $2.00 = $6,100.009,100 × $1.10 = 10,010.001,650 × $1.95 = 3,217.50
$19,327.50
3,050 × $2.00 = $6,1009,100 × $1.00 = 9,1001,650 × $2.00 = 3,300
$18,500
2,800 × $6.00 =$16,800 400 × $6.25 = 2,500
$19,300
3,200 × $6.00$19,200
(1,500)(2) × $6 $18,000
Standard Allowedfor Actual Output
$1,100 U $400 U
$1,500 U
DIRECT MATERIALS
Rate Efficiency
AQ × AC AQ × SC SQ × SC
4,000 × $2.00 = $8,00012,000 × $1.00 = 12,000 2,000 × $2.00 = 4,000
$24,000
$1,200 U$100 U
$1,300 U
1 At the time of purchase.
2 3
4 5
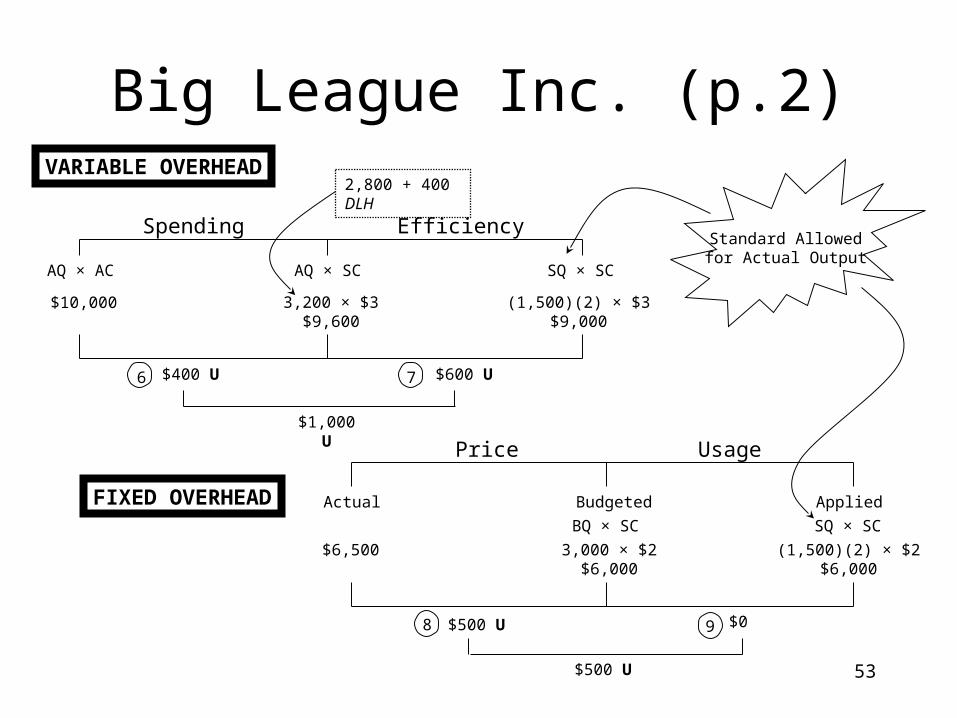
53
Big League Inc. (p.2)VARIABLE OVERHEAD
Spending Efficiency
AQ × AC AQ × SC SQ × SC
$6,500
Standard Allowedfor Actual Output
$400 U $600 U
$1,000 U
FIXED OVERHEAD
Price Usage
Actual Budgeted Applied
$0$500 U
$500 U
$10,000 3,200 × $3$9,600
(1,500)(2) × $3$9,000
(1,500)(2) × $2$6,000
3,000 × $2$6,000
BQ × SC SQ × SC
2,800 + 400 DLH
6 7
8 9
54
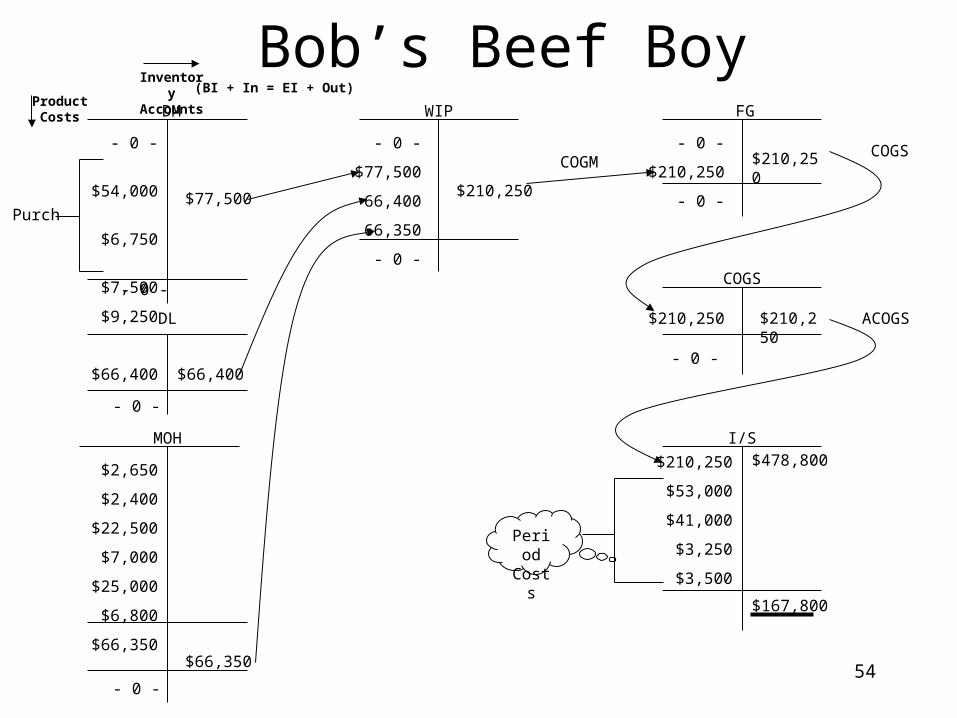
Bob’s Beef Boy
- 0 -
$54,000
$6,750
$7,500
$9,250
$77,500
DM
$66,400 $66,400
DL
$2,650
$2,400
$22,500
$7,000
$25,000
$6,800
$66,350$66,350
MOH
- 0 -
$77,500
66,400
66,350
- 0 -
$210,250
WIP
- 0 -
$210,250
- 0 -
$210,250
FG
$210,250 $210,250
COGS
COGM
$210,250
$53,000
$41,000
$3,250
$3,500
$478,800
$167,800
I/S
- 0 -
- 0 -
- 0 -
Purch
- 0 -
COGS
ACOGS
PeriodCosts
Inventory Accounts
Product Costs
(BI + In = EI + Out)

55
Billy’s Boat BonanzaDirectLabor
DirectMaterials
ManufacturingOverhead
Marketing& Selling
Admin.Cost
1. The wages of employees who build the sailboats.
X
2. The cost of advertising in the local newspapers.
X
3. The cost of an aluminum mast installed in a sailboat.
X
4. The wages of the assembly shop’s supervisor.
X
5. Rent on the boathouse. (Prorated on the basis of space occupied.)
X X X
6. The wages of the company’s bookkeeper.
X
7. Sales commissions paid to the company’s salespeople.
X
8. Depreciation on power tools.X
5656
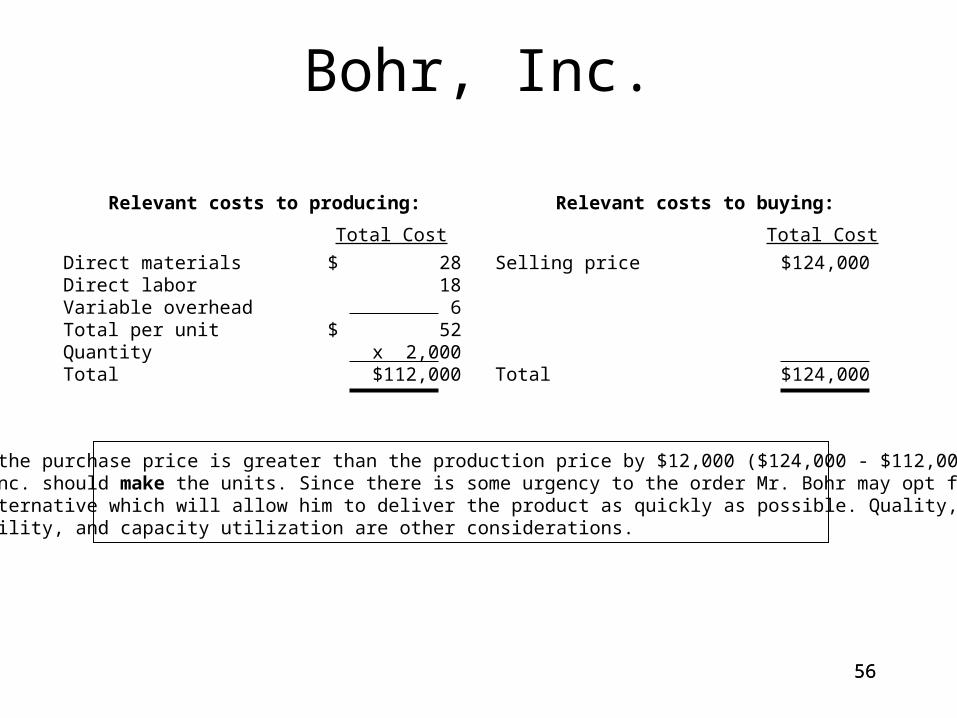
Bohr, Inc.
Relevant costs to producing:
Direct materialsDirect laborVariable overheadTotal per unitQuantityTotal
$ 2818
6$ 52x 2,000
$112,000
Total Cost
Since the purchase price is greater than the production price by $12,000 ($124,000 - $112,000),Bohr Inc. should make the units. Since there is some urgency to the order Mr. Bohr may opt forthe alternative which will allow him to deliver the product as quickly as possible. Quality,reliability, and capacity utilization are other considerations.
Relevant costs to buying:
Selling price
Total
$124,000
$124,000
Total Cost

57
Absorption Costing
Income Statement
For the Year Ended Dec. 31, 2002
Rev. $630,000
COGS: Prime (252,000)
VOH (84,000)
FOH (100,000)
GM $194,000
S&A: VSE (54,000)
FSE (45,000)
FAE (90,000)
OI $5,000
Variable Costing
Income Statement
For the Year Ended Dec. 31, 2002
Rev. $630,000
VC: Prime (252,000)
VOH (84,000)
VSE (54,000)
CM $240,000
FC: FOH (100,000)
FSE (45,000)
FAE (90,000)
OI $5,000
Bojangle Dance Shoes
58
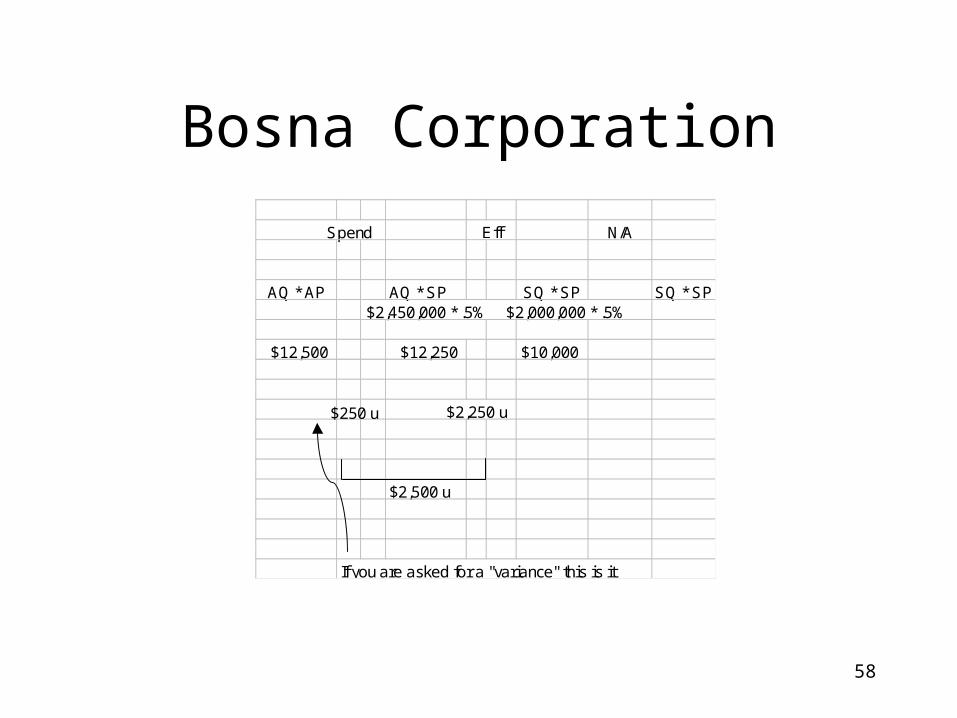
Bosna Corporation
Spend N/A
AQ * AP AQ * SP SQ * SP SQ * SP$2,450,000 * .5% $2,000,000 * .5%
$12,500 $12,250 $10,000
$2,250 u
$2,500 u
If you are asked for a "variance" this is it
Eff
$250 u
59
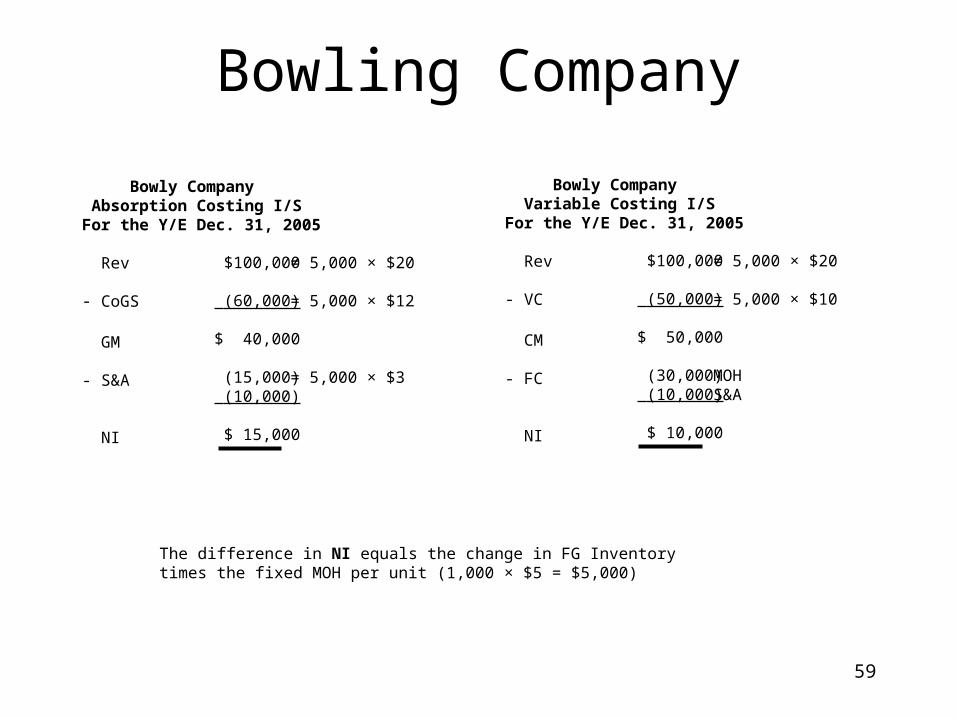
Bowling Company
Bowly Company Absorption Costing I/SFor the Y/E Dec. 31, 2005
Rev
- CoGS
GM
- S&A
NI
$100,000
(60,000)
$ 40,000
(15,000) (10,000)
$ 15,000
= 5,000 × $20
= 5,000 × $12
= 5,000 × $3
Bowly Company Variable Costing I/SFor the Y/E Dec. 31, 2005
Rev
- VC
CM
- FC
NI
$100,000
(50,000)
$ 50,000
(30,000) (10,000)
$ 10,000
= 5,000 × $20
= 5,000 × $10
MOHS&A
The difference in NI equals the change in FG Inventorytimes the fixed MOH per unit (1,000 × $5 = $5,000)

60
Brötchen Bakery Standard Allowedfor Actual Output
Price Usage
AQ × AC AQ × SC SQ × SC
Pounds
30,000 × $2.20$66,000
(1,450)(20) × $2.00$58,000
30,000 × $2.00$60,000
$6,000 U $2,000 U
$8,000 U
DIRECT MATERIALS
Rate Efficiency
AQ × AC AQ × SC SQ × SC
DLH
8,000 × $18.90$151,200
(1,450)(5) × $18.00$130,500
8,000 × $18.00$144,000
$7,200 U $13,500 U
$20,700 U
DIRECT LABOR
Qty purch=
Qty used

61
Brötchen Bakery (p. 2)Spending Efficiency
AQ × AC AQ × SC SQ × SC
DLH
8,000 × $1.375$11,000
(1,450)(5) × $1.50$10,875
8,000 × $1.50$12,000
$1,000 F $1,125 U
$125 U
VARIABLE OVERHEAD
Spending Volume
Actual BudgetedBQ × SC
AppliedSQ × SC
DLH
8,000 × $3.25$26,000
(1,450)(5) × $3.00$21,750
8,333.33 × $3.00$25,000
$1,000 U $3,250 U
$4,250 U
FIXED OVERHEAD
$150,000 ÷ 100,000 DLH
$300,000 ÷ 100,000 DLH
Standard Allowedfor Actual Output
SQ =
100,000 DLH ÷ 12 months
62
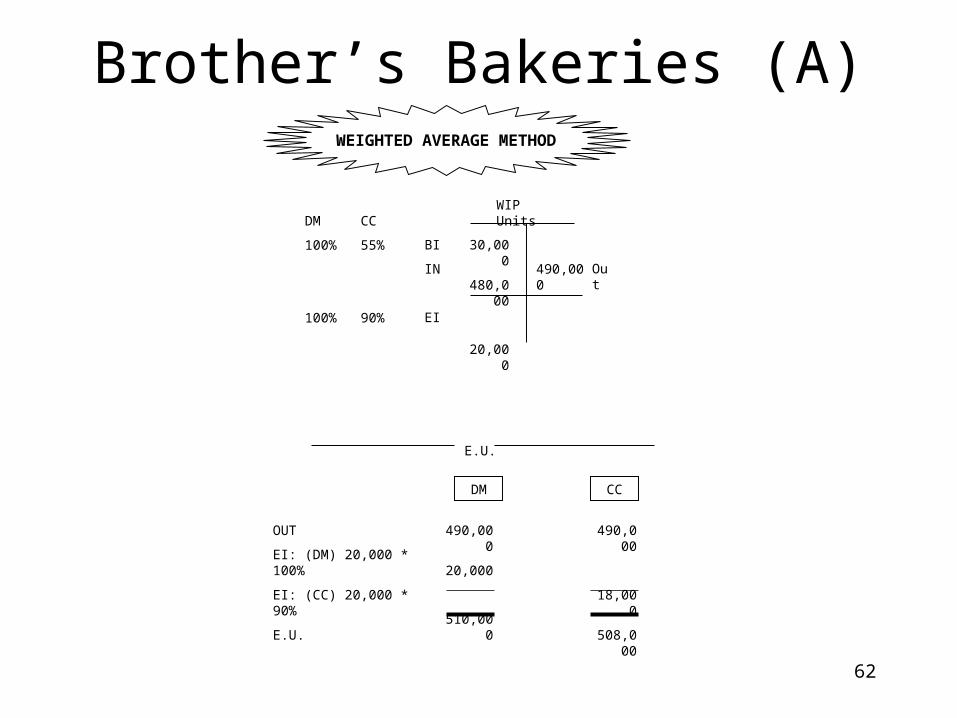
Brother’s Bakeries (A)
WIP Units
30,000
480,000
20,000
490,000 Out
BI
IN
EI
DM
100%
100%
CC
55%
90%
E.U.
DM CC
490,000
20,000
510,000
490,000
18,000
508,000
OUT
EI: (DM) 20,000 * 100%
EI: (CC) 20,000 * 90%
E.U.
WEIGHTED AVERAGE METHOD

63
Brother’s Bakeries (B)
E.U.
DM CC
0
460,000
20,000
480,000
13,500
460,000
18,000
491,500
BI: (DM) 30,000 × 0%
BI: (CC) 30,000 × 45%
Start & Finish*
EI: (DM) 20,000 × 100%
EI: (CC) 20,000 × 90%
E.U.
FIFO METHOD
WIP Units
30,000
480,000
20,000
490,000 Out
BI
IN
EI
DM
100%
100%
CC
55%
90%
* 480,000 loaves started – 20,000 loaves in ending WIP = 460,000 loaves started and completed this month
6464
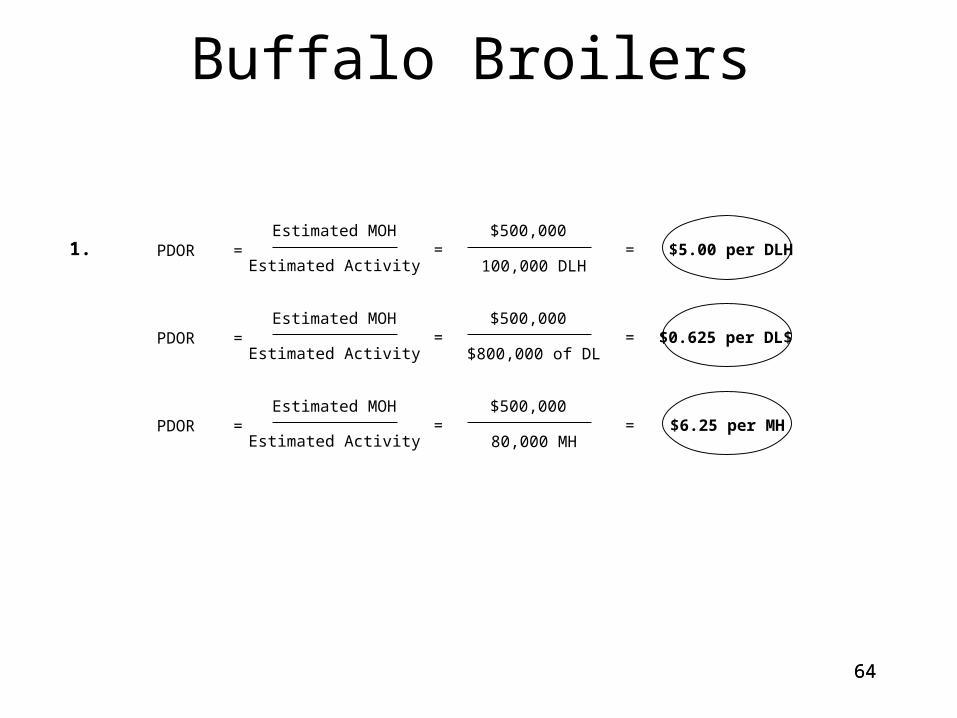
Buffalo Broilers
PDOR = Estimated MOH
Estimated Activity=
$500,000
100,000 DLH$5.00 per DLH=1.
PDOR = Estimated MOH
Estimated Activity=
$500,000
$800,000 of DL$0.625 per DL$=
PDOR = Estimated MOH
Estimated Activity=
$500,000
80,000 MH$6.25 per MH=

6565
Buffalo Broilers (p. 2)
Actual Applied
$5.00 * 120,000
$576,000 = $600,000
$24,000 overapplied
Actual Applied
.625 * $930,000
$576,000 = $581,250
$5,250 overapplied
Actual Applied
$6.25 * 90,000
$576,000 = $562,500
$13,500
2.
3.
MOH (MH)
MOH (DLH) MOH (DL$)
underapplied
Actual OHper DL
Actual MOH
Actual Activity=
$576,000
120,000 DLH= $4.80 per DLH=

6666
California Textbooks (A)Relevant costs to make
$ 1842
$15
Relevant costs to buy
Selling price $16
Total relevant cots $16
Direct materialDirect laborVariable OHAvoidable FOHTotal relevant costs
It is $10,000 cheaper to make the covers.Therefore, California should make the covers.
Relevant costs to make
$ 10,00080,00040,00020,000
$150,000
Relevant costs to buy
Selling price $160,000
Total relevant cots $160,000
Direct materialDirect laborVariable OHAvoidable FOHTotal relevant costs
- OR -
It is $1 per unit cheaper to make the covers.Therefore, California should make the covers.
6767
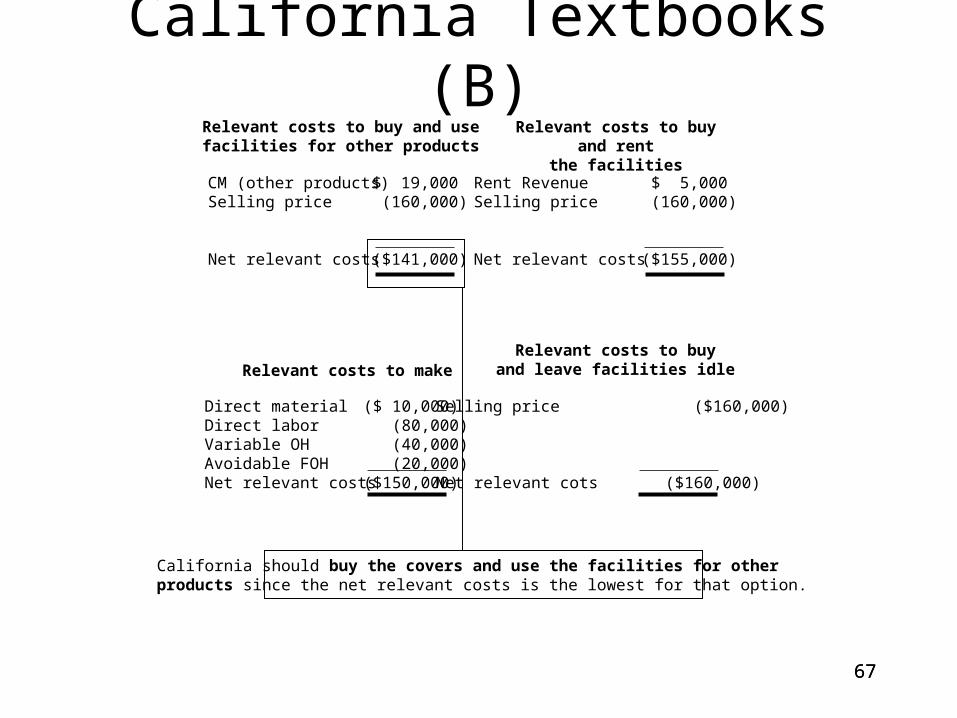
California Textbooks (B)Relevant costs to buy and usefacilities for other products
$ 19,000 (160,000)
($141,000)
CM (other products)Selling price
Net relevant costs
California should buy the covers and use the facilities for otherproducts since the net relevant costs is the lowest for that option.
Relevant costs to make
($ 10,000) (80,000) (40,000) (20,000)($150,000)
Relevant costs to buyand leave facilities idle
Selling price ($160,000)
Net relevant cots ($160,000)
Direct materialDirect laborVariable OHAvoidable FOHNet relevant costs
Relevant costs to buy and rentthe facilities
$ 5,000 (160,000)
($155,000)
Rent RevenueSelling price
Net relevant costs

68
Candlelight Candles
I have chosen to round to
2 decimal places
WIP Units
25,000
510,000
12,000
523,000Out
BI
IN
EI
DM
100%
100%
CC
40%
80%
WIP - $ (Wtd. Avg.)
DM $42,650
CC $17,152
DM $433,500
CC $339,690
DM $10,680
CC $ 6,432
$17,112
523,000 * $1.56
= $815,880
= 12000 * 100% * $0.89
= 12000 * 80% * $0.67
OutBI
IN
EI
E.U.
DM CC
523,000
12,000
535,000
523,000
9,600
532,600
OUT
EI: (DM) 12000 * 100%
EI: (CC) 12000 * 80%
E.U.
Costs to Account For
DM CC
$42,650
$433,500
$476,150
$17,152
$339,690
$356,842
BI
IN
Total
$/EU
DMCC
$476,150 / 535,000 = $0.89
$356,842 / 532,600 = $0.67
$1.56
WEIGHTED AVERAGE METHOD
69
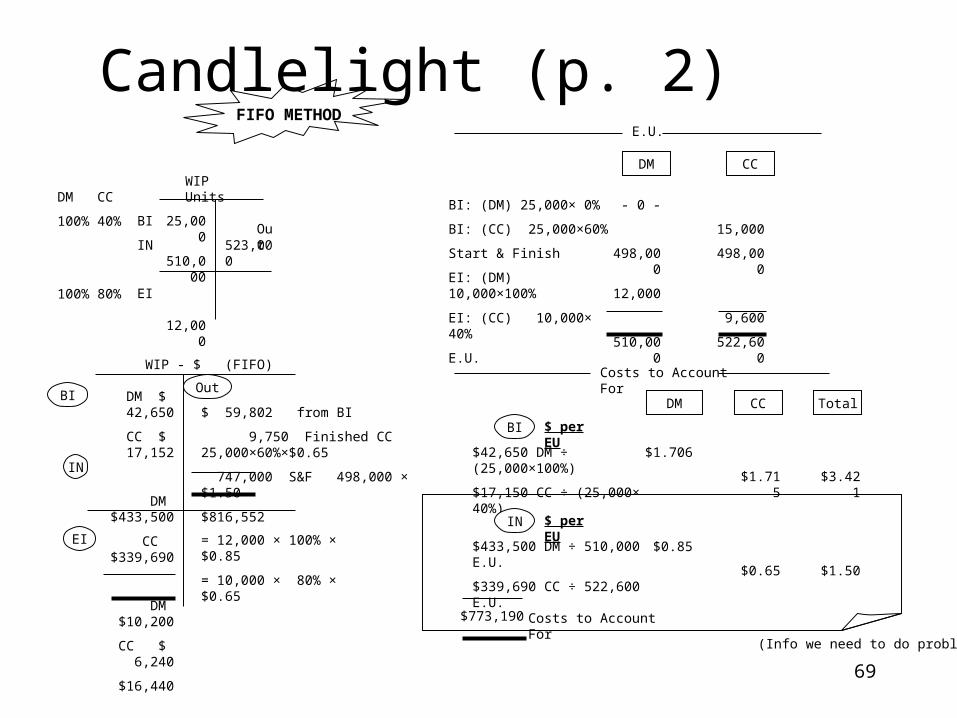
Candlelight (p. 2)
WIP - $ (FIFO)
DM $ 42,650
CC $ 17,152
DM $433,500
CC $339,690
DM $10,200
CC $ 6,240
$16,440
$ 59,802 from BI
9,750 Finished CC 25,000×60%×$0.65
747,000 S&F 498,000 × $1.50
$816,552
= 12,000 × 100% × $0.85
= 10,000 × 80% × $0.65
OutBI
IN
EI
E.U.
DM CC
- 0 -
498,000
12,000
510,000
15,000
498,000
9,600
522,600
Costs to Account For
DM CC
$1.706
$1.715
$ per EU
BI: (DM) 25,000× 0%
BI: (CC) 25,000×60%
Start & Finish
EI: (DM) 10,000×100%
EI: (CC) 10,000× 40%
E.U.
FIFO METHOD
BI
$42,650 DM ÷ (25,000×100%)
$17,150 CC ÷ (25,000× 40%)
Total
$3.421
$0.85
$0.65
$ per EUIN
$433,500 DM ÷ 510,000 E.U.
$339,690 CC ÷ 522,600 E.U. $1.50
(Info we need to do problem)
$773,190 Costs to Account For
WIP Units
25,000
510,000
12,000
523,000Out
BI
IN
EI
DM
100%
100%
CC
40%
80%

70
$ 30,000
$205,000
$20,000
$215,000
DM
BI
Purch
EI
$ 80,000
215,000
350,000
289,000
$ 50,000
$884,000
BI
EI
WIP
$ 110,000
884,000
$ 120,000
$ 874,000
BI
EI
FG
$ 350,000 $ 350,000
- 0 -
DL
MOH
$ 15,000
35,000
14,000
6,000
90,000
40,000
65,000
24,000
$ 289,000
$ 289,000
- 0 -
IDM
Fact Mgr Sal
Fact Ins
Ptty Tax
IDL
Mach Rent
Fact Util
Fact Bldg Depr
COGS
I/S
$ 874,000
150,000
300,000
100,000
17,500
3,000
$ 1,700,000COGS
Sales Comm
Admin Exp
Delivery Exp
Interest Exp
Loss on Sale of Equip
Sales
NI BT
$ 874,000
- 0 -
$ 874,000
COGS
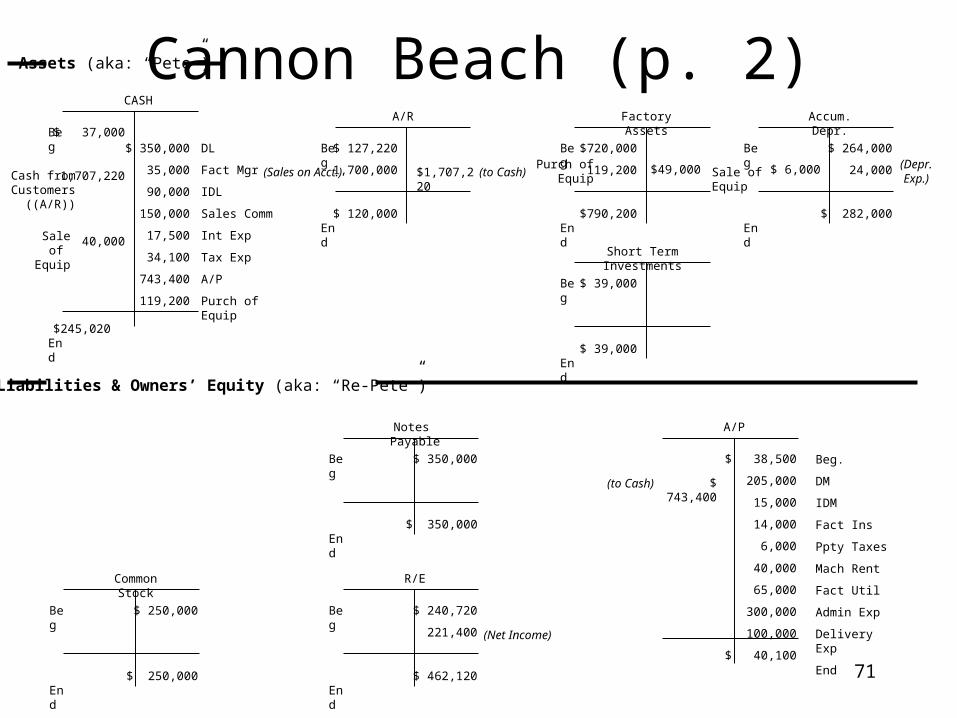
Cannon Beach Co.
$ 255,500$ 34,100Inc. Tax
NI AT$ 221,400$ 221,400
- 0 -
(to R/E)
71
Cannon Beach (p. 2)$ 37,000
1,707,220
40,000
$245,020
$ 350,000
35,000
90,000
150,000
17,500
34,100
743,400
119,200
Beg
End
CASH
Assets (aka: “Pete”)
$ 127,220
1,700,000
$ 120,000
$1,707,220
Beg
End
A/R
$720,000
119,200
$790,200
Beg
End
Factory Assets
$ 264,000
24,000
$ 282,000
Beg
End
Accum. Depr.
Cash fromCustomers
((A/R))
DL
Fact Mgr
IDL
Sales Comm
Int Exp
Tax Exp
A/P
Purch of Equip
Liabilities & Owners’ Equity (aka: “Re-Pete”)
$ 350,000
$ 350,000
Beg
End
Notes Payable
$ 38,500
205,000
15,000
14,000
6,000
40,000
65,000
300,000
100,000
$ 40,100
A/P
$ 250,000
$ 250,000
Beg
End
Common Stock
$ 240,720
221,400
$ 462,120
Beg
End
R/E
$ 743,400
(to Cash)(Sales on Acct.)(Depr.Exp.)
(Net Income)
$ 39,000
$ 39,000
Beg
End
Short Term Investments
Beg.
DM
IDM
Fact Ins
Ppty Taxes
Mach Rent
Fact Util
Admin Exp
Delivery Exp
End
(to Cash)
$ 6,000Sale of EquipPurch of
Equip$49,000
Sale of Equip

72
Cannon Beach (p. 3)Cannon Beach Sand Company
Balance SheetAs of December 31, 2005
Assets CashA/RS/T InvestmtsPlant AssetsAccum DeprDMWIPFG
Total
$ 245,020 120,000 39,000
790,200 (282,000)
20,000 50,000
120,000
$1,102,220
Liabilities& Owners’Equity
N/PA/PC/SR/E
Total
$ 350,000 40,100
250,000 462,120
$1,102,220

73
Cannon Beach (p. 4)Cannon Beach Sand Company
Statement of Cash Flows (Indirect Method)For the Year-Ended December 31, 2005
Net Income
Depr. Exp↓ A/R (source)↑ A/P (source)↓ DM (source)↓ WIP (source)↑ FG (use)Loss on Equip Sale
Net Cash provided byOperating Activities
Sale of EquipmentPurch of Equipment
Net Cash used byInvesting Activities
Net increase in cash
Beg. Cash
End Cash
$ 221,400
+ 24,000 + 7,220 + 1,600 + 10,000 + 30,000 - 10,000 + 3,000
$ 287,220
$ 40,000 - 119,200
$ (79,200)
$ 208,020
37,000
$ 245,020
Not specifically requested by problem;already calculated CF using Direct Method.
Calculation of Free Cash Flows
Cash from OperationsLess: Capital Expenditures (net)
Free Cash Flows
$287,220 (79,200)
$208,020
Operating Activities
Investing Activities

74
Cardinal ManufacturingIf Jocketty Division sells all components on the outside market, Cardinal Manufacturing’s contribution
margin per unit will be the same as Jocketty’s, which follows:
Sales revenues $80Variable costs 50Contribution margin per unit $30
If Jocketty Division sells to the LaRussa Division, Cardinal Manufacturing’s contribution margin per unit will be as follows:
Estimated revenue from special orderVariable costs Manufacturing, LaRussa Division Shipping, LaRussa Division Component, Jocketty DivisionContribution margin per unit
Cardinal Manufacturing’s overall contribution margin per unit will be $10 greater if Jocketty sells to LaRussa. Notice that fixed costs were excluded from the calculation, as they will not change with the special order and are therefore irrelevant to the decision.
No, management should not force the transfer price down to $60 per unit. It should follow the present transfer price policy and transfer at market price. Corporate management should also ensure that LaRussa Division does not refuse the special order. Even at a transfer price of $80, the order will generate a contribution margin of $10 per unit of LaRussa. Although the LaRussa Division would prefer a higher contribution margin, its managers should realize that a $10 contribution margin per unit is better than a zero contribution margin. And that is the amount that would be generated by the idle facilities.
$130
3010
50$40
2.
1.
75
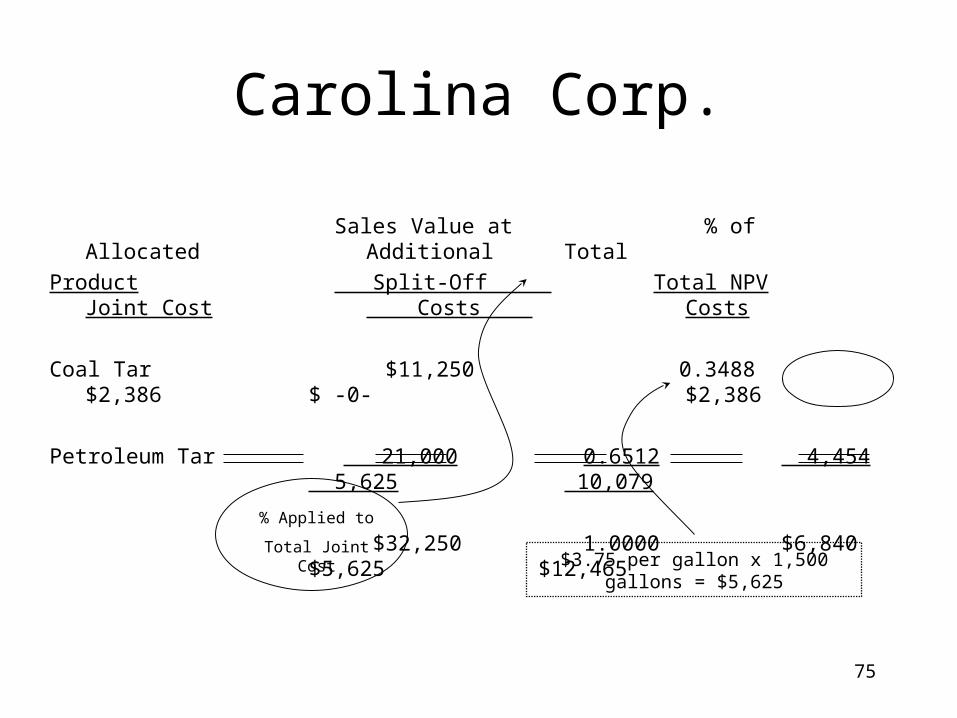
Carolina Corp.
$3.75 per gallon x 1,500 gallons = $5,625
% Applied to
Total Joint Cost
Sales Value at % of Allocated AdditionalTotal
Product Split-Off Total NPV Joint Cost Costs Costs
Coal Tar $11,250 0.3488 $2,386 $ -0- $2,386
Petroleum Tar 21,000 0.6512 4,454 5,625 10,079
$32,250 1.0000 $6,840 $5,625 $12,465

76
Carwash Company (A)
Present0
Year1
Year2
Year3
Investment
Savings
Total
PV Factor
NPV Calc.
$(100,000)$ 40,000
$(60,000)
× 1.0000
$(60,000)
$15,000
$15,000
× 3.7908
$56,862
Year4
Year5
= $(3,138) < $0 +
From PV of Annuity Table

77
Carwash Company (B)The higher the interest rate, the lower the Present Value
Correct Answer: 12% YES, the investment should be made.
Present0
Year1
Year2
Year3
Investment
Savings
Total
PV Factor
NPV Calc.
$(15,403)
$(15,403)
× 1.0000
$(15,403)
$4,000
$4,000
× 0.8929
$3,571.60
Year4
$4,000
$4,000
× 0.7972
$3,188.80
$5,000
$5,000
× 0.7118
$3,559.00
$8,000
$8,000
× 0.6355
$5084.00 ≈ $0 difference
$15,403.40

78
DM $210,000
DL 140,000
VOH 30,000
$380,000
Cass Company
Absorption Costing
Income Statement
For the Year Ended Dec. 31, 1996
Rev. $500,000
COGS: Direct materials (210,000)
Direct labor (140,000)
Variable overhead (30,000)
Fixed overhead (50,000) (430,000)
GM $70,000
S&A: Variable S&A (20,000)
Fixed S&A (60,000)
OI ($10,000)
Variable Costing
Income Statement
For the Year Ended Dec. 31, 1996
Rev. $500,000
VC: Direct materials (210,000)
Direct labor (140,000)
Variable overhead (30,000)
Variable S&A (20,000)
CM $100,000
FC: Fixed overhead (50,000)
Fixed S&A (60,000)
OI ($10,000)
78
1.
2. & 3. & 4.
2. 3.4.

79
Cass Company (p. 2)
Operating Leverage 10
79
BE($) FC
CM Ratio
$110,000
$100,000$500,000
$550,000
CM
NI
$100,000
$ 10,000
=
=
=
= =
=5.
6.
80
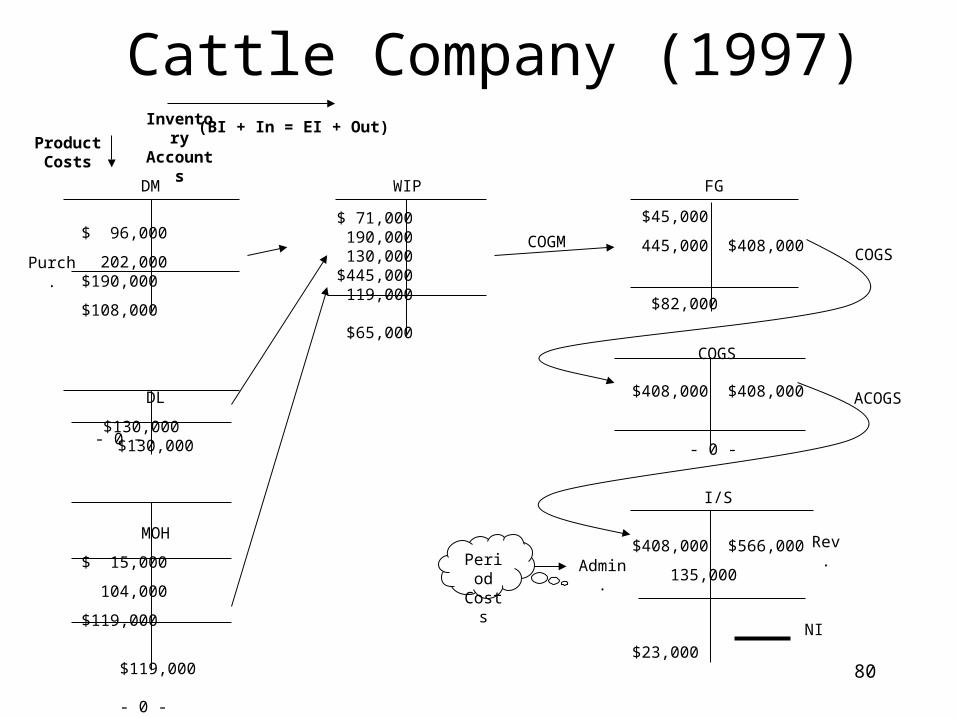
Cattle Company (1997)
$ 96,000
202,000 $190,000
$108,000
DL
$130,000 $130,000
MOH
$ 15,000
104,000
$119,000
$119,000
- 0 -
Purch.
Inventory AccountsProduct
Costs
$ 71,000 190,000 130,000 $445,000 119,000
$65,000
$45,000
445,000 $408,000
$82,000
$408,000 $408,000
- 0 -
I/S
$408,000 $566,000
135,000
$23,000
COGS
ACOGS
COGM
NI
Rev.
Admin.
(BI + In = EI + Out)
PeriodCosts
- 0 -
FG
COGS
WIPDM

81
Cattle Company (1998)
$ 65,000
235,000
170,000 $562,000
176,000
$84,000
$ 82,000
562,000 $575,000
$69,000
$575,000 $575,000
- 0 -
$575,000 $812,000
161,000
$76,000 NI
Rev.
ACOGS
COGSCOGM
DM
$108,000
229,000 $235,000
$102,000
DL
$170,000 $170,000
- 0 -
MOH
$18,000
158,000
$176,000
$176,000
- 0 -
Purch.
Admin.PeriodCosts
FG
COGS
I/S
WIP
Inventory AccountsProduct
Costs
(BI + In = EI + Out)
82
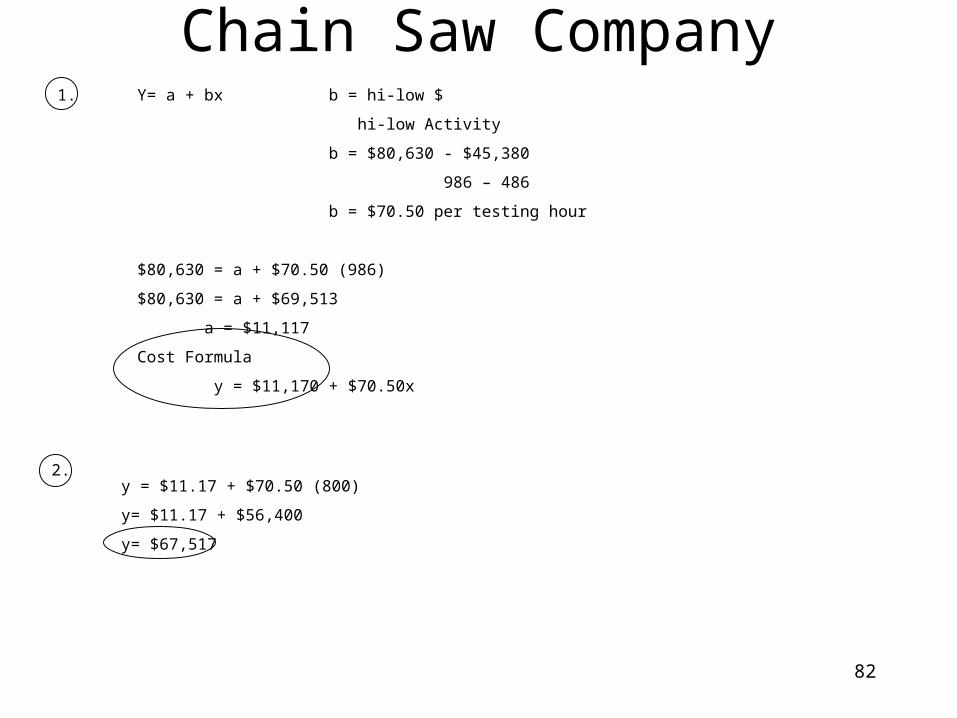
1. Y= a + bx b = hi-low $
hi-low Activity
b = $80,630 - $45,380
986 – 486
b = $70.50 per testing hour
$80,630 = a + $70.50 (986)
$80,630 = a + $69,513
a = $11,117
Cost Formula
y = $11,170 + $70.50x
2.y = $11.17 + $70.50 (800)
y= $11.17 + $56,400
y= $67,517
Chain Saw Company

83
Chain Saw Co. (cont.)CHAIN SAW COMPANYRegression Analysis
SUMMARY OUTPUTY = Costs X = Hours
J $54,235 640 Regression StatisticsF $59,520 722 Multiple R 0.915652697M $45,380 486 R Square 0.838419862A $64,000 886 Adjusted R Square 0.822261848M $59,235 634 Standard Error 4677.027055J $73,060 812 Observations 12J $81,625 927A $80,630 986 ANOVAS $75,105 958 df SS MS F Significance FO $63,970 819 Regression 1 1135045702 1135045702 51.88879487 2.91444E-05N $67,350 856 Residual 10 218745820.7 21874582.07D $55,285 546 Total 11 1353791523
Coefficients Standard Error t Stat P-value Lower 95% Upper 95%Intercept 17431.74361 6733.347046 2.588867542 0.027002373 2428.90886 32434.57837X = Hours 61.49849834 8.537441076 7.203387736 2.91444E-05 42.47589089 80.52110579
y = $61.50 x + $17,431.74
when x = 800 y = $66,631.74
Cost Function:

8484
Cheetah Company
Cost Pools Activity Costs Cost Drivers Overhead Rate
Machine setup $360,000 3,000 setup hours $120Materials handling $100,000 25,000 pounds $ 4Electric power $ 40,000 40,000 kilowatt hours $ 1
Direct materialsDirect laborFactory overhead: Machine setup Materials handling Electric powerTotal product costsProduction unitsCost per Unit
The Quick$40,000
24,000
24,000 4,000
2,000$94,000 4,000$ 23.50
$120 × 200 =$ 4 × 1,000 =$ 1 × 2,000 =
÷
The Dead$50,000
40,000
28,800 12,000
4,000$134,800 20,000
$ 6.74
$120 × 240 =$ 4 × 3,000 =$ 1 × 4,000 =
÷
÷÷÷
===
8585
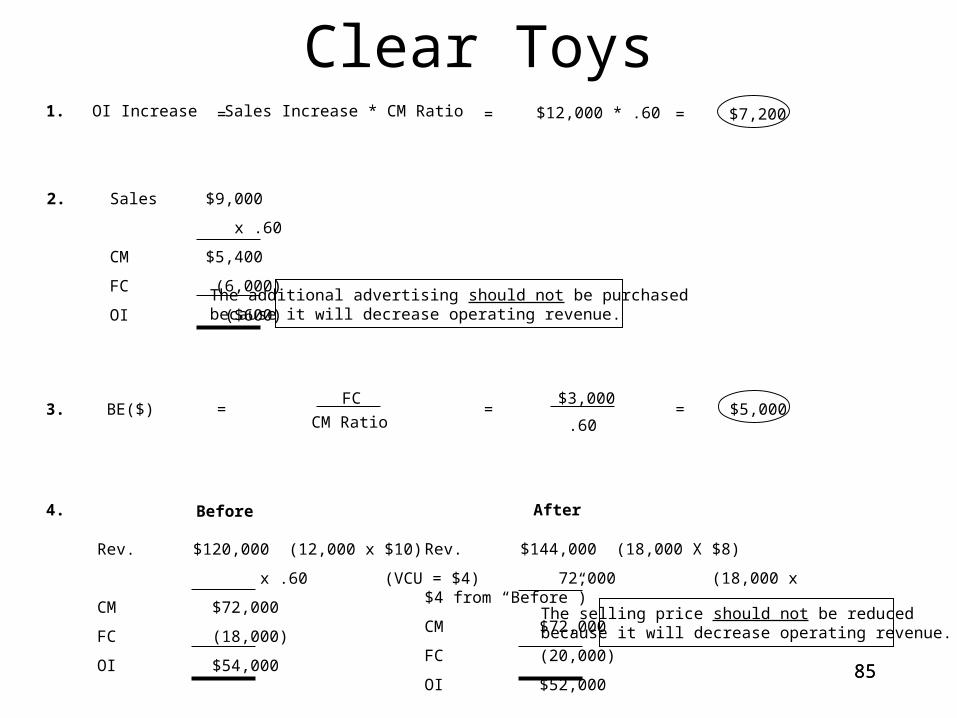
$12,000 * .60
Sales $9,000
x .60
CM $5,400
FC (6,000)
OI ($600)
Rev. $120,000 (12,000 x $10)
x .60 (VCU = $4)
CM $72,000
FC (18,000)
OI $54,000
Rev. $144,000 (18,000 X $8)
72,000 (18,000 x $4 from “Before”)
CM $72,000
FC (20,000)
OI $52,000
Clear ToysOI Increase = Sales Increase * CM Ratio = $7,200=
The additional advertising should not be purchasedbecause it will decrease operating revenue.
BE($)FC
CM Ratio
$3,000
.60$5,000= = =
Before After
The selling price should not be reducedbecause it will decrease operating revenue.
1.
2.
3.
4.
86
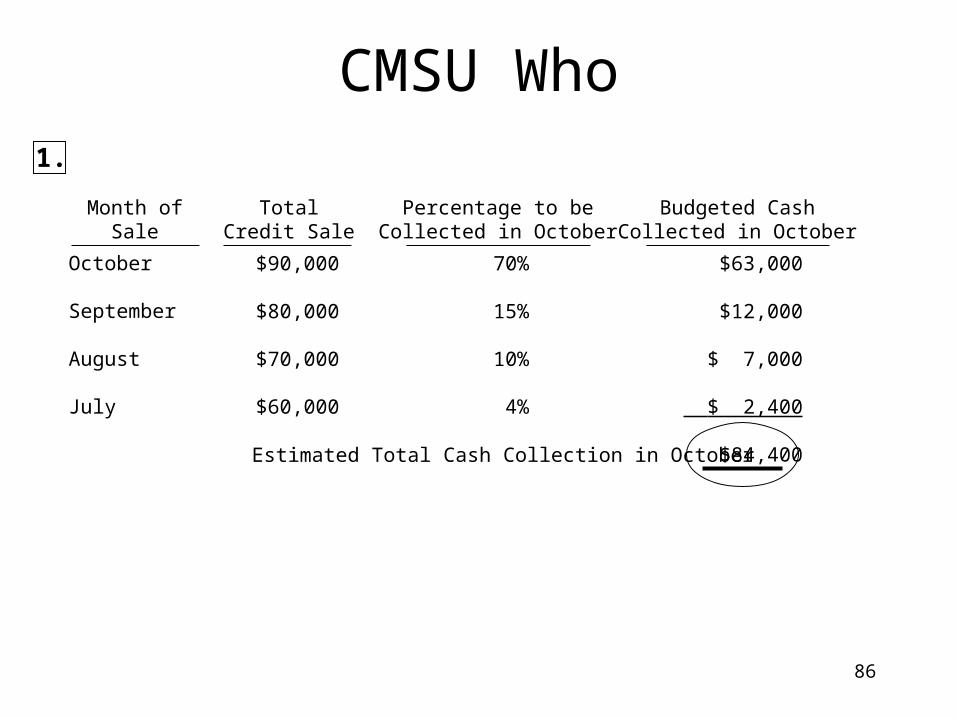
CMSU Who
Month ofSale
TotalCredit Sale
Percentage to beCollected in October
Budgeted CashCollected in October
October
September
August
July
$90,000
$80,000
$70,000
$60,000
70%
15%
10%
4%
$63,000
$12,000
$ 7,000
$ 2,400
$84,400Estimated Total Cash Collection in October
1.
87
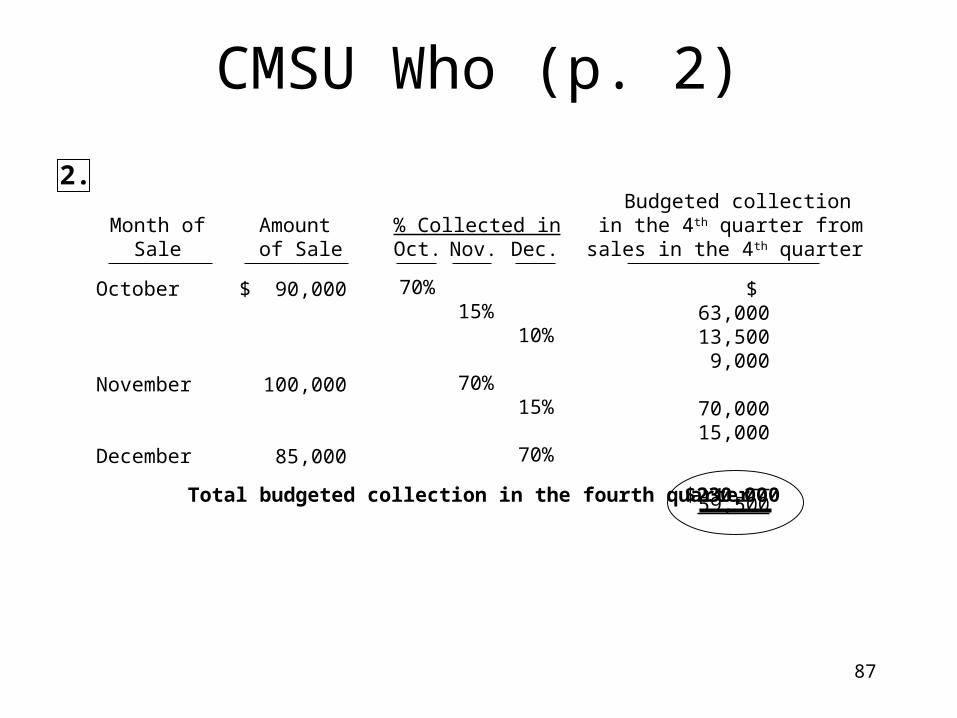
CMSU Who (p. 2)
Month ofSale
Amount of Sale
% Collected inOct. Nov. Dec.
Budgeted collection in the 4th quarter fromsales in the 4th quarter
October
November
December
$ 90,000
100,000
85,000
70%15%
70%
10%
15%
70%
$ 63,00013,500
9,000
70,00015,000
59,500
Total budgeted collection in the fourth quarter $230,000
2.

88
The Costume Company
$800,000 ÷ $8.00 = 100,000 expected (budgeted) DLH… 4 DLH per unit
FIXED OVERHEAD Spending Volume Actual FOH Budgeted FOH Applied FOH BQ × SP SQ × SP $802,000 $800,000 (25,250)(4) × $8
$808,000
$2,000 U $8,000 F
$6,000 F
Flexible Budget Variance = $2,000 U
WHERE: BQ = Budgeted Qty. × Std. Allowed

89
Cowboy Boots Co.Standard Allowedfor Actual Output
Price Quantity / Usage
AQ × AC AQ × SC SQ × SC
yards
10,000 × $8.00
$80,000
(7,000)(1.5) × $9.0010,500 × $9.00
$94,500
10,000 × $9.00
$90,000
$10,000 F
$4,500 U
CAN’T!
DIRECT MATERIALS
11,000 × $9.00
$99,000
DM Purchased ≠ DM Used

90
Cowboy Boots Co. (p.2)Standard Allowedfor Actual Output
Rate Efficiency
AQ × AC AQ × SC SQ × SC
DLH
3,800 × $15.50
$58,900
(7,000)(0.5) × $15.003,500 × $15.00
$52,500
3,800 × $15.00
$57,000
$1,900 U $4,500 U
$6,400 U
DIRECT LABOR

91
Coxwain Company
Price
AQ * AP AQ * SP SQ * SP18,000 * $3.60 SP = $3.40
18,000 * SP$64,800 $61,200
AQ * SP SQ * SP15,000 * $3.40 16,000 * $3.40
$51,000 $54,400
$3,600 u
Quantity/ Usage
$3,400 F

92
Creamed Cornhusker
Rate Efficiency
AQ × AC AQ × SC SQ × SC11,000 × $30.00 11,000 × $33.00 12,000 × $33.00 $330,000 $363,000 $396,000
$33,000 F $33,000 F
$66,000 F
Std. Allowed forActual Output(in units)
1.
2.
9393
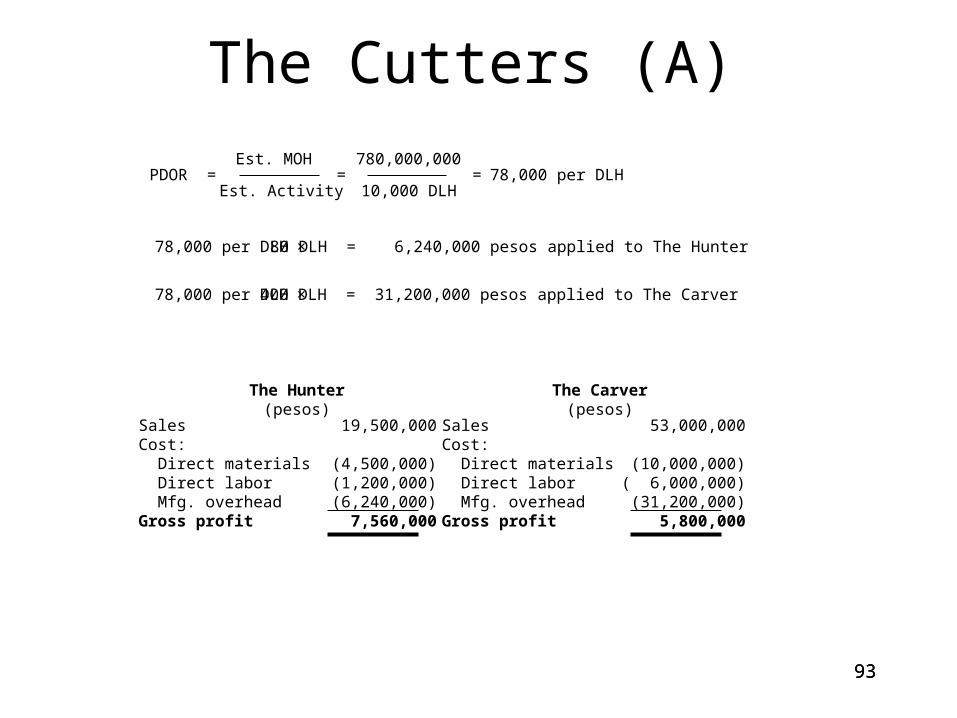
The Cutters (A)
PDOR =Est. MOH
Est. Activity=
780,000,000
10,000 DLH= 78,000 per DLH
78,000 per DLH × 80 DLH = 6,240,000 pesos applied to The Hunter
78,000 per DLH × 400 DLH = 31,200,000 pesos applied to The Carver
SalesCost: Direct materials Direct labor Mfg. overheadGross profit
53,000,000
(10,000,000) ( 6,000,000) (31,200,000)
5,800,000
The Carver(pesos)
SalesCost: Direct materials Direct labor Mfg. overheadGross profit
19,500,000
(4,500,000) (1,200,000) (6,240,000)
7,560,000
The Hunter(pesos)
9494
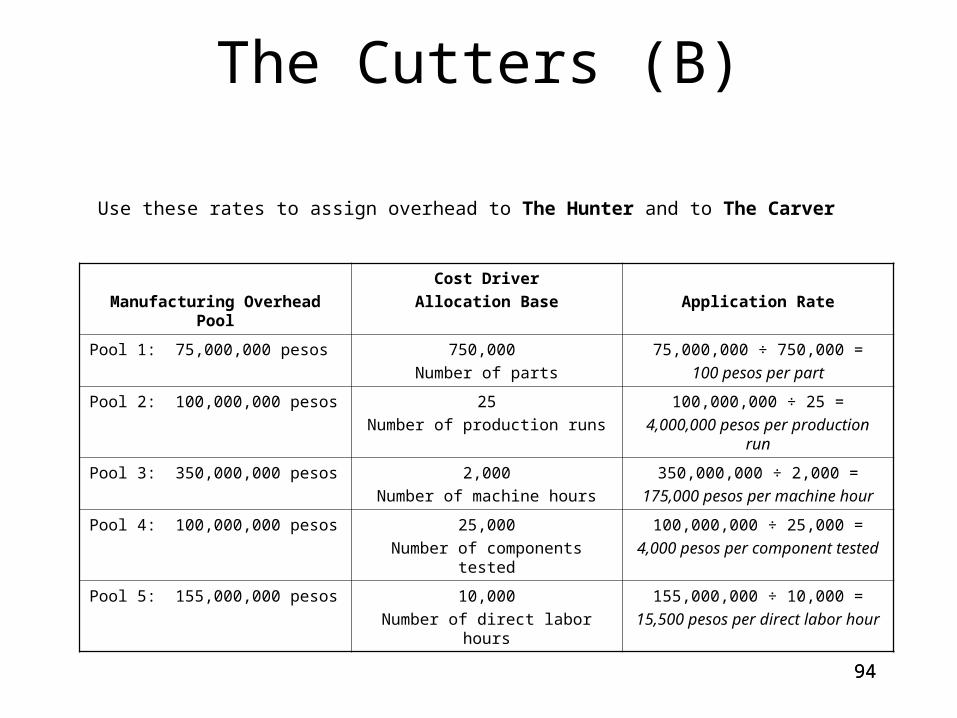
The Cutters (B)
Manufacturing Overhead Pool
Cost Driver
Allocation Base Application Rate
Pool 1: 75,000,000 pesos 750,000
Number of parts
75,000,000 ÷ 750,000 =
100 pesos per part
Pool 2: 100,000,000 pesos 25
Number of production runs
100,000,000 ÷ 25 =
4,000,000 pesos per production run
Pool 3: 350,000,000 pesos 2,000
Number of machine hours
350,000,000 ÷ 2,000 =
175,000 pesos per machine hour
Pool 4: 100,000,000 pesos 25,000
Number of components tested
100,000,000 ÷ 25,000 =
4,000 pesos per component tested
Pool 5: 155,000,000 pesos 10,000
Number of direct labor hours
155,000,000 ÷ 10,000 =
15,500 pesos per direct labor hour
Use these rates to assign overhead to The Hunter and to The Carver
9595
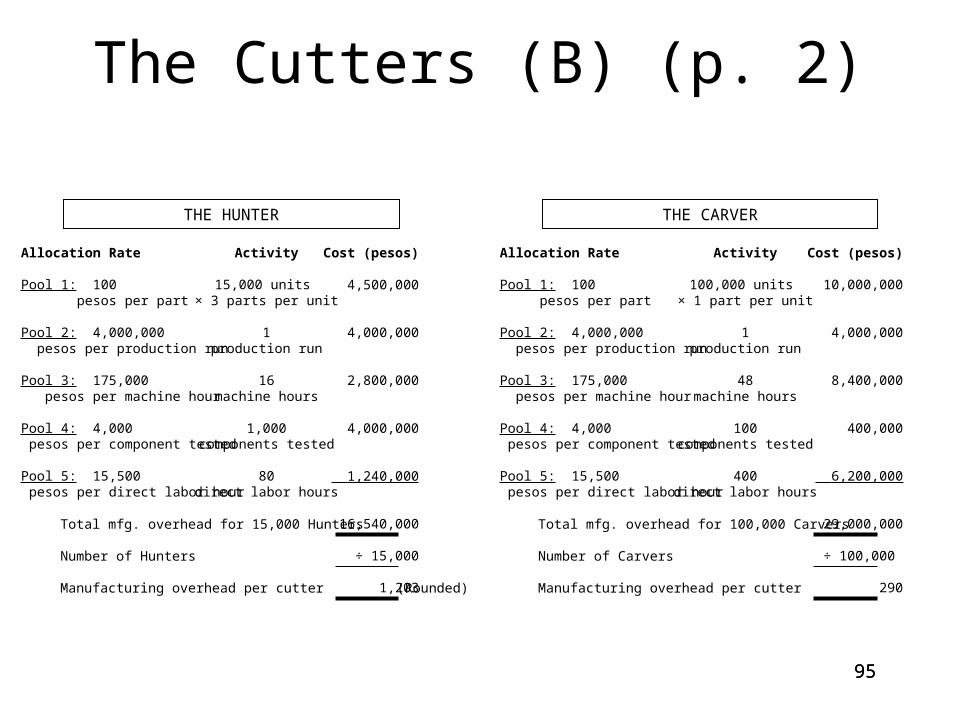
Allocation Rate
Pool 1: 100 pesos per part
Pool 2: 4,000,000 pesos per production run
Pool 3: 175,000 pesos per machine hour
Pool 4: 4,000 pesos per component tested
Pool 5: 15,500 pesos per direct labor hour
Activity
15,000 units × 3 parts per unit
1production run
16machine hours
1,000components tested
80direct labor hours
Cost (pesos)
4,500,000
4,000,000
2,800,000
4,000,000
1,240,000
16,540,000
÷ 15,000
1,203
Total mfg. overhead for 15,000 Hunters
Number of Hunters
Manufacturing overhead per cutter
Allocation Rate
Pool 1: 100 pesos per part
Pool 2: 4,000,000 pesos per production run
Pool 3: 175,000 pesos per machine hour
Pool 4: 4,000 pesos per component tested
Pool 5: 15,500 pesos per direct labor hour
Activity
100,000 units × 1 part per unit
1production run
48machine hours
100components tested
400direct labor hours
Cost (pesos)
10,000,000
4,000,000
8,400,000
400,000
6,200,000
29,000,000
÷ 100,000
290
Total mfg. overhead for 100,000 Carvers
Number of Carvers
Manufacturing overhead per cutter
THE HUNTER THE CARVER
The Cutters (B) (p. 2)
(Rounded)

9696
The Cutters (B) (p. 3)
PROFIT PER ACTIVITY-BASED COSTINGThe Cutters (B)
PROFIT PER JOB-ORDER COSTING The Cutters (A)
SalesCost: Direct materials Direct labor Mfg. overheadGross profit
53,000,000
(10,000,000) ( 6,000,000) (29,000,000)
8,000,000
The Carver(pesos)
SalesCost: Direct materials Direct labor Mfg. overheadGross profit
19,500,000
( 4,500,000) ( 1,200,000) (16,540,000)
( 2,740,000)
The Hunter(pesos)
SalesCost: Direct materials Direct labor Mfg. overheadGross profit
53,000,000
(10,000,000) ( 6,000,000) (31,200,000)
5,800,000
The Carver(pesos)
SalesCost: Direct materials Direct labor Mfg. overheadGross profit
19,500,000
(4,500,000) (1,200,000) (6,240,000)
7,560,000
The Hunter(pesos)

97
Cutting Edge Skis
Shaping and Milling Dept.
November 1997
(Round to 3 decimal places)
WIP Units
200
5000
400
4800Out
BI
IN
EI
DM
50%
40%
CC
30%
25%
WIP - $ (Wtd. Avg.)
DM $3000
CC $1,000
DM $74,000
CC 70,000
DM $2,483.84
CC $1,449.00
$3,932.84
4800 * 30.014
= $144,067.20
= 400 * 40% * $15.524
= 400 * 25% * $14.490
OutBI
IN
EI
E.U.
DM CC
4800
160
4960
4800
100
4900
Costs to Account For
DM CC
$3,000
$74,000
$77,000
$1,000
$70,000
$71,000
BI
IN
Total
$/EU
DMCC
$77,000 / 4960 = $15.524
$71,000 / 4900 = $14.490
$30.014
OUT
EI: (DM) 400 * 40%
EI: (CC) 400 * 25%
E.U.
WEIGHTED AVERAGE METHOD
98
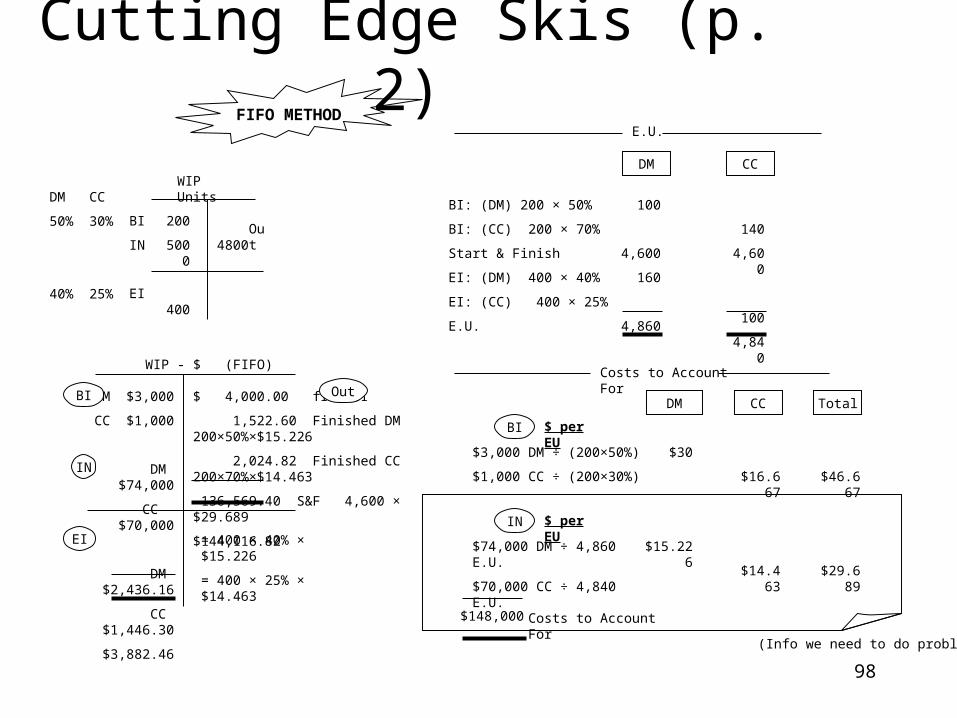
Cutting Edge Skis (p. 2)
WIP - $ (FIFO)
DM $3,000
CC $1,000
DM $74,000
CC $70,000
DM $2,436.16
CC $1,446.30
$3,882.46
$ 4,000.00 from BI
1,522.60 Finished DM 200×50%×$15.226
2,024.82 Finished CC 200×70%×$14.463
136,569.40 S&F 4,600 × $29.689
$144,116.82
= 400 × 40% × $15.226
= 400 × 25% × $14.463
OutBI
IN
EI
E.U.
DM CC
100
4,600
160
4,860
140
4,600
100
4,840
Costs to Account For
DM CC
$30
$16.667
$ per EU
BI: (DM) 200 × 50%
BI: (CC) 200 × 70%
Start & Finish
EI: (DM) 400 × 40%
EI: (CC) 400 × 25%
E.U.
FIFO METHOD
BI
$3,000 DM ÷ (200×50%)
$1,000 CC ÷ (200×30%)
Total
$46.667
$15.226
$14.463
$ per EUIN
$74,000 DM ÷ 4,860 E.U.
$70,000 CC ÷ 4,840 E.U. $29.689
(Info we need to do problem)
$148,000 Costs to Account For
WIP Units
200
5000
400
4800Out
BI
IN
EI
DM
50%
40%
CC
30%
25%

99
Cyclone Company
FG – 2nd Quarter
1,600
8,800
2,400
8,000
BI (8,000 * 20%)
Budgeted Production
EI (12,000 * 20%)
Budgeted sales

100100
WTD. WTD.AVG. AVG.
SP VC CM MIX CM SP
Boston $1,200 $700 $500 60% $300 $720
Deluxe $5,000 $2,000 $3,000 40% $1,200 $2,000
$1,500 $2,720
60% Boston = 1200 Boston = 1200 Boston
40% Deluxe = 800 Deluxe = 800 Deluxe
2000 units total @ BE
2,000 units
-- OR ---
1200 x $1200 = $1,440,000
800 x $5000 = 4,000,000
$5,440,000
Deering Banjo Co.
BE(units)
BE($)
FC
FC
CM per unit
CM ratio$3,000,000
$1,500$2,700
2,000 units
$5,440,000
$3,000,000
$1,500= = =
= = =
1.
2.

101101
Duncan’s Avionics
1. The cost of the memory chips used in a radar set.
2. Factory heating costs.
3. Factory equipment maintenance costs.
4. Training costs for new administrative employees.
5. The cost of the solder that is used in assembling the radar sets.
6. The travel costs of the company’s salespersons.7. Wages and salaries of factory security personnel.
8. The cost of air-conditioning executive offices.
9. Wages and salaries in the department that handles billing customers.
10. Depreciation on the equipment in the fitness room used by factory workers.
11. Telephone expenses incurred by factory management.
12. The costs of shipping completed radar sets to customers.
13. The wages of the workers who assemble the radar sets.
15. Health insurance premiums for factory personnel.
14. The president’s salary.
Product Period
X
X
X
X
X
X
X
X
X
X
X
X
X
X
X

102
Q=DLH
$4.00 $900,000
(SP) 1,500,000 × 150/1000
Rate Eff
AQ x AP190,000 x $4.00$760,000
SQ x SP
180,000 X $4.00
$720,000
$760,000 ÷ 190,000AQ x SP
$0 $40,000 U
1,200,000 x 150/1000
=
1. FC $150,000
VC $720,000
$870,000
190,000 × $4.00
$760,000GIVEN
=
180,000
2.Dunce Company

103103
Earl Corporation
Additional costs if processed furtherIncrease in sales value if processed furtherDifferential benefit (cost)
$28,00040,000
$ 12,000
$20,00020,000
$ 0
A B
$12,00020,000$ 8,000
C
Earl Corporation is indifferent about the further processing for B since the net benefit is zero.There would be a positive benefit for further processing of A ($12,000) and C ($8,000).
104104
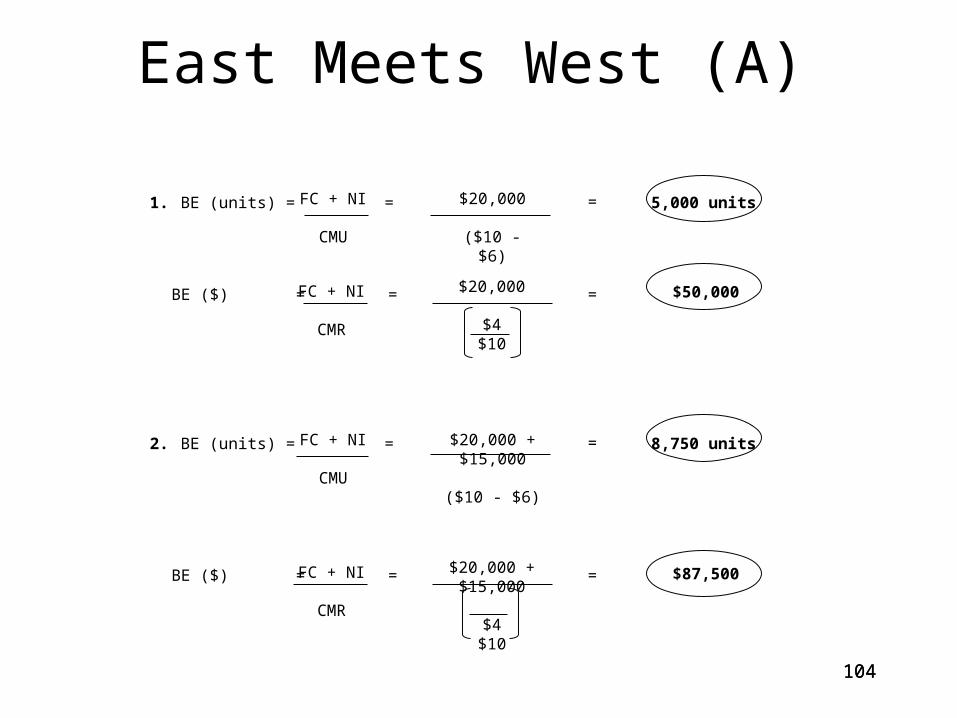
East Meets West (A)
1. BE (units) = FC + NI
CMU
= $20,000
($10 - $6)
= 5,000 units
BE ($) = FC + NI
CMR
= $20,000
$4$10
= $50,000
2. BE (units) = FC + NI
CMU
= $20,000 + $15,000
($10 - $6)
= 8,750 units
BE ($) = FC + NI
CMR
= $20,000 + $15,000
$4$10
= $87,500
105105
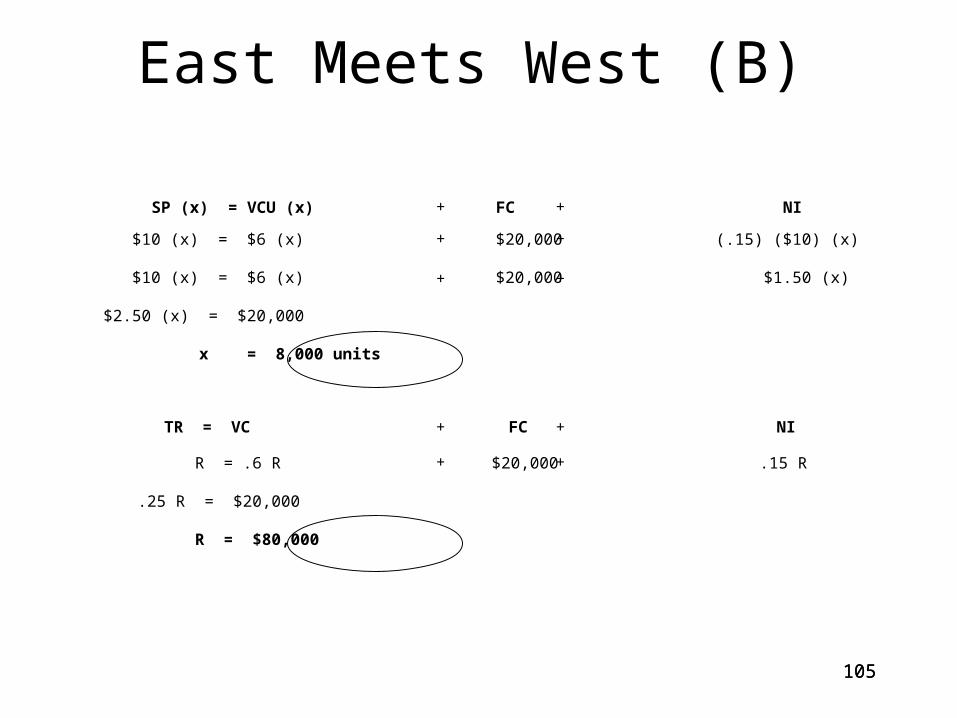
East Meets West (B)
SP (x) = VCU (x) FC NI
$10 (x) = $6 (x) $20,000 (.15) ($10) (x)
$10 (x) = $6 (x) $20,000 $1.50 (x)
$2.50 (x) = $20,000
x = 8,000 units
+
+
+
+
+
+
TR = VC FC NI
R = .6 R $20,000 .15 R
.25 R = $20,000
R = $80,000
+
+
+
+
106106
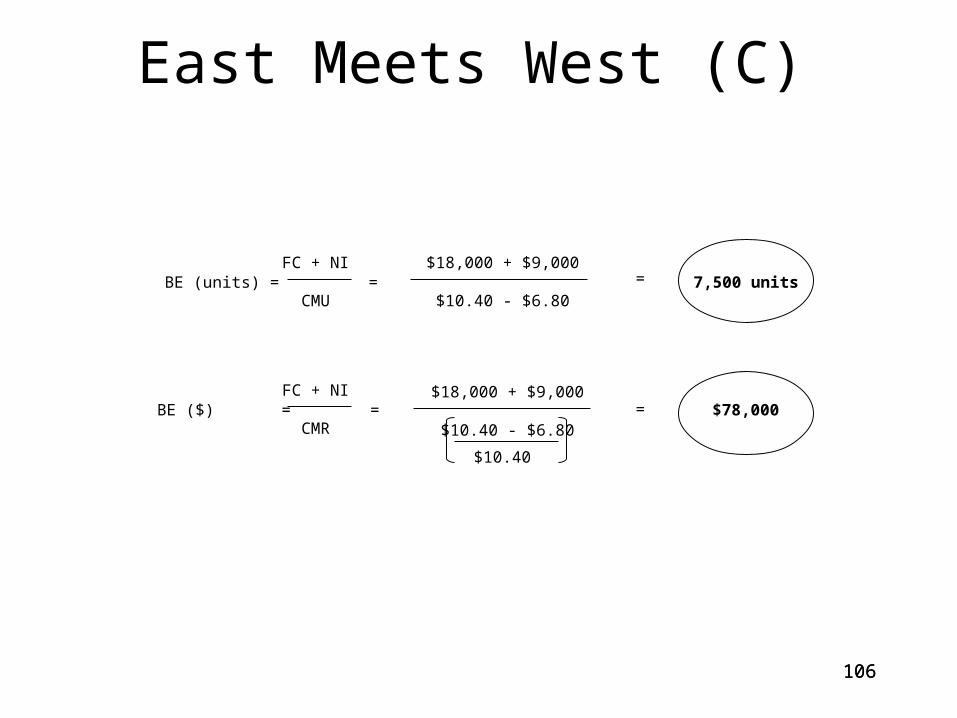
East Meets West (C)
BE (units) = FC + NI
CMU=
$18,000 + $9,000
$10.40 - $6.80
= 7,500 units
BE ($) = =$18,000 + $9,000
$10.40 - $6.80= $78,000
FC + NI
CMR
$10.40
107107
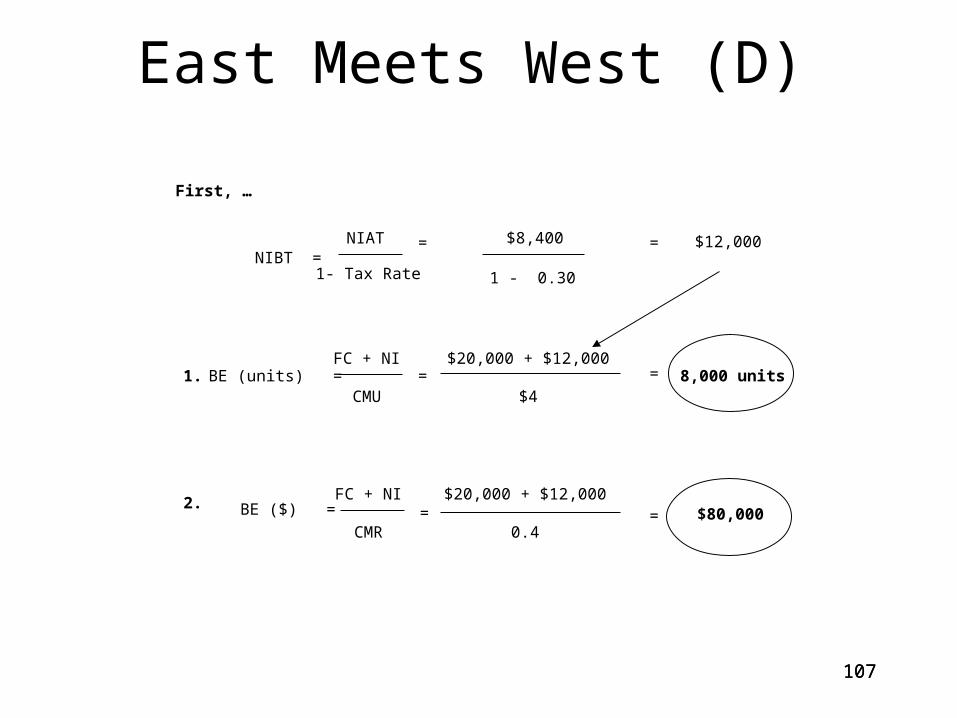
East Meets West (D)
1.
2.
BE (units) = FC + NI
CMU=
$20,000 + $12,000
$4
= 8,000 units
BE ($) = FC + NI
CMR=
$20,000 + $12,000
0.4= $80,000
NIBT = NIAT
1- Tax Rate
= $8,400
1 - 0.30
First, …
= $12,000

108108
East Meets West (E)
$20,000 + $12,0000.4
$27,500 + $12,0000.5
This seems better because EMW does notneed earn as much revenue to achieve itstarget profit
BUT!
$20,0000.4
$27,5000.5
Actual Rev. – BE Rev. $80,000 - $50,000Actual Rev. $80,000
Actual Rev. – BE Rev. $79,000 - $55,000
Actual Rev. $79,000MORE RISKY
=
=
=
=
=
=
=
=
=
=
=
=FC + NI
CMR
FC + NI
CMR
FC + NI
CMR
FC + NI
CMR
Current
New BE ($)
Current
New
BE ($)
BE ($)
BE ($)
Current
New MS Ratio
MS Ratio
$80,000
$79,000
$50,000
$55,000
.375
.304
=
=
=
=
=
=
109
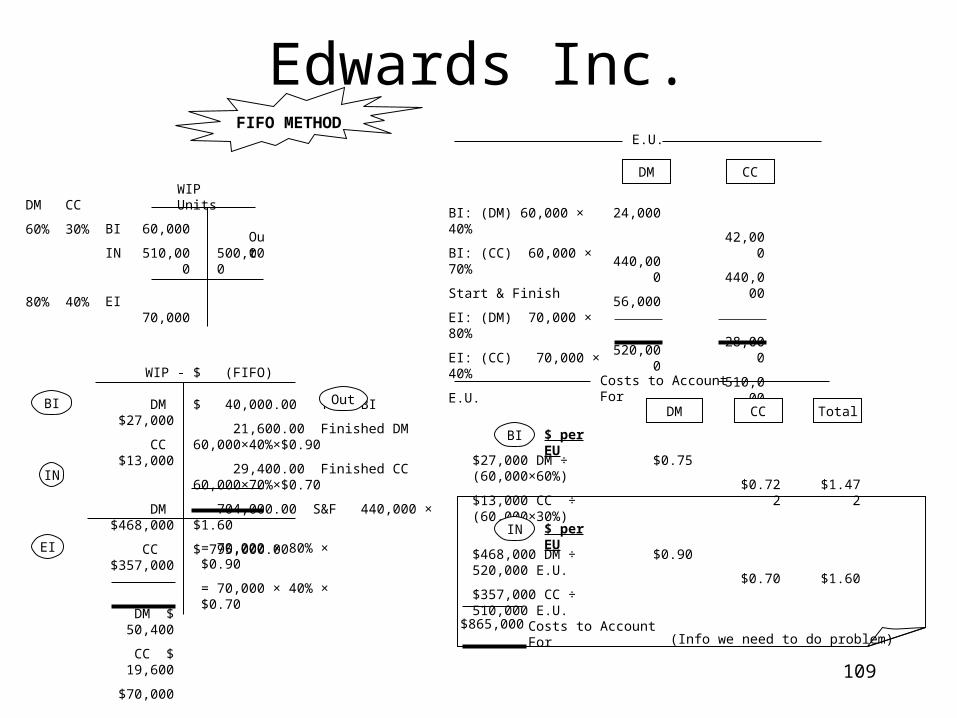
Edwards Inc.
WIP - $ (FIFO)
DM $27,000
CC $13,000
DM $468,000
CC $357,000
DM $ 50,400
CC $ 19,600
$70,000
$ 40,000.00 from BI
21,600.00 Finished DM 60,000×40%×$0.90
29,400.00 Finished CC 60,000×70%×$0.70
704,000.00 S&F 440,000 × $1.60
$ 795,000.00
= 70,000 × 80% × $0.90
= 70,000 × 40% × $0.70
OutBI
IN
EI
E.U.
DM CC
24,000
440,000
56,000
520,000
42,000
440,000
28,000
510,000
Costs to Account For
DM CC
$0.75
$0.722
$ per EU
BI: (DM) 60,000 × 40%
BI: (CC) 60,000 × 70%
Start & Finish
EI: (DM) 70,000 × 80%
EI: (CC) 70,000 × 40%
E.U.
FIFO METHOD
BI
$27,000 DM ÷ (60,000×60%)
$13,000 CC ÷ (60,000×30%)
Total
$1.472
$0.90
$0.70
$ per EUIN
$468,000 DM ÷ 520,000 E.U.
$357,000 CC ÷ 510,000 E.U. $1.60
$865,000 Costs to Account For
WIP Units
60,000
510,000
70,000
500,000Out
BI
IN
EI
DM
60%
80%
CC
30%
40%
(Info we need to do problem)

110110
Everything Inc.
* Some of the listed businesses might user either process costing or a job-ordercosting system, depending on how operations are carried out and howhomogeneous the final product is. For example, a plywood manufacturer mightuse job-order costing if plywoods are constructed of different woods or comein markedly different sizes.
Job-Order Costing Process Costing
Custom yacht builder x
Golf course designer x
Potato chip manufacturer x
Business consultant x
Plywood manufacturer* x
Soft-drink bottler* x
Film studio x
Bridge construction company x
Manufacturer of fine custom jewelry x
Made-to-order garment factory x
Factory making one personal computer model x
Fertilizer factory x
111
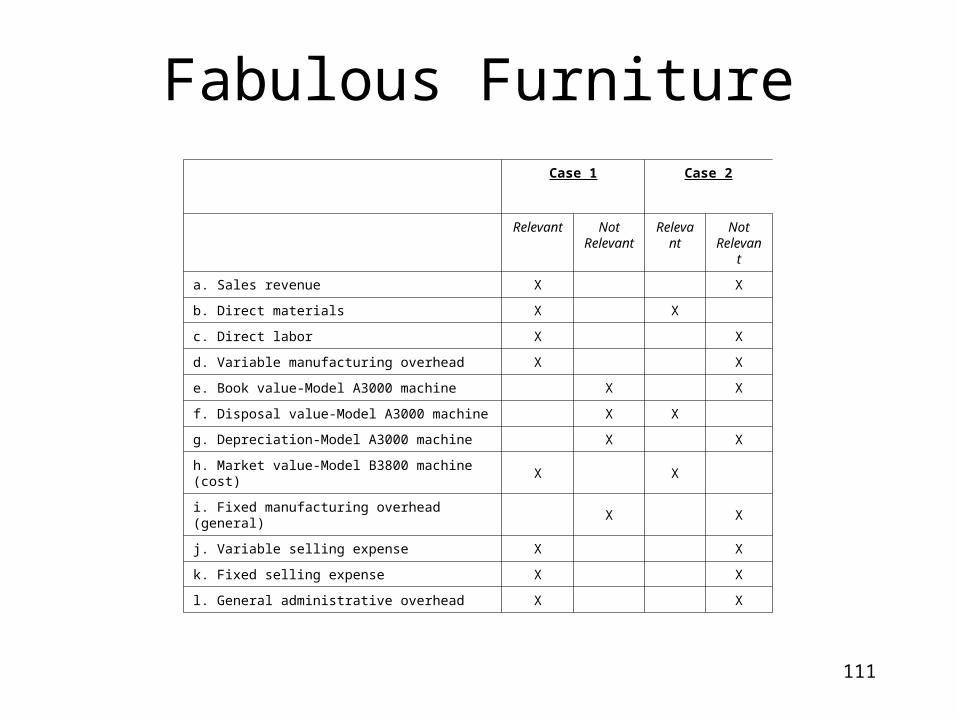
Case 1 Case 2
Relevant Not Relevant
Relevant
Not Relevant
a. Sales revenue X X
b. Direct materials X X
c. Direct labor X X
d. Variable manufacturing overhead X X
e. Book value-Model A3000 machine X X
f. Disposal value-Model A3000 machine X X
g. Depreciation-Model A3000 machine X X
h. Market value-Model B3800 machine (cost) X X
i. Fixed manufacturing overhead (general) X X
j. Variable selling expense X X
k. Fixed selling expense X X
l. General administrative overhead X X
Fabulous Furniture

112
Fast Company
VARIABLE-COSTING INCOME STATEMENTS
SalesLess variable expenses: Variable cost of goods sold a
Variable selling and administrative b
Contribution marginLess fixed expenses: Fixed overhead Fixed selling and administrativeNet income
$1,500,000
(900,000) (37,500)$ 562,500
(150,000) (50,000)$ 362,500
$1,000,000
(600,000) (25,000) $ 375,000
(150,000) (50,000)$ 175,000
$2,000,000
(1,200,000) (50,000)$ 750,000
(150,000) (50,000)$ 550,000
2002 2003 2004
a 2002: $6.00 × 150,000 = $ 900,000 2003: $6.00 × 100,000 = $ 600,000 2004: $6.00 × 200,000 = $1,200,000
b $0.25 per unit × Units sold
$4.00 + $1.50 + $0.50 = $6.00
113
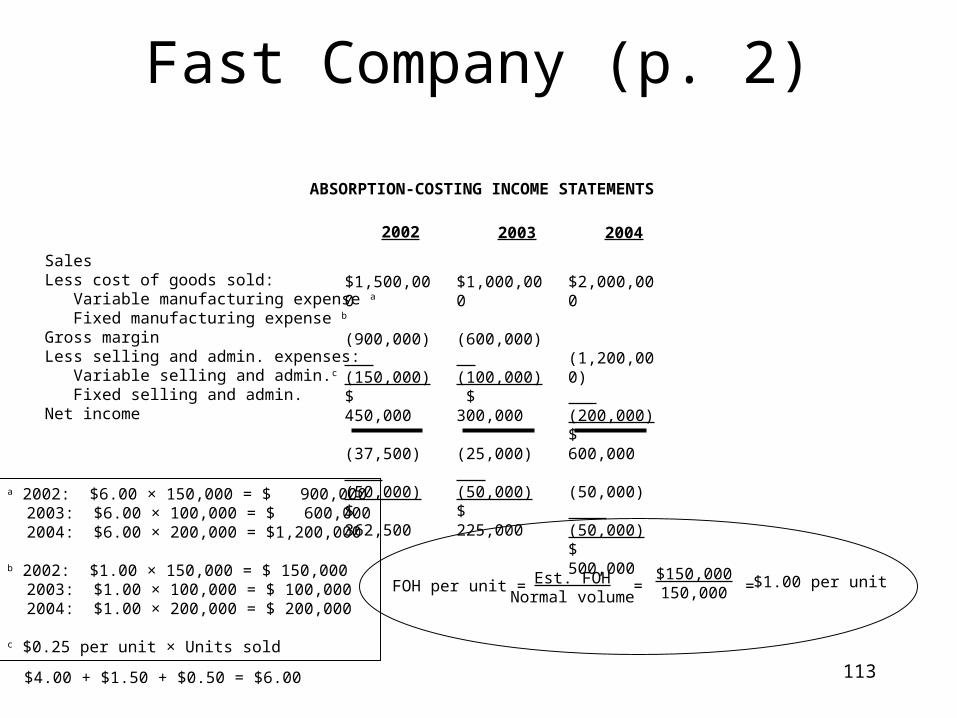
Fast Company (p. 2)
ABSORPTION-COSTING INCOME STATEMENTS
SalesLess cost of goods sold: Variable manufacturing expense a
Fixed manufacturing expense b
Gross marginLess selling and admin. expenses: Variable selling and admin.c
Fixed selling and admin.Net income
$1,500,000
(900,000) (150,000)$ 450,000
(37,500) (50,000)$ 362,500
$1,000,000
(600,000) (100,000) $ 300,000
(25,000) (50,000)$ 225,000
$2,000,000
(1,200,000) (200,000)$ 600,000
(50,000) (50,000)$ 500,000
2002 2003 2004
a 2002: $6.00 × 150,000 = $ 900,000 2003: $6.00 × 100,000 = $ 600,000 2004: $6.00 × 200,000 = $1,200,000
b 2002: $1.00 × 150,000 = $ 150,000 2003: $1.00 × 100,000 = $ 100,000 2004: $1.00 × 200,000 = $ 200,000
c $0.25 per unit × Units sold
FOH per unit = Est. FOHNormal volume
=$150,000150,000 = $1.00 per unit
$4.00 + $1.50 + $0.50 = $6.00
114
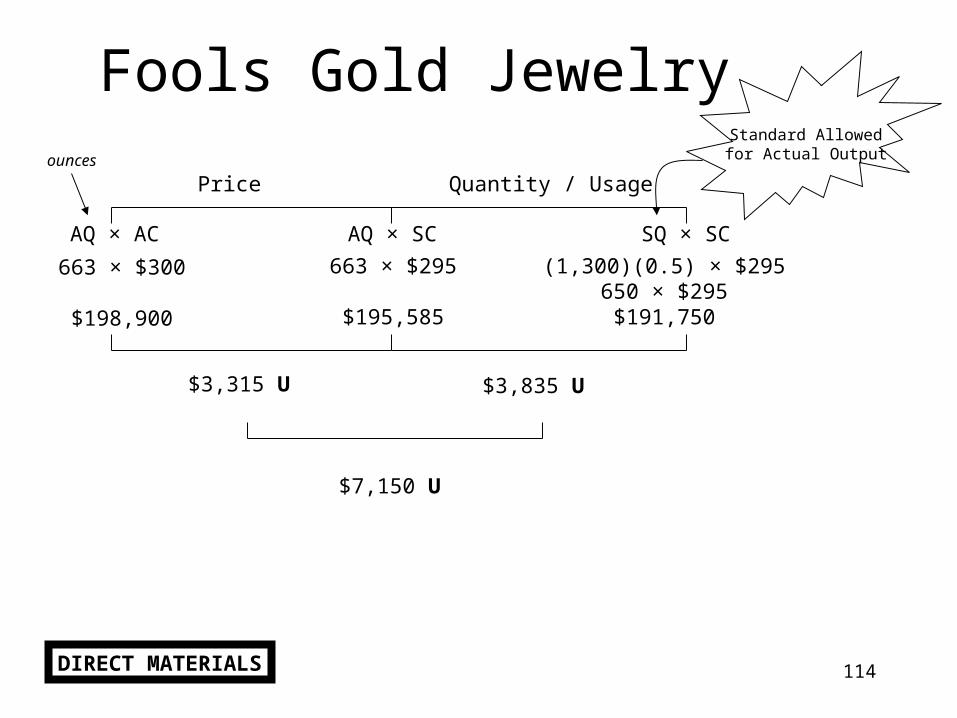
Fools Gold JewelryStandard Allowedfor Actual Output
Price Quantity / Usage
AQ × AC AQ × SC SQ × SC
ounces
663 × $300
$198,900
(1,300)(0.5) × $295650 × $295$191,750
663 × $295
$195,585
$3,315 U $3,835 U
$7,150 U
DIRECT MATERIALS
115115
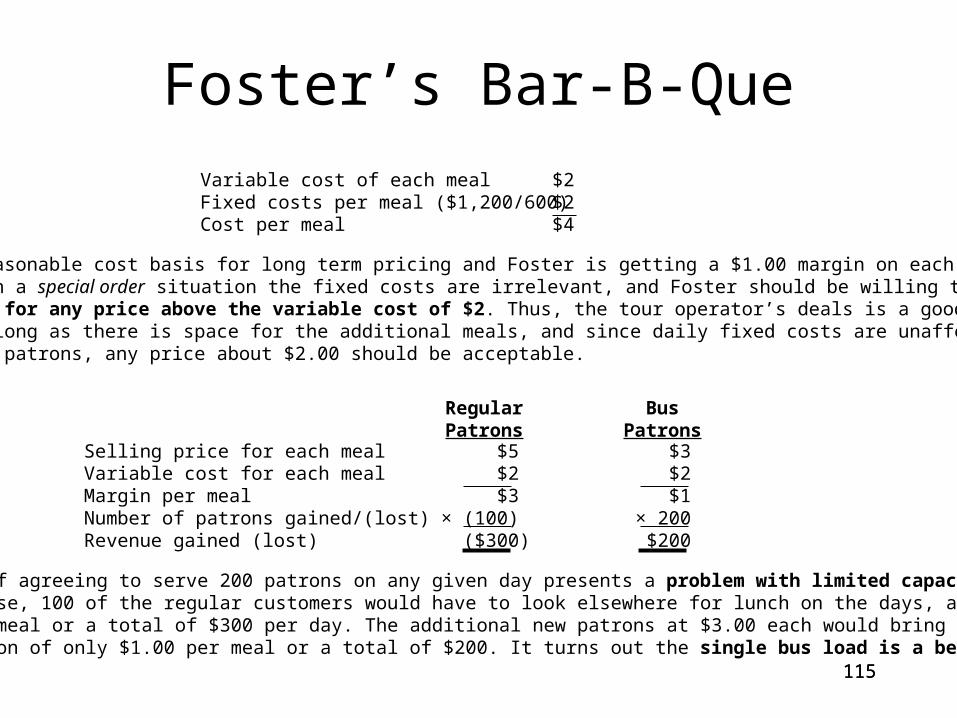
Foster’s Bar-B-Que
Variable cost of each mealFixed costs per meal ($1,200/600)Cost per meal
$2$2$4
$4 is a reasonable cost basis for long term pricing and Foster is getting a $1.00 margin on each meal.However, in a special order situation the fixed costs are irrelevant, and Foster should be willing to accepta customer for any price above the variable cost of $2. Thus, the tour operator’s deals is a good one forBarry. As long as there is space for the additional meals, and since daily fixed costs are unaffected by theadditional patrons, any price about $2.00 should be acceptable.
Selling price for each mealVariable cost for each mealMargin per mealNumber of patrons gained/(lost)Revenue gained (lost)
$5 $2 $3
× (100) ($300)
$3$2$1
× 200$200
RegularPatrons
BusPatrons
The idea of agreeing to serve 200 patrons on any given day presents a problem with limited capacity.In this case, 100 of the regular customers would have to look elsewhere for lunch on the days, at a loss of$3.00 per meal or a total of $300 per day. The additional new patrons at $3.00 each would bring in acontribution of only $1.00 per meal or a total of $200. It turns out the single bus load is a better deal.

116116
Frodo CompanyThere are two ways to approach this problem: Method 1:Costs Keep Old Buy New DifferenceOperating costs ($75,000) ($20,000)Depreciation (not relevant) ($30,000) ($30,000)Resale of old $ 2,000Purchase of new ($40,000)
_______ _______($105,000) ($88,000) $17,000
Method 2:Incremental Method (as shown in class)
Change in operating cost $11,000 × 5 years = $ 55,000Resale of old machine $ 2,000Cost of new machine ($40,000)(Cost) or Savings $ 17,000
- =
Frodo should buy the new machine as it will result in a savings of $17,000.

117
FOH
Spending Volume
Actual
AQ × AC
$7,890
Budgeted
BQ × SC
(3,100)(2.5) × $0.90
7,750 × $0.90
$6,975
$140 U $225 U
Applied
SQ x SC
(3000)(2.5) × $0.90
7,500 × $0.90
$6,750
VOH
Spending Efficiency
AQ × AC
7,300 × $2.308
$16,850
AQ × SC
7,300 × $2.20
$16,060
$790 U $440 F
SQ × SC
(3000)(2.5) × $2.20
7,500 × $2.20
$16,500
Frostee Freeze Co.

118
The case will require three attorneys to stay four nights ina San Francisco hotel. The predicted hotel bill is $1,200.
1.
Funk and Wagnall’s professional staff is paid $800per day for out-of-town assignments.2.
Last year, depreciation on Funk and Wagnall’soffice was $12,000.3.
Round-trip transportation to San Francisco is expectedto cost $600 per person for the engagement.4.
The firm has recently accepted an engagement that willrequire partners to spend two weeks in Dallas. Thepredicted out-of-pocket costs of this engagement are $8,500.
5.
The firm has a maintenance contract on its word processingequipment that will cost $2,200 next year.6.
If the firm accepts the engagement in San Francisco, it willhave to decline a conflicting engagement in Orlando thatwould have provided a net cash inflow of $7,200.
7.
The firm’s variable overhead is $40 per client-hour.8.
The firm pays $150 per year for Mr. Funk’s subscriptionto a law journal.9.
Last year the firm paid $7,500 to increase the insulationin its building.10.
Relevant Costs Irrelevant Costs
Opportunity Outlay Outlay Sunk
X
X
X
X
X
X
X
X
X X
X
Funk and Wagnall

119119
Gamers Inc.
Selling price per unitVariable cost per unitContribution margin per unitRelative use of labor hours(GASH requries ½ as many as Bash)Contribution margin per labor hr.
$200.00164.00
$ 36.00÷ 2
$ 18.00
$140.00121.00
$ 19.00÷ 1
$ 19.00
BASH GASH
Since GASH requires ½ the labor time, and since labor capacity is a constraint,and since GASH’s relative contribution per labor hour is greater, as much productionas possible should be devoted to GASH.

120
Gee-Whiz ShoesStandard Allowedfor Actual Output
Rate Efficiency
AQ × AC AQ × SC SQ × SC
DLH
9,500 × $18.20$172,900
(20,000)(0.5) × $18.00650 × $295$180,000
9,500 × $18.00$171,000
$1,900 U $9,000 F
$7,100 F
DIRECT LABOR

121
Georgetown, Inc.
Georgetown, Inc.Absorption Costing I/S
For the Y/E Dec. 31, 2005
Georgetown, Inc.Absorption Costing I/S
For the Y/E Dec. 31, 2006
Rev $ 4,000 = 2,000 units × $2.00
- CoGS (1,400) = VC 2,000 units × $0.70 per unit (1,000) = FC 2,000 units × $0.50 per unit
GM $ 1,600
- S&A (1,000) = 2,000 units sold × $0.50 per unit (300) = Fixed
NI $ 300
Rev $ 4,800 = 2,400 units × $2.00
- CoGS (1,680) = VC 2,400 units × $0.70 per unit (1,200) = FC 2,400 units × $0.50 per unit
GM $ 1,920
- S&A (1,200) = 2,400 units sold × $0.50 per unit (300) = Fixed
NI $ 420
Fixed cost of production per unit:$1,100 / 2,200 = $0.50 per unit

122
Georgetown, Inc. (p. 2)
Georgetown, Inc.Variable Costing I/S
For the Y/E Dec. 31, 2005
Georgetown, Inc.Variable Costing I/S
For the Y/E Dec. 31, 2006
Rev $ 4,000 = 2,000 units × $2.00
- VC (1,400) = CoGS (2,000 units × $0.70) (1,000) = S&A (2,000 units × $0.50)
CM $ 1,600
- FC (1,100) = MOH (300) = S&A
NI $200
Rev $ 4,800 = 2,400 units × $2.00
- VC (1,680) = CoGS (2,400 units × $0.70) (1,200) = S&A (2,400 units × $0.50)
CM $ 1,920
- FC (1,100) = MOH (300) = S&A
NI $520
Production > SalesAbs. NI is higher!
Sales > ProductionVC NI is higher!
The difference in NI 2005:
Units mfg. - units sold× FOH per unitDifference in NI
The difference in NI 2006:
Units mfg. - units sold× FOH per unitDifference in NI
200 $0.50
$ 100
200 $0.50
$ 100

123123
Gilligan’s Boat Rentals
New boatDeduct current disposal priceRebuild of existing boatMargin
$92,0009,000
$ 83,000
$ -
$ 75,000$ 75,000
Replace Rebuild
The difference is in favor of rebuilding by $8,000 ($83,000 - $75,000).The $90,000 purchase cost is irrelevant.

124124
Global, Inc.
* This particular item may cause some debate. Hopefully, advertising results in more demand forproducts and services by customers. So advertising costs are correlated with the amount ofproducts and services provided. However, note the direction of causality. Advertising causes anincrease in the amount of goods and services provided, but an increase in the amount of goodsand services demanded by customers does not necessarily result in a proportional increase inadvertising costs. Hence, advertising costs are fixed in the classical sense that the total amountspent on advertising is not proportional to what the unit sales turn out to be.
1. Small glass plates used for lab tests in a hospital
2. Straight-line depreciation of a building
3. Top-management salaries
4. Electrical costs of running machines
5. Advertising of products and services*
6. Batteries used in manufacturing trucks7. Commissions to salespersons
8. Insurance on a dentist’s office
9. Leather used in manufacturing footballs
10. Rent on a medical center
Product Period
X
X
X
X
X
X
X
X
X
X
Cost Behavior
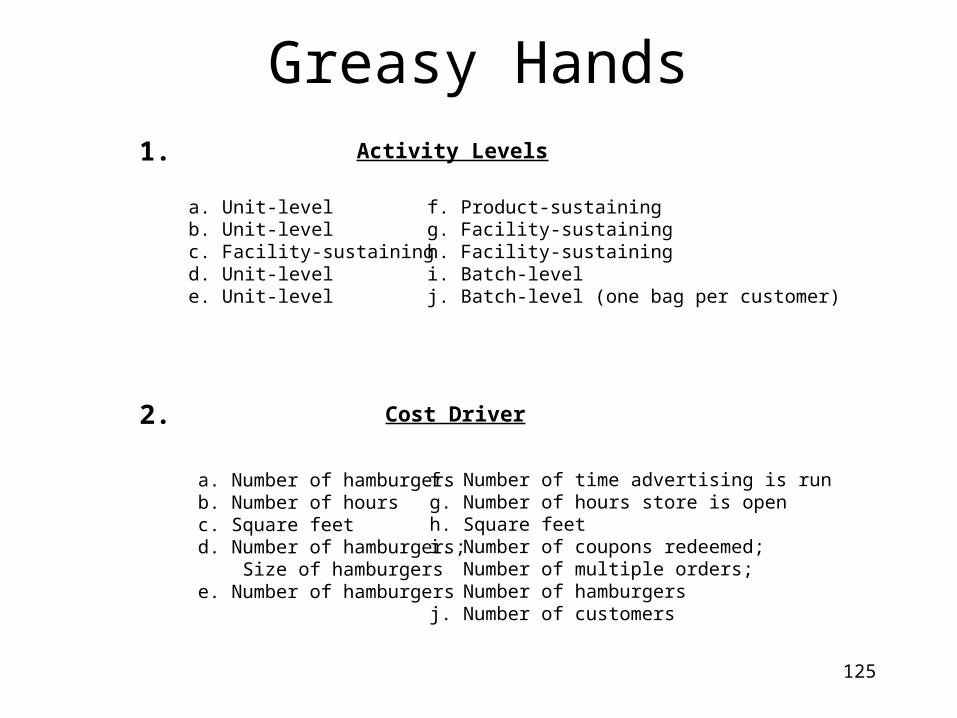
125
Greasy Hands1. Activity Levels
a. Unit-levelb. Unit-levelc. Facility-sustainingd. Unit-levele. Unit-level
f. Product-sustainingg. Facility-sustainingh. Facility-sustainingi. Batch-levelj. Batch-level (one bag per customer)
2. Cost Driver
a. Number of hamburgersb. Number of hoursc. Square feetd. Number of hamburgers; Size of hamburgerse. Number of hamburgers
f. Number of time advertising is rung. Number of hours store is openh. Square feeti. Number of coupons redeemed; Number of multiple orders; Number of hamburgersj. Number of customers

126126
Green Soda
1.
MS ($) = Actual Revenue - BE Revenue
MS ($) = $900,000 - $791,500 MS ($) = $108,500
Act. Rev. = (SP) (Units Sold)
Act. Rev. = ($4.50) (200,000)
Act. Rev = $900,000
BE (units) = FC + NI
CMU=
$316,600
$1.80
= 175,889
BE ($) = = $791,500
MS ($) = $108,500
FC + NI
CMU
=$316,600
0.40

127127
Green Soda (p. 2)
Operating leverage = CM / NI
NI = $360,000 – 316,600
NI = $43,400
CM = (SPU – VCU)(Units Sold)
CM = ($4.50 - $2.70)(200,000)
CM = $360,000
Operating leverage = $360,000 / $43,400
3.
Proof using income statement approach:
Sales ($4.50 * 200,000 units * 130%) $1,170,000Var. Costs ($2.70 * 200,000 units * 130%) (702,000)CM $ 468,000Fixed Costs (316,600)Net Income $ 151,400
(New NI – Old NI) ÷ Old NI = Increase in NI($151,400 - $43,400) ÷ $43,400 = 249%
2.
8.29 * 30% = 249%
Operating leverage ratio * Increase in Sales = Increase in NI
Operating leverage = 8.29
NI = CM – FC

128128
Green Soda (p. 3)
4. BE (units) FC + NI
CMU=
($316,600 + $41,200)
$1.80198,778
BE ($) $894,500
7.37Operating leverage =
FC + NI
CMR=
($316,600 + $41,200)
0.40
Sales ($4.50 * 200,000 * 115%)
VC ($2.70 * 200,000 * 115%)
CM
FC ($316,600 + $41,200)
NI
$1,035,000
(621,000)
$ 414,000
(357,800)
$ 56,200
Income Statement:
CM
NI
$414,000
$56,200
=
=
=
=
= =

129
Grover Manufacturing
Grover ManufacturingAbsorption Costing I/S
For the Y/E Dec. 31, 2003
Grover ManufacturingAbsorption Costing I/S
For the Y/E Dec. 31, 2004
Rev. $ 82,500 = 1,100 units × $75
- CoGS (38,500) = VC 1,100 units × $35 per unit (19,800) = FC 1,100 units × $18 per unit (3,600) = Underapplied MOH (200 @ $53)
GM $ 20,600
- S&A (11,000) = 1,100 units sold × $10 per unit (4,000) = Fixed
NI $ 5,600
Rev $ 150,000 = 2,000 units × $75
- CoGS (70,000) = VC 2,000 units × $35 per unit (36,000) = FC 2,000 units × $18 per unit (-0-) = Underapplied MOH
GM $ 44,000
- S&A (20,000) = 2,000 units sold × $10 per unit (4,000) = Fixed
NI $ 20,000
Fixed cost of production per unit:$27,000 / 1,500 = $18 FC per unit$18 FC + 35 VC = $53 TC per unit
Normal volume is 1,500 units of production.Underapplied MOH = 1,500 normal volume – 1,300 actual production = 200 units
Normal volume is 1,500 units of production.Underapplied MOH = 1,500 normal volume – 1,500 actual production = 0 units

130
Grover Mfg. (p. 2)
Grover ManufacturingVariable Costing I/S
For the Y/E Dec. 31, 2003
Grover ManufacturingVariable Costing I/S
For the Y/E Dec. 31, 2004
Rev $ 82,500 = 1,100 units × $75
- VC (38,500) = CoGS (1,100 units × $35) (11,000) = S&A (1,100 units × $10)
CM $ 33,000
- FC (27,000) = MOH (4,000) = S&A
NI $2,000
Rev $ 150,000 = 2,000 units × $75
- VC (70,000) = CoGS (2,000 units × $35) (20,000) = S&A (2,000 units × $10)
CM $ 60,000
- FC (27,000) = MOH (4,000) = S&A
NI $29,000
Production > SalesAbs. NI is higher!
Sales > ProductionVC NI is higher!
The difference in NI 2003:
Units mfg. - units sold× FOH per unitDifference in NI
The difference in NI 2004:
Units mfg. - units sold× FOH per unitDifference in NI
200 $18
$ 3,600
500 $18
$ 9,000

131
Halo Products Company
PDOR = Estimated MOH
Estimated Activity=
$200,000
32,000 DLH
=
$6.25 per DLH
Applied MOH = Actual Activity × PDOR 36,400 DLH × $6.25 $227,500=
=1.
2.
3. MOH
$256,200 $227,000
$28,700
$28,700
- 0 -
to COGS
Underapplied
4.Actual OH
per DL
Actual MOH
Actual Activity=
$256,200
36,400 DLH= $7.04 per DLH=

132
Hannibal Company
DM
$23,400
Purch 160,000
$33,400
$150,000
$100,000 $100,000
DL
$20,000
21,000
30,000
5,978
$76,978
$76,978
$6,520
150,000
100,000
76,978
$7,498
$326,000
WIP
$40,000
326,000
$57,050
$308,950
FG
$308,950$308,950
COGS
I/S
$308,950
$55,000
38,000
61,000
$600,000
$137,050 OI
MOH
- 0 -
- 0 -
- 0 -
COGS
ACOGS
COGM
PeriodCosts
Inventory Accounts
Product Costs
(BI + In = EI + Out)

133133
Hassle Company
Relevant costs to make
$ .60.40.10
$1.10
Relevant costs to buy
Selling price $1.25
Total relevant cots $1.25
Direct materialDirect laborVariable OHTotal relevant costs
It is $.15 ($1.25 - $1.10) cheaper to make the handles.Therefore, Hassle should make the handles.
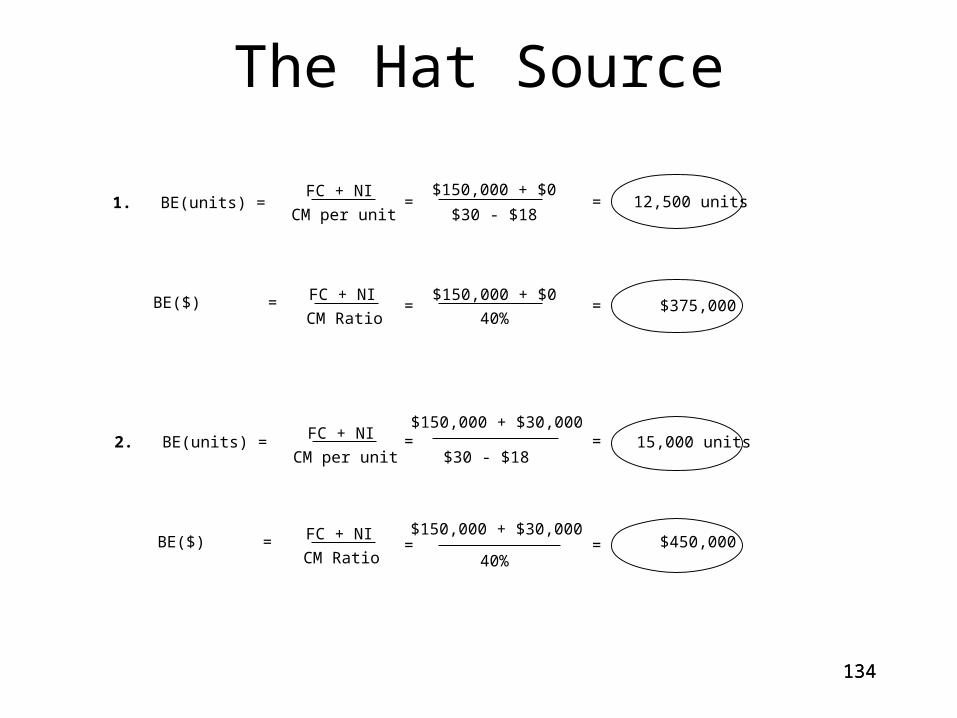
134134
The Hat Source
1. BE(units) =CM per unit
FC + NI=
$150,000 + $0
$30 - $18 12,500 units
BE($) =CM Ratio
FC + NI=
$150,000 + $0
40% $375,000
2. BE(units) =CM per unit
FC + NI =$30 - $18
15,000 units
BE($) =CM Ratio
FC + NI=
$150,000 + $30,000
40% $450,000
$150,000 + $30,000
=
=
=
=

135135
HBM Industries
1. Activity Levels
a. Product-sustainingb. Product-sustainingc. Product-sustainingd. Product-sustaininge. Batch-level
f. Batch-levelg. Unit-levelh. Facility-sustainingi. Product-sustainingj. Facility-sustaining
2. Cost Drivers
a. Number of productsb. Number of productsc. Number of products d. Number of productse. Number of batches or setupsf. Number of batchesg. Number of units
h. Purchase costs; Replacement costs; Book valuesi. Number of purchase orders; Number of products; Number of suppliersj. Square feet
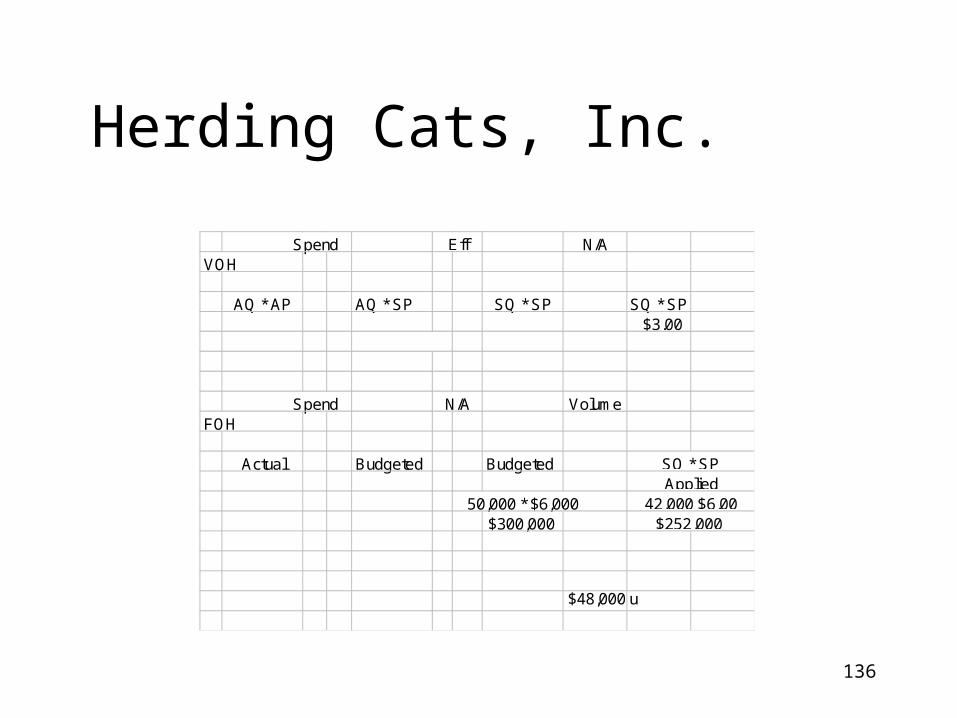
136
Herding Cats, Inc.
Spend N/AVOH
AQ * AP AQ * SP SQ * SP SQ * SP$3.00
Spend VolumeFOH
Actual Budgeted Budgeted
50,000 * $6,000$300,000
42,000 $6.00$252,000
N/A
SQ * SPApplied
Eff
$48,000 u

137
VOH
Spending Efficiency
AQ x AP
$131,000
AQ x SP
121,000 x $.50
$60,500
$3,000U
SQ x SP
115,000 x $.50
$57,500
N/A
SQ x SP
115,000 x $.50
FOH
Actual
Budgeted
$110,000
Budgeted
$110,000
Applied
SQ x SP ($1)
115,000
Spending N/A Volume
$5,000 F
TOTAL
$178,500 $179,500
$3,000U
$172,500
Spending Efficiency Volume
$5,000 F$8000 U
Herry Company

138
Hollandaise CompanyThe cost of a single unit of product under the two costingmethods would be:
Absorption VariableCosting Costing
DM, DL & Vbl MOH $5.00 $5.00Fixed MOH ($15,000/5,000 units) $3.00 - Total cost per unit $8.00 $5.00
Absorption costing Year 1 Year 2 Year 3 Total
Sales (@ $15.00) $75,000 $60,000 $90,000 $225,000Less COGS: Beg. Inv. (@ $8.00) 0 0 8,000 0 COGM (@ $8.00) 40,000 40,000 40,000 120,000 CGAS 40,000 40,000 48,000 120,000 End. Inv. (@ $8.00) 0 8,000 0 0 COGS 40,000 32,000 48,000 120,000Gross Margin 35,000 28,000 42,000 105,000Less S&A 26,000 25,000 27,000 78,000Net Income $9,000 $3,000 $15,000 $27,000

139
Hollandaise Co. (p. 2)Variable costing Year 1 Year 2 Year 3 Total
Sales (@ $15.00) $75,000 $60,000 $90,000 $225,000Less vbl. exp: Vbl COGS (@ $5.00) 25,000 20,000 30,000 75,000 Vbl S&A (@ $1.00) 5,000 4,000 6,000 15,000Total vbl. exp. 30,000 24,000 36,000 90,000Contribution margin 45,000 36,000 54,000 135,000Less fixed exp: MOH 15,000 15,000 15,000 45,000 S&A exp. 21,000 21,000 21,000 63,000Total fixed exp. 36,000 36,000 36,000 108,000Net income $9,000 $0 $18,000 $27,000
A reconciliation of the net income figures for the two methodsover the three year period follows:
Year 1 Year 2 Year 3
Variable costing NI $9,000 $0 $18,000Add: FOH cost deferred in inv. under absorp. costing (1,000 units x $3.00) 3,000Less: FOH cost released from inv. under absorption costing (1,000 x $3.00) (3,000)Absorption costing NI $9,000 $3,000 $15,000

140140
Holman Company1. Predetermined
overhead rate= Estimated total manufacturing overhead cost
Estimated total amount of the allocation base
= $170,00071,000 direct labor-hours
= $4.00 per direct labor-hour
2. Applied Overhead = Direct labor-hours × Predetermined overhead rate
75,000 DL hours × $4.00
= $300,000
=

141141
Holman Company (p. 2)
UtilitiesDepreciationInsuranceIndirect laborIndirect materialSalary
$ 75,40058,00025,00054,60053,00055,000
3.
$21,000 underapplied
Manufacturing Overhead
$300,000
$21,000Balance
Applied overheadfrom part 2

142
Home Quality Products
Prevention Costs: b. Seminar costs for “Vendor Day”.
Appraisal Costs: c. Costs of conformance tests at Charlotte plant. e. Costs of inspection tests at the Raleigh packaging plant.
Internal Failure Costs: a. Labor and materials costs of reworking a batch of steam-iron handles.
External Failure Costs: d. Replacement cost of 1,000 steam-irons sold in the Pittsburgh are.
The cost of customer ill-will created by the sale of defective products has two components:
(a) The volume of future lost sales,(b) The contribution margin on lost sales.
Customer surveys and interviews with distributors and retailers can provide a way to estimate (a);(b) can be estimated using internal accounting information.
1.
2.

143143
$35 - $20
$35
FC + NI ($30,000 * 12) + $510,000 CM ratio $35 - $20
$35
Actual Rev. – BE Rev.
$2,030,000 – ($70,000 x 12)
$2,030,000 – $840,000
$1,190,000
$864,000
$360,000 + $1,440,000
Howard’s Limited$35 – $20
FC + NICM per unit $35 – $20
FC
BE(units)
BE(units)
BE($)
BE($)
MS($)
MS Ratio
OI
2,000 units
$70,000
$2,030,000
120,000 units annually
$30,000
$30,000CM ratio
FC
$1,440,0001 – TR 1 – .4
10,000 units monthly
NIAT
=
=
=
=
=
=
=
=
=
= =
=
=
=
= =
=
=
=
=
$2,030,000 - $840,000
$2,030,00058.6%= =
Act. Rev. – BE Rev.
Act. Rev.
4.
3.
2.
1.CM per unit

144
Howdy Company
PDOR =
Estimated MOH
Estimated Activity=
$602,000
70,000 MH$8.60 per MH=
1. Department A
PDOR =
Estimated MOH
Estimated Activity=
$735,000
$420,000 of DL$1.75 per DL$=
Department B
=Applied MOH = Actual Activity × PDOR 110 MH × $8.60 $946=2.
Department A
=Applied MOH = Actual Activity × PDOR 680 DL$ × $1.75 $1,190=
Department A
$2,136 total applied MOH
DMDL
MOH
$470290946
$1,706
DMDL
MOH
332680
1,190$2,202
3.
$3,90850 units
$78.16 per unit=
Department B
Department B

145145
Howdy Company (p. 2)
MOH
(65,000 * $8.60)
559,000
$11,000
$570,000
$11,000
- 0 -
MOH
$750,000
$13,000
- 0 -
($436,000 * 1.75)
$763,000
$13,000
4.
overapplied
Department BDepartment A
To COGS
underapplied
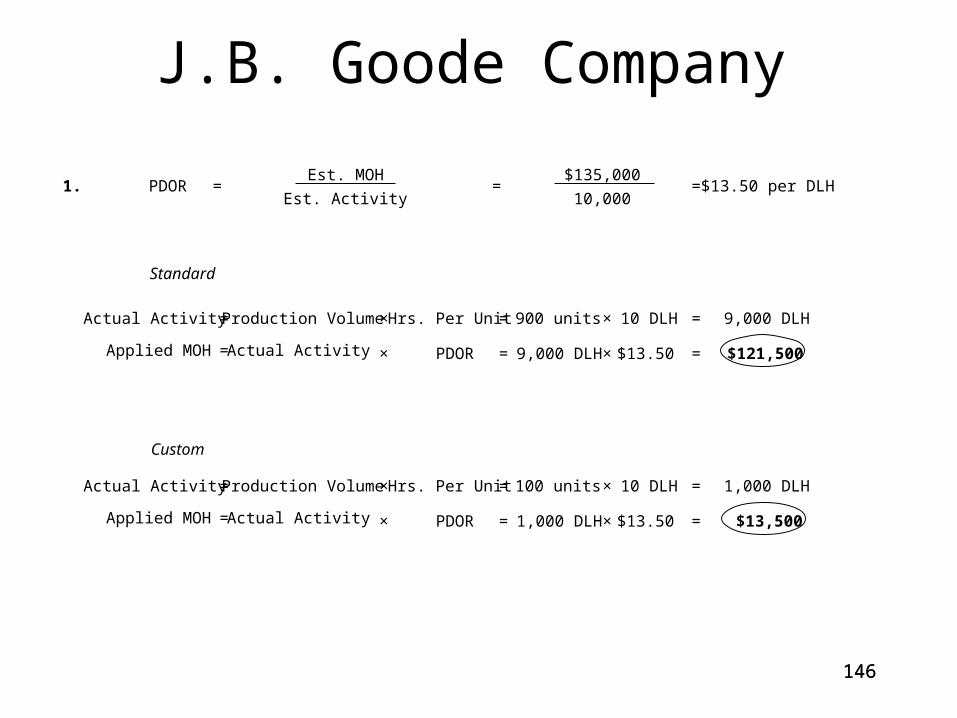
146146
J.B. Goode Company
PDOREst. MOH
Est. Activity
$135,000
10,000$13.50 per DLH= =1.
Applied MOH Actual Activity PDOR
900 units 10 DLH 9,000 DLH
$13.50 $121,500
Actual Activity Production Volume Hrs. Per Unit
9,000 DLH
×= = ×
×=×=
Standard
=
=
=
Applied MOH Actual Activity PDOR
100 units 10 DLH 1,000 DLH
$13.50 $13,500
Actual Activity Production Volume Hrs. Per Unit
1,000 DLH
×= = ×
×=×=
Custom
=
=

147147
J.B. Goode Co. (p. 2)
Depr.Maint.Purch.Insp.IDMSuper.Supplies
3,0009,0001,500 400 900 400 900
×××××××
$10.00$ 1.50$11.00$12.00$15.00$28.00$ 3.00
=======
$30,000 13,500 16,500 4,800 13,500 11,200 2,700$92,200 Applied MOH ÷ 900 Guitars = $102.45 each
Depr.Maint.Purch.Insp.IDMSuper.Supplies
1,0001,000 500 600 100 600 100
×××××××
$10.00$ 1.50$11.00$12.00$15.00$28.00$ 3.00
=======
$10,000 1,500 5,500 7,200 1,500 16,800 300$42,800 Applied MOH ÷ 100 Guitars = $428 each
2. Standard
Custom
Applied MOHAct. Activity PDOR× =
Applied MOHAct. Activity PDOR× =

148148
J.B. Goode Co. (p. 3)
CustomOLD WAY
CustomNEW WAY
DMDLMOHTOTAL
DMDLMOHTOTAL
$375240
135$750
$ 375240
428$1,043
No, the $1,000 revenue is not covering the true cost of production.
The single biggest reason for the higher overhead costis the supervision required for the custom guitars.
3.
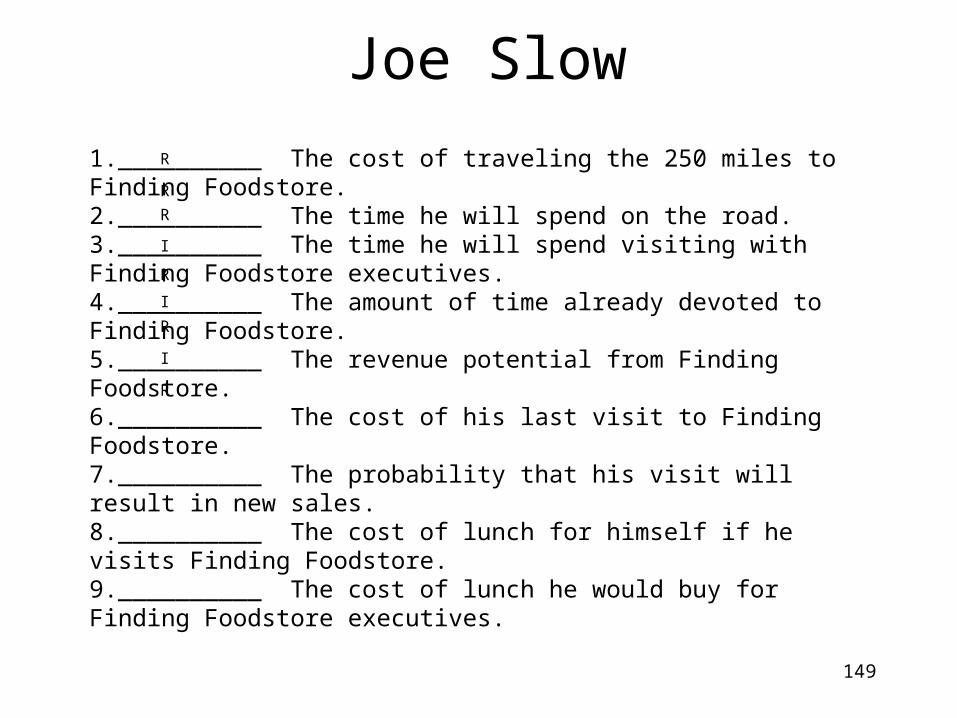
149
Joe Slow
R
R
R
I
R
I
R
I
R
1.__________ The cost of traveling the 250 miles to Finding Foodstore.2.__________ The time he will spend on the road.3.__________ The time he will spend visiting with Finding Foodstore executives.4.__________ The amount of time already devoted to Finding Foodstore.5.__________ The revenue potential from Finding Foodstore.6.__________ The cost of his last visit to Finding Foodstore.7.__________ The probability that his visit will result in new sales.8.__________ The cost of lunch for himself if he visits Finding Foodstore.9.__________ The cost of lunch he would buy for Finding Foodstore executives.

150150
The John Company
WIP Units
5,000
40,000
10,000
35,000
OutBI
IN
EI
DM
100%
100%
CC
60%
40%
WIP - $ (Wtd. Avg.)
DM $ 5,050
CC 3,270
DM 44,000
CC 48,600
DM $10,900
CC 5,320
$16,220
35,000 × $2.42
= $84,700
= 10,000 × $1.09
= 4,000 × $1.33
E.U.
DM CC
35,000
10,000
45,000
35,000
4,000
39,000
Costs to Account For
$5,050
$44,000
$49,050
$3,270
$48,600
$51,870
BI
IN
Total
$/EU
$49,050 / 45,000 = $1.09
$ 2.42
OUT
EI: (DM) 10,000 × 100%
EI: (CC) 10,000 × 40%
E.U.
DM CC
DM CC
$51,870 / 39,000 = $1.33
WEIGHTED AVERAGE METHOD
BI Out
IN
EI
1.
1.

151151
The John Co. (p.2)
WIP Units
5,000
40,000
10,000
35,000Out
BI
IN
EI
DM
100%
100%
CC
60%
40%
WIP - $ (FIFO)
DM $ 5,050
CC 3,270
DM 44,000
CC 48,600
DM $11,000
CC 5,400
$16,400
$ 8,320 from BI
2,700 Finished CC 5,000×40%×$1.35
73,500 S&F 30,000 × $2.45
$84,520
= 10,000 × 100% × $1.10
= 10,000 × 40% × $1.35
E.U.
DM CC
- 0 -
30,000
10,000
40,000
2,000
30,000
4,000
36,000
Costs per EU
DM CC
$1.01
$1.09
$ per EU
BI: (DM) 5,000× 0%
BI: (CC) 5,000×40%
Start & Finish
EI: (DM) 10,000×100%
EI: (CC) 10,000× 40%
E.U.
$5,050 DM ÷ (5,000×100%)
$3,270 CC ÷ (5,000× 60%)
Total
$2.10
$1.10
$1.35
$ per EU
$44,000 DM ÷ 40,000 E.U.
$48,600 CC ÷ 36,000 E.U. $2.45
$100,920 Costs to Account For
BI Out
IN
EI
BI
IN
FIFO METHOD
2.
2.

152152
Johnson County Senior Services
1.
No, the housekeeping program should not be discontinued. It is actually generating a positive programsegment margin and is, of course, providing a valuable service to seniors.
Contribution margin lost if the housekeeping program is droppedFixed costs that could be avoided: Liability insurance Program administrator’s salaryDecrease in net operating income for the organization as a whole
$(80,000)
52,000 $(28,000)
$15,00037,000
Depreciation on the van is a sunk cost and the van has no salvage value since it would be donated toanother organization. The general administrative overhead is allocated and none of it would be avoided if theprogram were dropped; thus it is not relevant to the decision.
Relevant revenues and costs of the housekeeping program:

153153
Johnson County (p. 2)2.
To give the administrator of the entire organization a clearer picture of the financial viability of each of theorganization’s programs, the general administrative overhead should not be allocated. It is a common cost thatshould be deducted from the total program segment margin. Following the format for a segmented incomestatement, a better income statement would be:
RevenuesLess variable expensesContribution marginLess traceable fixed expenses: Depreciation Liability insurance Program administrators’ salariesTotal traceable fixed expensesProgram segment marginsGeneral admin overheadNet operating income (loss)
$900,000490,000
$410,000
$ 68,00042,000
115,000225,000185,000180,000$ 5,000
$260,000120,000
$140,000
$ 8,00020,00040,00068,000
$72,000
$400,000210,000
$190,000
$ 40,0007,000
38,00085,000
$105,000
$240,000160,000
$ 80,000
$20,00015,00037,00072,000$ 8,000
TotalHome
NursingMeals onWheels
House-keeping

154154
Jolly Roger Candies
CM per unit
FC + NI=
$400 + $300
$1= 700 units
BE(units) =CM per unit
FC + NI=
$400 + $0
$1= 400 units
400 units × 120% = 480 units (volume 20% above breakeven volume)
Rev (480 units × $4)- VC (480 units × $3) CM- FC NI
$1,920 1,440$ 480 400$ 80
NIBT = NIAT
1- TR=
$300
1 – 40%= $500
BE(units) =CM per unit
FC + NI =$400 + $500
$4.00 - $3.50= 1,800 units
BE(units) =1.
2.
3.

155155
Jude Law & Associates
Purchasing the new system will cause the following to occur:
$180,000 Labor cost savings on old system ($36,000 × 5 years) 10,000 Sale of old system (76,000) Cost of new system (90,000) Labor cost of new system ($18,000 × 5 years) 500 Higher residual value of new system
$24,500 Savings by purchasing the new system
Jude Law will save $24,500 by purchasing the new system.Therefore, the system should be purchased.
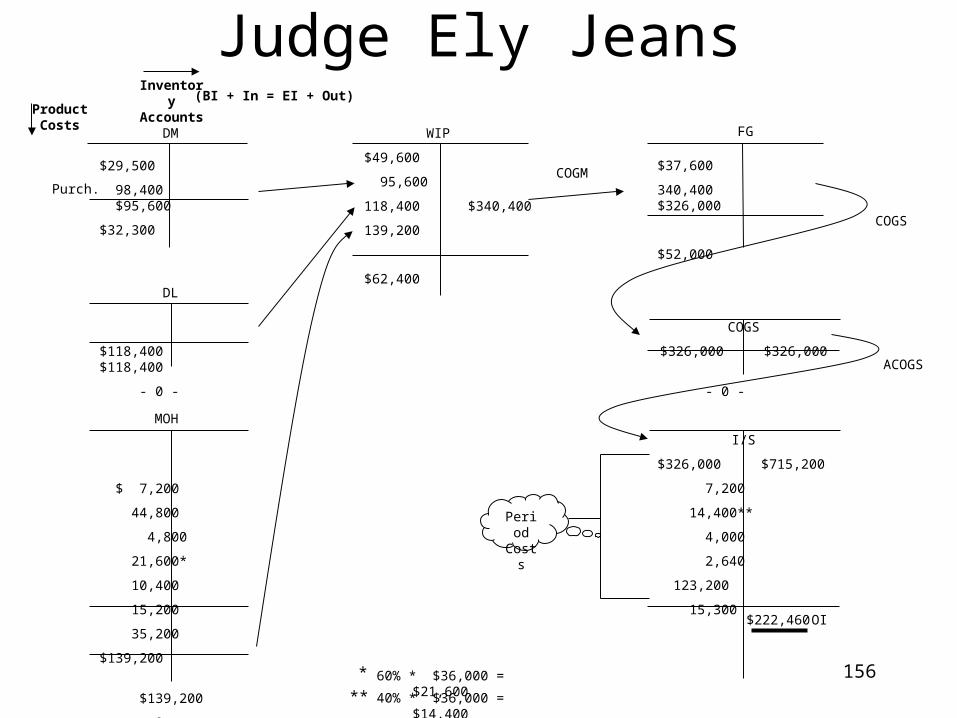
156
Judge Ely Jeans
$29,500
98,400 $95,600
$32,300
$118,400 $118,400
- 0 -
$ 7,200
44,800
4,800
21,600*
10,400
15,200
35,200
$139,200
$139,200
- 0 -
$49,600
95,600
118,400 $340,400
139,200
$62,400
$37,600
340,400 $326,000
$52,000
COGS
$326,000 $326,000
- 0 -
I/S
$326,000 $715,200
7,200
14,400**
4,000
2,640
123,200
15,300
OI
40% * $36,000 = $14,400
COGS
ACOGS
COGM
FG
PeriodCosts
60% * $36,000 = $21,600*
**
$222,460
WIPDM
DL
MOH
Purch.
Inventory Accounts
Product Costs
(BI + In = EI + Out)
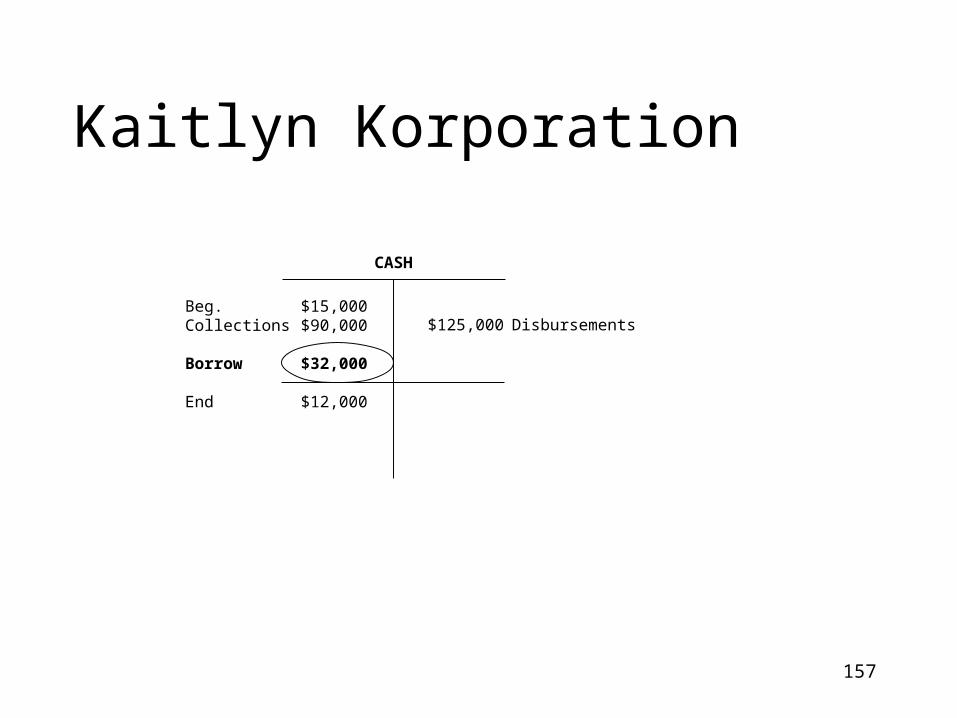
157
Kaitlyn Korporation
CASH
$15,000$90,000
$32,000
$12,000
$125,000Beg.Collections
Borrow
End
Disbursements

158
Kennel Street Company
Price Quantity
AQ * AP AQ * SP SQ * SP1,600 * AP
1,600 * $3.60$5,520 $5,760
AQ * SP SQ * SP * $3.60 1,450 * $3.60
$240 F
AP = $3.45
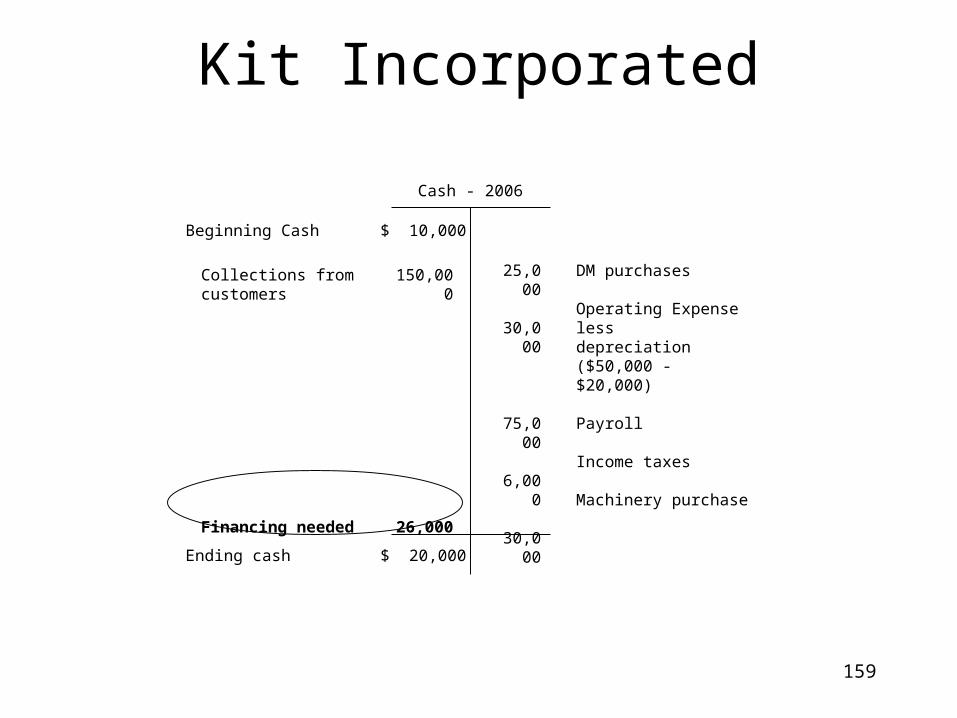
159
Kit Incorporated
Cash - 2006
$ 10,000
$ 20,000
150,000
26,000
Beginning Cash
Ending cash
Collections from customers
Financing needed
DM purchases
Operating Expense lessdepreciation($50,000 - $20,000)
Payroll
Income taxes
Machinery purchase
25,000
30,000
75,000
6,000
30,000
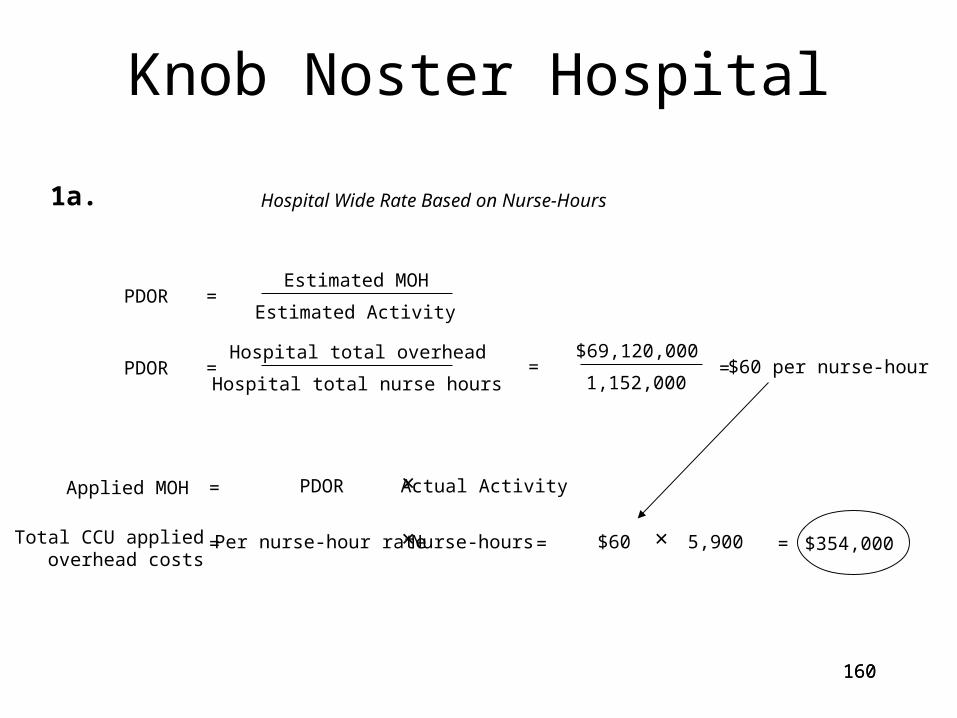
160160
Knob Noster Hospital
1a. Hospital Wide Rate Based on Nurse-Hours
PDORHospital total overhead
Hospital total nurse hours=
$69,120,000
1,152,000$60 per nurse-hour
Total CCU applied overhead costs
= Per nurse-hour rate × Nurse-hours = $60 × 5,900 = $354,000
==
PDOREstimated MOH
Estimated Activity=
Applied MOH = PDOR × Actual Activity
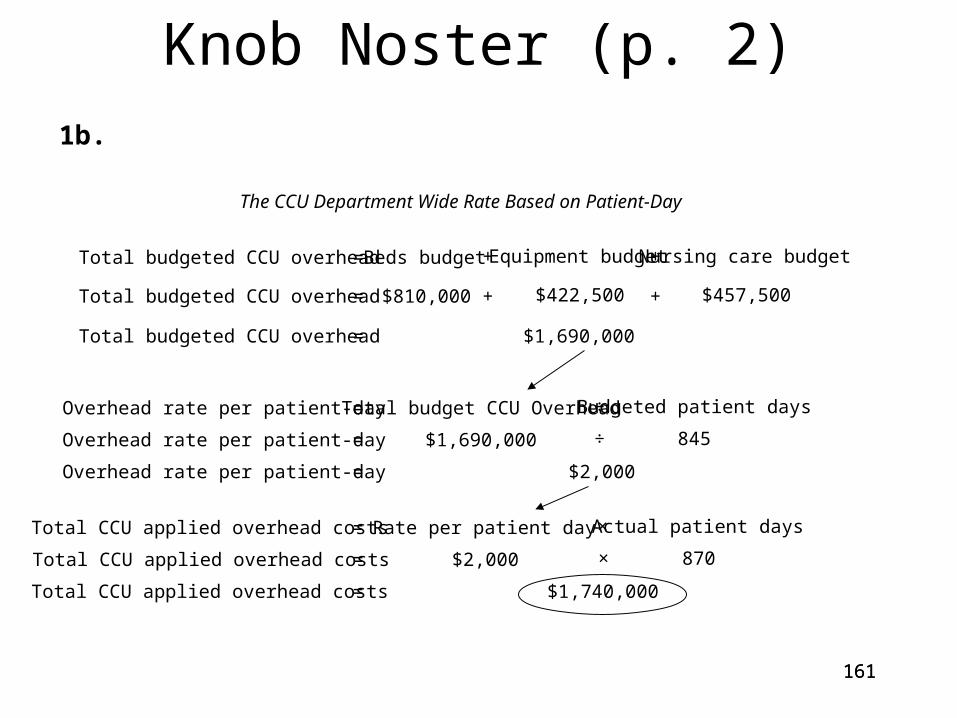
161161
Knob Noster (p. 2)1b.
The CCU Department Wide Rate Based on Patient-Day
Total budgeted CCU overhead = Beds budget Equipment budget Nursing care budget
Total budgeted CCU overhead = $810,000 $422,500 $457,500
Total budgeted CCU overhead = $1,690,000
Overhead rate per patient-day = Total budget CCU Overhead Budgeted patient days÷
Overhead rate per patient-day = $1,690,000 845÷
Overhead rate per patient-day = $2,000
Total CCU applied overhead costs = Rate per patient day Actual patient days×
Total CCU applied overhead costs = $2,000 870×
Total CCU applied overhead costs = $1,740,000
+
++
+

162162
Knob Noster (p. 3)1c.
Activity Cost Driver Rates
BudgetedCost Pool
BudgetedCost
BudgetedActivity
BudgetedMOH Rate
ActualActivity
AppliedOverhead
Beds $810,000 900 $900.00 900 $ 810,000÷ = × =
Equipment 422,500 845 500.00 870 435,000÷ = × =
Personnel 457,500 6,000 76.25 5,900 449,875÷ = × =
Total applied manufacturing overhead costs $1,694,875
2.
The first method uses a hospital wide overhead rate, which likely bears no relationship with the overheadactivities performed in the critical care unit (CCU). The second method uses the patient-day overhead ratefor the CCU department. This is an improvement over the first method. But a single patient-day cost drivermay not have direct relationships with some of the activities performed in the CCU department. The thirdmethod is the preferred method because it uses a cost driver for each of the cost pools that reflects the resourcesconsumed by activities of the cost pool.

163
KSU Company
Rate Efficiency
AQ × AC AQ × SC SQ × SC40,000 × $25 40,000 × $24 42,000 × $24 $1,000,000 $960,000 $1,008,000
$40,000 U $48,000 F
$8,000 F
Std. Allowed forActual Output(in units)
1.
2.

164164
Landis Playhouses
1. NIBT NIAT
1 – TR
$495,014
1 – 35%
BE(units) CM per unit
FC + NI $280,420 + $761,560
$1,200 869 units
CM per unit = $3,000 – $1,200 – $400 – $150 – $50
2. After-tax equivalent of 20% increase:
20% ÷ (1 – .35) = 30.77%
VC + FC + NI TR = .6 TR + $280,420 + .3077 TR.0923 TR = $280,420
TR = $3,038,137
(Rounded)
CM per unit = Selling Price – all variable costs
$1,200CM per unit =
$761,560
Let TR = the level of revenue that generates a pretax return of 30.77%
= = =
= = =
=TR
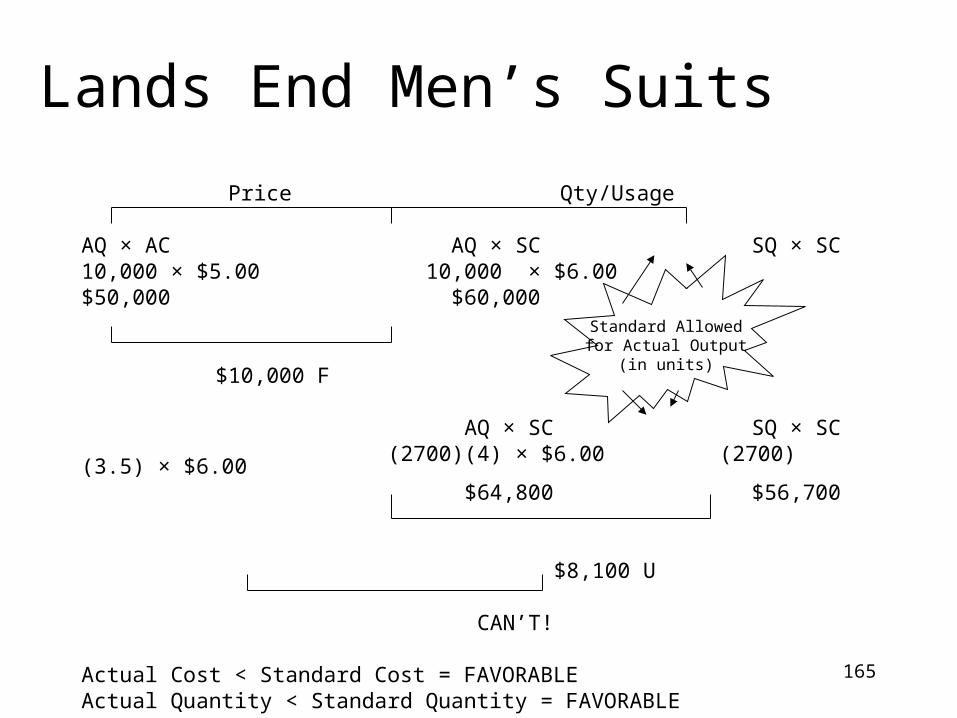
165
Lands End Men’s Suits Price Qty/Usage
AQ × AC AQ × SC SQ × SC10,000 × $5.00 10,000 × $6.00$50,000 $60,000
$10,000 F
AQ × SC SQ × SC (2700)(4) × $6.00 (2700)(3.5) × $6.00 $64,800 $56,700
$8,100 U
CAN’T!
Actual Cost < Standard Cost = FAVORABLEActual Quantity < Standard Quantity = FAVORABLE
Standard Allowedfor Actual Output
(in units)

166
Mango Motors
Absorption Costing
Income Statement
For the Year Ended Dec. 31, 1996
Rev. $810,000
VC (540,000)
FC (60,000)
GM $210,000
VS&A (67,500)
FS&A (50,000)
OI $92,500
Variable Costing
Income Statement
For the year Ended Dec. 31, 1996
Rev. $810,000
VC (540,000)
VS&A (67,500)
CM $202,500
FC (60,000)
FS&A (50,000)
OI $92,500
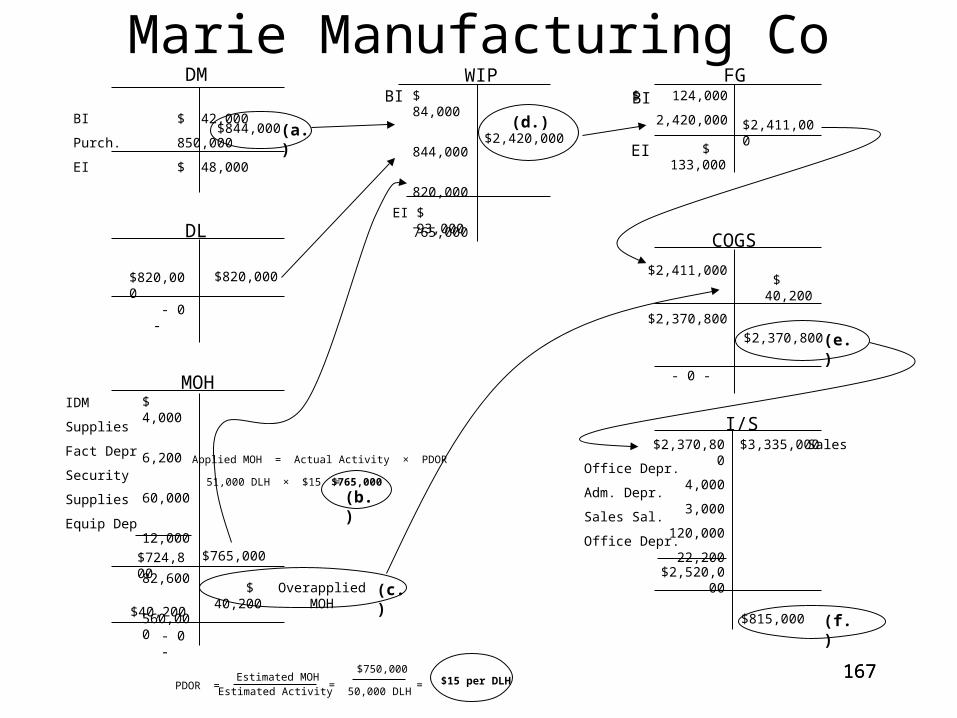
167167
Marie Manufacturing CoBI $ 42,000
Purch. 850,000
EI $ 48,000
DM
(a.)$844,000
$820,000
DL
$820,000
MOHIDM
Supplies
Fact Depr
Security
Supplies
Equip Dep
$ 4,000
6,200
60,000
12,000
82,600
560,000
$765,000$724,800
Overapplied MOH
$40,200
$ 40,200
WIPBI $ 84,000
844,000
820,000
765,000
$ 93,000EI
$2,420,000(d.)
FG$ 124,000
2,420,000
BI
$2,411,000
$ 133,000EI
COGS
$2,411,000
$2,370,800
(e.)$2,370,800
- 0 -
I/S
Office Depr.
Adm. Depr.
Sales Sal.
Office Depr.
$3,335,000 Sales$2,370,800
4,000
3,000
120,000
22,200
$2,520,000
$815,000 (f.)
- 0 -
- 0 -
PDOR = Estimated MOH
Estimated Activity=
$750,000
50,000 DLH= $15 per DLH
Applied MOH = Actual Activity × PDOR
51,000 DLH × $15 = $765,000
(b.)
(c.)
$ 40,200
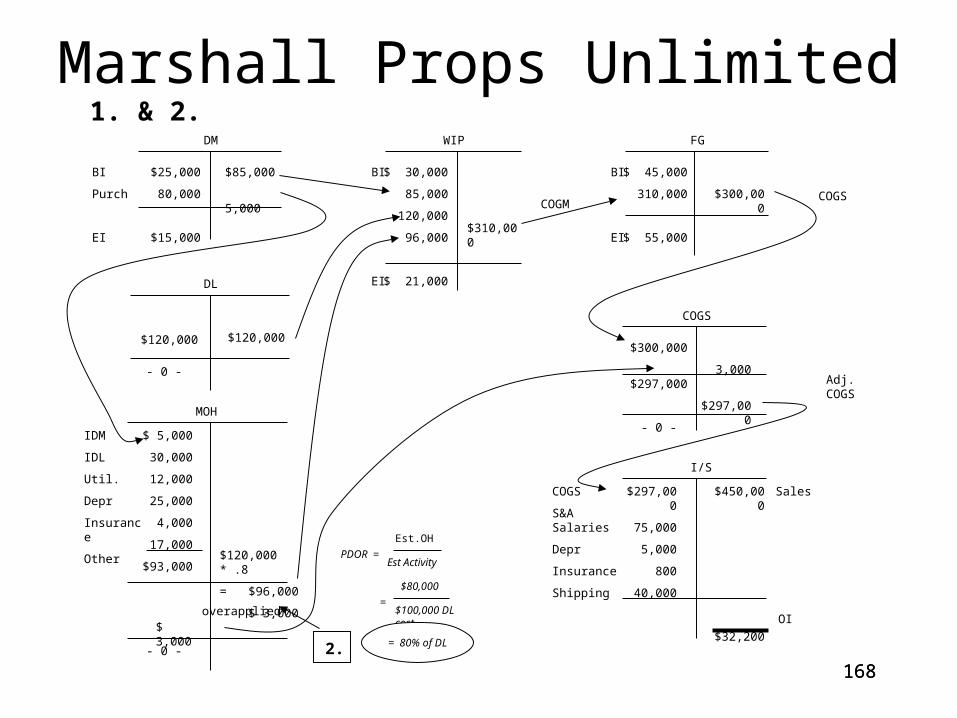
168168
Marshall Props Unlimited
$25,000
80,000
$15,000
$85,000
5,000
DM
BI
Purch
EI
$ 30,000
85,000
120,000
96,000
$ 21,000
$310,000
BI
EI
WIP
$ 45,000
310,000
$ 55,000
$300,000
BI
EI
FG
$120,000 $120,000
DL
MOH
$ 5,000
30,000
12,000
25,000
4,000
17,000
$93,000$120,000 * .8
= $96,000
$ 3,000
IDM
IDL
Util.
Depr
Insurance
Other
COGS
I/S
$297,000
75,000
5,000
800
40,000
$450,000
$32,200
COGS
S&A Salaries
Depr
Insurance
Shipping
Sales
OI
Est.OH
Est Activity
$80,000
$100,000 DL cost
= 80% of DL
3,000
$297,000
$ 3,000
$300,000
$297,000 Adj. COGS
PDOR =
=
COGS
1. & 2.
overapplied
COGM
2.
- 0 -
- 0 -
- 0 -

169169
Marshall Props (p. 2)Marshall Props Unlimited
Schedule of Cost of Goods Manufactured
For the Year Ended December 31, 2006
Raw material:
Raw materials inventory, 1-1
Add: Purchases of raw materials
Total materials available
Deduct: Raw materials inventory, 12-31
Raw materials used in production
Less: Indirect Materials
Direct Labor
Manufacturing overhead:
Utilities......................................................................................
Indirect Labor..............................................................................
Indirect Materials..........................................................................
Depreciation.................................................................................
Other………..............................................................................
Insurance……………………………………………………..
Actual overhead costs
Add: Overapplied overhead
Manufacturing overhead applied to WIP
Total manufacturing costs
Add: Beginning work in process inventory
Deduct: Ending work in process inventory
Cost of Goods Manufactured
$ 25,000
80,000
$105,000
(15,000)
$ 90,000
(5,000)$ 85,000
120,000
$12,000
30,000
5,000
25,000
17,000
4,000
$93,000
3,000
96,000
$301,000
30,000
$331,000
(21,000)
$310,000
3.

170170
Marshall Props (p. 3)
Marshall Props Unlimited
Schedule of Cost of Goods Sold
For the year ended December 31, 2006
Finished goods inventory, 1-1
Add: Cost of goods manufactured
Goods available for sale
Less: Ending finished goods inventory
Cost of goods sold
Deduct: Overapplied overhead
Adjusted cost of goods sold
$45,000
310,000
355,000
(55,000)
$300,000
(3,000)
$297,000
3.
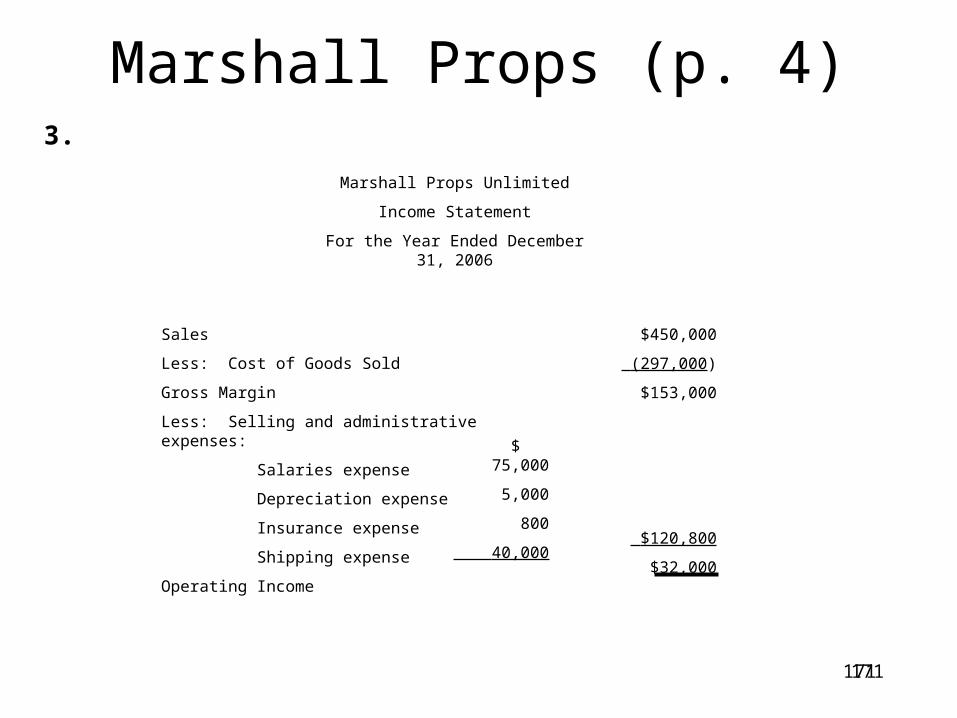
171171
Marshall Props (p. 4)
Marshall Props Unlimited
Income Statement
For the Year Ended December 31, 2006
Sales
Less: Cost of Goods Sold
Gross Margin
Less: Selling and administrative expenses:
Salaries expense
Depreciation expense
Insurance expense
Shipping expense
Operating Income
$450,000
(297,000)
$153,000
$120,800
$32,000
$ 75,000
5,000
800
40,000
3.

172
McKay Mills
Yarn 455 × $811.55 = $369,255.25
Fabric 420 × $811.55 = $340,851.00
Clothing 750 × $811.55 = $608,662.50
PDOR = Estimated MOH
Estimated Activity=
$1,335,000
1,645 DLH$811.55 per DLH=
(500 + 410 + 735)
Actual Activity × PDOR = Applied MOH2.
1.
MOH
$1,372,000.00 $1,318,768.75
$53,231.25
$53,231.25
- 0 -
to COGS
Underapplied
$1,318,768.75
172

173
Mesa Verde Company
MESA VERDE COMPANYBalance Sheet
December 31, 2005
AssetsCurrent Assets: Cash ………………………… Accounts receivable ………… Inventories ………………….. Total current assets …………Noncurrent assets …………….Total assets ……………………
Liabilities
Stockholders’ Equity
Current liabilities ..……………Noncurrent liabilities …………Total liabilities.………………..
Common stock ..………………Additional paid-in capital …….Retained earnings .……………Total stockholders’ equity ……Total liabilities and equity ……
$ 10,25046,000
86,250
$ 22,500 62,000
$142,500 280,000$422,500
$ 84,500
$150,00060,000
128,000 338,000
$422,500
Where? How?Note 8 [Plug]Note 5Note 4Note 7 [Plug](Given)Note 6 [Calc. = Total L + SE]
Note 9Note 10 [Plug]Note 3
(Given)(Given)Note 2Note 2[Calc.: Note 6]
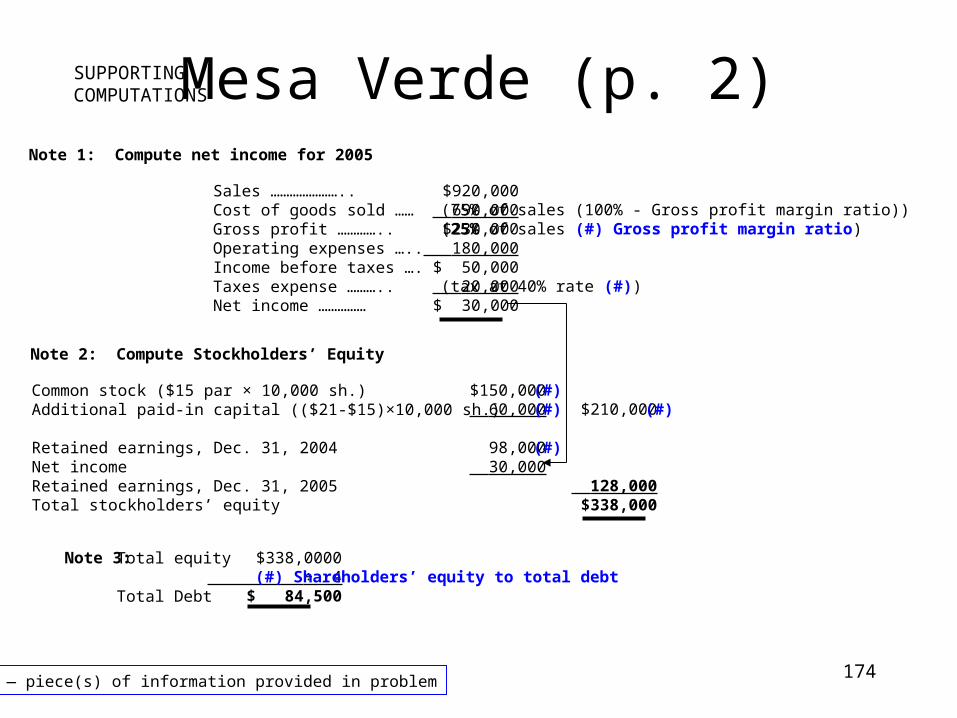
174
Mesa Verde (p. 2)SUPPORTINGCOMPUTATIONS
Note 1: Compute net income for 2005
Sales …………………..Cost of goods sold ……Gross profit …………..Operating expenses …..Income before taxes ….Taxes expense ………..Net income ……………
$920,000 690,000$230,000
180,000$ 50,000 20,000
$ 30,000
(75% of sales (100% - Gross profit margin ratio))(25% of sales (#) Gross profit margin ratio)
(tax at 40% rate (#))
Note 2: Compute Stockholders’ Equity
Common stock ($15 par × 10,000 sh.)Additional paid-in capital (($21-$15)×10,000 sh.)
Retained earnings, Dec. 31, 2004Net incomeRetained earnings, Dec. 31, 2005Total stockholders’ equity
$150,000 60,000
98,000 30,000
(#) — piece(s) of information provided in problem
$210,000
128,000$338,000
(#)(#)
(#)
(#)
Note 3: Total equity
Total Debt
$338,0000 ÷ 4$ 84,500
(#) Shareholders’ equity to total debt
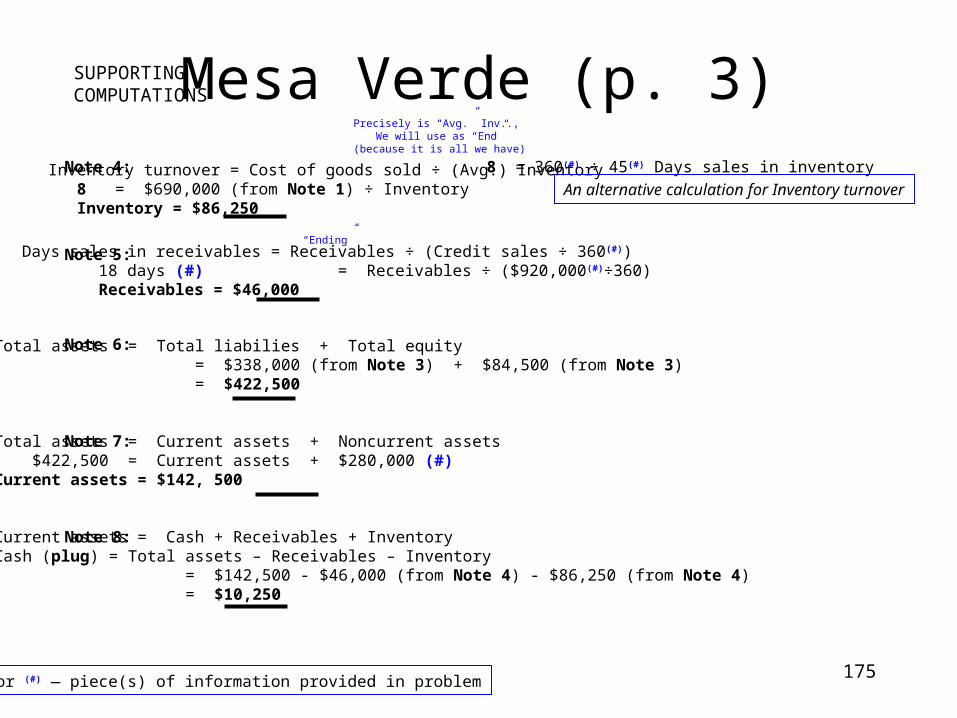
175
Mesa Verde (p. 3)SUPPORTINGCOMPUTATIONS
Note 4: Inventory turnover = Cost of goods sold ÷ (Avg.) Inventory 8 = $690,000 (from Note 1) ÷ Inventory Inventory = $86,250
(#) or (#) — piece(s) of information provided in problem
Precisely is “Avg.” Inv.., We will use as “End”
(because it is all we have)
8 = 360(#) ÷ 45(#) Days sales in inventory
An alternative calculation for Inventory turnover
Days sales in receivables = Receivables ÷ (Credit sales ÷ 360(#)) 18 days (#) = Receivables ÷ ($920,000(#)÷360) Receivables = $46,000
“Ending”
Note 6: Total assets = Total liabilies + Total equity = $338,000 (from Note 3) + $84,500 (from Note 3) = $422,500
Total assets = Current assets + Noncurrent assets $422,500 = Current assets + $280,000 (#)Current assets = $142, 500
Current assets = Cash + Receivables + InventoryCash (plug) = Total assets – Receivables – Inventory = $142,500 - $46,000 (from Note 4) - $86,250 (from Note 4) = $10,250
Note 5:
Note 7:
Note 8:

176
Mesa Verde (p. 4)SUPPORTINGCOMPUTATIONS
(#) or (#) — piece(s) of information provided in problem
Note 9: Acid-test ratio = (Cash + Accounts receivable) ÷ Current liabilities 2.5 (#) = ($10,250 + $46,000) ÷ Current liabilities
Current liabilities = $22,500
Total liabilities = Current liabilities + Noncurrent liabilities $84,500 (from Note 3) = $22,500 + Noncurrent liabilities
Noncurrent liabilities = $62,000
Note 10:

177
Millstone Company
MILLSTONE COMPANYBalance Sheet
December 31, 2004
AssetsCurrent Assets: Cash ………………………… Accounts receivable ………… Inventories ………………….. Total current assets …………Noncurrent assets …………….Total assets ……………………
Liabilities
Stockholders’ Equity
Current liabilities ..……………Noncurrent liabilities …………Total liabilities.………………..
Common stock ..………………Additional paid-in capital …….Retained earnings .……………Total stockholders’ equity ……Total liabilities and equity ……
$ 61,700115,000
161,000
$276,000 63,080
$337,700 510,000$847,700
$339,080
$100,000150,000
258,620 508,620
$847,700
Where? How?Note 7Note 4Note 3Calculation: Cash+A/R+Inv.(Given)Calc: Note 8
Note 6Note 10 [Plug]Note 9
(Given)(Given)Note 13 [Plug]Note 11[ = Total assets]

178
Millstone (p. 2)SUPPORTINGCOMPUTATIONS
Note 1: Compute net income for 2005
Sales …………………..Cost of goods sold ……Gross profit …………..Operating expenses …..Income before taxes ….Taxes expense ………..Net income ……………
$1,840,000 1,288,000
$552,000
$ 92,000
(#)(70% of sales (100% - Gross profit margin ratio))(30% of sales (#) Gross profit margin ratio)
(5% Net operating profit margin ratio (#))
Note 2: Compute Stockholders’ Equity
Common stock ($15 par × 10,000 sh.)Additional paid-in capital (($21-$15)×10,000 sh.)
Retained earnings, Dec. 31, 2004Net incomeRetained earnings, Dec. 31, 2005Total stockholders’ equity
$100,000 150,000
$166,620 92,000
(#) — piece(s) of information provided in problem
$250,000
258,620$508,620
(#)(#) (#)
[Plug: Note 12](Note 11)
The Answer toQuestion #2
(Note 13)
Note 3: Inventory turnover = Cost of goods sold ÷ (Avg.) Inventory 8 (#) = $1,288,000 (from Note 1) ÷ Inventory Inventory = $161,000
Precisely is “Avg.” Inv.., We will use as “End”
(because it is all we have)

179
Millstone (p. 3)SUPPORTINGCOMPUTATIONS
(#) — piece(s) of information provided in problem
Accounts receivable turnover = Sales ÷ Average accounts receivable 16 (#) = $1,840,000 ÷ Avg. A/R Accounts receivable = $115,000
Note 5:
Working capital = Current assets - Current liabilities = Cash + Accounts receivable + Inventories - Current liabilities $27,200 (#) = Cash + $115,000 (Note 4) + $161,000 (Note 3) - $276,000 (Note 6) Cash = $61,700
Note 4:
Note 6:
Note 7:
Precisely is “Avg.” Inv.., We will use as “End”
(because it is all we have)
Operating cash flow to income = Operating cash flow ÷ Net income 3 (#) = Operating cash flow ÷ $92,000 (Note 1) Operating cash flow = $276,000
Cash flow to current liabilities ratio = Operating cash flow ÷ Current liabilities 1 (#) = $276,000 (Note 5) ÷ Current liabilities Current liabilities = $276,000
Note 8: Total assets = Cash + Accounts receivables + Inventories + Noncurrent assets = $61,700 (Note 7) + $115,000 (Note 4) + $161,000 (Note 3) + $510,000 (#)Total assets = $847,700
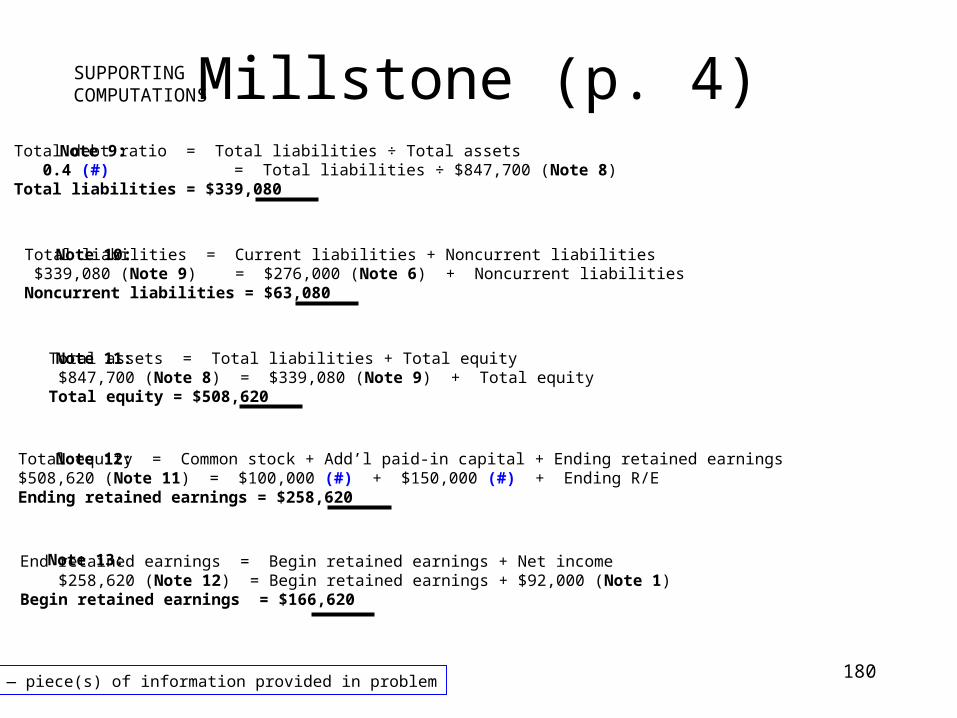
180
Total debt ratio = Total liabilities ÷ Total assets 0.4 (#) = Total liabilities ÷ $847,700 (Note 8)Total liabilities = $339,080
Millstone (p. 4)SUPPORTINGCOMPUTATIONS
(#) — piece(s) of information provided in problem
Note 9:
Note 10: Total liabilities = Current liabilities + Noncurrent liabilities $339,080 (Note 9) = $276,000 (Note 6) + Noncurrent liabilitiesNoncurrent liabilities = $63,080
Note 11: Total assets = Total liabilities + Total equity $847,700 (Note 8) = $339,080 (Note 9) + Total equityTotal equity = $508,620
Note 12: Total equity = Common stock + Add’l paid-in capital + Ending retained earnings$508,620 (Note 11) = $100,000 (#) + $150,000 (#) + Ending R/EEnding retained earnings = $258,620
Note 13: End retained earnings = Begin retained earnings + Net income $258,620 (Note 12) = Begin retained earnings + $92,000 (Note 1) Begin retained earnings = $166,620

181
Missouri Retailers (A)
APR
MAY
JUN
FebMar.Apr.
Mar.Apr.May
Apr.MayJun.
$ 85,000×20%$ 95,000×30%$ 75,000×50%
$ 95,000×20%$ 75,000×30%$ 85,000×50%
$ 75,000×20%$ 85,000×30%$108,000×50%
$17,00028,500
37,500$83,000
$19,00022,500
42,500$84,000
$15,00025,500
54,000$94,500
APR MAY JUN Total
$261,500

182
Missouri Retailers (B)
Mar.Apr.
Apr.May
MayJun.
$50,000×70%$55,000×30%
$55,000×70%$65,000×30%
$65,000×70%$88,000×30%
$35,000 16,500$51,500
$38,500 19,500$58,000
$45,500 26,400$71,900
Total
$181,400
APR
MAY
JUN
APR MAY JUN

183183
Mizzou Company
PDOR = Estimated Activity ÷ Estimated Activity= $130,890 ÷ 1,720= $76.10 per DLH
Unit Product Cost: Direct Materials Direct Labor Mfg. Overhead Total Unit Cost
Miz Zou
$10.70 11.20 53.27 *$75.17
$16.70 19.20 91.32 **$127.22
* 0.7 DLH/unit × $76.10 = $53.27** 1.2 DLH/unit × $76.10 = $91.32
Activity-Based Costing: Activity Rates
Activity Cost Pool Machine set-ups Purchase orders General factory
EstimatedMOH
EstimatedActivity
ActivityRates
$13,57091,52025,800
230 setups2,080 orders1,720 DLH
$59 per setup$44 per order$15 per DLH
Traditional Method1.
2.
÷÷÷
===

184184
Mizzou Company (p. 2)
Activities Machine set-ups Purchase orders General factory Total Overhead Cost
ActivityRates
$59 per setup$44 per order$15 per DLH
EstimatedActivity
100 setups 810 orders 280 DLH
MOH$ 5,900
35,640 4,200$45,740
EstimatedActivity
130 setups1,270 orders1,440 DLH
MOH$ 7,670
55,880 21,600$85,150
MIZ ZOU
Activity-Based Costing: Applying MOH to Products
Activity-Based Costing: MOH per Unit
Number of units produced 400 units 1,200 units
MOH per unit $ 114.35 $ 70.96
Unit Product Cost: Direct Materials Direct Labor Mfg. Overhead Total Unit Cost
Miz Zou
$ 10.70 11.20 114.35$136.25
$16.70 19.20 79.96$106.86
Activity-Based Costing: Unit Product Costs
3. (a)
3. (b)
3. (c)
Total overhead cost $45,740 units $85,150 units÷ ÷

185185
Moehrle Manufacturing
$ 453030
5$110
Direct materialDirect laborVariable OHSpecial logo costTotal relevant costs
Relevant costs to manufacture
The minimum selling price for the special order is $110 sincethat is the total of relevant costs per unit.

186186
Moore Computers
Absorption Costing
Income Statement
For the Year Ended Dec. 31, 2003
Rev. $500,000
COGS: Direct materials (60,000)
Direct labor (45,000)
Indirect labor (25,000)
Factory insurance (12,000)
Depreciation—Factory (80,000)
Repairs and maint.—Factory (15,000)
GM $263,000
S&A: Marketing expenses (66,000)
General and admin. expenses (55,000)
OI $142,000
Variable Costing
Income Statement
For the Year Ended Dec. 31, 2003
Rev. $500,000
VC: Direct materials (60,000)
Direct labor (45,000)
Repairs and maint.—Factory (15,000)
Marketing expenses (66,000)
CM $314,000
FC: Indirect labor (25,000)
Factory insurance (12,000)
Depreciation—Factory (80,000)
General and admin. expenses (55,000)
OI $142,000

187
$ 60,000
250,000 $240,000
$70,000
DL
$405,000 $405,000
MOH
$ 10,000
25,000
100,000
35,000
30,000
$200,000
- 0 -
Purch
$120,000 240,000 405,000 $850,000 200,000
$115,000
FG
$150,000
850,000 $835,000
$165,000
COGS
$835,000 $835,000
- 0 -
I/S
$835,000 $940,000
110,000
$ 5,000
COGS
ACOGS
COGM
OI (LOSS!!)
Rev.
Admin.PeriodCosts
$200,000
DM WIP
Muleskinner Athletic Wear, Inc.
- 0 -
Inventory AccountsProduct
Costs
(BI + In = EI + Out)

188188
Narcissus NeedlesUtilities $10,000
Depr. 15,000
Dupr. Sal. 30,000
Janitorial 6,000
Ins. 9,000
Total MOH $70,000
Utilities $10,500
Depr. 15,000
Supr. Sal. 30,000
Janitorial 5,200
Ins. 8,500
1.
2.
3.
PDOR = Estimated MOH
Estimated Activity=
$70,000
3,500 DLH
=
$20.00 per DLH
Applied MOH = Actual Activity × PDOR 3,600 DLH × $20.00 $72,000=
=
Total MOH $69,200
MOH
Actual$69,200
$2,800
$2,800
- 0 -to COGS
Overapplied
Applied$72,000

189189
Oatman Company
$ 16,000
200,000
$ 26,000
$190,000
DM
BI
Purch
EI
$ 10,000
190,000
160,000
170,000
$ 50,000
$480,000
BI
EI
WIP
$ 30,000
480,000
$ 35,000
$475,000
BI
EI
FG
$160,000 $160,000
DL
MOH
$ 42,000
27,000
9,000
51,000
129,000 40,000 * $4.25
= $170,000
$ 41,000
Utilities
IDL
Insurance
Depr.
COGS
I/S
$434,000
36,000
80,000
1,000
50,000
9,000
$700,000
$ 90,000
COGS
Sales comm.
Admin Sal.
Insurance
Advertising
Depreciation
Sales
OI
Est.OH
Est Activity
$153,000
36,000 MH
= $4.25 per MH
$ 41,000
$434,000
$ 41,000
$475,000
$434,000
Adj. COGS
PDOR =
=
COGS
- 0 -
1.
- 0 -
COGM
- 0 -
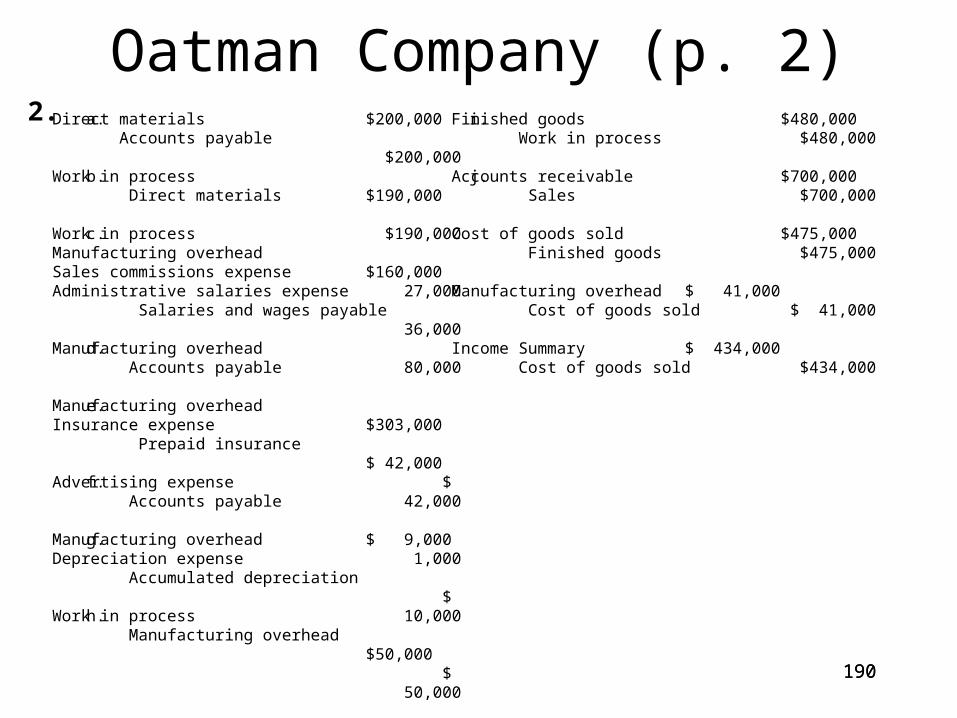
190190
Oatman Company (p. 2)2. Direct materials
Accounts payable
Work in process Direct materials
Work in processManufacturing overheadSales commissions expenseAdministrative salaries expense Salaries and wages payable
Manufacturing overhead Accounts payable
Manufacturing overheadInsurance expense Prepaid insurance
Advertising expense Accounts payable
Manufacturing overheadDepreciation expense Accumulated depreciation
Work in process Manufacturing overhead
a.
b.
c.
d.
e.
f.
g.
h.
$200,000 $200,000
$190,000 $190,000
$160,000 27,000 36,000 80,000 $303,000
$ 42,000 $ 42,000
$ 9,000 1,000 $ 10,000
$50,000 $ 50,000
$ 51,000 9,000 $ 60,000
$170,000 $170,000
Finished goods Work in process
Accounts receivable Sales
Cost of goods sold Finished goods
Manufacturing overhead Cost of goods sold
Income Summary Cost of goods sold
i.
j.
$480,000 $480,000
$700,000 $700,000
$475,000$475,000
$ 41,000$ 41,000
$ 434,000$434,000
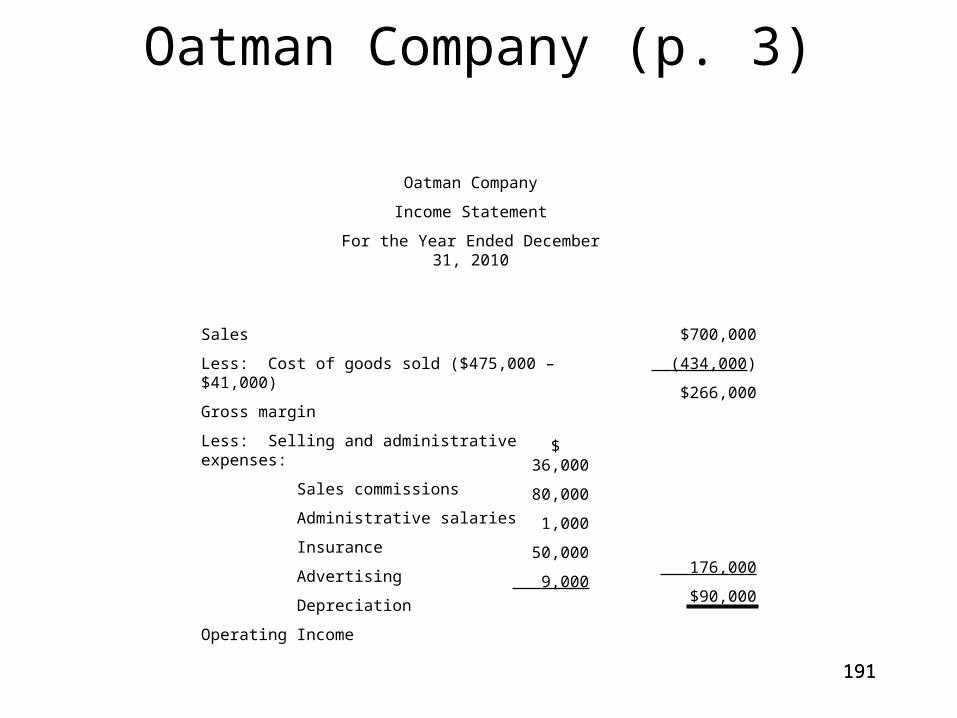
191191
Oatman Company (p. 3)
Oatman Company
Income Statement
For the Year Ended December 31, 2010
Sales
Less: Cost of goods sold ($475,000 – $41,000)
Gross margin
Less: Selling and administrative expenses:
Sales commissions
Administrative salaries
Insurance
Advertising
Depreciation
Operating Income
$700,000
(434,000)
$266,000
176,000
$90,000
$ 36,000
80,000
1,000
50,000
9,000
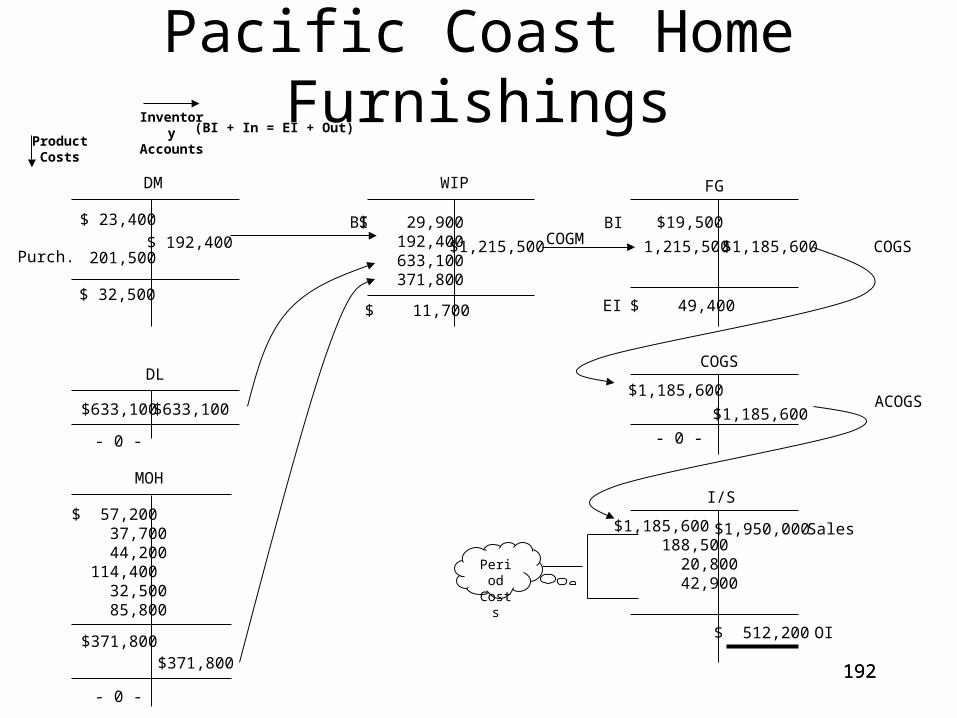
192192
Pacific Coast Home Furnishings
DM
DL
MOH
WIP FG
COGS
I/S
Purch.
$ 23,400
201,500$ 192,400
$ 32,500
$633,100 $633,100
- 0 -
$ 57,200 37,700 44,200 114,400 32,500 85,800
$371,800$371,800
- 0 -
$ 29,900 192,400 633,100 371,800
BI
$ 11,700
$1,215,500
$19,500BI
1,215,500 $1,185,600COGM
$ 49,400
$1,185,600
$1,185,600
- 0 -
COGS
$1,185,600 188,500 20,800 42,900
$1,950,000 Sales
$ 512,200 OI
EI
ACOGS
PeriodCosts
Inventory Accounts
Product Costs
(BI + In = EI + Out)
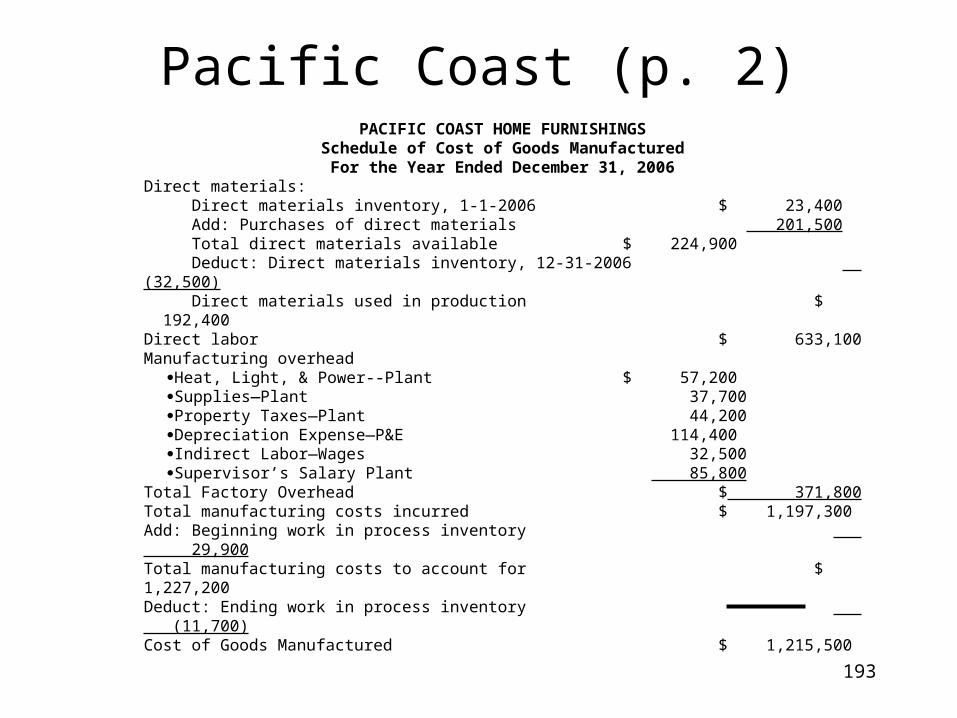
193
Pacific Coast (p. 2)
PACIFIC COAST HOME FURNISHINGSSchedule of Cost of Goods ManufacturedFor the Year Ended December 31, 2006
Direct materials: Direct materials inventory, 1-1-2006 $ 23,400 Add: Purchases of direct materials 201,500 Total direct materials available $ 224,900 Deduct: Direct materials inventory, 12-31-2006 (32,500) Direct materials used in production $ 192,400Direct labor $ 633,100Manufacturing overhead
Heat, Light, & Power--Plant $ 57,200Supplies—Plant 37,700Property Taxes—Plant 44,200Depreciation Expense—P&E 114,400Indirect Labor—Wages 32,500Supervisor’s Salary Plant 85,800
Total Factory Overhead $ 371,800Total manufacturing costs incurred $ 1,197,300Add: Beginning work in process inventory 29,900Total manufacturing costs to account for $ 1,227,200Deduct: Ending work in process inventory (11,700)Cost of Goods Manufactured $ 1,215,500

194194
Pacific Coast (p. 3)
PACFIC COAST HOME FURNISHINGSIncome Statement
For the Year Ended December 31, 2006
Sales $ 1,950,000Cost of Goods Sold Finished Goods Inventory, Beginning $ 19,500 Cost of Goods Manufactured 1,215,500 Total Goods Available for Sale $ 1,235,000 Finished Goods Inventory, Ending 49,400
Less: Cost of goods sold (1,185,600)Gross margin $ 764,400Less: Selling and administrative expenses:
Sales reps’ salaries $ 188,500 Supplies—Admin Office 20,800 Depr. Exp—Admin Office 42,900
Total Selling & Administrative Expenses (252,200)Operating Income $ 512,200
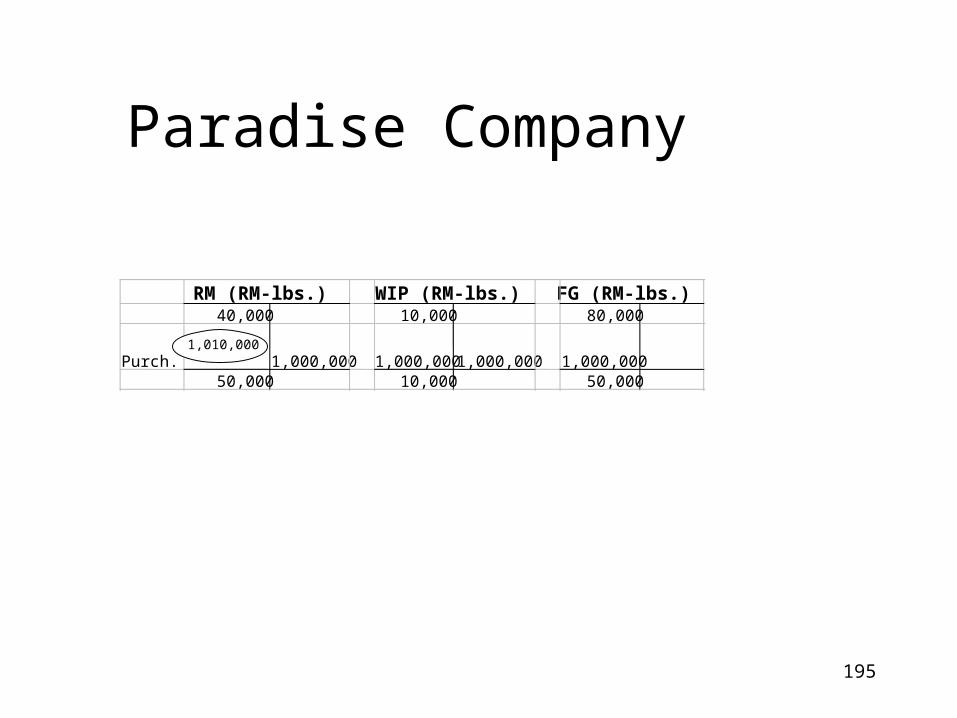
195
Paradise Company
40,000 10,000 80,000
Purch. 1,000,000 1,000,000 1,000,000 1,000,00050,000 10,000 50,000
RM (RM-lbs.) WIP (RM-lbs.) FG (RM-lbs.)
1,010,000

196196
Pauley’s Parts Co.
Future revenuesDeduct future costsMargin
$30,00025,000
$ 5,000
$2,500
$2,500
Remachine Scrap
The difference is in favor of remachining by $2,500 ($5,000 - $2,500).The $50,000 inventory cost is irrelevant.
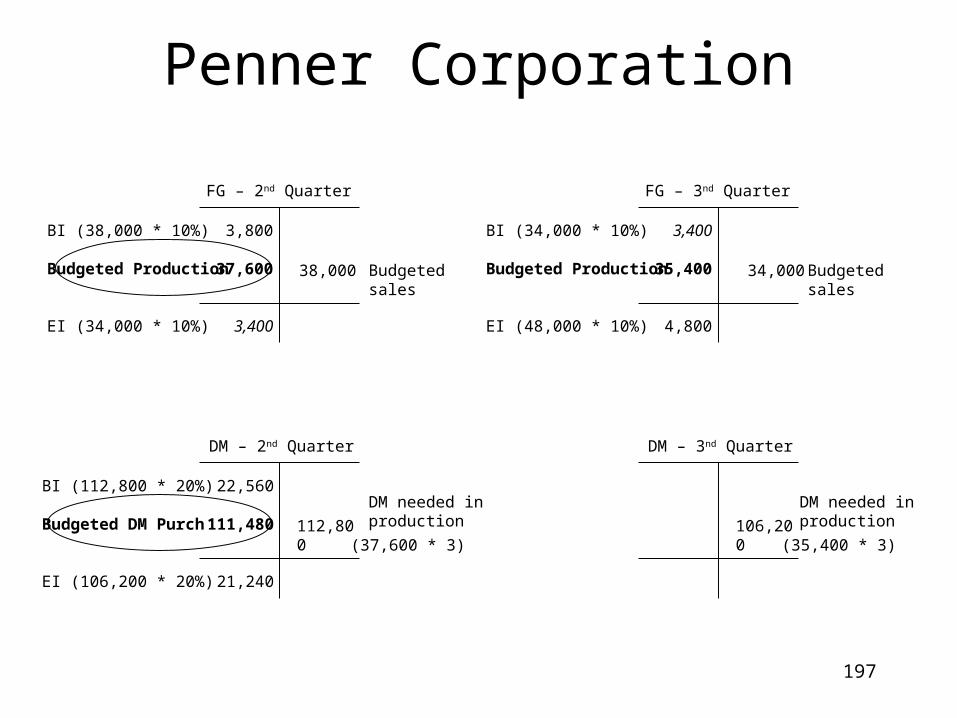
197
Penner Corporation
FG – 2nd Quarter
3,800
37,600
3,400
38,000
BI (38,000 * 10%)
Budgeted Production
EI (34,000 * 10%)
Budgeted sales
FG – 3nd Quarter
3,400
35,400
4,800
34,000
BI (34,000 * 10%)
Budgeted Production
EI (48,000 * 10%)
Budgeted sales
DM – 2nd Quarter
22,560
111,480
21,240
112,800
BI (112,800 * 20%)
Budgeted DM Purch
EI (106,200 * 20%)
DM needed in production
(37,600 * 3)
DM – 3nd Quarter
106,200
DM needed in production
(35,400 * 3)

198198
Phony Phones Co.
Corded $30.00 $24.00 $ 6.00 5/10 $3.00
2.4 GHz $32.00 $24.00 $ 8.00 4/10 $3.20
5.8 GHz $40.00 $36.00 $ 4.00 1/10 $0.40
$6.60
SPU VCU CMU Mix
Wtd.Avg.CMU
FC $165,000 25,000 units
CM per unit $6.60
Corded 2.4 GHz 5.8 GHz
50% 40% 10%
12,500 + 10,000 + 2,500 = 25,000
$375,000 + $320,000 + $100,000 = $795,000
Corded 2.4 GHz 5.8 GHz
# 1
===BE (units)
#1

199199
Phony Phones Co. (p. 2)
NIBT =NIAT
(1- Tax Rate)
# 2NIBT =
$59,400
(1- .4)
NIBT = $99,000
BE (units) = $165,000 + $99,000
$6.60BE (units) =
FC + NIBT
BE (units) 40,000 =
CM per unit
Corded 2.4 GHz 5.8 GHz
50% 40% 10%
20,000 + 16,000 + 4,000 = 40,000
$610,500 + $512,000 + $160,000 = $1,282,500
Corded 2.4 GHz 5.8 GHz
#2
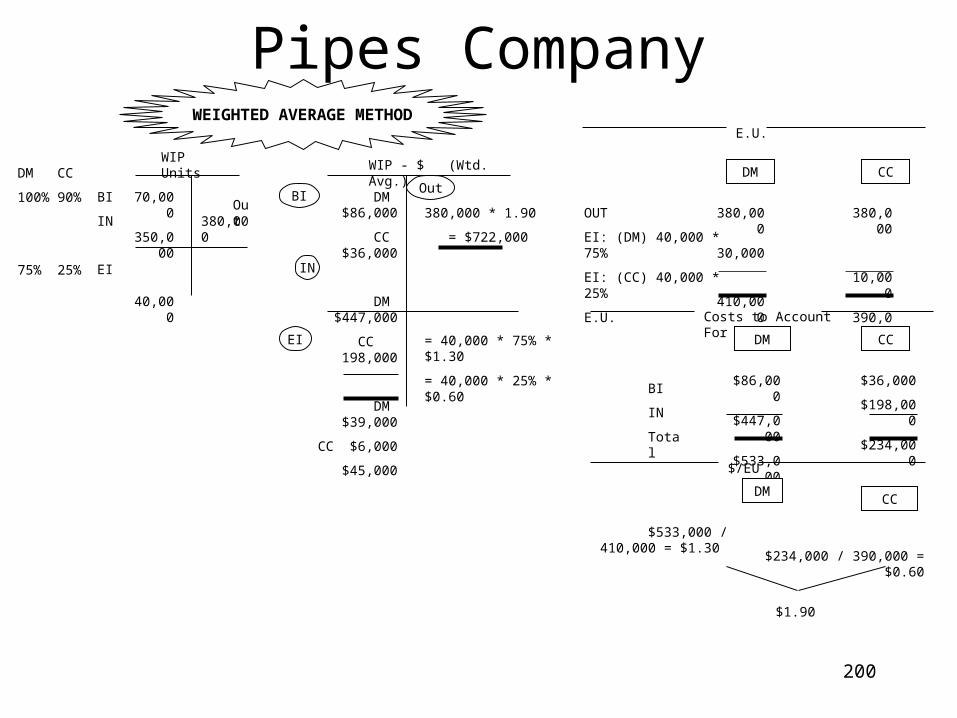
200
Pipes Company
WIP Units
70,000
350,000
40,000
380,000Out
BI
IN
EI
DM
100%
75%
CC
90%
25%
WIP - $ (Wtd. Avg.)
DM $86,000
CC $36,000
DM $447,000
CC 198,000
DM $39,000
CC $6,000
$45,000
380,000 * 1.90
= $722,000
= 40,000 * 75% * $1.30
= 40,000 * 25% * $0.60
OutBI
IN
EI
E.U.
DM CC
380,000
30,000
410,000
380,000
10,000
390,000
Costs to Account For
DM CC
$86,000
$447,000
$533,000
$36,000
$198,000
$234,000
BI
IN
Total
$/EU
DMCC
$533,000 / 410,000 = $1.30
$234,000 / 390,000 = $0.60
$1.90
OUT
EI: (DM) 40,000 * 75%
EI: (CC) 40,000 * 25%
E.U.
WEIGHTED AVERAGE METHOD
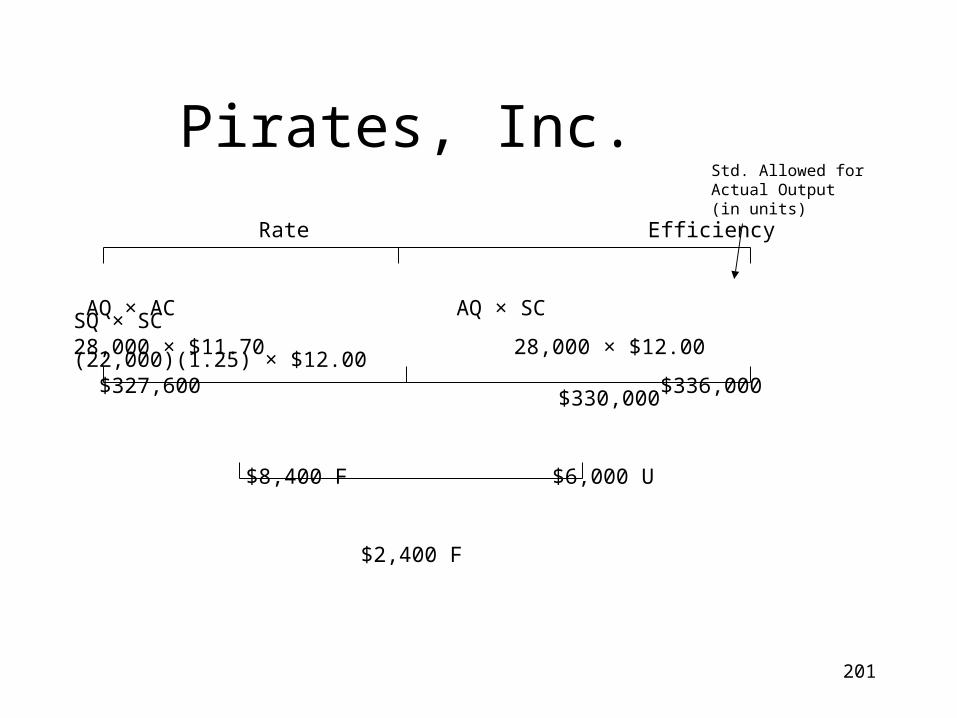
201
Pirates, Inc.
Rate Efficiency
AQ × AC AQ × SC SQ × SC28,000 × $11.70 28,000 × $12.00 (22,000)(1.25) × $12.00 $327,600 $336,000 $330,000
$8,400 F $6,000 U
$2,400 F
Std. Allowed forActual Output(in units)

202202
Plentiful Printing, Inc.$15,000
95,000
$20,000
$90,000
DM
$ 3,000
90,000
40,000
60,000
$ 8,000
2,000
3,000
$13,000
$180,000
WIP
$ 20,000
180,000
$ 15,000
$185,000
FG
$40,000
2,500 * $16
$40,000
DL
Actual
$57,000
$ 3,000
Applied
$40,000 * 1.5
= $60,000
$ 3,000
MOH
$182,000
$ 3,000
$182,000
COGS
$182,000
57,000
12,000
$285,000
$34,000
I/S
PD
OR
= E
st M
OH
/ E
st A
ctiv
ity
=
$60
0,00
0 / $
400,
000
=
$1.
50 p
er D
L $
$2,0
00 /
125
hrs
= $
16 /h
r D
L R
ate
BI
Purch
EI
BI
EI
Adj. COGS
Selling
Admin
Sales
OI
COGMCOGS
Adj. COGS- 0 -
- 0 -
- 0 -
$185,000

203203
Polaris Company$ 10,000
210,000
$ 34,000
$178,000
12,000
DM
BI
Purch
EI
$ 42,000
178,000
90,000
240,000
$ 30,000
$520,000
BI
EI
WIP
$ 37,000
520,000
$ 77,000
$480,000
BI
EI
FG
$ 90,000
- 0 -
$ 90,000
DL
MOH
$ 12,000
110,000
40,000
70,000
$232,000 30,000 * $8
= $240,000
$ 8,000
IDM
IDL
Depr.
Other
COGS
I/S
$472,000
54,000
42,000
$600,000COGS
Selling
Admin.
Sales
$ 8,000
- 0 -
$480,000
$472,000
- 0 -Adj. COGS
COGS
$ 8,000
$472,000
COGM
$ 32,000 OI
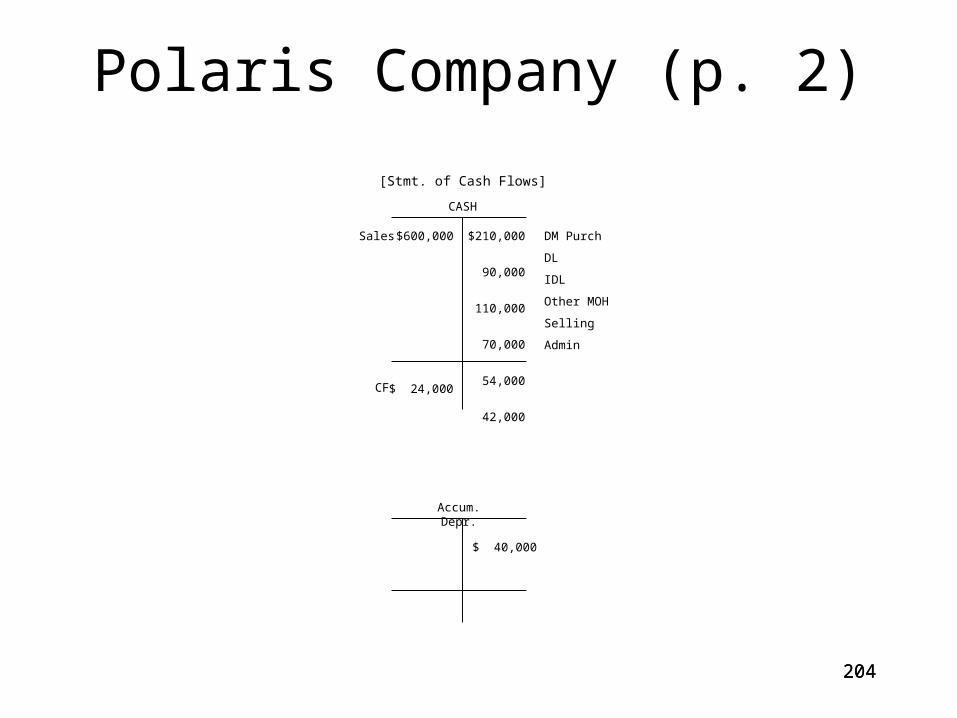
204204
Polaris Company (p. 2)
$600,000
$ 24,000
$210,000
90,000
110,000
70,000
54,000
42,000
CASH
$ 40,000
Accum. Depr.
[Stmt. of Cash Flows]
Sales DM Purch
DL
IDL
Other MOH
Selling
Admin
CF
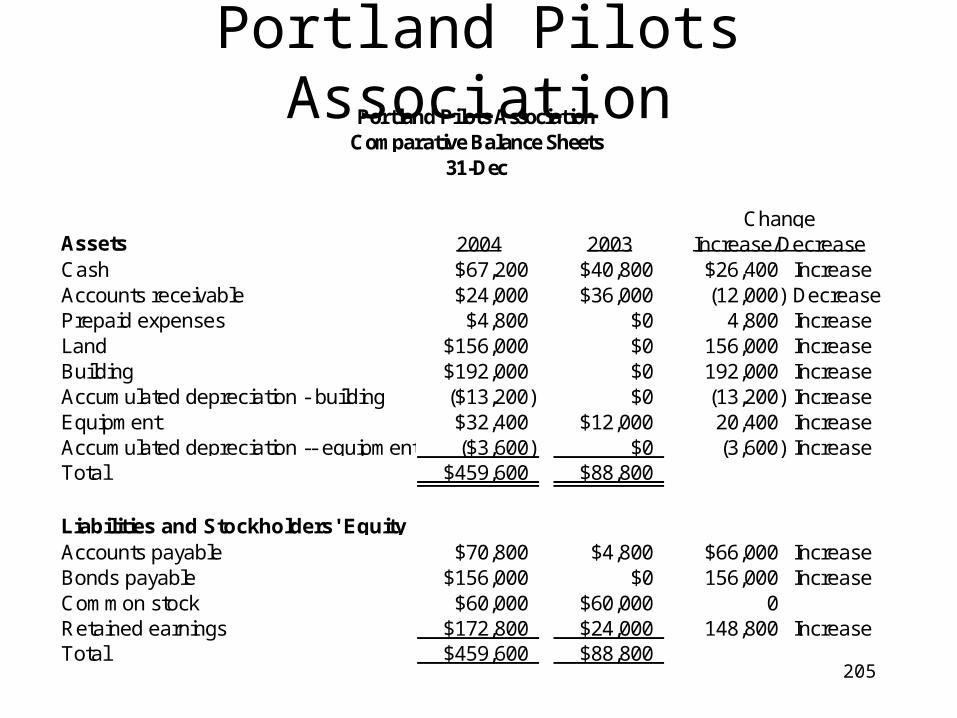
205
Portland Pilots Association
Assets 2004 2003Cash $67,200 $40,800 $26,400 IncreaseAccounts receivable $24,000 $36,000 (12,000) DecreasePrepaid expenses $4,800 $0 4,800 IncreaseLand $156,000 $0 156,000 IncreaseBuilding $192,000 $0 192,000 IncreaseAccumulated depreciation - building ($13,200) $0 (13,200) IncreaseEquipment $32,400 $12,000 20,400 IncreaseAccumulated depreciation -- equipment ($3,600) $0 (3,600) IncreaseTotal $459,600 $88,800
Liabilities and Stockholders' EquityAccounts payable $70,800 $4,800 $66,000 IncreaseBonds payable $156,000 $0 156,000 IncreaseCommon stock $60,000 $60,000 0Retained earnings $172,800 $24,000 148,800 IncreaseTotal $459,600 $88,800
Increase/DecreaseChange
31-Dec
Portland Pilots AssociationComparative Balance Sheets

206
Portland Pilots (p. 2)
Operating ActivitiesNet income $166,800Adjustments to convert net income to a cash basis: Depreciation expense $18,000 Loss on sale of equipment 3,600 Decrease in accounts receivable 12,000 Increase in prepaid expenses (4,800) Increase in accounts payable 66,000 94,800Net cash provided by operating activities $261,600
Investing Activities Purchase of building ($192,000) Purchase of equipment (30,000) Sale of equipment 4,800Net cash used by investing activies (217,200)
Financing Activities Payment of cash dividends (18,000)Net cash used by financing activities (18,000)
Net increase in cash and cash equivalents $26,400Cash and cash equivalents at beginning of year 40,800Cash and cash equivalents at end of year $67,200
Noncash investing and financing activities Issuance of bonds payable to purchase land $156,000
PORTLAND PILOTS COMPANYStatement of Cash Flows -- Indirect Method
For the Year Ended December 31, 2004
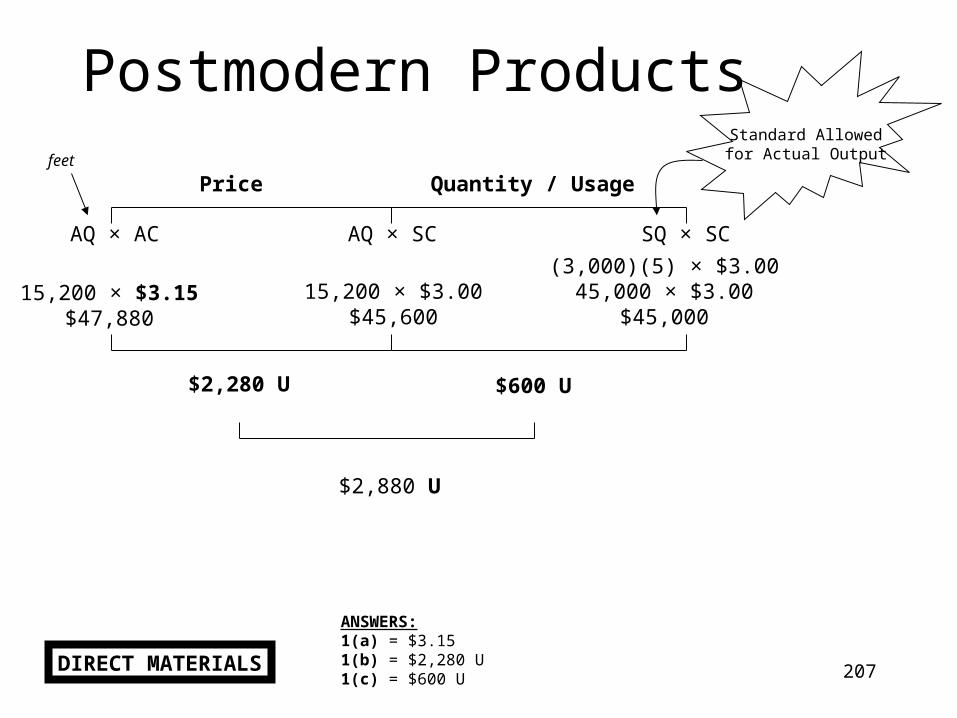
207
Postmodern ProductsStandard Allowedfor Actual Output
Price Quantity / Usage
AQ × AC AQ × SC SQ × SC
feet
15,200 × $3.15$47,880
(3,000)(5) × $3.0045,000 × $3.00
$45,00015,200 × $3.00
$45,600
$2,280 U $600 U
$2,880 U
DIRECT MATERIALS
ANSWERS:1(a) = $3.151(b) = $2,280 U1(c) = $600 U
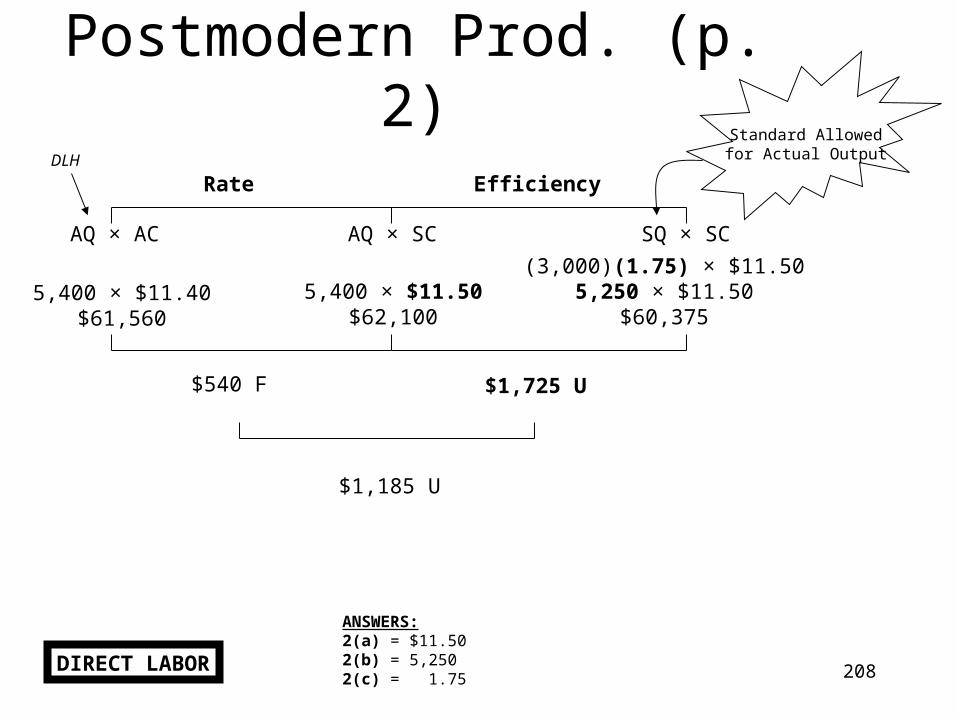
208
Postmodern Prod. (p. 2)Standard Allowedfor Actual Output
Rate Efficiency
AQ × AC AQ × SC SQ × SC
DLH
5,400 × $11.40$61,560
(3,000)(1.75) × $11.505,250 × $11.50
$60,3755,400 × $11.50
$62,100
$540 F $1,725 U
$1,185 U
DIRECT LABOR
ANSWERS:2(a) = $11.502(b) = 5,2502(c) = 1.75

209
P.W. ProductsStandard Allowedfor Actual Output
Price Quantity / Usage
AQ × AC AQ × SC SQ × SC
pounds
350,000 × $4.12$1,442,000
(12,000)(25) × $4.00300,000 × $4.00
$1,200,000
350,000 × $4.00$1,400,000
$42,000 U
$16,000 U
CAN’T!
DIRECT MATERIALS
304,000 × $4.00$1,216,000
DM Purchased ≠ DM Used
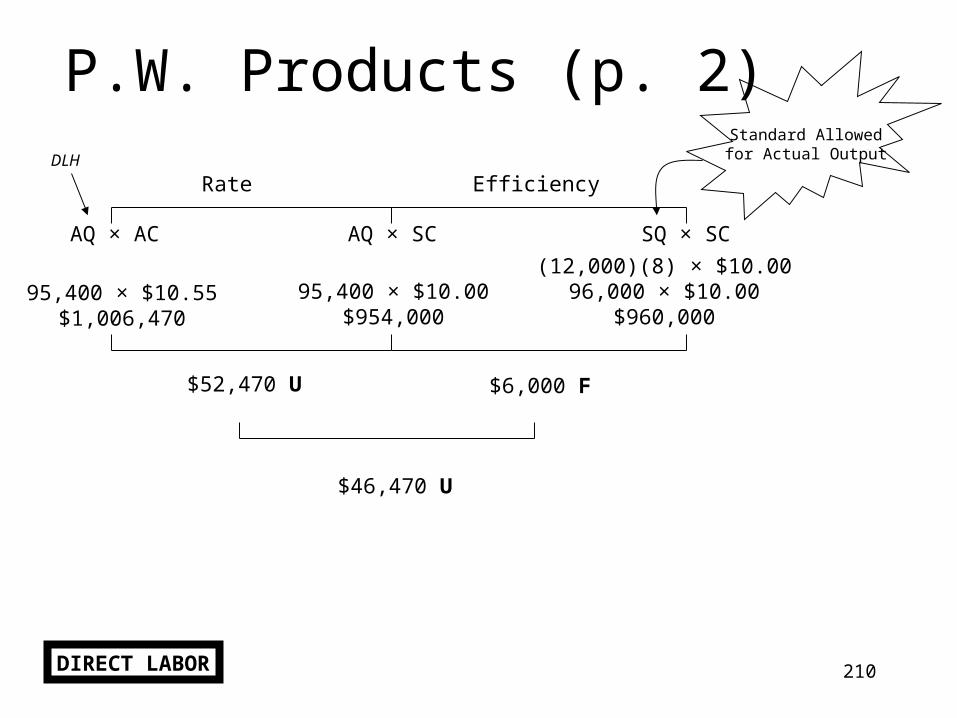
210
P.W. Products (p. 2)Standard Allowedfor Actual Output
Rate Efficiency
AQ × AC AQ × SC SQ × SC
DLH
95,400 × $10.55$1,006,470
(12,000)(8) × $10.0096,000 × $10.00
$960,00095,400 × $10.00
$954,000
$52,470 U $6,000 F
$46,470 U
DIRECT LABOR
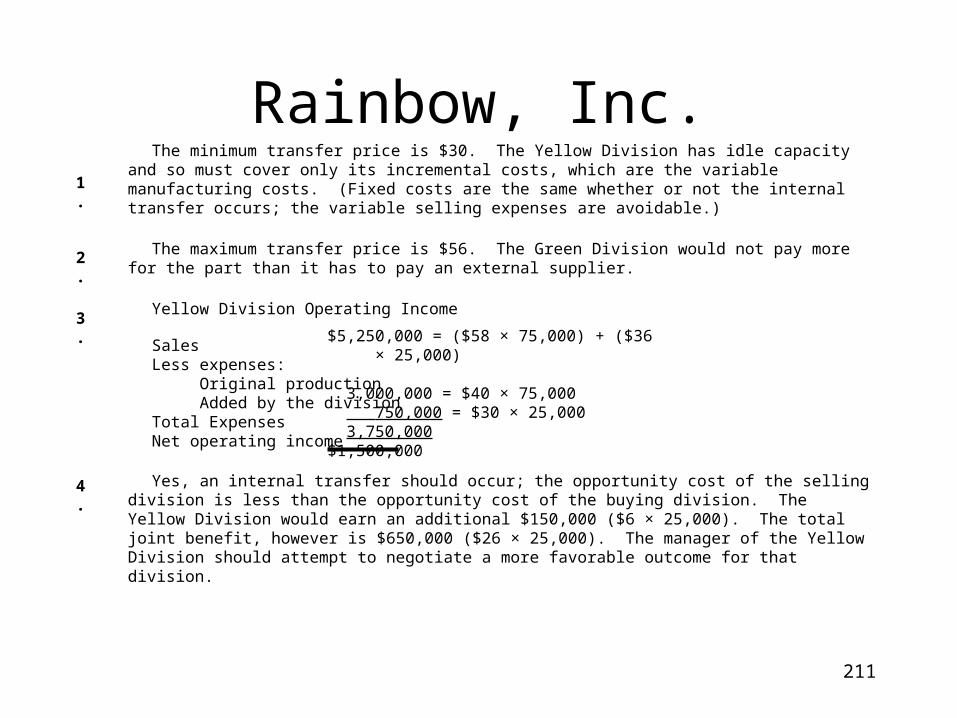
211
Rainbow, Inc.The minimum transfer price is $30. The Yellow Division has idle capacity and so must cover only its
incremental costs, which are the variable manufacturing costs. (Fixed costs are the same whether or not the internal transfer occurs; the variable selling expenses are avoidable.)
The maximum transfer price is $56. The Green Division would not pay more for the part than it has to pay an external supplier.
Yellow Division Operating Income
Yes, an internal transfer should occur; the opportunity cost of the selling division is less than the opportunity cost of the buying division. The Yellow Division would earn an additional $150,000 ($6 × 25,000). The total joint benefit, however is $650,000 ($26 × 25,000). The manager of the Yellow Division should attempt to negotiate a more favorable outcome for that division.
SalesLess expenses:
Original productionAdded by the division
Total ExpensesNet operating income
$5,250,000 = ($58 × 75,000) + ($36 × 25,000)
3,000,000 = $40 × 75,000 750,000 = $30 × 25,000 3,750,000$1,500,000
1.
2.
3.
4.

212
Rebel Company
Price
AQ * AP AQ * SP SQ * SP30,000 * $2.80 30,000 * $3.00 29,000 * $3.00
$84,000 $90,000 $87,000
$3,000 / 1,000 in Q = $3.00
$3,000 F
Quantity
$3,000 u$6,000 F

213
Rikki-Tikki-Tavi TaffyRikky-Tikky-Tavi Taffy
Comparative Balance Sheets31-Dec
Assets 2002 2001
Current Assets:
Cash $3,600 $26,400 ($22,800) Decrease Accounts receivable 144,000 98,400 $45,600 Increase Inventory 129,600 102,000 $27,600 Increase Prepaid expenses 6,000 9,600 ($3,600) DecreaseTotal current assets 283,200 236,400 $46,800 IncreaseLong-term investments 64,800 88,800 ($24,000) DecreasePlant and equipment 523,200 336,000 $187,200 IncreaseLess: Accumulated depreciation 72,000 60,000 $12,000 IncreaseNet plant and equipment 451,200 276,000 $175,200 IncreaseTotal assets $799,200 $601,200 $198,000 Increase
Liabilities and Stockholders’ Equity
Current liabilities:
Accounts payable $86,400 $72,000 $14,400 Increase Accrued liabilities 22,800 21,600 $1,200 IncreaseTotal current liabilities 109,200 93,600 $15,600 IncreaseBonds payable 156,000 0 $156,000 IncreaseDeferred income taxes 14,400 12,000 $2,400 IncreaseStockholders’ equity:
Preferred stock 98,400 114,000 ($15,600) Decrease Common stock 318,000 285,600 $32,400 Increase Retained earnings 103,200 96,000 $7,200 IncreaseTotal stockholders’ equity 519,600 495,600 $24,000 IncreaseTotal liabilities and stockholders’ equity $799,200 $601,200 $198,000 Increase

214
Rikki-Tikki-Tavi (p. 2)
Operating ActivitiesNet income $37,200Adjustments to convert net income to a cash basis: Depreciation expense $33,600 Increase in accounts receivable (45,600) Increase in inventory (27,600) Decrease in prepaid expenses 3,600 Increase in accounts payable 14,400 Increase in accrued liabilities 1,200 Gain on sale of investments (12,000) Gain on sale of equipment (3,600) Increase in deferred income taxes 2,400 (33,600)Net cash provided by operating activities $3,600
Investing Activities Sale of investments $36,000 Sale of equipment 12,000 Purchase of plant and equipment (217,200)Net cash used by investing activies (169,200)
Financing Activities Increase in bonds payable $156,000 Increase in common stock 16,800 Payment of cash dividends (30,000)Net cash used by financing activities 142,800
Net increase in cash and cash equivalents ($22,800)Cash and cash equivalents at beginning of year 26,400Cash and cash equivalents at end of year $3,600
Noncash investing and financing activities Preferred stock converted to common stock $15,600
RIKKY-TIKKY-TAVI TAFFYStatement of Cash Flows -- Indirect Method
For the Year Ended December 31, 2002

215215
Robin Hood, Inc.
MOH
$2,400,000 $2,240,000
$160,000
$160,000
- 0 -
to COGS
Underapplied
PDOR = Estimated MOH
Estimated Activity=
$2,000,000
125,000 DLH
=
$16.00 per DLH
Applied MOH = Actual Activity × PDOR 140,000 DLH × $16.00 $2,240,000=
=1.
2.
3.

216
Rocky Mountain Bicycle Club
Direct materials $ 60Direct labor 70Variable manufacturing OH 25Fixed manufacturing OH ($300,000 ÷ 5,000 units) 60Unit cost $ 215
Absorption Costing
Rocky Mountain Bicycle ClubAbsorption Costing I/S
For the Y/E Dec. 31, 2005
Rev $ 1,400,000 = 4,000 units × $350 per unit
- CoGS (240,000) = VC DM 4,000 units × $60 per unit (280,000) = VC DL 4,000 units × $70 per unit
(100,000) = VC MOH 4,000 units × $25 per unit (240,000) = FC MOH 4,000 units × $60 per unit
GM $ 540,000
- S&A (40,000) = VC S&A 4,000 units × $10 per unit (400,000) = FC S&A
NI $100,000
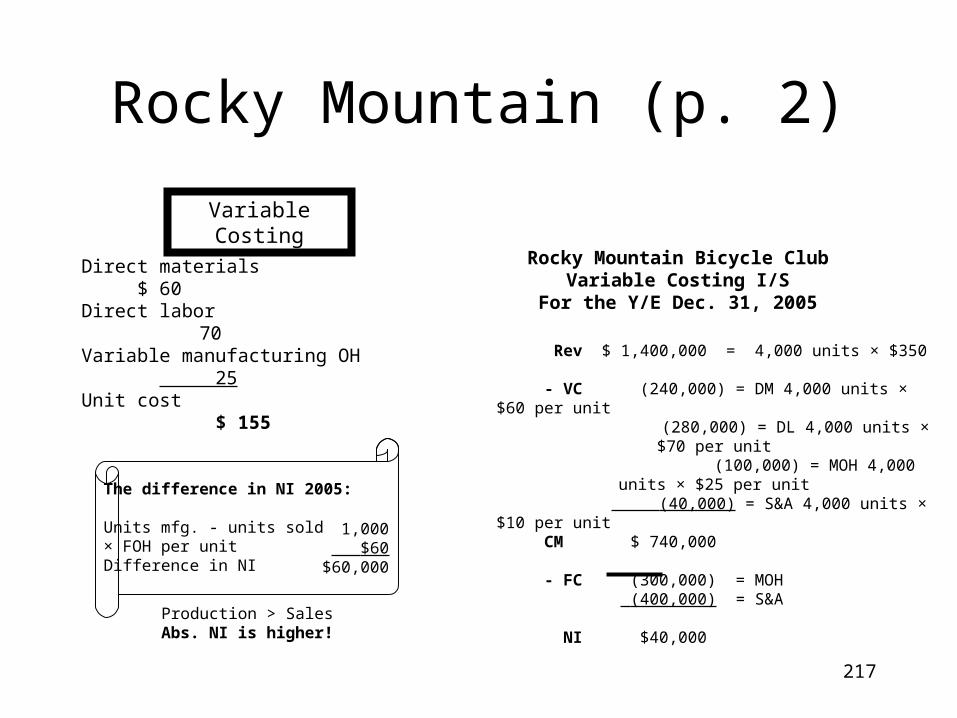
217
Rocky Mountain (p. 2)
Variable Costing
Direct materials $ 60Direct labor 70Variable manufacturing OH 25Unit cost $ 155
Rocky Mountain Bicycle ClubVariable Costing I/S
For the Y/E Dec. 31, 2005
Rev $ 1,400,000 = 4,000 units × $350
- VC (240,000) = DM 4,000 units × $60 per unit (280,000) = DL 4,000 units × $70 per unit
(100,000) = MOH 4,000 units × $25 per unit (40,000) = S&A 4,000 units × $10 per unit
CM $ 740,000
- FC (300,000) = MOH (400,000) = S&A
NI $40,000
The difference in NI 2005:
Units mfg. - units sold× FOH per unitDifference in NI
1,000 $60
$60,000
Production > SalesAbs. NI is higher!

218218
BI $131,400
PURCH. 319,700
EI $126,100
DM
1. $325,000
$293,480
DL
$293,480
MOHIDL
DEPR.
PTY TAX
FIRE INS.
IDM
UTIL.
DEPR.
$22,700
31,000
12,600
7,840
11,600
36,000
44,000
920 x 29= 26,680 DLH
26,680 x $600
= $160,080
$165,740
UnderappliedMOH
$5,6603.
$5,660
PRIME COSTS DM $325,000DL 293,480
$618,4802.
WIPBI $ 49,000
325,000
293,480
160,080
$ 73,900EI
$753,660
4.
FG$ 87,300
753,660
BI
$763,660
$ 77,300EI
COGS$763,660
5,660
$769,320
6.$769,320
- 0 -
I/S
SOLO SALARIES
ADU.
PTY TAX
FIRE INS.
COMM.
ADMIN.
UTIL.
RENT
DEPR.
MISC.
R & ALLOW
$1,281,700 Sales$769,320
85,000
44,000
5,400
1,960
28,500
167,200
9,000
8,700
17,400
4,300
36,100$1,176,880
$104,820 X 40% = $41,928 $104,820
$62,892
NI BT7.
NI AT
- 0 -
Roley Poley
PER UNIT
$753,660 / 920
5.= $819
- 0 -
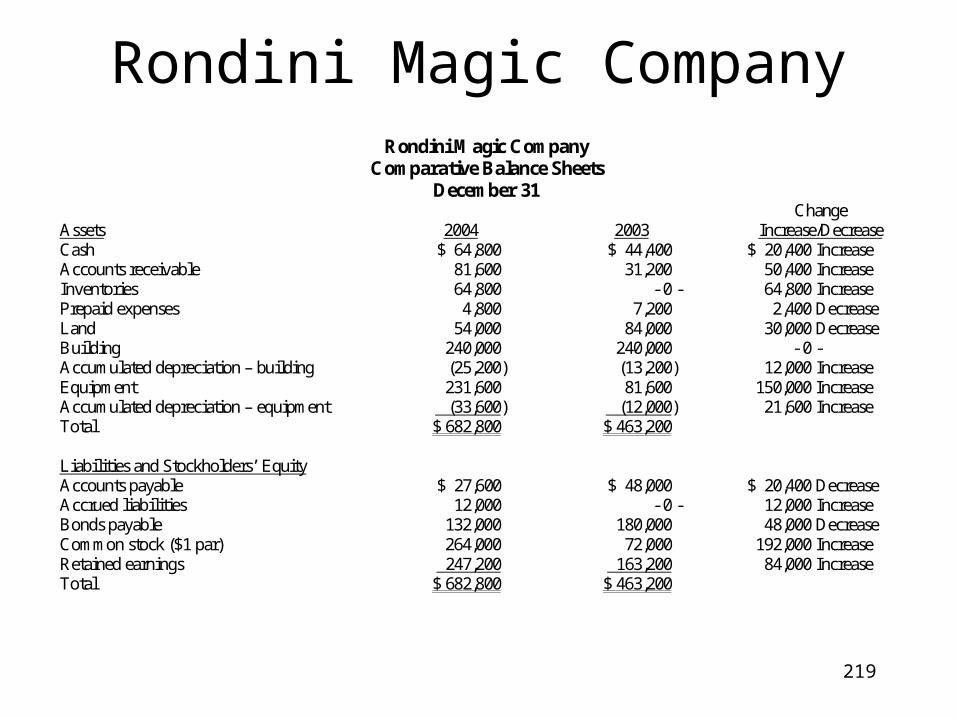
219
Rondini Magic CompanyRondini Magic Company
Comparative Balance Sheets December 31
Assets
2004
2003
Change Increase/Decrease
Cash $ 64,800 $ 44,400 $ 20,400 Increase Accounts receivable 81,600 31,200 50,400 Increase Inventories 64,800 - 0 - 64,800 Increase Prepaid expenses 4,800 7,200 2,400 Decrease Land 54,000 84,000 30,000 Decrease Building 240,000 240,000 - 0 - Accumulated depreciation – building (25,200) (13,200) 12,000 Increase Equipment 231,600 81,600 150,000 Increase Accumulated depreciation – equipment (33,600) (12,000) 21,600 Increase Total $ 682,800 $ 463,200 Liabilities and Stockholders’ Equity Accounts payable $ 27,600 $ 48,000 $ 20,400 Decrease Accrued liabilities 12,000 - 0 - 12,000 Increase Bonds payable 132,000 180,000 48,000 Decrease Common stock ($1 par) 264,000 72,000 192,000 Increase Retained earnings 247,200 163,200 84,000 Increase Total $ 682,800 $ 463,200
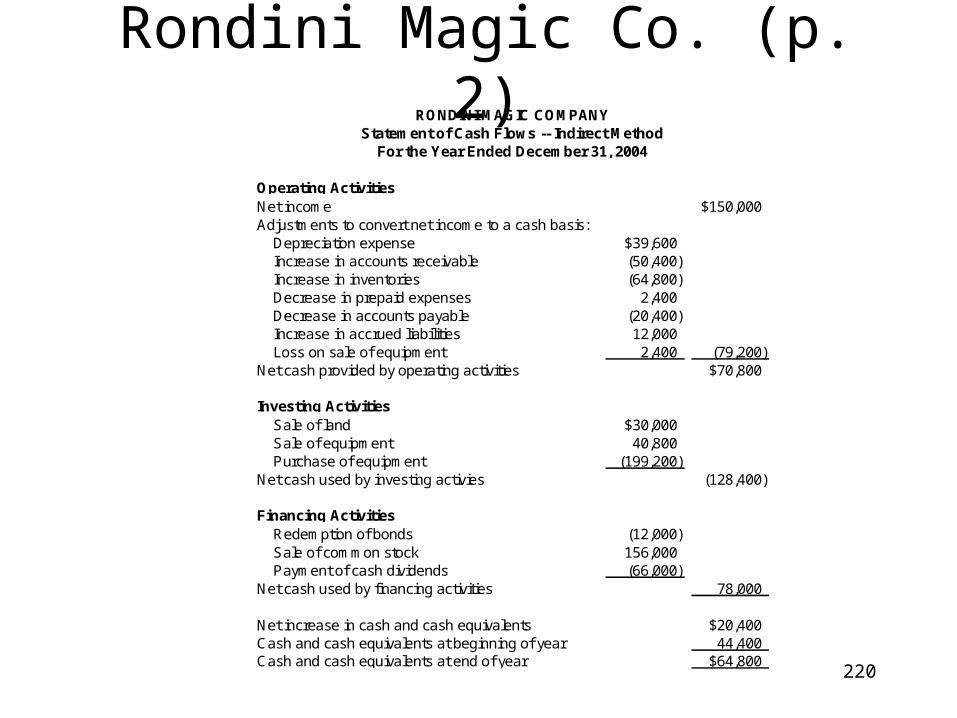
220
Rondini Magic Co. (p. 2)
Operating ActivitiesNet income $150,000Adjustments to convert net income to a cash basis: Depreciation expense $39,600 Increase in accounts receivable (50,400) Increase in inventories (64,800) Decrease in prepaid expenses 2,400 Decrease in accounts payable (20,400) Increase in accrued liabilities 12,000 Loss on sale of equipment 2,400 (79,200)Net cash provided by operating activities $70,800
Investing Activities Sale of land $30,000 Sale of equipment 40,800 Purchase of equipment (199,200)Net cash used by investing activies (128,400)
Financing Activities Redemption of bonds (12,000) Sale of common stock 156,000 Payment of cash dividends (66,000)Net cash used by financing activities 78,000
Net increase in cash and cash equivalents $20,400Cash and cash equivalents at beginning of year 44,400Cash and cash equivalents at end of year $64,800
RONDINI MAGIC COMPANYStatement of Cash Flows -- Indirect Method
For the Year Ended December 31, 2004
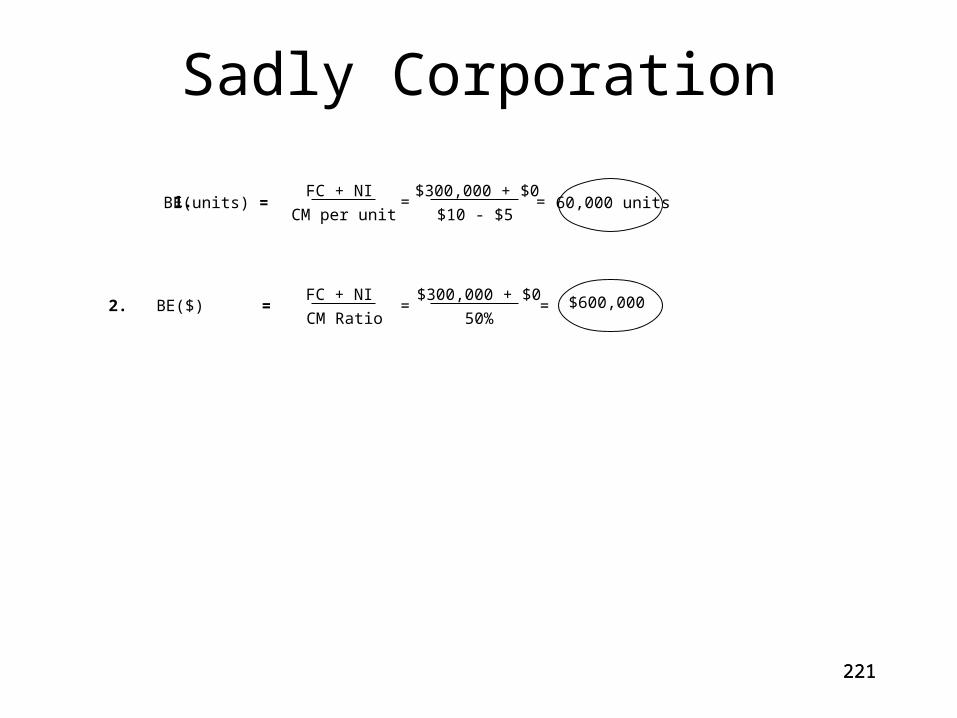
221221
Sadly Corporation
BE(units) =CM per unit
FC + NI $300,000 + $0
$10 - $560,000 units
2. BE($) =CM Ratio
FC + NI $300,000 + $0
50%$600,000=
= =
=
1.
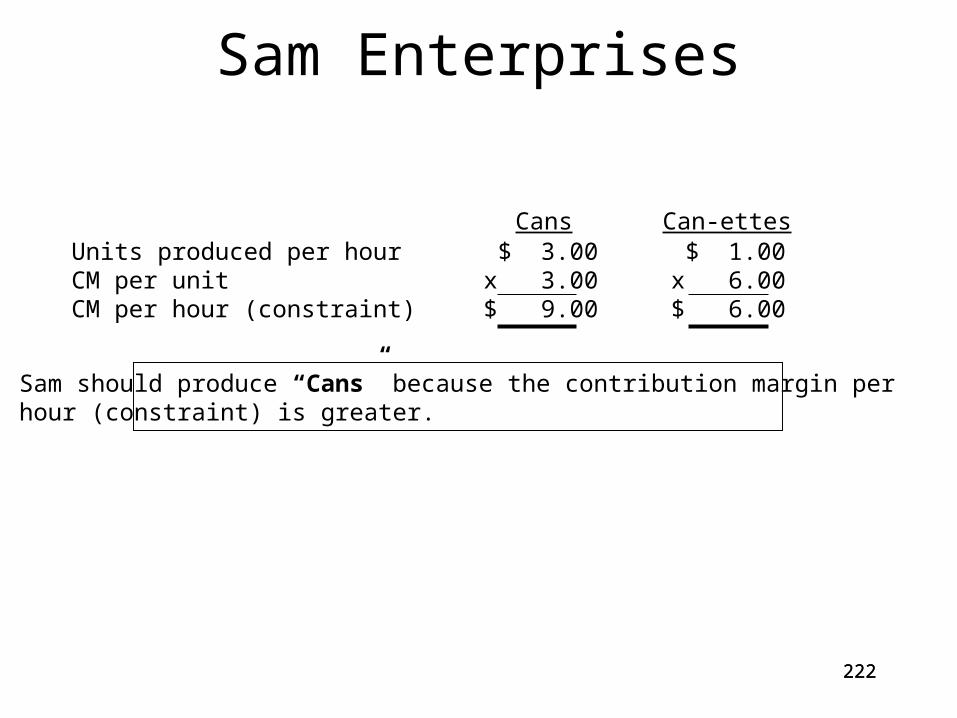
222222
Sam Enterprises
Units produced per hourCM per unitCM per hour (constraint)
$ 3.00x 3.00$ 9.00
$ 1.00x 6.00$ 6.00
Cans Can-ettes
Sam should produce “Cans” because the contribution margin perhour (constraint) is greater.

223
Shockey Company
Price Qty/Usage
AQ × AC AQ × SC SQ × SC3,350 × $30 3,350 × $25$100,500 $83,750
$16,750 U
AQ × SC SQ × SC 3,375 × $25 (900)(4) × $25 $84,375 $90,000
$5,625 F
CAN’T!
Actual Cost > Standard Cost = UNFAVORABLEActual Quantity < Standard Quantity = FAVORABLE
Standard Allowedfor Actual Output
(in units)
1.
RM – Alum (lbs.)
503,350 3,375
25

224
Shockey Co. (p. 2)
Rate Efficiency
AQ × AC AQ × SC SQ × SC4,200 × $42 4,200 × $40 (900)(5) × $40 $176,400 $168,000 $180,000
$8,400 U $12,000 F
$3,600 F
Std. Allowed forActual Output(in units)
2.

225
Sleep Warm, Inc.
$18,500
80,000 $81,700
$16,800
$40,500 $40,500
$105,750
$105,750
$105,750
$12,000
81,700
40,500 $216,450
105,750
$23,500
$10,200
216,450 $217,550
$9,100
$217,550 $217,550
$ 82,450
$217,550 $400,000
100,000
DM
DL
MOH
WIP FG
COGS
- 0 -
- 0 - - 0 -
I/S
ACOGS
COGSCOGM
Admin.PeriodCosts
Purch.
Inventory Accounts
Product Costs
(BI + In = EI + Out)
OI

226
Sly-Like-A-Fox, Inc.
SLY-LIKE-A-FOX, INC.Balance Sheet
December 31, 2002
AssetsCurrent Assets: Cash ………………………… Accounts receivable ………… Inventories …………………..Current Assets ………………...Noncurrent assets …………….Total assets ……………………
Liabilities and Equity
Current liabilities ..……………Noncurrent liabilities …………Total liabilities.………………..
Total equity …………………..Total Liabilities and Equity …..
$ 75,00075,000
50,000$200,000$300,000$500,000
$100,000 150,000$250,000
$250,000$500,000
Where? How?Note 10 [Plug]Note 4Note 5Note 7 [Plug](Given)Note 6 [Calc. = Total L+E]
Note 8Note 9 [Plug]Note 3
Note 2[Calc.: Note 6]
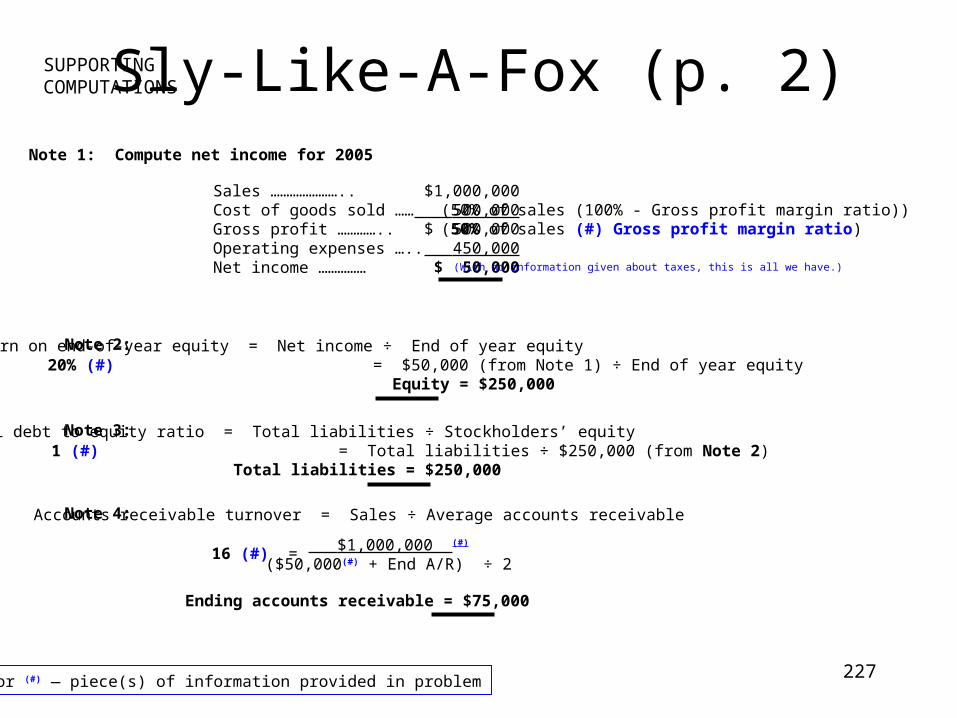
227
Sly-Like-A-Fox (p. 2)SUPPORTINGCOMPUTATIONS
Note 1: Compute net income for 2005
Sales …………………..Cost of goods sold ……Gross profit …………..Operating expenses …..Net income ……………
$1,000,000 500,000$ 500,000 450,000$ 50,000
(50% of sales (100% - Gross profit margin ratio))(50% of sales (#) Gross profit margin ratio)
(With no information given about taxes, this is all we have.)
Note 2: Return on end-of-year equity = Net income ÷ End of year equity 20% (#) = $50,000 (from Note 1) ÷ End of year equity Equity = $250,000
Note 3: Total debt to equity ratio = Total liabilities ÷ Stockholders’ equity 1 (#) = Total liabilities ÷ $250,000 (from Note 2) Total liabilities = $250,000
Note 4: Accounts receivable turnover = Sales ÷ Average accounts receivable
16 (#) = $1,000,000 (#)
($50,000(#) + End A/R) ÷ 2
(#) or (#) — piece(s) of information provided in problem
Ending accounts receivable = $75,000
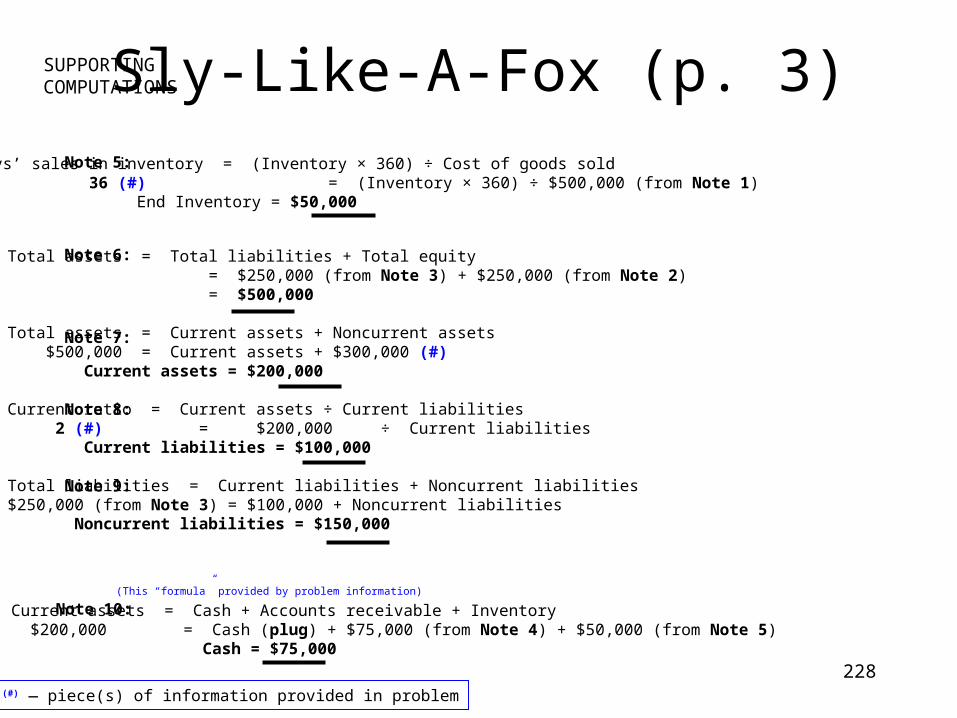
228
Sly-Like-A-Fox (p. 3)
Note 6: Total assets = Total liabilities + Total equity = $250,000 (from Note 3) + $250,000 (from Note 2) = $500,000
Total assets = Current assets + Noncurrent assets $500,000 = Current assets + $300,000 (#) Current assets = $200,000
Current ratio = Current assets ÷ Current liabilities 2 (#) = $200,000 ÷ Current liabilities Current liabilities = $100,000
Total liabilities = Current liabilities + Noncurrent liabilities$250,000 (from Note 3) = $100,000 + Noncurrent liabilities Noncurrent liabilities = $150,000
(#) or (#) — piece(s) of information provided in problem
SUPPORTINGCOMPUTATIONS
Note 10: Current assets = Cash + Accounts receivable + Inventory $200,000 = Cash (plug) + $75,000 (from Note 4) + $50,000 (from Note 5) Cash = $75,000
(This “formula” provided by problem information)
Note 5: Days’ sales in inventory = (Inventory × 360) ÷ Cost of goods sold 36 (#) = (Inventory × 360) ÷ $500,000 (from Note 1) End Inventory = $50,000
Note 9:
Note 8:
Note 7:

229
Smith Company Price Qty
AQ × AC AQ × SC SQ × SC 36,000 × $8.35 36,000 × $8.25 $300,600 $297,000
$3,600 U Std. Allowed for Actual Output(Std. Amt. x Actual Units)
AQ × SC SQ × SC31,800 × $8.25 (3200)(10) × $8.25 $262,350 $264,000
$1,650 F
CAN’T!

230
Smith Company (p. 2)
Rate Efficiency
AQ × AC AQ × SC SQ × SC 11,520 × $9.80 11,520 × $9.65 (3200)(3.5) × $9.65 $112,896 $111,168 $108,080
$1,728 U $3,088 U
$4,816 U
Translating Dr. Fessler’s “picture” into Formulas:1. AQ × (SC – AC) = Rate Variance2. SC × (SQ – AQ) = Efficiency variance

231
Soap ‘N Suds Inc.
Sales Value Less: Net Allocatedof Production Separable Costs Realizable Value % NRV Joint Cost
Mango $202,500 - 0 - $202,500 0.49 $102,900
Kiwi 210,000 - 0 - 210,000 0.51 107,100
Total $412,500 - 0 - $412,500 1.00 $210,000
Net Realizable Value Method (Sold at the Split-Off Point)
1.
Gal. Produced x Selling Price
Units ofProduction % Of Allocated(in gallons) Production Joint Cost
Mango 90,000 0.60 $126,000
Kiwi 60,000 0.40 84,000
Total 150,000 1.00 $210,000
Physical Unit Method
2.
4.

232
Soap ‘N Suds Inc. (p. 2)
Sales Value Less: Net Allocatedof Production Separable Costs Realizable Value % NRV Joint Cost
Mango $202,500 $117,000 $85,500 0.35 $ 73,500
Kiwi 210,000 48,000 162,000 0.65 136,500
Total $412,500 $165,000 $247,500 1.00 $210,000
Net Realizable Value Method (Sold Beyond the Split-Off Point)
3.
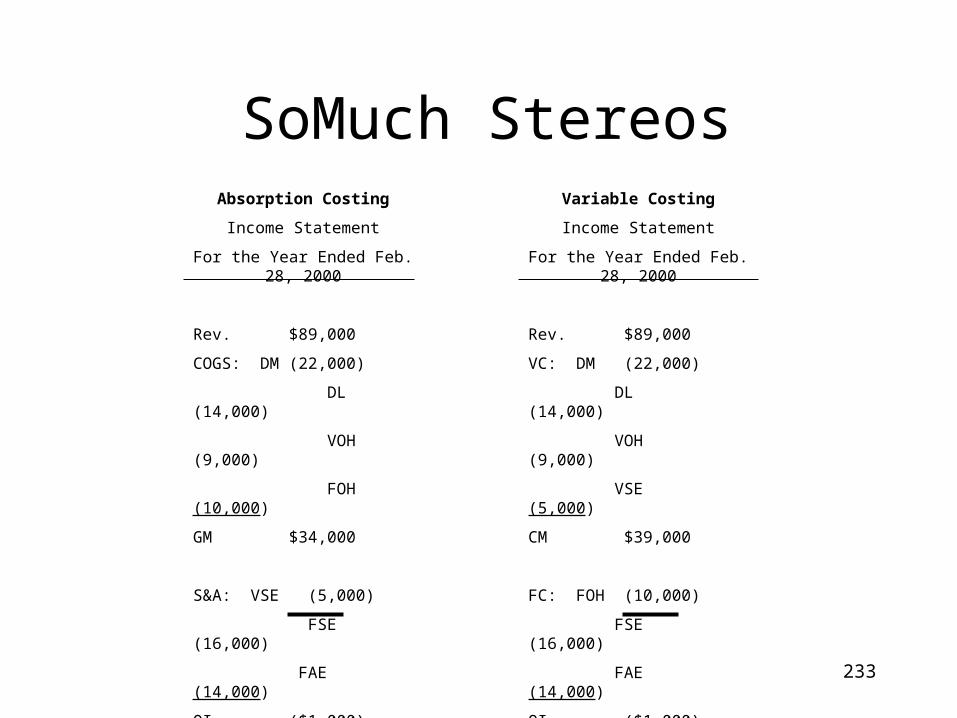
233
SoMuch StereosAbsorption Costing
Income Statement
For the Year Ended Feb. 28, 2000
Rev. $89,000
COGS: DM (22,000)
DL (14,000)
VOH (9,000)
FOH (10,000)
GM $34,000
S&A: VSE (5,000)
FSE (16,000)
FAE (14,000)
OI ($1,000)
Variable Costing
Income Statement
For the Year Ended Feb. 28, 2000
Rev. $89,000
VC: DM (22,000)
DL (14,000)
VOH (9,000)
VSE (5,000)
CM $39,000
FC: FOH (10,000)
FSE (16,000)
FAE (14,000)
OI ($1,000)

234
South Street Furniture
South Street Furniture Company Absorption Costing I/S For the Y/E Dec. 31, 2005
Rev
- CoGS
GM
- S&A
NI
$3,600,000
(248,000)(2,176,000) (12,000)$1,164,000
(216,000) (340,000)
$ 608,000
= 72,000 units × $20
= BI 8,000 units × $31 per unit= 64,000 units × $34 per unitUnderapplied MOH (2,000 @ $6)
= 72,000 units sold × $3 per unitFixed
South Street Furniture Company Variable Costing I/S For the Y/E Dec. 31, 2005
Rev
- VC
CM
- FC
NI
$ 3,600,000
(208,000)(1,792,000)
(216,000)$ 1,384,000
(480,000) (340,000)
$ 564,000
= 72,000 units × $20
= BI 8,000 units × $26 per unit= 64,000 units × $28 per unit= 72,000 units × $ 3 per unit
MOHS&A
The difference in NI :
FOH from BIFOH to EIDifference in NI
PDOR = $480,000 ÷ 80,000 normal production = $6.00 per unit
$(40,000) 84,000 $ 44,000
= 8,000 units @ $5 per unit = 14,000 units @ $6 per unit

235
1.y = a + bx b = hi-lo $
hi-lo activity
b = $390,700 - $180,000
4,980 – 2,180
= $210,700
2,800
b = $75.25 per machine hour
$390,000 = a + $75.25 (4,980)
$390,700 = a + $374,745
a = $15,955
Cost Formula
y = $15,955 + $75.25x
y = $15,955 + $75.25 (3,500)
y = $15,955 + $263,375
y = $279,330
2.
Southern Carpets
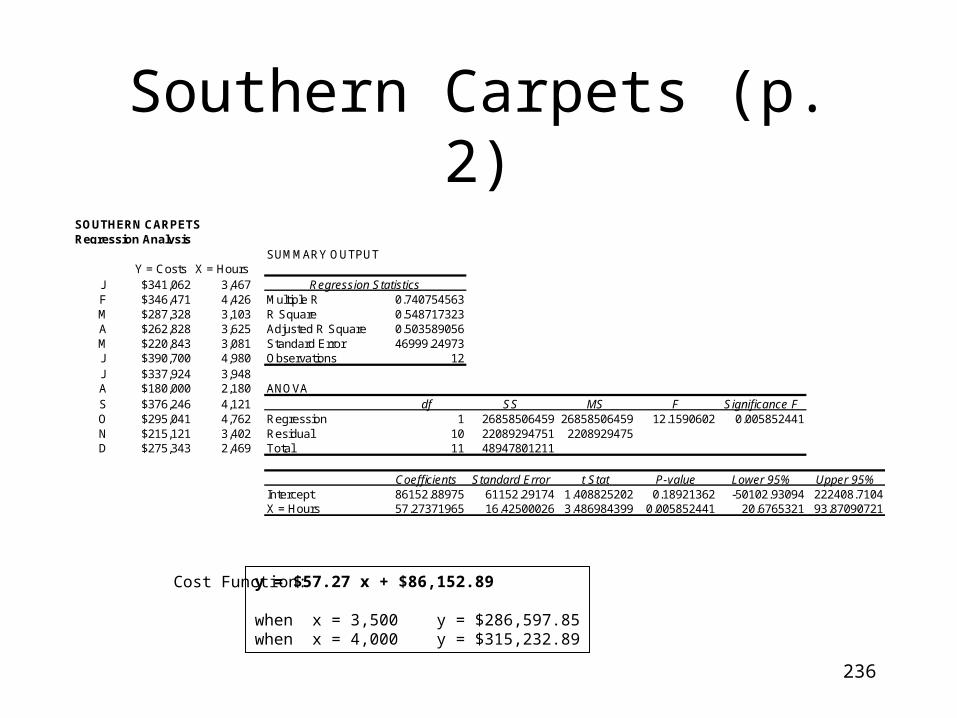
236
Southern Carpets (p. 2)SOUTHERN CARPETSRegression Analysis
SUMMARY OUTPUTY = Costs X = Hours
J $341,062 3,467 Regression StatisticsF $346,471 4,426 Multiple R 0.740754563M $287,328 3,103 R Square 0.548717323A $262,828 3,625 Adjusted R Square 0.503589056M $220,843 3,081 Standard Error 46999.24973J $390,700 4,980 Observations 12J $337,924 3,948A $180,000 2,180 ANOVAS $376,246 4,121 df SS MS F Significance FO $295,041 4,762 Regression 1 26858506459 26858506459 12.1590602 0.005852441N $215,121 3,402 Residual 10 22089294751 2208929475D $275,343 2,469 Total 11 48947801211
Coefficients Standard Error t Stat P-value Lower 95% Upper 95%Intercept 86152.88975 61152.29174 1.408825202 0.18921362 -50102.93094 222408.7104X = Hours 57.27371965 16.42500026 3.486984399 0.005852441 20.6765321 93.87090721
y = $57.27 x + $86,152.89
when x = 3,500 y = $286,597.85when x = 4,000 y = $315,232.89
Cost Function:

237
Spartan Inc.
Product Sales Value Additional Costs Net Realizable Value % of NRV Allocated Joint Cost
Alpha $180,000 $20,000 $160,000 0.64 $76,800
Beta 100,000 20,000 80,000 0.32 38,400
Chi 20,000 10,000 10,000 0.04 4,800
$250,000 1.00 $120,000
Sales Value less
Additional Costs
% Applied to
Total Joint Cost
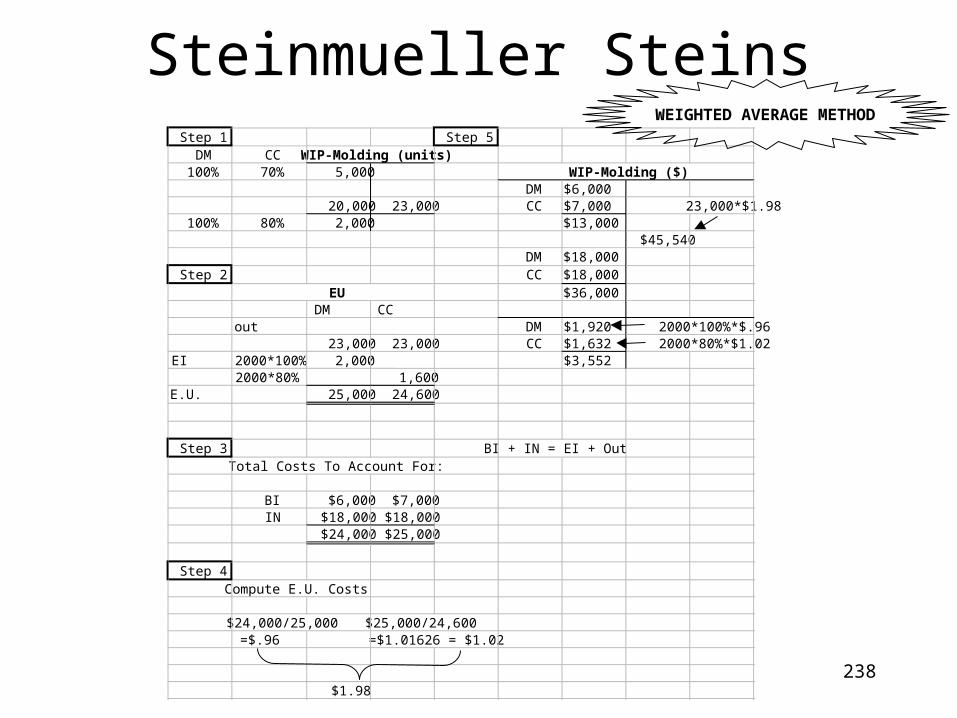
238
Steinmueller SteinsStep 1 Step 5
DM CC100% 70% 5,000
DM $6,00020,000 23,000 CC $7,000 23,000*$1.98
100% 80% 2,000 $13,000$45,540
DM $18,000Step 2 CC $18,000
$36,000DM CC
out DM $1,920 2000*100%*$.9623,000 23,000 CC $1,632 2000*80%*$1.02
EI 2000*100% 2,000 $3,5522000*80% 1,600
E.U. 25,000 24,600
Step 3 BI + IN = EI + Out
BI $6,000 $7,000IN $18,000 $18,000
$24,000 $25,000
Step 4Compute E.U. Costs
$24,000/25,000 $25,000/24,600 =$.96 =$1.01626 = $1.02
$1.98
WIP-Molding (units)
EU
Total Costs To Account For:
WIP-Molding ($)
WEIGHTED AVERAGE METHOD
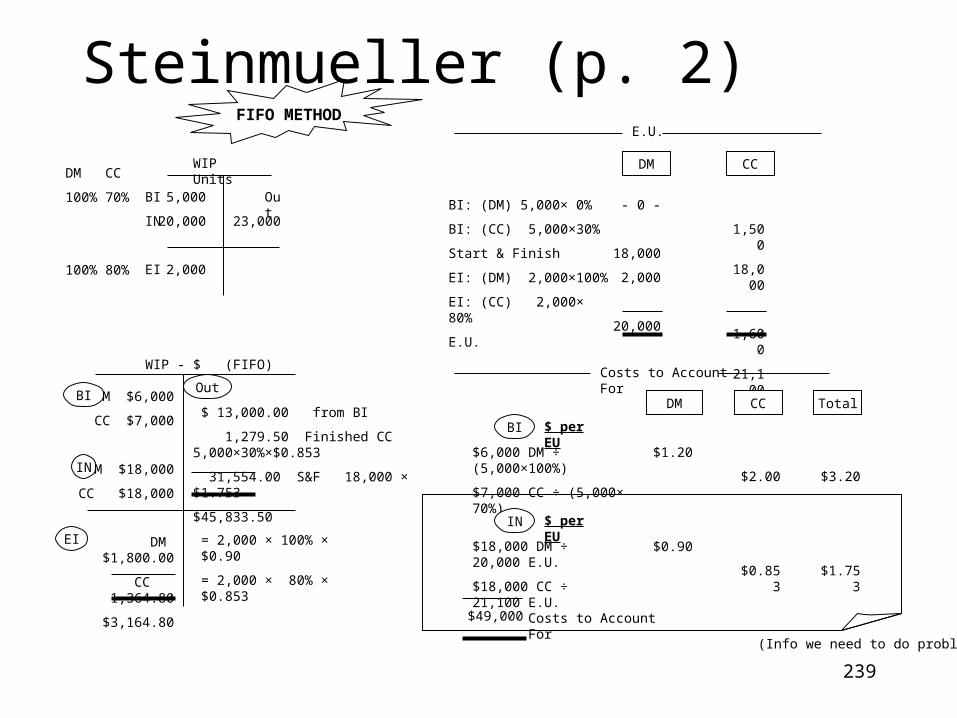
239
Steinmueller (p. 2)
WIP Units
5,000
20,000
2,000
23,000
OutBI
IN
EI
DM
100%
100%
CC
70%
80%
WIP - $ (FIFO)
DM $6,000
CC $7,000
DM $18,000
CC $18,000
DM $1,800.00
CC 1,364.80
$3,164.80
$ 13,000.00 from BI
1,279.50 Finished CC 5,000×30%×$0.853
31,554.00 S&F 18,000 × $1.753
$45,833.50
= 2,000 × 100% × $0.90
= 2,000 × 80% × $0.853
OutBI
IN
EI
E.U.
DM CC
- 0 -
18,000
2,000
20,000
1,500
18,000
1,600
21,100
Costs to Account For
DM CC
$1.20
$2.00
$ per EU
BI: (DM) 5,000× 0%
BI: (CC) 5,000×30%
Start & Finish
EI: (DM) 2,000×100%
EI: (CC) 2,000× 80%
E.U.
FIFO METHOD
BI
$6,000 DM ÷ (5,000×100%)
$7,000 CC ÷ (5,000× 70%)
Total
$3.20
$0.90
$0.853
$ per EUIN
$18,000 DM ÷ 20,000 E.U.
$18,000 CC ÷ 21,100 E.U. $1.753
(Info we need to do problem)
$49,000 Costs to Account For

240
Stetson Company
Stetson Company Absorption Costing I/S For the Y/E Dec. 31, 2001
Rev
- CoGS
GM
- S&A
NI
$17,000
(- 0 -)(6,000)
(4,000)$ 7,000
(1,000) (1,400)
$ 4,600
= 2,000 units × $8.50
= BI ( - none - )= 2,000 units × $3 per unitUnderapplied MOH (4,000 @ $1)
= 1,000 units sold × $0.50 per unitFixed
Normal volume is 10,000 units of production.Underapplied MOH = 10,000 – 6,000 actual production = 4,000 units
Stetson Company Absorption Costing I/S For the Y/E Dec. 31, 2002
Rev
- CoGS
GM
- S&A
NI
$25,500
(9,000)( - 0 - )
(9,100)$ 7,400
(1,500) (1,400)
$ 4,500
= 3,000 units × $8.50
= BI 3,000 units × $3 per unit= - 0 - units × $3 per unitUnderapplied MOH (9,100 @ $1)
= 3,000 units sold × $0.50 per unitFixed
Normal volume is 10,000 units of production.Underapplied MOH = 10,000 – 900 actual production = 9,100 units

241
Stetson Company (p. 2)
Stetson Company Variable Costing I/S For the Y/E Dec. 31, 2002
Rev
- VC
CM
- FC
NI
= 3,000 units × $8.50
CoGS (3,000 units × $2 per unitS&A (3,000 units × $0.50 per unit)
MOHS&A
The difference in NI 2001:
Units mfg. - units sold× FOH per unitDifference in NI
4,000 $1.00$ 4,000
$ 25,500
(6,000) (1,500)$ 18,000
(10,000) (1,400)
$ 6,600
Stetson Company Variable Costing I/S For the Y/E Dec. 31, 2001
Rev
- VC
CM
- FC
NI
= 2,000 units × $8.50
CoGS (2,000 units × $2.00 per unit)S&A (2,000 units × $0.50 per unit)
MOHS&A
$ 17,000
(4,000) (1,000)$ 12,000
(10,000) (1,400)
$ 600
The difference in NI 2002:
Units mfg. - units sold× FOH per unitDifference in NI
2,100 $1.00$2,100
Production > SalesAbs. NI is higher!
Sales > ProductionVC NI is higher!
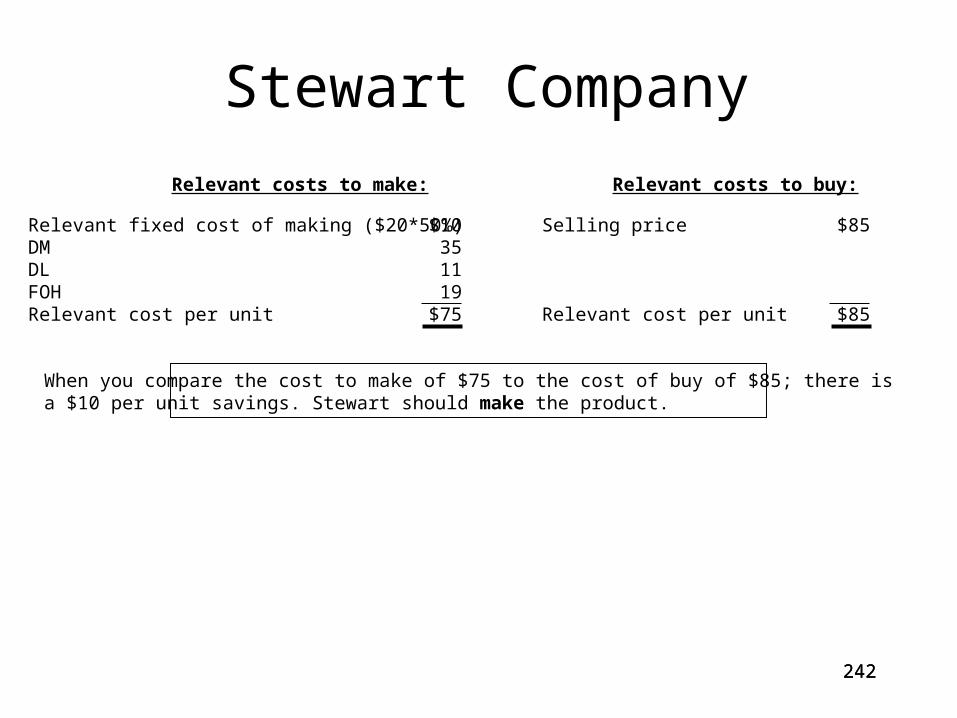
242242
Stewart Company
Relevant fixed cost of making ($20*50%)DMDLFOHRelevant cost per unit
$10351119
$75
When you compare the cost to make of $75 to the cost of buy of $85; there isa $10 per unit savings. Stewart should make the product.
Relevant costs to make:
Selling price
Relevant cost per unit
$85
$85
Relevant costs to buy:
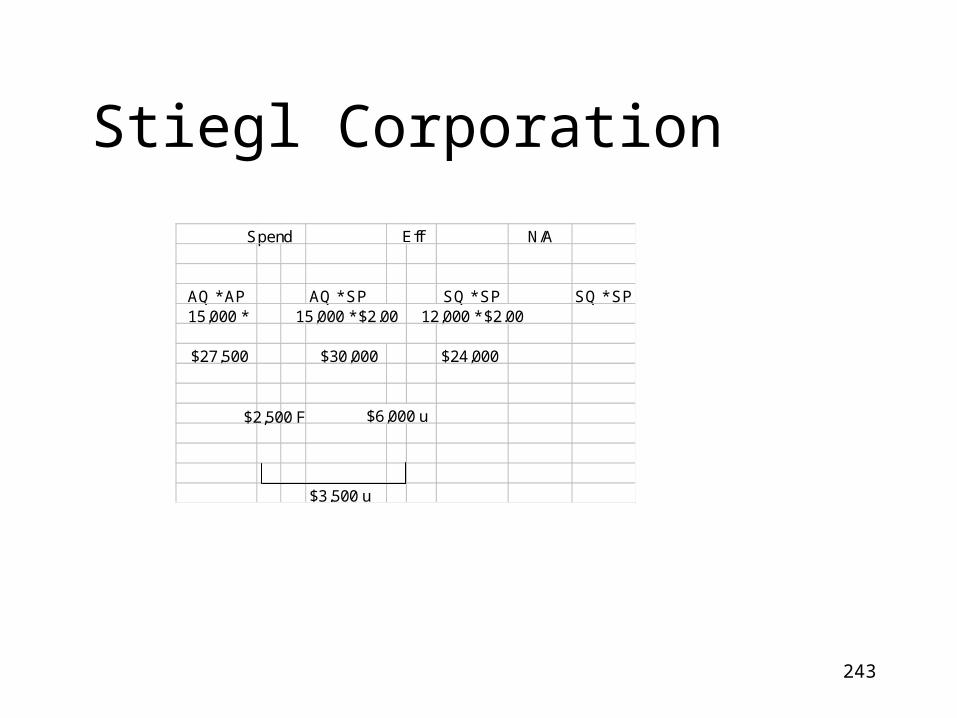
243
Stiegl Corporation
Spend N/A
AQ * AP AQ * SP SQ * SP SQ * SP15,000 * 15,000 * $2.00 12,000 * $2.00
$27,500 $30,000 $24,000
$6,000 u
$3,500 u
Eff
$2,500 F

244244
Stone Monument (A)
1.
2.
BE (units) = FC + NI
CMU
= $6,000,000
$1,000
= 6,000 units
BE ($) = FC + NI
CMR
= $6,000,000
$2,000 - $1,000
= $12,000,000
= 30%BE (units)
NormalCapacity
BE unitsas a % ofnormalcapacity
=6,000
20,000
=
$2,000

245245
Stone Monument (B)
1.
2.
BE (units) = FC + NI
CMU=
$6,000,000 + $1,400,000
$1,000= 7,400 units
BE ($) = = = $14,800,000
FC + NI
CMR
$6,000,000 + $1,400,000
$2,000 - $1,000
$2,000
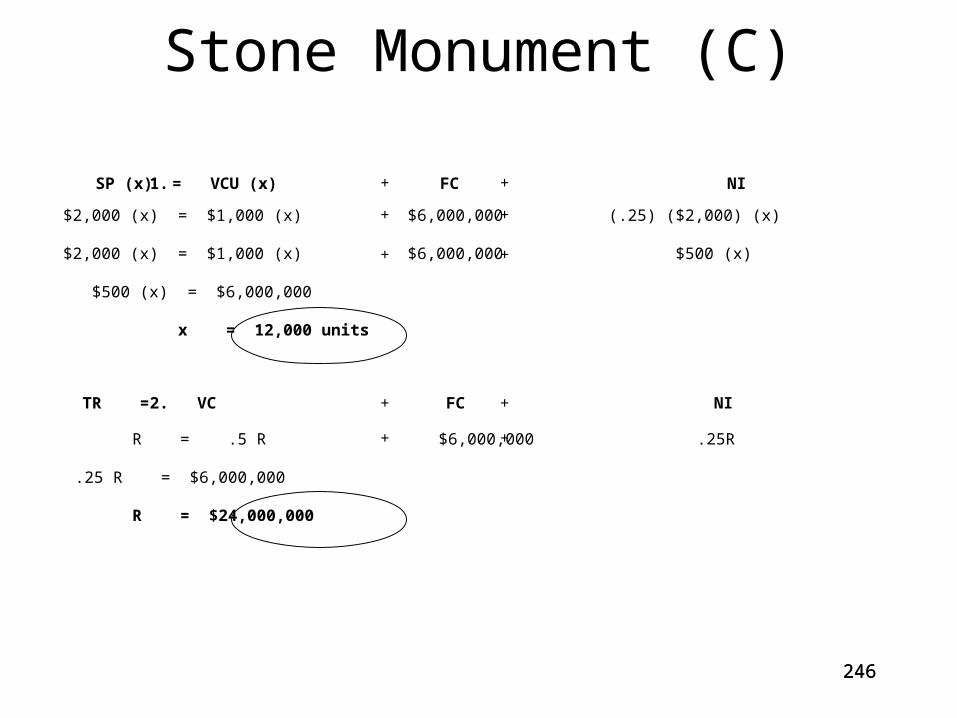
246246
Stone Monument (C)
1.
2.
SP (x) = VCU (x) FC NI
$2,000 (x) = $1,000 (x) $6,000,000 (.25) ($2,000) (x)
$2,000 (x) = $1,000 (x) $6,000,000 $500 (x)
$500 (x) = $6,000,000
x = 12,000 units
+
+
+
+
+
+
TR = VC FC NI
R = .5 R $6,000,000 .25R
.25 R = $6,000,000
R = $24,000,000
+
+
+
+

247247
Stone Monument (D)
2.
1. SP (x) = VCU (x) FC NI
$2,000 (x) = $1,000 (x) $6,000,000 (.25) ($2,000) (x)
$2,000 x = $1,000 x $6,000,000 $400 x
$600 x = $6,000,000
x = 10,000 units
+
+
+
+
+
+
Sales($) = Units SP
Sales($) = 10,000 $2,000
Sales($) = $20,000,000
*
*

248248
Stone Monument (E)
SP (x) = VCU (x) + FC + NI
SP (20,000) = $1,000 (20,000) + $6,000,000 + $21,000,000
SP = $47,000,000
20,000
SP = $2,350

249249
Stone Monument (F)
1.
2.
MS ($) = Actual Revenue - BE Revenue
MS ($) = $40,000,000* - $12,000,000** MS ($) = $28,000,000
MS Ratio = Actual Revenue - BE Revenue
MS Ratio = $40,000,000 - $12,000,000
Actual Revenue
$40,000,000
MS Ratio = 70%Quite Good!!
*($2,000 SP x 20,000 normal volume)
** (from (A))

250250
Stone Monument (G)
1.
2.
BE (units) = FC + NI
CMU=
$6,000,000 + $2,000,000
$1,000
= 8,000 units
BE ($) = FC + NI
CMR= = $16,000,000
NIBT = NIAT
1- Tax Rate=
$1,400,000
1 - 0.30
First, …
= $2,000,000
$6,000,000 + $2,000,000
$2,000 - $1,000
$2,000

251
Strange Fire, P.C.
Variable Overhead
Spending Efficiency N/A
Actual VOH AQ × SC SQ × SC 2900 × $20 2800 × $20
$54,000 $58,000 $56,000
$4,000 F $2,000 U
2,000 F
Flexible Budget Variance = $2,000 F

252
Stuffing Company (A)
Present0
Year1
Year2
Year3
Purchase
Savings
Total
PV Factor
NPV Calc.
$(60,000)
$(60,000)
× 1.0000
$(60,000)
$25,000
$25,000
× 0.9091
$22,727.50
$25,000
$25,000
× 0.7513
$18,782.50
$25,000
$25,000
× 0.8264
$20,660.00 = $2,170
From PV Table
≥ $0 ☺
OR use Annuity Table
PurchaseSavingsPV FactorNPV Calc.
$25,000× 2.4869
$62,172.50
per year for 3 years$(60,000)
× 1.0000 $(60,000) = $2,172.50 ☺
+ ++

253
Stuffing Company (B)•TRIAL & ERROR•THE HIGHER THE INTEREST RATE, THE LOWER THE PV
We know 10% is TOO LOW (why, because it yields a positive NPV)
So we try 11% … $25,000× 2.4437
$61,092.50(11% for 3 yr. annuity)
vs. $(60,000) STILL TOO LOW
So we try 12% … $25,000× 2.4018
$60,200(12% for 3 yr. annuity)
vs. $(60,000) Still A BIT too low
So we try 13% … $25,000× 2.3612
$59,025(13% for 3 yr. annuity)
vs. $(60,000) Now A BIT too HIGH
Closer to 12% than 13%

254
Stuffing Company (C)
Investment A: 2 years
$ 20,000 in Year 1 80,000 in Year 2 $100,000 Total
Investment B: 2 years
$ 90,000 in Year 1 10,000 in Year 2 $100,000 Total
Investment B BETTER because get money sooner
Payback Period = Original Investment ÷ Periodic Cash Flow
Investment C: 3 years
$100,000 ÷ $39,000 = 2.5641 years

255
Stuffing Company (D)
Accounting Rate of Return (ARR) = Avg. NI ÷ Investment
[ARR aka Simple Rate of Return]
Avg. NI =$80,000
5 yrs. = $16,000 NI per year
Average NIInvestment
= $16,000 $100,000 = 16% ARRARR =

256
Stuffing Company (E)
Profitability Index = PV of CF
Investment
Project 1:
Project 2:
Project 3:
$567,270 ÷ $480,000 = 1.182
$336,140 ÷ $270,000 = 1.245
$379,760 ÷ $400,000 = 0.949
RANKING:
NPV
PI
IRR
Project 1
1
2
2
Project 2
2
1
1
Project 3
3
3
3
1.
2.
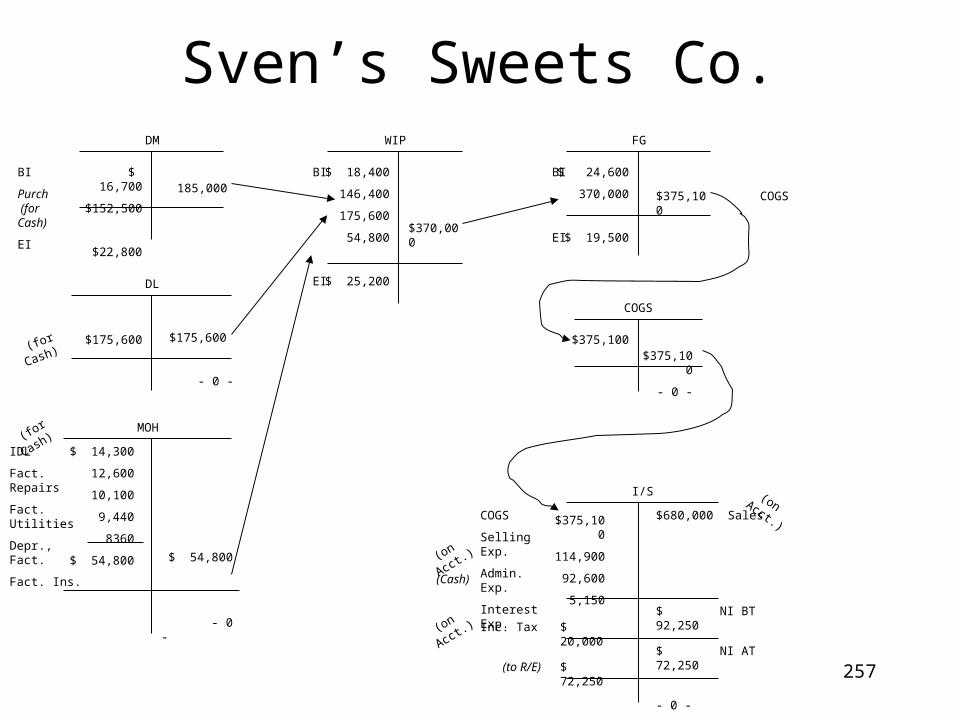
257
$ 16,700
$152,500
$22,800
185,000
DM
BI
Purch (for Cash)
EI
$ 18,400
146,400
175,600
54,800
$ 25,200
$370,000
BI
EI
WIP
$ 24,600
370,000
$ 19,500
$375,100
BI
EI
FG
$175,600 $175,600
- 0 -
DL
MOH
$ 14,300
12,600
10,100
9,440
8360
$ 54,800 $ 54,800
- 0 -
IDL
Fact. Repairs
Fact. Utilities
Depr., Fact.
Fact. Ins.
COGS
I/S
$375,100
114,900
92,600
5,150
$680,000COGS
Selling Exp.
Admin. Exp.
Interest Exp.
Sales
NI BT
$375,100
- 0 -
$375,100
COGS
Sven’s Sweets Co.
(for Cash)
(for C
ash)
(on Acct.)
(on Acct.)
$ 92,250$ 20,000Inc. Tax (o
n Acct.)
NI AT$ 72,250$ 72,250
- 0 -
(Cash)
(to R/E)
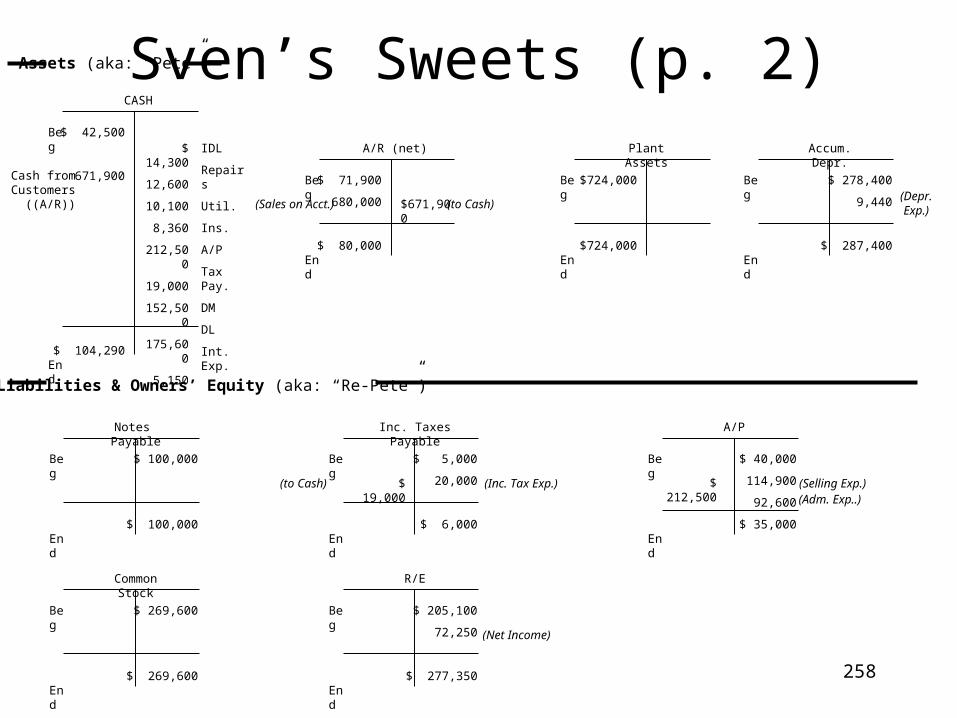
258
Sven’s Sweets (p. 2)$ 42,500
671,900
$ 104,290
$ 14,300
12,600
10,100
8,360
212,500
19,000
152,500
175,600
5,150
Beg
End
CASH
Assets (aka: “Pete”)
$ 71,900
680,000
$ 80,000
$671,900
Beg
End
A/R (net)
$724,000
$724,000
Beg
End
Plant Assets
$ 278,400
9,440
$ 287,400
Beg
End
Accum. Depr.
Cash fromCustomers
((A/R))
IDL
Repairs
Util.
Ins.
A/P
Tax Pay.
DM
DL
Int. Exp.
Liabilities & Owners’ Equity (aka: “Re-Pete”)
$ 100,000
$ 100,000
Beg
End
Notes Payable
$ 5,000
20,000
$ 6,000
Beg
End
Inc. Taxes Payable
$ 40,000
114,900
92,600
$ 35,000
Beg
End
A/P
$ 269,600
$ 269,600
Beg
End
Common Stock
$ 205,100
72,250
$ 277,350
Beg
End
R/E
$ 19,000 $ 212,500(Inc. Tax Exp.)(to Cash)
(to Cash)(Sales on Acct.)(Depr.Exp.)
(Net Income)
(Selling Exp.)(Adm. Exp..)
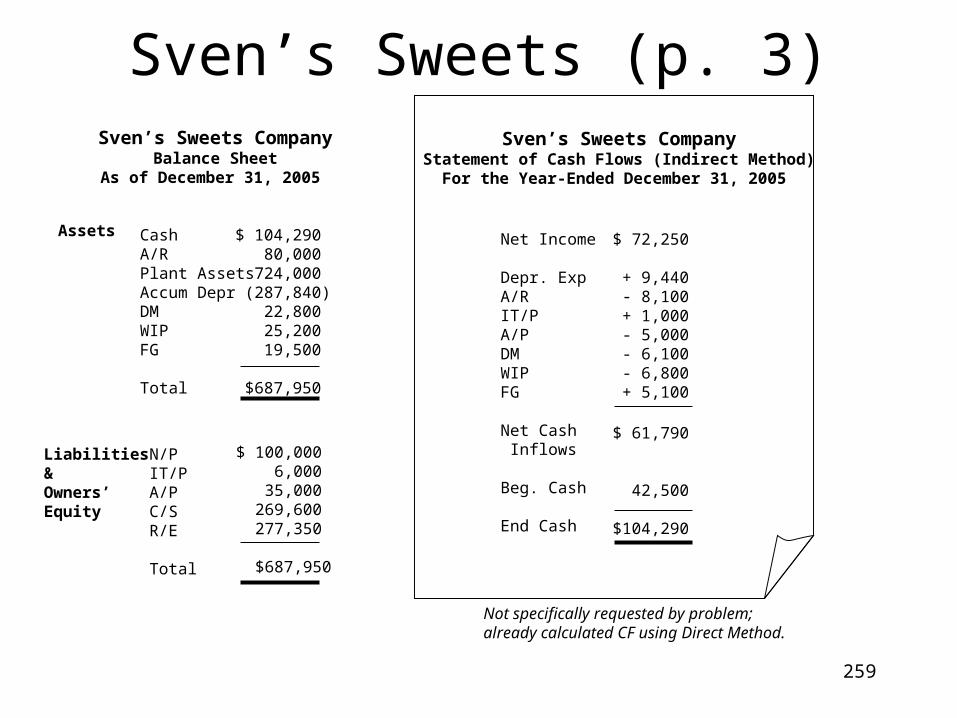
259
Sven’s Sweets (p. 3)Sven’s Sweets Company
Balance SheetAs of December 31, 2005
Assets CashA/RPlant AssetsAccum DeprDMWIPFG
Total
$ 104,290 80,000
724,000 (287,840)
22,800 25,200 19,500
$687,950
Liabilities& Owners’Equity
N/PIT/PA/PC/SR/E
Total
$ 100,000 6,000
35,000 269,600 277,350
$687,950
Sven’s Sweets CompanyStatement of Cash Flows (Indirect Method)
For the Year-Ended December 31, 2005
Net Income
Depr. ExpA/RIT/PA/PDMWIPFG
Net Cash Inflows
Beg. Cash
End Cash
$ 72,250
+ 9,440- 8,100+ 1,000- 5,000- 6,100- 6,800+ 5,100
$ 61,790
42,500
$104,290
Not specifically requested by problem;already calculated CF using Direct Method.

260
Sweet Surrender, Inc.
SWEET SURRENDER, INC.Balance Sheet
December 31, 2003
AssetsCurrent Assets: Cash ………………………… Accounts receivable ………… Inventories …………………..Current Assets ………………...Noncurrent assets …………….Total assets ……………………
Liabilities and Equity
Current liabilities ..……………Noncurrent liabilities …………Total liabilities.………………..
Total equity …………………..Total Liabilities and Equity …..
$ 85,000125,000
75,000$285,000$495,000$780,000
$237,500 22,500
$260,000
$520,000$780,000
Where? How?(Given)Note 5Note 4[Calc.: Note 7]Note 8 [Plug]Note 6 [Calc. = Total L+E]
Note 9Note 10 [Plug]Note 3
Note 2[Calc.: Note 6]

261
Return on end-of-year equity = Net income ÷ End of year equity 0.5 (#) = $260,000 (from Note 1) ÷ End of year equity Equity = $520,000
Total debt to equity ratio = Total liabilities ÷ Stockholders’ equity 0.5 (#) = Total liabilities ÷ $520,000 (from Note 2) Total liabilities = $260,000
Days’ sales in inventory = (Inventory × 360) ÷ Cost of goods sold 15 days (#) = (Inventory × 360) ÷ $1,800,000 (from Note 1) End Inventory = $75,000
Days’ sales in receivables = (Accounts receivable × 360) ÷ Sales 15 days (#) = (Inventory × 360) ÷ $3,000,000 (from Note 1) End Accounts receivable = $125,000
Note 1: Compute net income for 2003
Sales …………………..Cost of goods sold ……Gross profit …………..Operating expenses …..Income before taxes ….Taxes expense ………..Net income ……………
$3,000,000 1,800,000$1,200,000 800,000$ 400,000 140,000$ 260,000
(= COGS + Gross profit)(#) (60% of sales (100% - Gross profit margin ratio))(40% of sales (#) Gross profit margin ratio)(#)(Calculation)(tax at 35% rate (#))
Sweet Surrender (p. 2)SUPPORTINGCOMPUTATIONS
Note 2:
Note 3:
Note 4:
(#) — piece(s) of information provided in problem
Note 5:
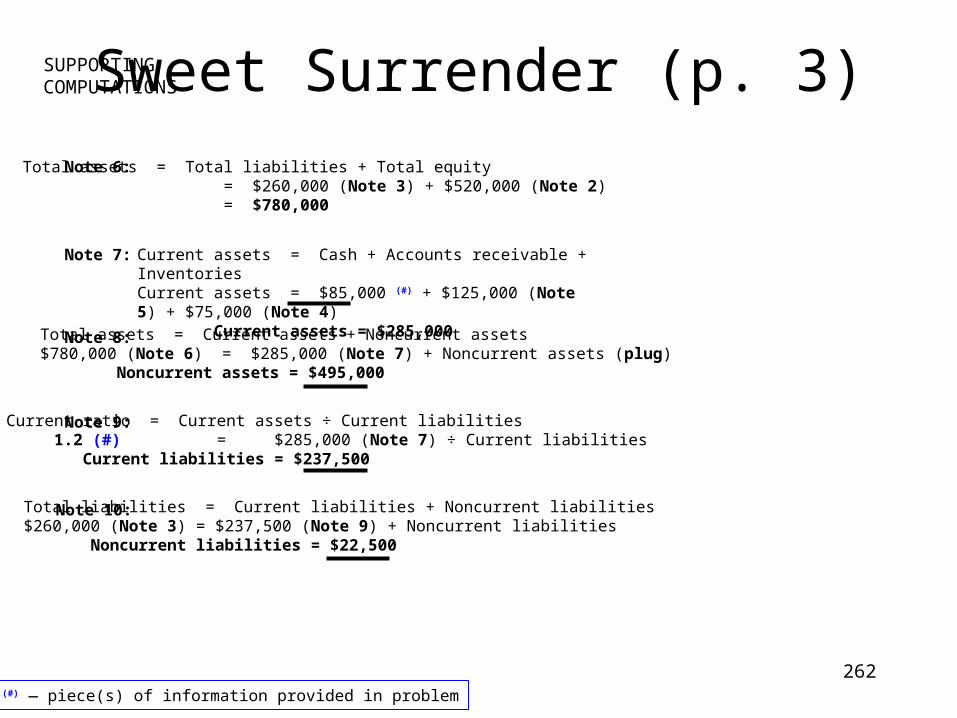
262
Note 10: Total liabilities = Current liabilities + Noncurrent liabilities$260,000 (Note 3) = $237,500 (Note 9) + Noncurrent liabilities Noncurrent liabilities = $22,500
Current assets = Cash + Accounts receivable + InventoriesCurrent assets = $85,000 (#) + $125,000 (Note 5) + $75,000 (Note 4) Current assets = $285,000
Current ratio = Current assets ÷ Current liabilities 1.2 (#) = $285,000 (Note 7) ÷ Current liabilities Current liabilities = $237,500
Sweet Surrender (p. 3)
Note 7:
Total assets = Current assets + Noncurrent assets$780,000 (Note 6) = $285,000 (Note 7) + Noncurrent assets (plug) Noncurrent assets = $495,000
SUPPORTINGCOMPUTATIONS
Note 9:
Note 8:
Total assets = Total liabilities + Total equity = $260,000 (Note 3) + $520,000 (Note 2) = $780,000
Note 6:
(#) or (#) — piece(s) of information provided in problem

263263
The Swizzle Manufacturing Co.
$ 10,000
200,000
$ 25,000
185,000
DM
BI
Purch
EI
$ 15,000
185,000
230,000
385,200
$ 22,000
$793,200
BI
EI
WIP
$ 30,000
793,200
$ 43,200
$780,000
BI
EI
FG
$230,000
(21,400 hrs)
$230,000
DL
MOH
$ 63,000
90,000
54,000
76,000
102,000
385,000 21,400 * $18
= $385,200
$ 200
Utilities
IDL
Maint.
Depr.
Rental
COGS
I/S
$779,800
7,000
110,000
136,000
19,000
18,000
$1,200,000
$ 130,200
COGS
Utilities
S&A Salaries
Advertising
Depr.
Rental
Sales
OI
Est.OH
Est Activity
$360,000
20,000 DLH
= $18 per DLH
200
$779,800
$ 200
$780,000
$779,800 Adj. COGS
PDOR =
=
COGSCOGM
- 0 -
- 0 -
- 0 -
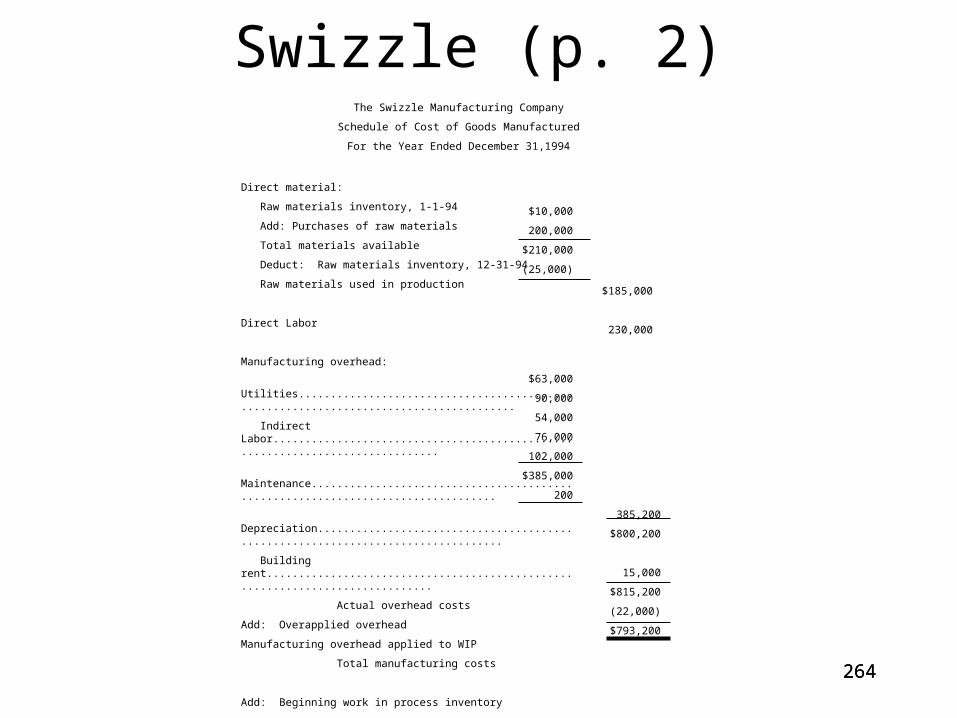
264264
Swizzle (p. 2)The Swizzle Manufacturing Company
Schedule of Cost of Goods Manufactured
For the Year Ended December 31,1994
Direct material:
Raw materials inventory, 1-1-94
Add: Purchases of raw materials
Total materials available
Deduct: Raw materials inventory, 12-31-94
Raw materials used in production
Direct Labor
Manufacturing overhead:
Utilities......................................................................................
Indirect Labor..............................................................................
Maintenance.................................................................................
Depreciation.................................................................................
Building rent..............................................................................
Actual overhead costs
Add: Overapplied overhead
Manufacturing overhead applied to WIP
Total manufacturing costs
Add: Beginning work in process inventory
Deduct: Ending work in process inventory
Cost of Goods Manufactured
$10,000
200,000
$210,000
(25,000)
$185,000
230,000
$63,000
90,000
54,000
76,000
102,000
$385,000
200
385,200
$800,200
15,000
$815,200
(22,000)
$793,200
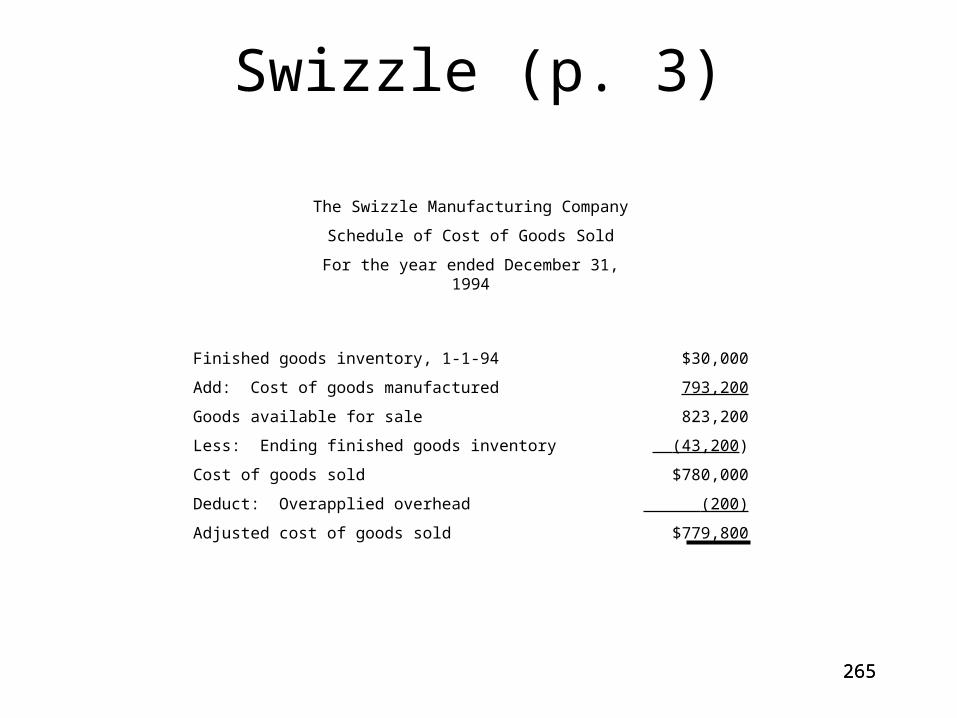
265265
Swizzle (p. 3)
The Swizzle Manufacturing Company
Schedule of Cost of Goods Sold
For the year ended December 31, 1994
Finished goods inventory, 1-1-94
Add: Cost of goods manufactured
Goods available for sale
Less: Ending finished goods inventory
Cost of goods sold
Deduct: Overapplied overhead
Adjusted cost of goods sold
$30,000
793,200
823,200
(43,200)
$780,000
(200)
$779,800
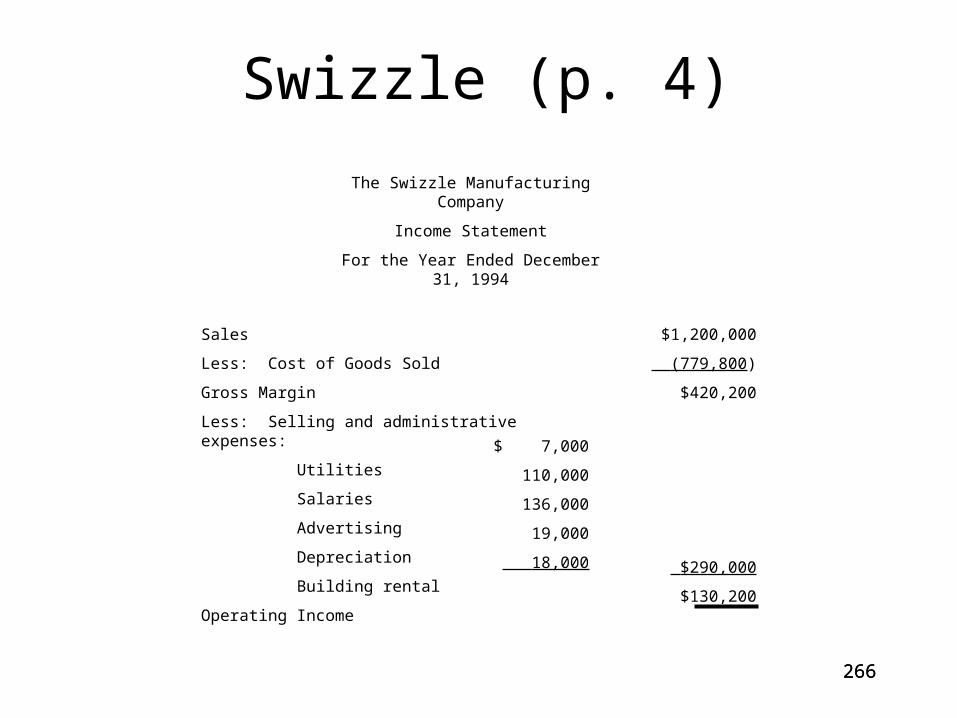
266266
Swizzle (p. 4)
The Swizzle Manufacturing Company
Income Statement
For the Year Ended December 31, 1994
Sales
Less: Cost of Goods Sold
Gross Margin
Less: Selling and administrative expenses:
Utilities
Salaries
Advertising
Depreciation
Building rental
Operating Income
$1,200,000
(779,800)
$420,200
$290,000
$130,200
$ 7,000
110,000
136,000
19,000
18,000
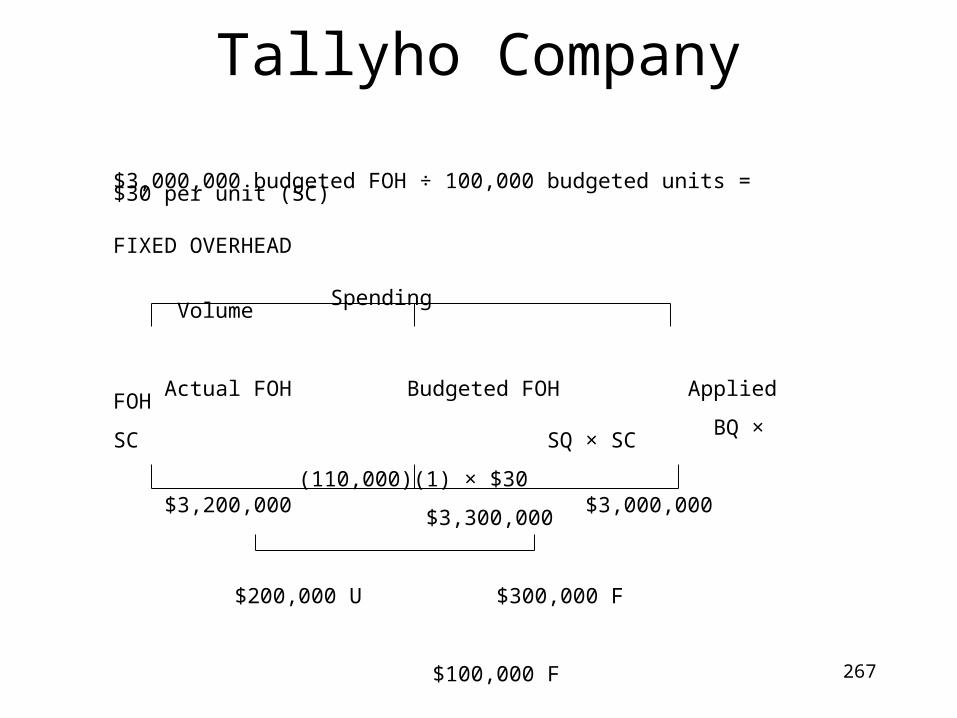
267
Tallyho Company
$3,000,000 budgeted FOH ÷ 100,000 budgeted units = $30 per unit (SC)
FIXED OVERHEAD Spending Volume Actual FOH Budgeted FOH Applied FOH BQ × SC SQ × SC (110,000)(1) × $30 $3,200,000 $3,000,000 $3,300,000
$200,000 U $300,000 F
$100,000 F
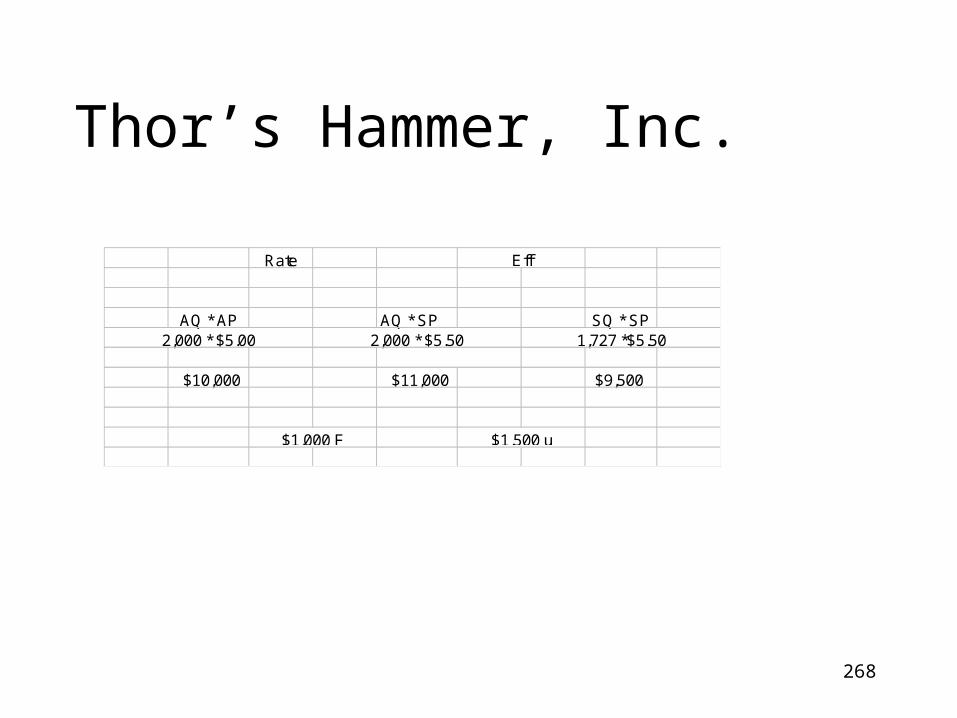
268
Thor’s Hammer, Inc.
Rate
AQ * AP AQ * SP SQ * SP2,000 * $5.00 2,000 * $5.50 1,727 *$5.50
$10,000 $11,000 $9,500
$1,000 F
Eff
$1,500 u

269269
Tigér Boats
$12,500 Selling price per boat(11,500) Variable cost per boat ($5,000 + $5,500 + $1,000)
Fixed manufacturing overhead will not change and thus isnot relevant.
$ 1,000 Contribution per boat
Contribution margin per boat is positive, therefore the offer shouldbe accepted.
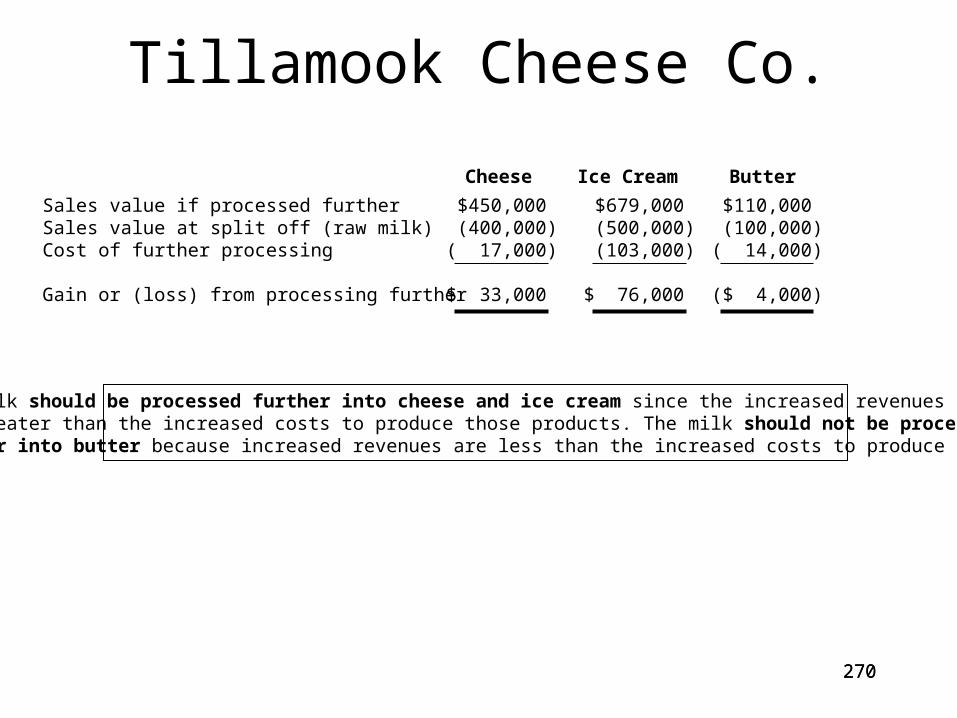
270270
Tillamook Cheese Co.
Sales value if processed furtherSales value at split off (raw milk)Cost of further processing
Gain or (loss) from processing further
$450,000 (400,000)( 17,000)
$ 33,000
Cheese Ice Cream Butter
$679,000 (500,000)(103,000)
$ 76,000
$110,000 (100,000)( 14,000)
($ 4,000)
The milk should be processed further into cheese and ice cream since the increased revenuesare greater than the increased costs to produce those products. The milk should not be processedfurther into butter because increased revenues are less than the increased costs to produce butter.
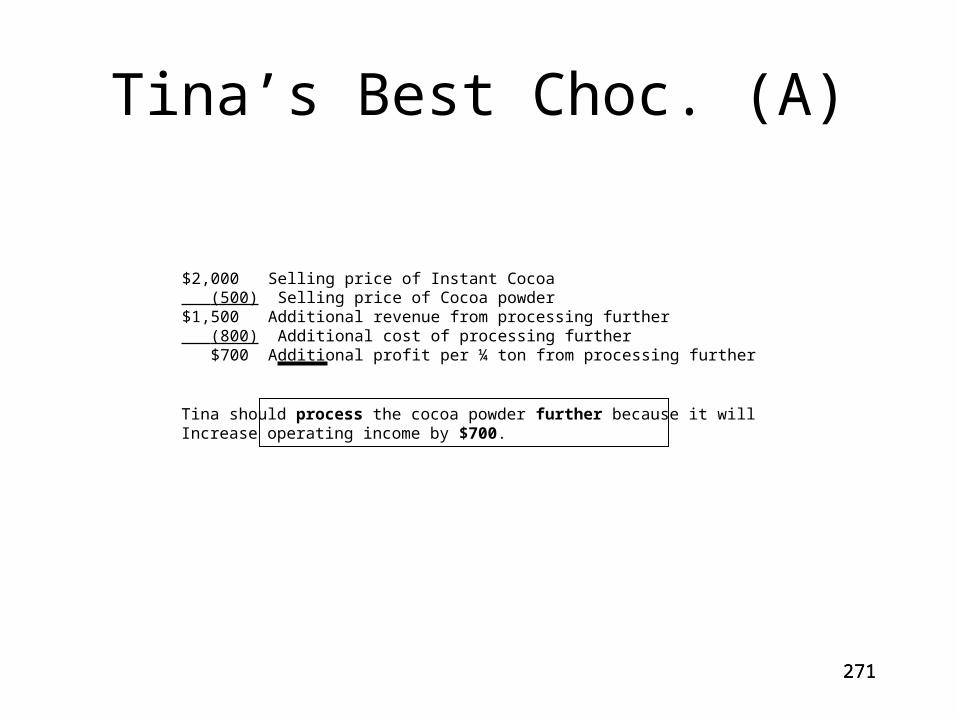
271271
Tina’s Best Choc. (A)
$2,000 Selling price of Instant Cocoa (500) Selling price of Cocoa powder$1,500 Additional revenue from processing further (800) Additional cost of processing further $700 Additional profit per ¼ ton from processing further
Tina should process the cocoa powder further because it willIncrease operating income by $700.

272272
Tina’s Best Choc. (B)
Contribution margin per case
Machine hours required per case
Revenue per machine hour
THE DARK
$2.00
.05 MH
$40.00
THE LIGHT
$1.00
.02 MH
$50.00
Tina should produce The Light because its revenue permachine hour (the constraint) is higher ($50 vs. $40).
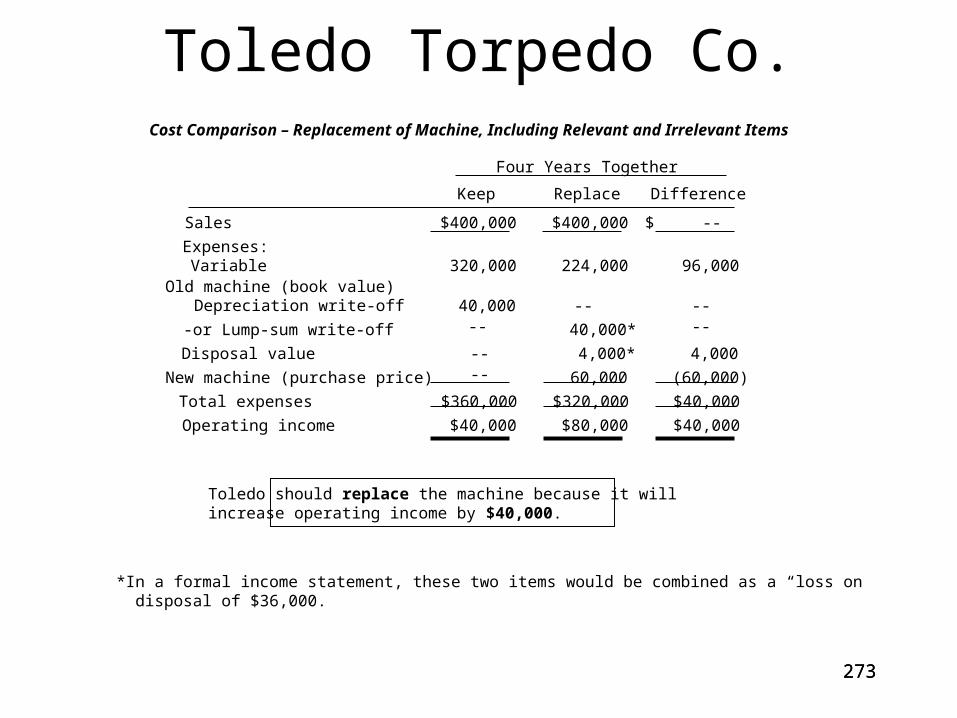
273273
Toledo Torpedo Co.Cost Comparison – Replacement of Machine, Including Relevant and Irrelevant Items
Sales
VariableOld machine (book value) Depreciation write-off
-or Lump-sum write-off
Disposal value
New machine (purchase price)
Total expenses
Operating income
Expenses:
$400,000 $400,000
320,000 224,000 96,000
40,000
4,000*
40,000*
4,000
$ --
-- -- -- --
60,000 (60,000)
$360,000 $320,000 $40,000
$40,000$40,000 $80,000
-- --
*In a formal income statement, these two items would be combined as a “loss on disposal of $36,000.
Keep Replace Difference
Four Years Together
Toledo should replace the machine because it willincrease operating income by $40,000.
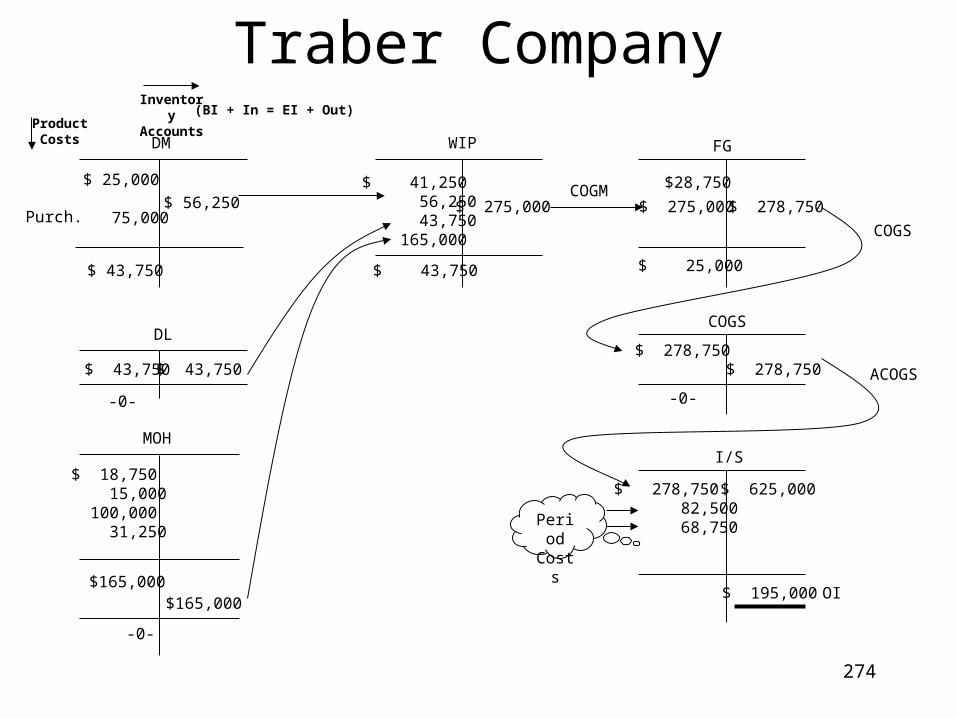
274
Traber Company
DM
DL
MOH
WIP FG
COGS
I/S
Purch.
$ 25,000
75,000$ 56,250
$ 43,750
$ 43,750 $ 43,750
-0-
$ 18,750 15,000 100,000 31,250
$165,000$165,000
-0-
$ 41,250 56,250 43,750 165,000
$ 43,750
$ 275,000
$28,750
$ 275,000 $ 278,750COGM
$ 25,000
-0-
COGS
$ 278,750 82,500 68,750
$ 625,000
$ 195,000 OI
$ 278,750$ 278,750 ACOGS
PeriodCosts
Inventory Accounts
Product Costs
(BI + In = EI + Out)
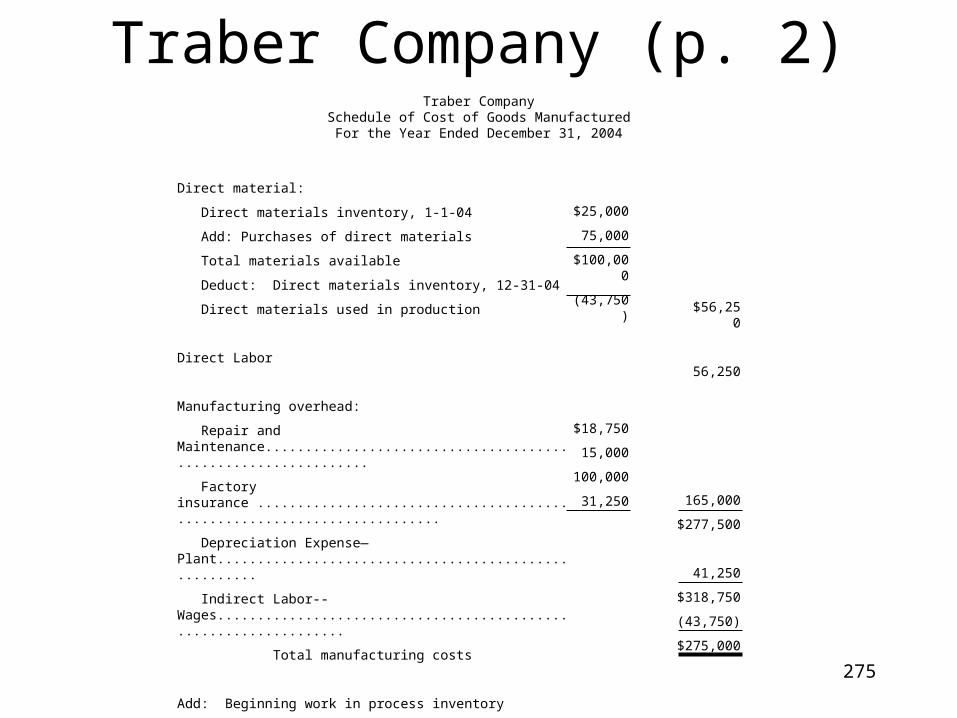
275
Traber Company (p. 2)
Direct material:
Direct materials inventory, 1-1-04
Add: Purchases of direct materials
Total materials available
Deduct: Direct materials inventory, 12-31-04
Direct materials used in production
Direct Labor
Manufacturing overhead:
Repair and Maintenance..............................................................
Factory insurance ........................................................................
Depreciation Expense—Plant......................................................
Indirect Labor--Wages.................................................................
Total manufacturing costs
Add: Beginning work in process inventory
Deduct: Ending work in process inventory
Cost of Goods Manufactured
$25,000
75,000
$100,000
(43,750)
$56,250
56,250
$18,750
15,000
100,000
31,250 165,000
$277,500
41,250
$318,750
(43,750)
$275,000
Traber CompanySchedule of Cost of Goods ManufacturedFor the Year Ended December 31, 2004
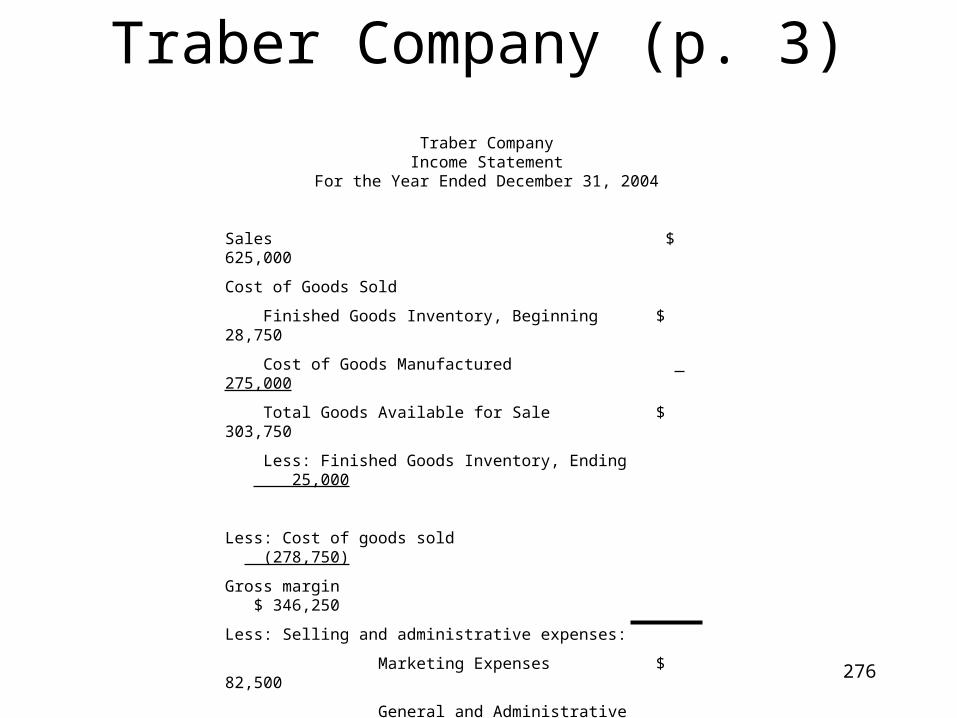
276
Traber Company (p. 3)
Traber CompanyIncome Statement
For the Year Ended December 31, 2004
Sales $ 625,000
Cost of Goods Sold
Finished Goods Inventory, Beginning $ 28,750
Cost of Goods Manufactured 275,000
Total Goods Available for Sale $ 303,750
Less: Finished Goods Inventory, Ending 25,000
Less: Cost of goods sold (278,750)
Gross margin $ 346,250
Less: Selling and administrative expenses:
Marketing Expenses $ 82,500
General and Administrative 68,750
Total Selling & Administrative Expenses (151,250)
Operating Income $ 195,000

277
True Blue Corporation
Variable Overhead
Spending Efficiency N/A
Actual VOH AQ × SC SQ × SC 400 × $3.85 420 × $3.85
$1,600 $1,540 $1,617
$60 U $77 F
$17 F
Flexible Budget Variance = $17 F
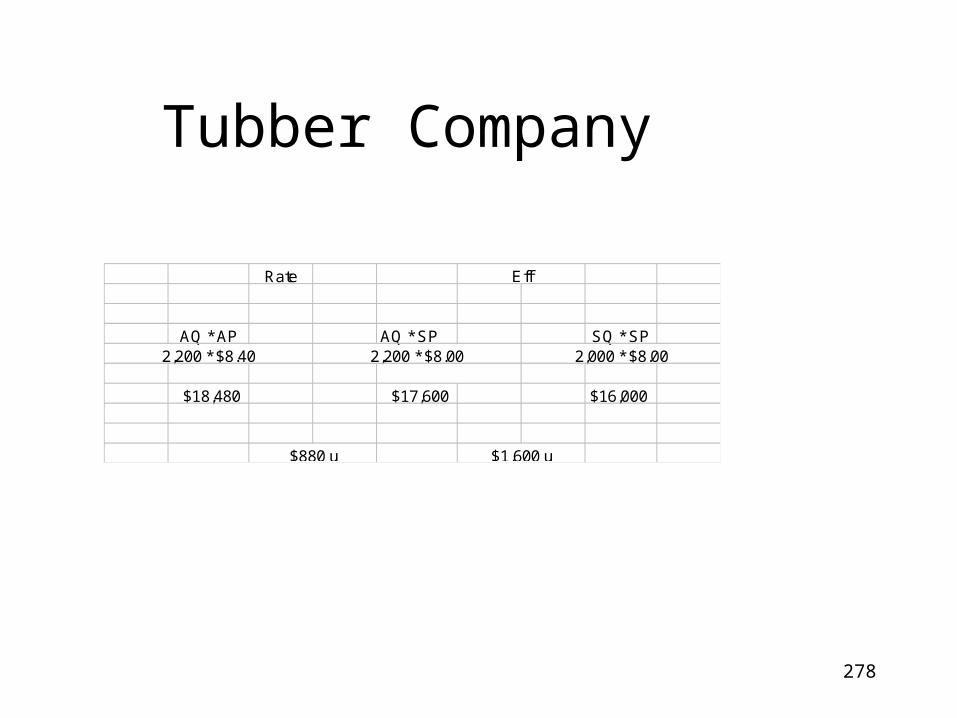
278
Tubber Company
Rate
AQ * AP AQ * SP SQ * SP2,200 * $8.40 2,200 * $8.00 2,000 * $8.00
$18,480 $17,600 $16,000
$880 u
Eff
$1,600 u
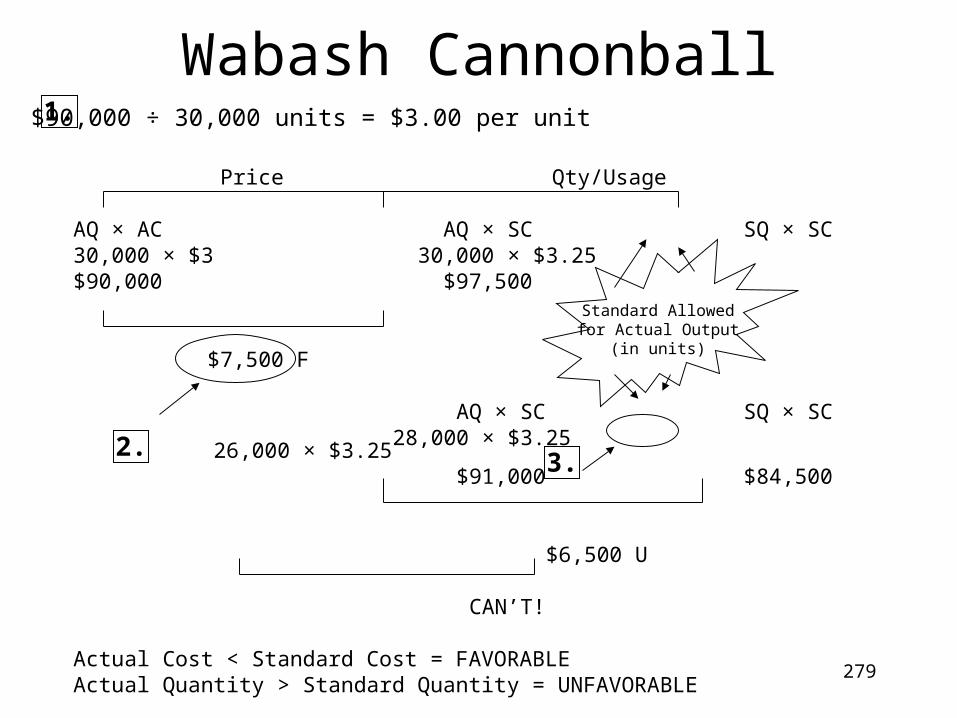
279
Wabash Cannonball1. $90,000 ÷ 30,000 units = $3.00 per unit
3.2.
Price Qty/Usage
AQ × AC AQ × SC SQ × SC30,000 × $3 30,000 × $3.25$90,000 $97,500
$7,500 F
AQ × SC SQ × SC 28,000 × $3.25 26,000 × $3.25 $91,000 $84,500
$6,500 U
CAN’T!
Actual Cost < Standard Cost = FAVORABLEActual Quantity > Standard Quantity = UNFAVORABLE
Standard Allowedfor Actual Output
(in units)
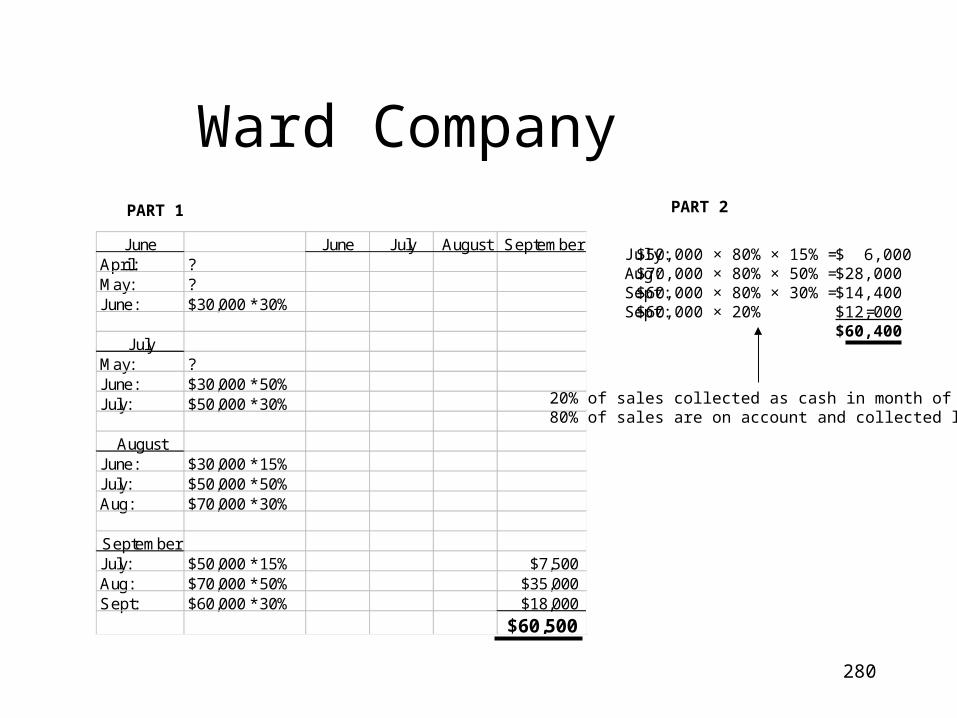
280
Ward Company
June June July August SeptemberApril: ?May: ?June: $30,000 * 30%
JulyMay: ?June: $30,000 * 50%July: $50,000 * 30%
AugustJune: $30,000 * 15%July: $50,000 * 50%Aug: $70,000 * 30%
SeptemberJuly: $50,000 * 15% $7,500Aug: $70,000 * 50% $35,000Sept: $60,000 * 30% $18,000
$60,500
PART 1 PART 2
July:Aug:Sept:Sept:
$50,000 × 80% × 15% =$70,000 × 80% × 50% = $60,000 × 80% × 30% =$60,000 × 20% =
$ 6,000$28,000$14,400$12,000$60,400
20% of sales collected as cash in month of sale80% of sales are on account and collected later

281
Whiskers Products, Inc.
April April May JuneTotal
QuarterFeb: $55,000 * 20% $11,000Mar: $60,000 * 30% $18,000 $54,000Apr: $50,000 * 50% $25,000
MayMar: $60,000 * 20% $12,000Apr: $50,000 * 30% $15,000 $57,000May: $60,000 * 50% $30,000
JuneApr: $50,000 * 20% $10,000May: $60,000 * 30% $18,000 $55,500June: $55,000 * 50% $27,500Total: $54,000 $57,000 $55,500 $166,500
2ND Quarter Cash Receipts

282
Whittle Company
650
PRODUCTION: 4,60010%*5000= 500
FG-Units
4,450

283
Young ProductsYoung Products
Sales budgetFor the First Quarter
Units 100,000Unit price x $15.00Sales $1,500,000
Young ProductsProduction Budget
For the First QuarterSales (in units) 100,000Desired end. inv. 12,000

284
Young Products (cont.)
Young ProductsDirect Materials
For the First QuarterUnits to be produced 104,000DM per unit (lbs) x 4 Production needs (lbs) 416,000Desired end. inv. 6,000 Total needs (lbs) 422,000Less: Beg. inv. (lbs) (4,000) Materials to be purch. (lbs) 418,000
Young ProductsDirect Labor BudgetFor the First Quarter
Units to be produced 104,000Labor: Time per unit x 0.5 Total hours needed 52,000
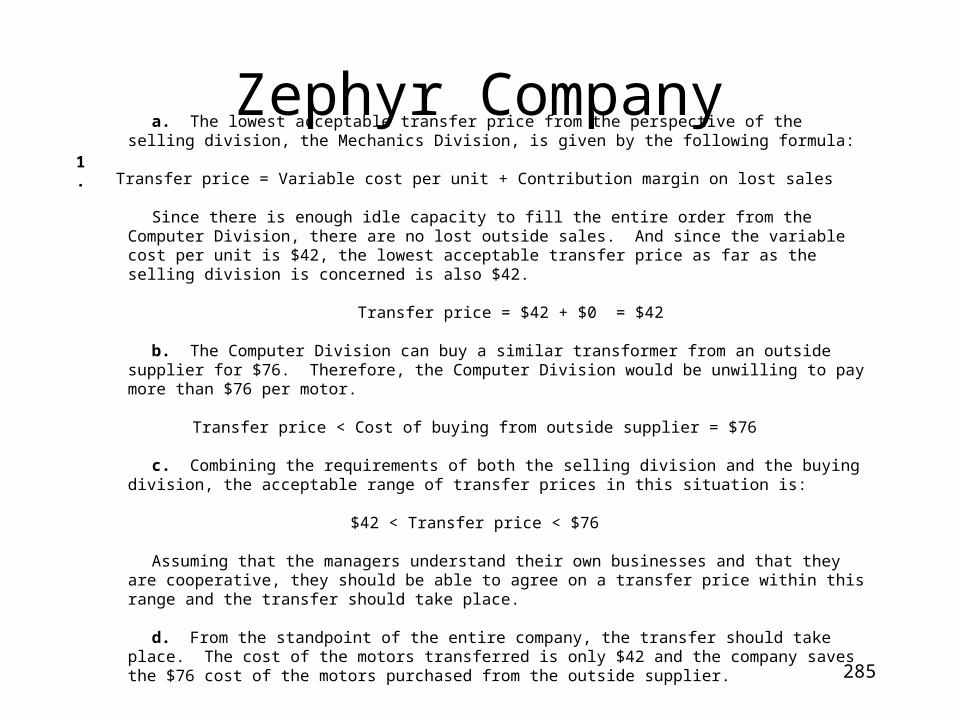
285
Zephyr Companya. The lowest acceptable transfer price from the perspective of the selling division, the Mechanics Division, is
given by the following formula:
Transfer price = Variable cost per unit + Contribution margin on lost sales
Since there is enough idle capacity to fill the entire order from the Computer Division, there are no lost outside sales. And since the variable cost per unit is $42, the lowest acceptable transfer price as far as the selling division is concerned is also $42.
Transfer price = $42 + $0 = $42
b. The Computer Division can buy a similar transformer from an outside supplier for $76. Therefore, the Computer Division would be unwilling to pay more than $76 per motor.
Transfer price < Cost of buying from outside supplier = $76
c. Combining the requirements of both the selling division and the buying division, the acceptable range of transfer prices in this situation is:
$42 < Transfer price < $76
Assuming that the managers understand their own businesses and that they are cooperative, they should be able to agree on a transfer price within this range and the transfer should take place.
d. From the standpoint of the entire company, the transfer should take place. The cost of the motors transferred is only $42 and the company saves the $76 cost of the motors purchased from the outside supplier.
1.

286
Zephyr Company (p. 2)
a. Each of the 5,000 units transferred to the Computer Division must displace a sale to an outsider at a price of $80. Therefore, the selling division would demand a transfer price of at least $80. This can also be computed using the formula for the lowest acceptable transfer price as follows:
Transfer price = $42 + ($80 - $42) = $80
b. As before, the Computer Division would be unwilling to pay more than $76 per motor.
c. The requirements of the selling and buying divisions in this instance are incompatible. The selling division must have a price of at least $80 whereas the buying division will not pay more than $76. An agreement to transfer the motors is extremely unlikely.
d. From the standpoint of the entire company, the transfer should not take place. By transferring a motor internally, the company gives up revenue of $80 and saves $76, for a loss of $4.
2.


