+ All Categories
Home > Documents > 1 3 DOCKETED - California Energy Commission 27, 2013 · Brush Generation Project Revised 1-Hour NO2...

1 3 DOCKETED - California Energy Commission 27, 2013 · Brush Generation Project Revised 1-Hour NO2...

Date post: 04-Jul-2018
Category:
Upload: duongnguyet
View: 213 times
Download: 0 times
Share this document with a friend
16
February 27, 2013 Mr. Eric Solorio California Energy Commission Docket No. 11-AFC-3 1516 9 th St. Sacramento, CA 95814 Cogentrix Quail Brush Generation Project - Docket Number 11-AFC-3, Quail Brush Generation Project Revised 1-Hour NO2 Modeling Assessment and Modeling Files Docket Clerk: Pursuant to the provisions of Title 20, California Code of Regulation, and on behalf of Quail Brush Genco, LLC, a wholly owned subsidiary of Cogentrix Energy, LLC, Tetra Tech hereby submits the Quail Brush Generation Project Revised 1-Hour NO2 Modeling Assessment and Modeling Files for the Quail Brush Power Project (11-AFC-3). The Quail Brush Generation Project is a 100 megawatt natural gas fired electric generation peaking facility to be located in the City of San Diego, California. As specific computer software is needed to open and run the modeling files, the Applicant is not serving each party with the CD but is filing with the Docket Unit and will provide a copy of the CD upon request. If you have any questions regarding this submittal, please contact Rick Neff at (704) 525-3800 or me at (303) 980-3653. Sincerely, Constance E. Farmer Project Manager/Tetra Tech DOCKETED California Energy Commission FEB. 27 2013 TN # 69714 11-AFC-03
Transcript

February 27, 2013 Mr. Eric Solorio California Energy Commission Docket No. 11-AFC-3 1516 9th St. Sacramento, CA 95814 Cogentrix Quail Brush Generation Project - Docket Number 11-AFC-3, Quail Brush Generation Project Revised 1-Hour NO2 Modeling Assessment and Modeling Files Docket Clerk: Pursuant to the provisions of Title 20, California Code of Regulation, and on behalf of Quail Brush Genco, LLC, a wholly owned subsidiary of Cogentrix Energy, LLC, Tetra Tech hereby submits the Quail Brush Generation Project Revised 1-Hour NO2 Modeling Assessment and Modeling Files for the Quail Brush Power Project (11-AFC-3). The Quail Brush Generation Project is a 100 megawatt natural gas fired electric generation peaking facility to be located in the City of San Diego, California. As specific computer software is needed to open and run the modeling files, the Applicant is not serving each party with the CD but is filing with the Docket Unit and will provide a copy of the CD upon request. If you have any questions regarding this submittal, please contact Rick Neff at (704) 525-3800 or me at (303) 980-3653. Sincerely,

Constance E. Farmer Project Manager/Tetra Tech

DOCKETEDCalifornia Energy Commission

FEB. 27 2013

TN # 69714

11-AFC-03

APPLICA

QUAIL

SERVICE L APPLICANTCogentrix EC. Richard “EnvironmenJohn CollinsLori Ziebart,Quail Brush9405 ArrowpCharlotte, Nrickneff@cojohncollins@loriziebart@

APPLICANTTetra Tech Connie FarmSr. EnvironmSarah McCaSr. Environm143 Union BLakewood, Cconnie.farmsarah.mcca Tetra Tech Barry McDoVP Solar En17885 Von Irvine, CA 9barry.mcdon

APPLICANTElla Foley GCamarin MaBingham McThree EmbaSan Francisella.gannoncamarin.ma

B

ATION FOR C

BRUSH GE

LIST:

T nergy, LLC “Rick” Neff, Vicntal, Health & Ss, VP Developm, Project Manag Generation Prpoint Boulevard

NC 28273 ogentrix.com @cogentrix.com

@cogentrix.com

T’S CONSULTEC, Inc. mer mental Project all mental PlannerBoulevard, SuitCO 80228 [email protected]@tetratech.co

EC, Inc. onald nergy DevelopmKarman Avenu2614-6213 nald@tetratech

T’S COUNSELGannon adigan cCutchen LLP arcadero Centesco, CA [email protected]@bingha

BEFORE THE CO

1

CERTIFICATI

ENERATION

ce President Safety ment ger roject d

m

TANTS

Manager

r te 1010

com om

ment ue, Ste. 500

h.com

L

er -4067 m am.com

ENERGY REOMMISSION O

516 NINTH ST 1-800-822-6

ION FOR THE

N PROJECT

INTERVENRoslind Va9360 LeticSantee, CAroslindv@g Rudy Reye8655 GravSantee, CArreyes2777 Dorian S. H7951 ShanSantee, CAdhouser@ Kevin Brew8502 MesaSantee, CAlzpup@yah Helping HaMr. Rob Si1901 First ASan Diego,rob@redw Sierra Clubc/o Law OfRobert W. 716 CastroSolana Bebob.wright

3

ESOURCES COF THE STATTREET, SACRA6228 – WWW.E

E

NORS arghese cia Drive A 92071 gmail.com

es ves Avenue, #1A 92071 [email protected]

Houser ntung Drive A 92071 cox.net

wster a Heights RoadA 92071 hoo.com

and Tools mpson, CEO Avenue, Suite 2, CA 92101 oodrob.com

b, San Diego Cffice of Robert Wright o Street ach, CA [email protected]

CONSERVATTE OF CALIFOAMENTO, CA 95ENERGY.CA.GO

Docket N

PROOF(Revis

17

m

d

219

Chapter W. Wright

5

TION AND DEORNIA 5814 OV

No. 11-AFC-

F OF SERVICsed 02/12/20

INTERVENOSunset GreeHomeownersc/o Briggs LaCory J. BriggIsabel E. O’D99 East “C” SUpland, CA cory@briggsisabel@brigg HomeFed Fac/o Allen MaMallory & NaJeffrey A. ChHeather S. R501 West BrSan Diego, Cjchine@allenhriley@allenjkaup@allenvhoy@allenm Preserve WiVan Collinsw9222 Lake CSantee, CA 9savefanita@ Center for BJohn Buse Aruna Prabh351 CalifornSan Franciscjbuse@bioloaprabhala@

EVELOPMENT

03

CE 13)

ORS (Cont’d.) ens s Association aw Corporationgs Donnell Street, Suite 191786 slawcorp.com gslawcorp.com

anita Rancho, atkins Leck Gamatsis LLP hine Riley roadway, 15th FCA 92101 nmatkins.com nmatkins.com nmatkins.com matkins.com

ld Santee worth Canyon Road 92071

@cox.net

iological Divers

hala ia Street, Suiteco, CA 94104

ogicaldiversity.obiologicaldiver

T

n

11

m

LLC mble

Floor

sity

e 600

org rsity.org

* Indicates change 2

INTERVENORS (Cont’d.) California Pilots Association Andy Wilson 31438 Greenbrier Lane Hayward, CA 94544 [email protected] INTERESTED AGENCIES California ISO [email protected] City of Santee Department of Development Services Melanie Kush, Director of Planning 10601 Magnolia Avenue, Bldg. 4 Santee, CA 92071 [email protected] City of San Diego Development Services Dept. Morris E. Dye 1222 First Avenue, MS 501 San Diego, CA 92101 [email protected] County of San Diego Department of Planning & Land Use Mindy Fogg Land Use Environmental Planner Advance Planning 5510 Overland Avenue, Suite 310 San Diego, CA 92123 [email protected] ENERGY COMMISSION STAFF Eric Solorio Project Manager [email protected] Stephen Adams Staff Counsel [email protected] ENERGY COMMISSION – PUBLIC ADVISER *Blake Roberts Assistant Public Adviser [email protected]

COMMISSION DOCKET UNIT California Energy Commission – Docket Unit Attn: Docket No. 11-AFC-03 1516 Ninth Street, MS-4 Sacramento, CA 95814-5512 [email protected] OTHER ENERGY COMMISSION PARTICIPANTS (LISTED FOR CONVENIENCE ONLY): After docketing, the Docket Unit will provide a copy to the persons listed below. Do not send copies of documents to these persons unless specifically directed to do so. KAREN DOUGLAS Commissioner and Presiding Member ANDREW McALLISTER Commissioner and Associate Member Raoul Renaud Hearing Adviser Galen Lemei Adviser to Commissioner Douglas Jennifer Nelson Adviser to Commissioner Douglas David Hungerford Adviser to Commissioner McAllister Patrick Saxton Adviser to Commissioner McAllister Eileen Allen Commissioners’ Technical Adviser for Facility Siting

I, ConstancNO2 ModeCalifornia (web page f The docum

(Check on For servic X I

de In

po

I declare uthat I am o Dated: Fe

ce Farmer, deceling Assessme(11-AFC-03). Tfor this project

ment has been

ne)

ce to all other

e-mailed the deposited it in th

nstead of e-maiostage to all of

nder penalty ofver the age of

bruary 27, 201

clare that on Feent, Cogentrix QThis document at: http://www.

sent to the oth

parties and fil

document to ahe US mail with

iling the documf the persons o

f perjury under18 years.

3

Declar

ebruary 27, 20Quail Brush Geis accompanie.energy.ca.gov

er persons on

ling with the D

ll e-mail addreh first class pos

ment, I personan the Service L

r the laws of the

3

ration of Servic

13, I served aneneration Projeed by the most v/sitingcases/qu

the Service Lis

Docket Unit at

esses on the Sstage to those

lly delivered it List for whom a

e State of Calif

ce

nd filed copies ect, City of Sanrecent Proof ouailbrush/index

st above in the

the Energy C

Service List abparties noted a

or deposited ita mailing addre

fornia that the f

of the attachedn Diego, San Dof Service, whicx.html.

following man

Commission:

bove and persoabove as “hard

t in the US maiess is given.

foregoing is tru

d Revised 1-Hoiego County,

ch I copied from

ner:

onally delivered copy required

l with first class

ue and correct,

our

m the

ed it or d”; OR

s

and

REVISED 1-HOUR NO2 MODELING ASSESSMENT

For the:

QUAIL BRUSH GENERATION PROJECT

Prepared for:

Quail Brush Genco, LLC. 9405 Arrowpoint Boulevard

Charlotte, NC 28273

Prepared by:

Atmospheric Dynamics, Inc. Torres 3 SW of Mountain View

P.O. Box 5907 Carmel-by-the-Sea, CA. 93921-5907

February 2013

1

Revised Quail Brush Generation Project 1-Hour NO2 Startup Air Quality Impact Assessment

This report describes the Quail Brush Generation Project (QBGP) air quality modeling results for the comparison to the Federal 1-hour standard of 188 ug/m3. Potential air quality impacts were evaluated based on air quality dispersion modeling, as described herein. With the exception of the binary data files, all input and output modeling files are contained on a CD-ROM disk provided with this report. The modeling analyses were performed using the techniques and methods outlined by the EPA in the June 2010 "Guidance Concerning the Implementation of the 1-hour NO2 NAAQS for the Prevention of Significant Deterioration Program" (EPA, June 2010).

DISPERSION MODELING For modeling the potential impact of QBGP in terrain that is both below and above stack top (defined as simple terrain when the terrain is below stack top and complex terrain when it is above stack top), the USEPA guideline model AERMOD (version 12345) was used with the Plume Volume Molar Ratio Method for comparison with the Federal 1-hour NO2 standard. The meteorological and receptor data sets used in this revised analysis were based on the data used in the October 2012 assessment. The purpose of the revised AERMOD modeling analysis was to evaluate compliance with the federal 1-hour NO2 air quality standard. As discussed with CEC Staff, the modeled 98th percentile daily average 1-hour NO2 modeled concentration was added to the seasonal monitored background NO2 concentrations in order to determine the total modeled impact.

Two operating profiles were assessed for compliance with the 1-hour NO2 standard: (1) six engines starting up in the same hour with the other five engines nonoperational and (2) six engines starting up in the same hour with the other five engines at full operational load. In both cases, the heaters are fully operational. The stack parameters were those used in the October 2012 application.

The worst case cold startup emissions along with the assumptions on the NO2/NOx ratios were modified with this submittal and are based upon the following procedures:

1. Only six (6) engines may start-up at any one-time (1-hour time frame).

2. Per the most recent analysis of applicable NO2/NOx ratios, QBGP has proposed to use the following ratios for the following time periods:

a. 25% for the cold startup period of 25 minutes for each engine.

b. 18.5% for the remaining 35 minutes in the startup hour for each engine.

c. These changes result in a weighted start-up hour NO2/NOx ratio of 21.2%.

3. QBGP has reduced, per item 3 above, the cold start-up time from 30 to 25 minutes. This reduction amounts to a 17% reduction in the cold start-up time.

4. QBGP has approved a reduction in the cold start-up NOx emissions of 10%, which decreases the pound/event value from 8.82 lbs to 7.94 lbs of NOx.

2

5. The pound per hour NOx emission rate used in the assessment becomes 8.7091 lb/hr or 1.09735 g/s per engine for a startup hour. Thus, each engine in startup represents 25 minutes in startup mode and 35 minutes at 100 percent base load.

6. For all other operations hours, including warm start hours, the previously established NO2/NOx ratio of 18.5% will apply.

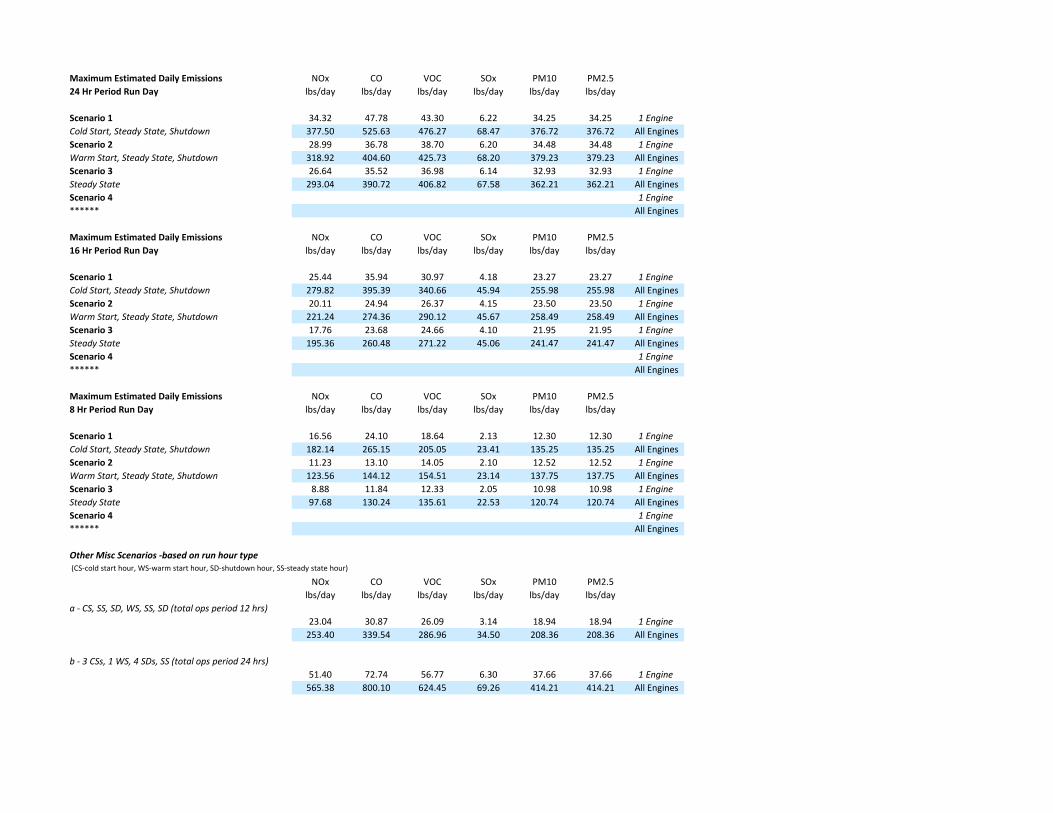
The previous worst-case hour included a shutdown, but this case was removed from the analysis as the engines will not startup, run and then shut down during any one-hour period. The updated emissions for all engines are provided as an attachment at the end of this document.

The worst case NO2 facility configuration, eleven engines at 100% load for 70°F ambient temperatures (Case I), was modeled with AERMOD. The modeling options and inputs were the same as the previous modeled, namely:

Seasonal NO2 background data for 2008-2010 (third-highest seasonal value for each hour, with the NO2 data first processed in accordance with the guidance contained in the CAPCOA Guidance Document “Modeling Compliance of The Federal 1-Hour NO2 NAAQS” dated October 27, 2011) from the Kearny Mesa site were used to assess compliance with the NAAQS based on the 5-year average of the annual 8th highest daily 1-hour maxima.

Receptor and source base elevations were determined from the USGS National Elevation Dataset (NED) data in the GeoTIFF format at a horizontal resolution of 1/3 arc-second (approximate 10 meter spacing). Because of the format of the NED data, all coordinates (both sources and receptors) were referenced to UTM North American Datum 1983 (NAD83, Zone 11). Elevation locations in the NED dataset were interpolated by AERMAP to the UTM locations appropriate for the receptor grid spacings shown below.

The receptor grids used in the modeling analysis are presented in Figure 1.

PLUME VOLUME MOLAR RATIO METHOD As with one of the existing techniques called the Ozone Limiting Method (OLM), the Plume Volume Molar Ratio Method (PVMRM) approach limits the conversion of NO to NO2 based on the amount of ambient ozone available. The OLM involves an initial comparison of the estimated maximum NOx concentration and the ambient ozone concentration to determine which is the limiting factor to NO2 formation. If the ozone concentration is greater than the maximum NOx concentration, total conversion is assumed. If the NOx concentration is greater than the ozone concentration, the formation of NO2 is limited by the ambient ozone concentration. In this case, the NO2 concentration is set equal to the ozone concentration plus a correction factor that accounts for in-stack and near-stack thermal conversion. However, the PVMRM approach limits the conversion based on the amount of ozone within the volume of the plume. With PVMRM, the NO2/NOx conversion ratio is coupled with the dispersion of the plume. The PVMRM approach also incorporates a technique for merging plumes from nearby sources for purposes of calculating the NO2/NOx ratios.

3

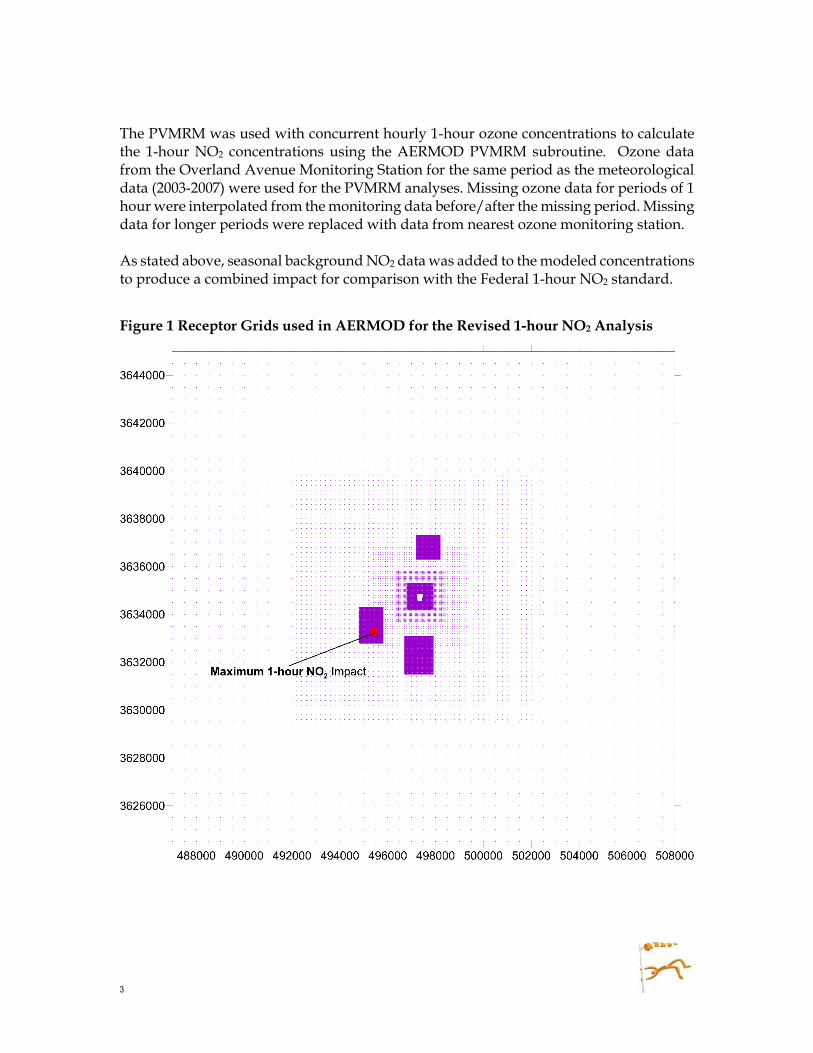
The PVMRM was used with concurrent hourly 1-hour ozone concentrations to calculate the 1-hour NO2 concentrations using the AERMOD PVMRM subroutine. Ozone data from the Overland Avenue Monitoring Station for the same period as the meteorological data (2003-2007) were used for the PVMRM analyses. Missing ozone data for periods of 1 hour were interpolated from the monitoring data before/after the missing period. Missing data for longer periods were replaced with data from nearest ozone monitoring station. As stated above, seasonal background NO2 data was added to the modeled concentrations to produce a combined impact for comparison with the Federal 1-hour NO2 standard.

Figure 1 Receptor Grids used in AERMOD for the Revised 1-hour NO2 Analysis

4

AERMOD MODELING RESULTS In order to determine which of the six (6) engines in startup mode would produce the largest impact, a series of screening runs were performed with various combinations of engines in startup and in base load operation. It was determined that the worst-case impacts would occur for the case where five (5) of the engines were at 100 percent load and the remaining six (6) were in startup. The engines are clustered into two groups, with one of the groups of six (6) engines on the western side and five (5) engines in the eastern side. Six engine startups of beginning on the western side and rotating towards the east were assessed. It became apparent that the eastern engines always produce the largest impacts for the 1-hour NO2 standard. Thus, the worst case 1-hour NO2 results are based on the five (5) engines starting up on the eastern cluster with one (1) engine starting up in the western grouping. The remaining five (5) engines are at 100 percent load.

The revised 1-hour NO2 impacts are compared below to the AAQS. Maximum impacts for both NAAQS/CAAQS occurred on the high resolution receptor grids, so no additional refined receptor grids were necessary. Figure 1 identifies the location of the maximum 1-hour NO2 impact. As can be seen in Table 1, the facility will comply with applicable state/California and Federal/ National NO2 standards.

Table 1 Comparison of NO2 Air Quality Impacts to the AAQS

Pollutant Avg.

Period

Maximum Concentration

(µg/m3)

Background (µg/m3)

Total (µg/m3)

Ambient Air Quality

CAAQS/NAAQS

(µg/m3) (µg/m3)

STARTUP QBGP CONDITIONS:

NO2 1-hour Federal 180.232 - 180.23 - 188

1-hour State 314.044 - 314.04 339 -

Notes: Background concentrations included by AERMOD for 1-hour NO2 impacts.

CONCLUSION The results of the revised startup modeling analysis for NO2 demonstrates that the proposed project will safely comply with the federal 1-hour ambient air quality standard for NO2.

Table F.1-1 (Revised 02-26-13)

Maximum Hourly, Daily, and Annual Emissions Calculations Number of Identical Engines: 11

Full Load Case

Input data per unit: Avg Avg Cold Warm Max

# of Cold # of Warm Startup Startup Shutdown Cold Warm Estimated Estimated

Operation Annual Startups Startups Time Time Time Starts Starts Shutdowns Shutdowns

hrs/day Op hrs day day hrs hrs hrs yr yr yr day

24 4032 1 1 0.416 0.25 0.1417 300 100 400 2

Cold Warm Annual

Startup Startup Shutdown Steady State Total Cold Total Warm Total Steady State

Emissions Emissions Emissions Emissions Start Start Shutdown Non SU/SD Cold Starts Warm Starts Shutdowns

lbs/event lbs/event lbs/event lbs/hr hrs/yr hrs/yr hrs/yr hrs/yr lbs/yr lbs/yr lbs/yr

(100% Load)

NOx 7.94 2.43 0.2 1.317 124.8 25 56.68 3825.52 2382.0 243.0 80.0

CO 12.57 1.322 0.31 1.564 3771.0 132.2 124.0

VOC 6.614 1.764 0.34 1.584 1984.2 176.4 136.0

SOx 0.137 0.07 0.05 0.256 41.1 7.0 20.0

PM10 1.54 1.54 0.35 1.379 462.0 154.0 140.0

PM2.5 1.54 1.54 0.35 1.379 462.0 154.0 140.0

1. SU/SD emissions data and times derived from: Wartsila Emissions Data Sheet, DBAB715360, 2-27-11.

2. Cold start (CS): engine will reach steady state in 10 minutes and controls (SCR and CO Cat) will be fully operational in 30 minutes.

3. Warm start (WS): engine will reach steady state in 10 minutes and controls (SCR and CO Cat) will be fully operational in 15 minutes.

4. A warm start is defined as a start initiated within 2-6 hours after the engine has been shutdown, or

when the emissions control system is at a temperature of no less than 270 C (518 F).

5. Shutdown time is optimally 8.5 minutes per Wartsila.

6. Cold start w/o shutdown = 0.416 hrs steady state = 0.584 hrs

7. Warm start w/o shutdown = 0.25 hrs steady state = 0.75 hrs

8. Shut down = 0.1417 hrs steady state = 0.8583 hrs

9. Steady state (SS) emissions values derived from Cogentrix/Wartsila.

10. SO2 emissions include S to SO2 from lube oil burn-off from cylinder sleeves.

Maximum Estimated Hourly Emissions NOx CO VOC SOx PM10 PM2.5

1 Hour Period lbs/hr lbs/hr lbs/hr lbs/hr lbs/hr lbs/hr

Scenario 1 8.71 13.48 7.54 0.29 2.35 2.35 1 Engine

Cold Start w/Steady State (5 Engines) 43.55 67.42 37.70 1.43 11.73 11.73 5 Engines

Cold Start w/Steady State (6 Engines) 52.25 80.90 45.23 1.72 14.07 14.07 6 Engines

Scenario 2 3.42 2.50 2.95 0.26 2.57 2.57 1 Engine

Warm Start w/Steady State 37.60 27.45 32.47 2.88 28.32 28.32 All Engines

Scenario 3 8.91 13.79 7.88 0.34 2.70 2.70 1 Engine

Cold Start, Steady State, Shutdown *** 98.00 151.73 86.67 3.70 29.65 29.65 All Engines

Scenario 4 3.62 2.81 3.29 0.31 2.92 2.92 1 Engine

Warm Start, Steady State, Shutdown *** 39.80 30.86 36.21 3.43 32.17 32.17 All Engines

Scenario 5 1.33 1.65 1.70 0.27 1.53 1.53 1 Engine

Steady State w/Shutdown 14.63 18.18 18.70 2.97 16.87 16.87 All Engines

Scenario 6 1.32 1.56 1.58 0.26 1.38 1.38 1 Engine

Steady State 14.49 17.20 17.42 2.82 15.17 15.17 All Engines

*** cannot occur, once SU is finalized, the unit(s) must run for 2 hours prior to a SD

Total Annual Emissions

Maximum Estimated Daily Emissions NOx CO VOC SOx PM10 PM2.5

24 Hr Period Run Day lbs/day lbs/day lbs/day lbs/day lbs/day lbs/day

Scenario 1 39.20 49.77 44.31 6.22 34.41 34.41 1 Engine

Cold Start, Steady State, Shutdown 431.20 547.42 487.42 68.47 378.54 378.54 All Engines

Scenario 2 33.91 38.78 39.72 6.20 34.64 34.64 1 Engine

Warm Start, Steady State, Shutdown 373.00 426.55 436.96 68.20 381.05 381.05 All Engines

Scenario 3 31.61 37.54 38.02 6.14 33.10 33.10 1 Engine

Steady State 347.69 412.90 418.18 67.58 364.06 364.06 All Engines

Scenario 4 1 Engine

****** All Engines

Maximum Estimated Daily Emissions NOx CO VOC SOx PM10 PM2.5

16 Hr Period Run Day lbs/day lbs/day lbs/day lbs/day lbs/day lbs/day

Scenario 1 28.66 37.25 31.64 4.18 23.38 23.38 1 Engine

Cold Start, Steady State, Shutdown 315.31 409.79 348.03 45.94 257.18 257.18 All Engines

Scenario 2 23.37 26.27 27.05 4.15 23.61 23.61 1 Engine

Warm Start, Steady State, Shutdown 257.10 288.92 297.57 45.67 259.70 259.70 All Engines

Scenario 3 21.07 25.02 25.34 4.10 22.06 22.06 1 Engine

Steady State 231.79 275.26 278.78 45.06 242.70 242.70 All Engines

Scenario 4 1 Engine

****** All Engines

Maximum Estimated Daily Emissions NOx CO VOC SOx PM10 PM2.5

8 Hr Period Run Day lbs/day lbs/day lbs/day lbs/day lbs/day lbs/day

Scenario 1 18.13 24.74 18.97 2.13 12.35 12.35 1 Engine

Cold Start, Steady State, Shutdown 199.41 272.16 208.64 23.41 135.83 135.83 All Engines

Scenario 2 12.84 13.75 14.38 2.10 12.58 12.58 1 Engine

Warm Start, Steady State, Shutdown 141.20 151.28 158.18 23.14 138.35 138.35 All Engines

Scenario 3 10.54 12.51 12.67 2.05 11.03 11.03 1 Engine

Steady State 115.90 137.63 139.39 22.53 121.35 121.35 All Engines

Scenario 4 1 Engine

****** All Engines

Other Misc Scenarios -based on run hour type (CS-cold start hour, WS-warm start hour, SD-shutdown hour, SS-steady state hour)

NOx CO VOC SOx PM10 PM2.5

lbs/day lbs/day lbs/day lbs/day lbs/day lbs/day

a - CS, SS, SD, WS, SS, SD (total ops period 12 hrs)

25.32 31.80 26.56 3.14 19.02 19.02 1 Engine

278.56 349.75 292.18 34.50 209.21 209.21 All Engines

b - 3 CSs, 1 WS, 4 SDs, SS (total ops period 24 hrs)

55.94 74.58 57.71 6.30 37.81 37.81 1 Engine

615.33 820.37 634.82 69.26 415.90 415.90 All Engines

Maximum Estimated Annual Emissions NOx CO VOC SOx PM10 PM2.5

lbs/yr lbs/yr lbs/yr lbs/yr lbs/yr lbs/yr

Cold Startups 2382.0 3771.0 1984.2 41.1 462.0 462.0

Warm Startups 243.0 132.2 176.4 7.0 154.0 154.0

Shutdowns 80.0 124.0 136.0 20.0 140.0 140.0

Steady State 5038.2 5983.1 6059.6 979.3 5275.4 5275.4

1 Engine Totals, lbs/yr: 7743.2 10010.3 8356.2 1047.4 6031.4 6031.4

1 Engine Totals, tons/yr: 3.87 5.01 4.18 0.52 3.02 3.02

NOx CO VOC SOx PM10 PM2.5

tpy tpy tpy tpy tpy tpy

Total Tons/Yr All Engines: 42.59 55.06 45.96 5.76 33.17 33.17

EPA PSD Significant Emissions Rates, TPY: 40 100 40 40 15 10

SDAPCD 50 100 50 100 100 100

GHG Emissions Estimates CCAR, General Reporting Protocol, Version 3.1, January 2009, Table C.6.

Fuel: Natural Gas

Btu/scf: 1019 HHV

Heat Rate: 80.18 mmbtu/hr CO2e

Fuel Rate: 0.0787 mmscf/hr short IPCC SAR short

Emissions Factors Emissions lbs/hr lbs/year tons/yr Values tons/yr

CO2 116.954 lbs/mmbtu 9.38E+03 3.78E+07 1.89E+04 1 1.89E+04

CH4 0.01301 lbs/mmbtu 1.04E+00 4.21E+03 2.10E+00 21 4.42E+01

N2O 0.0002205 lbs/mmbtu 1.77E-02 7.13E+01 3.56E-02 310 1.10E+01

Total CO2e: 18960 short TPY 1 Engine

Total CO2e: 208560 short TPY All Engines

Total CO2e: 17236 metric TPY 1 Engine

PSD Triggered for GHGs: Yes Total CO2e: 189600 metric TPY All Engines

Ops Scenario

Air Agency Offset Trigger Levels, TPY:

1 short ton = 2000 lbs, 1 metric ton = 2200 lbs.

75% Load EvaluationMaximum Hourly, Daily Emissions Calculations Number of Identical Engines: 11

Input data per unit: Avg Avg Cold Warm Max

# of Cold # of Warm Startup Startup Shutdown Cold Warm Estimated Estimated

Operation Annual Startups Startups Time Time Time Starts Starts Shutdowns Shutdowns

hrs/day Op hrs day day hrs hrs hrs yr yr yr day

24 4032 1 1 0.416 0.25 0.1417 300 100 400 2

Cold Warm

Startup Startup Shutdown Steady State

Emissions Emissions Emissions Emissions

lbs/event lbs/event lbs/event lbs/hr

(75% Load)

NOx 7.94 2.43 0.2 1.11

CO 12.57 1.322 0.31 1.48

VOC 6.614 1.764 0.34 1.541

SOx 0.137 0.07 0.05 0.256

PM10 1.54 1.54 0.35 1.372

PM2.5 1.54 1.54 0.35 1.372

1. SU/SD emissions data and times derived from: Wartsila Emissions Data Sheet, DBAB715360, 2-27-11.

2. Cold start (CS): engine will reach steady state in 10 minutes and controls (SCR and CO Cat) will be fully operational in 25 minutes.

3. Warm start (WS): engine will reach steady state in 10 minutes and controls (SCR and CO Cat) will be fully operational in 15 minutes.

4. A warm start is defined as a start initiated within 2-6 hours after the engine has been shutdown, or

when the emissions control system is at a temperature of no less than 270 C (518 F).

5. Shutdown time is optimally 8.5 minutes per Wartsila.

6. Cold start w/o shutdown = 0.416 hrs steady state = 0.584 hrs

7. Warm start w/o shutdown = 0.25 hrs steady state = 0.75 hrs

8. Shut down = 0.1417 hrs steady state = 0.8583 hrs

9. Steady state (SS) emissions values derived from Cogentrix/Wartsila.

10. SO2 emissions include S to SO2 from lube oil burn-off from cylinder sleeves.

Maximum Estimated Hourly Emissions NOx CO VOC SOx PM10 PM2.5

1 Hour Period lbs/hr lbs/hr lbs/hr lbs/hr lbs/hr lbs/hr

Scenario 1 8.59 13.43 7.51 0.29 2.34 2.34 1 Engine

Cold Start w/Steady State (5 Engines) 42.94 67.17 37.57 1.43 11.71 11.71 5 Engines

Cold Start w/Steady State (6 Engines) 51.53 80.61 45.08 1.72 14.05 14.05 6 Engines

Scenario 2 3.26 2.43 2.92 0.26 2.57 2.57 1 Engine

Warm Start w/Steady State 35.89 26.75 32.12 2.88 28.26 28.26 All Engines

Scenario 3 8.79 13.74 7.85 0.34 2.69 2.69 1 Engine

Cold Start, Steady State, Shutdown *** 96.67 151.19 86.39 3.70 29.60 29.60 All Engines

Scenario 4 3.46 2.74 3.26 0.31 2.92 2.92 1 Engine

Warm Start, Steady State, Shutdown *** 38.09 30.16 35.86 3.43 32.11 32.11 All Engines

Scenario 5 1.15 1.58 1.66 0.27 1.53 1.53 1 Engine

Steady State w/Shutdown 12.68 17.38 18.29 2.97 16.80 16.80 All Engines

Scenario 6 1.11 1.48 1.54 0.26 1.37 1.37 1 Engine

Steady State 12.21 16.28 16.95 2.82 15.09 15.09 All Engines

*** cannot occur, once SU is finalized, the unit(s) must run for 2 hours prior to a SD

Maximum Estimated Daily Emissions NOx CO VOC SOx PM10 PM2.5

24 Hr Period Run Day lbs/day lbs/day lbs/day lbs/day lbs/day lbs/day

Scenario 1 34.32 47.78 43.30 6.22 34.25 34.25 1 Engine

Cold Start, Steady State, Shutdown 377.50 525.63 476.27 68.47 376.72 376.72 All Engines

Scenario 2 28.99 36.78 38.70 6.20 34.48 34.48 1 Engine

Warm Start, Steady State, Shutdown 318.92 404.60 425.73 68.20 379.23 379.23 All Engines

Scenario 3 26.64 35.52 36.98 6.14 32.93 32.93 1 Engine

Steady State 293.04 390.72 406.82 67.58 362.21 362.21 All Engines

Scenario 4 1 Engine

****** All Engines

Maximum Estimated Daily Emissions NOx CO VOC SOx PM10 PM2.5

16 Hr Period Run Day lbs/day lbs/day lbs/day lbs/day lbs/day lbs/day

Scenario 1 25.44 35.94 30.97 4.18 23.27 23.27 1 Engine

Cold Start, Steady State, Shutdown 279.82 395.39 340.66 45.94 255.98 255.98 All Engines

Scenario 2 20.11 24.94 26.37 4.15 23.50 23.50 1 Engine

Warm Start, Steady State, Shutdown 221.24 274.36 290.12 45.67 258.49 258.49 All Engines

Scenario 3 17.76 23.68 24.66 4.10 21.95 21.95 1 Engine

Steady State 195.36 260.48 271.22 45.06 241.47 241.47 All Engines

Scenario 4 1 Engine

****** All Engines

Maximum Estimated Daily Emissions NOx CO VOC SOx PM10 PM2.5

8 Hr Period Run Day lbs/day lbs/day lbs/day lbs/day lbs/day lbs/day

Scenario 1 16.56 24.10 18.64 2.13 12.30 12.30 1 Engine

Cold Start, Steady State, Shutdown 182.14 265.15 205.05 23.41 135.25 135.25 All Engines

Scenario 2 11.23 13.10 14.05 2.10 12.52 12.52 1 Engine

Warm Start, Steady State, Shutdown 123.56 144.12 154.51 23.14 137.75 137.75 All Engines

Scenario 3 8.88 11.84 12.33 2.05 10.98 10.98 1 Engine

Steady State 97.68 130.24 135.61 22.53 120.74 120.74 All Engines

Scenario 4 1 Engine

****** All Engines

Other Misc Scenarios -based on run hour type (CS-cold start hour, WS-warm start hour, SD-shutdown hour, SS-steady state hour)

NOx CO VOC SOx PM10 PM2.5

lbs/day lbs/day lbs/day lbs/day lbs/day lbs/day

a - CS, SS, SD, WS, SS, SD (total ops period 12 hrs)

23.04 30.87 26.09 3.14 18.94 18.94 1 Engine

253.40 339.54 286.96 34.50 208.36 208.36 All Engines

b - 3 CSs, 1 WS, 4 SDs, SS (total ops period 24 hrs)

51.40 72.74 56.77 6.30 37.66 37.66 1 Engine

565.38 800.10 624.45 69.26 414.21 414.21 All Engines

50% Load EvaluationMaximum Hourly, Daily Emissions Calculations Number of Identical Engines: 11

Input data per unit: Avg Avg Cold Warm Max

# of Cold # of Warm Startup Startup Shutdown Cold Warm Estimated Estimated

Operation Annual Startups Startups Time Time Time Starts Starts Shutdowns Shutdowns

hrs/day Op hrs day day hrs hrs hrs yr yr yr day

24 4032 1 1 0.416 0.25 0.1417 300 100 400 2

Cold Warm

Startup Startup Shutdown Steady State

Emissions Emissions Emissions Emissions

lbs/event lbs/event lbs/event lbs/hr

(50% Load)

NOx 7.94 2.43 0.2 0.921

CO 12.57 1.322 0.31 1.494

VOC 6.614 1.764 0.34 1.504

SOx 0.137 0.07 0.05 0.256

PM10 1.54 1.54 0.35 1.361

PM2.5 1.54 1.54 0.35 1.361

1. SU/SD emissions data and times derived from: Wartsila Emissions Data Sheet, DBAB715360, 2-27-11.

2. Cold start (CS): engine will reach steady state in 10 minutes and controls (SCR and CO Cat) will be fully operational in 30 minutes.

3. Warm start (WS): engine will reach steady state in 10 minutes and controls (SCR and CO Cat) will be fully operational in 15 minutes.

4. A warm start is defined as a start initiated within 2-6 hours after the engine has been shutdown, or

when the emissions control system is at a temperature of no less than 270 C (518 F).

5. Shutdown time is optimally 8.5 minutes per Wartsila.

6. Cold start w/o shutdown = 0.416 hrs steady state = 0.584 hrs

7. Warm start w/o shutdown = 0.25 hrs steady state = 0.75 hrs

8. Shut down = 0.1417 hrs steady state = 0.8583 hrs

9. Steady state (SS) emissions values derived from Cogentrix/Wartsila.

10. SO2 emissions include S to SO2 from lube oil burn-off from cylinder sleeves.

Maximum Estimated Hourly Emissions NOx CO VOC SOx PM10 PM2.5

1 Hour Period lbs/hr lbs/hr lbs/hr lbs/hr lbs/hr lbs/hr

Scenario 1 8.48 13.44 7.49 0.29 2.33 2.33 1 Engine

Cold Start w/Steady State (5 Engines) 42.39 67.21 37.46 1.43 11.67 11.67 5 Engines

Cold Start w/Steady State (6 Engines) 50.87 80.65 44.95 1.72 14.01 14.01 6 Engines

Scenario 2 3.12 2.44 2.89 0.26 2.56 2.56 1 Engine

Warm Start w/Steady State 34.33 26.87 31.81 2.88 28.17 28.17 All Engines

Scenario 3 8.68 13.75 7.83 0.34 2.68 2.68 1 Engine

Cold Start, Steady State, Shutdown *** 95.46 151.28 86.16 3.70 29.53 29.53 All Engines

Scenario 4 3.32 2.75 3.23 0.31 2.91 2.91 1 Engine

Warm Start, Steady State, Shutdown *** 36.53 30.28 35.55 3.43 32.02 32.02 All Engines

Scenario 5 0.99 1.59 1.63 0.27 1.52 1.52 1 Engine

Steady State w/Shutdown 10.90 17.52 17.94 2.97 16.70 16.70 All Engines

Scenario 6 0.92 1.49 1.50 0.26 1.36 1.36 1 Engine

Steady State 10.13 16.43 16.54 2.82 14.97 14.97 All Engines

*** cannot occur, once SU is finalized, the unit(s) must run for 2 hours prior to a SD

Maximum Estimated Daily Emissions NOx CO VOC SOx PM10 PM2.5

24 Hr Period Run Day lbs/day lbs/day lbs/day lbs/day lbs/day lbs/day

Scenario 1 29.86 48.11 42.42 6.22 33.99 33.99 1 Engine

Cold Start, Steady State, Shutdown 328.47 529.26 466.67 68.47 373.87 373.87 All Engines

Scenario 2 24.50 37.11 37.82 6.20 34.21 34.21 1 Engine

Warm Start, Steady State, Shutdown 269.54 408.26 416.06 68.20 376.35 376.35 All Engines

Scenario 3 22.10 35.86 36.10 6.14 32.66 32.66 1 Engine

Steady State 243.14 394.42 397.06 67.58 359.30 359.30 All Engines

Scenario 4 1 Engine

****** All Engines

Maximum Estimated Daily Emissions NOx CO VOC SOx PM10 PM2.5

16 Hr Period Run Day lbs/day lbs/day lbs/day lbs/day lbs/day lbs/day

Scenario 1 22.49 36.16 30.39 4.18 23.10 23.10 1 Engine

Cold Start, Steady State, Shutdown 247.42 397.79 334.32 45.94 254.10 254.10 All Engines

Scenario 2 17.14 25.16 25.79 4.15 23.33 23.33 1 Engine

Warm Start, Steady State, Shutdown 188.49 276.79 283.71 45.67 256.58 256.58 All Engines

Scenario 3 14.74 23.90 24.06 4.10 21.78 21.78 1 Engine

Steady State 162.10 262.94 264.70 45.06 239.54 239.54 All Engines

Scenario 4 1 Engine

****** All Engines

Maximum Estimated Daily Emissions NOx CO VOC SOx PM10 PM2.5

8 Hr Period Run Day lbs/day lbs/day lbs/day lbs/day lbs/day lbs/day

Scenario 1 15.12 24.21 18.36 2.13 12.21 12.21 1 Engine

Cold Start, Steady State, Shutdown 166.37 266.32 201.96 23.41 134.33 134.33 All Engines

Scenario 2 9.77 13.21 13.76 2.10 12.44 12.44 1 Engine

Warm Start, Steady State, Shutdown 107.45 145.32 151.36 23.14 136.82 136.82 All Engines

Scenario 3 7.37 11.95 12.03 2.05 10.89 10.89 1 Engine

Steady State 81.05 131.47 132.35 22.53 119.77 119.77 All Engines

Scenario 4 1 Engine

****** All Engines

Other Misc Scenarios -based on run hour type (CS-cold start hour, WS-warm start hour, SD-shutdown hour, SS-steady state hour)

NOx CO VOC SOx PM10 PM2.5

lbs/day lbs/day lbs/day lbs/day lbs/day lbs/day

a - CS, SS, SD, WS, SS, SD (total ops period 12 hrs)

20.95 31.02 25.68 3.14 18.82 18.82 1 Engine

230.42 341.24 282.46 34.50 207.02 207.02 All Engines

b - 3 CSs, 1 WS, 4 SDs, SS (total ops period 24 hrs)

47.25 73.04 55.96 6.30 37.41 37.41 1 Engine

519.78 803.48 615.52 69.26 411.55 411.55 All Engines


Recommended