1 510(k) SUBSTANTIAL EQUIVALENCE DETERMINATION DECISION SUMMARY A. 510(k) Number: k113323 B. Purpose for Submission: New device C. Measurand: Influenza A and Influenza B RNA from nasopharyngeal swabs D. Type of Test: Qualitative real-time reverse transcription-polymerase chain reaction (RT-PCR) for detection of Influenza A and B RNA from nasopharyngeal swab specimens. E. Applicant: QIAGEN GmbH F. Proprietary and Established Names: artus® Infl A/B RG RT-PCR Kit G. Regulatory Information: 1. Regulation section: 866.3980 2. Classification: Class II 3. Product codes: OCC, OOI, JJH 4. Panel: Microbiology
Influenza A and Influenza B RNA from nasopharyngeal swabs
D. Type of Test:
Qualitative real-time reverse transcription-polymerase chain reaction (RT-PCR) for detection of Influenza A and B RNA from nasopharyngeal swab specimens.
E. Applicant:
QIAGEN GmbH
F. Proprietary and Established Names:
artus® Infl A/B RG RT-PCR Kit
G. Regulatory Information:
1. Regulation section:
866.3980
2. Classification:
Class II
3. Product codes:
OCC, OOI, JJH
4. Panel:
Microbiology
2
H. Intended Use: 1. Intended use(s):
The artus® Infl A/B RG RT-PCR Kit is a multiplex real time PCR in vitro diagnostic test for the qualitative detection and identification of Influenza A and Influenza B virus RNA in nasopharyngeal swab specimens using the Rotor-Gene® Q MDx instrument. The test is intended for use as an aid in the differential diagnosis of Influenza A and Influenza B viral infections in patients symptomatic for respiratory tract infection in conjunction with clinical and epidemiological risk factors. It is not intended to detect Influenza C virus.
Negative results do not preclude respiratory virus infection and should not be used as the sole basis for diagnosis, treatment or other patient management decisions.
Performance characteristics for Influenza A were established during the 2009/2010 and 2010/2011 flu seasons when Influenza A (H3N2) and Influenza A/2009 (H1N1) were the predominant Influenza A viruses in circulation. When other Influenza A viruses emerge, performance characteristics may vary.
If infection with a novel Influenza A virus is suspected based on current clinical and epidemiological screening criteria recommended by public health authorities, specimens should be collected with appropriate infection control precautions for novel virulent influenza viruses and sent to state or local health departments for testing. Viral culture should not be attempted in these cases unless a BSL 3+ facility is available to receive and culture specimens.
2. Indication(s) for use:
Same as Intended Use
3. Special conditions for use statement(s):
Not Applicable
4. Special instrument requirements:
Qiagen Rotor-Gene® Q MDx instrument with 72-well rotor
Qiagen EZ1 Advanced
I. Device Description:
The artus Infl A/B RG RT-PCR Kit contains reagents and instructions for the detection and differentiation of Influenza A and Influenza B viral RNA in nasopharyngeal swabs of symptomatic patients.
3
The assay utilizes the EZ1 DSP Virus Kit (QIAGEN) and the EZ1 Advanced XL instrument with the EZ1 Advanced XL DSP Virus Card v. 1.0 for viral nucleic acid extraction. The artus Infl A/B RG RT-PCR Kit in conjunction with the Rotor-Gene Q MDx instrument (with 72-well rotor) and the Influenza Assay Package v. 1.0.7 (QIAGEN) is used for amplification and detection.
Pathogen detection by the reverse transcription-polymerase chain reaction (RT-PCR) is based on the reverse transcription of the RNA into complementary DNA. In real-time PCR the amplified product is detected via fluorescent dyes. These are linked to oligonucleotides that bind specifically to the amplified product. Monitoring the fluorescence intensities during the PCR run (i.e., in real time) allows the detection of the accumulating product without having to re-open the reaction tubes after the PCR run.
The artus Infl A/B RG RT-PCR procedure is briefly described below:
1. Sample collection: Collect nasopharyngeal swab specimens from symptomatic patients using a polyester, nylon, or rayon swab and place it into virus transport medium.
2. Nucleic acid extraction: Add the Influenza A/B internal control (IC) to the carrier RNA before starting the extraction procedure. Extract viral RNA using the EZ1 DSP Virus Kit in combination with the EZ1 Advanced XL instrument. The IC is added by the EZ1 Advanced to each sample during extraction.
3. Real-time RT-PCR: Add the extracted RNA and positive and negative control material to Influenza A/B Master mix. Perform real time RT-PCR using the Rotor-Gene Q MDx instrument.
4. Result interpretation: The Influenza Assay Package evaluates the results of the positive and negative controls to determine if the run is valid. If the run is valid, the internal control and target-specific results of each specimen are evaluated.
Interpretation of Control Results The Rotor-Gene Q software determines whether control results are valid or invalid and therefore whether the run is valid or invalid.
Conditions required for a valid run
Name Influenza A result Influenza B result Status
Inf A Co Valid – Valid
Inf B Co – Valid Valid
NTC – – Valid
4
Invalid runs If the Influenza A Control (Inf A Co), Influenza B Control (Inf B Co), or no template control (NTC) result is determined to be invalid, the software will provide a flag/warning message. If the run is invalid due to failure of the Influenza A Control, Influenza B Control, or no template control, all samples in that run must be retested using remaining purified nucleic acids.
Interpretation of Process Control Results For each Process Control the Rotor-Gene Q software indicates the results for influenza A and influenza B (RNA detected or RNA not detected).
If the expected results for one or more of the Process Controls are not met the run is considered invalid and all the samples in that PCR run must be extracted again and retested.
Interpretation of Specimen Results For each sample in a valid run, the Rotor-Gene Q software indicates the status of the analysis (valid or invalid) and the results for influenza A and influenza B (RNA detected or RNA not detected). A description of the sample results provided by the Rotor-Gene Q software is provided in the table below.
5
Sample results determined by the Rotor-Gene Q software
Name Flag/ warning
Influenza A result
Influenza B result Status
Interpretation of result
Sample ID
– RNA detected
RNA not detected
Valid Influenza A viral RNA detected
Sample ID
– RNA not detected
RNA detected
Valid Influenza B viral RNA detected
Sample ID
– RNA not detected
RNA not detected
Valid Influenza viral RNA not detected
Sample ID
– RNA detected
RNA detected
Valid
Influenza A viral RNA and influenza B viral RNA detected*
Sample ID
SAMPLE IC FAIL
Invalid Invalid Invalid
Not determined: signal in the Control channel is out of specification range.
Sample ID
InfA_ SAMPLE_ EARLY_CT
Invalid Invalid Invalid Not determined: Influenza A test channel failed.
Sample ID
INFA_ SAMPLE_ INVALID_ DATA
Invalid Invalid Invalid
Not determined: influenza A test channel failed, caused by double intersection.**
Sample ID
InfB_ SAMPLE_ EARLY_CT
Invalid Invalid Invalid Not determined: influenza B test channel failed.
Sample ID
INFB_ SAMPLE_ INVALID_ DATA
Invalid Invalid Invalid
Not determined: influenza B test channel failed, caused by double intersection.**
* Dual infections with Influenza A and B are rare. For a sample with a dual infection test result, the sample needs to be retested
6
** Amplification curve crosses the threshold twice.
Retesting invalid samples Samples with invalid results must be re-extracted and retested.
Materials Provided The contents of the artus Infl A/B RG RT-PCR Kit are sufficient for 96 tests in two to four PCR runs on the Rotor-Gene Q MDx. The Rotor-Gene Q MDx rotor holds up to 72 reaction tubes.
Kit contents
artus Infl A/B RG RT-PCR Kit (96)
Catalog no. 4524245
Number of reactions 96
Blue Influenza A/B Master 8 x 174 µl
Yellow Influenza Mg-Sol* ** 600 µl
Red Influenza A Control 200 µl
Brown Influenza B Control 200 µl
Green Influenza A/B IC† ** 2 x 1000 µl
White Water (PCR grade) 1000 µl
Instructions For Use (Handbook) 1
* Magnesium solution. † Internal control.
** See page Error! Bookmark not defined. for symbols list with definitions
Materials Required but Not Provided
For RNA purification Reagents
· EZ1 DSP Virus Kit (cat. no. 62724), version 4
Equipment
· EZ1 Advanced XL instrument (cat. no. 9001492)
· EZ1 Advanced XL DSP Virus Card v1.0 or higher, with firmware 1.0.1 and protocol “DSP Virus version 1.0” or higher (cat. no. 9018703)
7
For PCR
· Consumables
· Pipets (adjustable)
· Sterile, RNase-free pipet tips with filters
· Strip Tubes and Caps, 0.1 ml, for use with 72-well rotor (cat. no. 981103 or 981106)
Equipment
· Vortex mixer
· Laboratory timer
· Benchtop centrifuge with rotor for 2 ml reaction tubes
· Cooling block (Loading Block 72 x 0.1 ml Tubes, cat. no. 9018901)
Primer / probe sets in the artus Infl A/B RG RT-PCR Kit Component Target Target Gene Probe
Fluorophore Detection
Range (nm) Influenza A/B
Master Influenza A Virus Matrix Fam 510 +/- 5
Influenza B Virus Matrix IRD700 712 +/- 5
Internal Control Synthetic sequence Texas Red 610 +/- 5
J. Substantial Equivalence Information:
1. Predicate device name(s): ProFlu+ Assay
2. Predicate 510(k) number(s): k110968
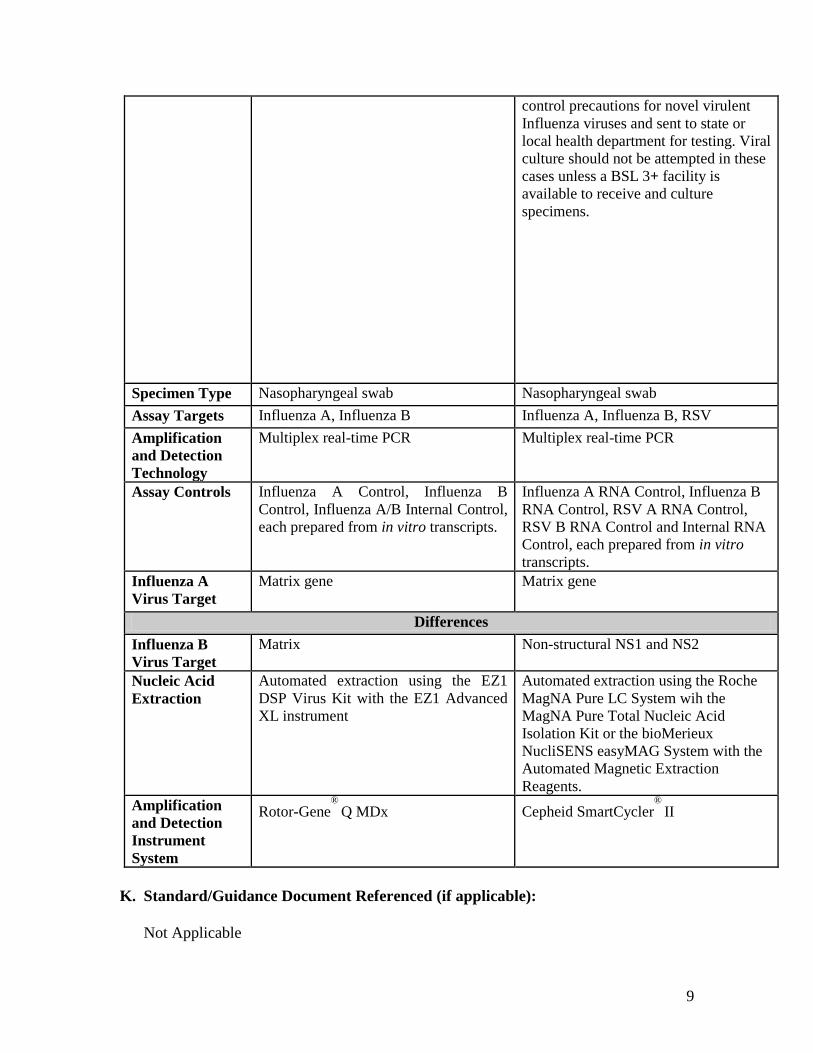
3. Comparison with predicate:
Name artus Infl A/B RG RT-PCR Kit ProFlu+ Assay
510(k) No. k113323 k110968
Regulation 866.3980 866.3980
Product Code OCC OCC
Device Class II II
Similarities
8
Intended Use The artus® Infl A/B RG RT-PCR Kit is a multiplex real time PCR in vitro diagnostic test for the qualitative detection and identification of Influenza A and Influenza B virus RNA in nasopharyngeal swab specimens using the Rotor-Gene® Q MDx instrument. The test is intended for use as an aid in the differential diagnosis of Influenza A and Influenza B viral infections in patients symptomatic for respiratory tract infection in conjunction with clinical and epidemiological risk factors. It is not intended to detect Influenza C virus.
Negative results do not preclude respiratory virus infection and should not be used as the sole basis for diagnosis, treatment or other patient management decisions.
Performance characteristics for Influenza A were established during the 2009/2010 and 2010/2011 flu seasons when Influenza A (H3N2) and Influenza A/2009 (H1N1) were the predominant Influenza A viruses in circulation. When other Influenza A viruses emerge, performance characteristics may vary.
If infection with a novel Influenza A virus is suspected based on current clinical and epidemiological screening criteria recommended by public health authorities, specimens should be collected with appropriate infection control precautions for novel virulent influenza viruses and sent to state or local health departments for testing. Viral culture should not be attempted in these cases unless a BSL 3+ facility is available to receive and culture specimens.
The ProFluTM
+ Assay is a multiplex Real-Time PCR (RT-PCR) in vitro diagnostic test for the rapid and qualitative detection and discrimination of Influenza A Virus, Influenza B Virus, and Respiratory Syncytial Virus (RSV) nucleic acids isolated and purified from nasopharyngeal (NP) swab specimens obtained from symptomatic patients. This test is intended for use to aid in the differential diagnosis of Influenza A, Influenza B and RSV viral infections in humans and is not intended to detect Influenza C. Negative results do not preclude influenza or RSV virus infection and should not be used as the sole basis for treatment or other management decisions. Conversely, positive results do not rule out bacterial infection or co-infection with other viruses. The agent detected may not be the definite cause of disease. The use of additional laboratory testing and clinical presentation must be considered in order to obtain the final diagnosis of respiratory viral infection. Performance characteristics for Influenza A Virus were established when Influenza A/H3 and A/H1 were the predominant Influenza A viruses in circulation (2006 - 2007 respiratory season). Performance characteristics for Influenza A were confirmed when Influenza A/Hl, Influenza A/H3, and Influenza A/2009 H1N1 were the predominant Influenza A viruses in circulation (2008 and 2009). When other Influenza A viruses are emerging, performance characteristics may vary. If infection with a novel Influenza A virus is suspected based on current clinical and epidemiological screening criteria recommended by public health authorities, specimens should be collected with appropriate infection
9
control precautions for novel virulent Influenza viruses and sent to state or local health department for testing. Viral culture should not be attempted in these cases unless a BSL 3+ facility is available to receive and culture specimens.
Specimen Type Nasopharyngeal swab Nasopharyngeal swab
Assay Targets Influenza A, Influenza B Influenza A, Influenza B, RSV
Amplification and Detection Technology
Multiplex real-time PCR Multiplex real-time PCR
Assay Controls Influenza A Control, Influenza B Control, Influenza A/B Internal Control, each prepared from in vitro transcripts.
Influenza A RNA Control, Influenza B RNA Control, RSV A RNA Control, RSV B RNA Control and Internal RNA Control, each prepared from in vitro transcripts.
Influenza A Virus Target
Matrix gene Matrix gene
Differences
Influenza B Virus Target
Matrix Non-structural NS1 and NS2
Nucleic Acid Extraction
Automated extraction using the EZ1 DSP Virus Kit with the EZ1 Advanced XL instrument
Automated extraction using the Roche MagNA Pure LC System wih the MagNA Pure Total Nucleic Acid Isolation Kit or the bioMerieux NucliSENS easyMAG System with the Automated Magnetic Extraction Reagents.
Amplification and Detection Instrument System
Rotor-Gene®
Q MDx Cepheid SmartCycler®
II
K. Standard/Guidance Document Referenced (if applicable):
Not Applicable
10
L. Test Principle:
The real-time PCR process simultaneously amplifies and detects nucleic acid targets in a single closed-tube reaction. Detection of Influenza RNA and Internal Control (IC) is based on three processes: nucleic acid isolation, reverse transcription, and real time PCR amplification/detection. Human respiratory specimens (nasopharyngeal swabs) from symptomatic patients are processed initially to isolate and purify viral nucleic acid from the cellular specimen matrix. After initial reverse transcription of RNA into complementary DNA (cDNA), amplification proceeds during which the probe anneals specifically to a region of the template between the forward and reverse primers. As primer extension and amplification occurs, the exonuclease activity of the Taq polymerase cleaves the probe separating the reporter dye away from the quencher. This generates an increase in fluorescent signal upon excitation from a light source of appropriate wavelength. With each cycle, additional reporter dye molecules are cleaved from their respective probes, yielding increased fluorescence signal. The amount of fluorescence at any given cycle is dependent on the amount of PCR product (amplicons) present at that time. Fluorescent intensity is monitored at each PCR cycle by fluorescent detection modules within the real-time instrument.
M. Performance Characteristics (if/when applicable):
1. Analytical performance:
a. Precision/Reproducibility:
The reproducibility of the artus Infl A/B RG RT-PCR test was evaluated using 3 investigational sites. A panel of 10 simulated specimens was provided for testing. Five of the specimens contained influenza A and the other 5 specimens contained influenza B. Each half of the panel included duplicate low-positive and moderate positive test samples. The test panel samples were prepared from whole virus. Influenza A test samples were made using Influenza A/California/7/09-like virus and the Influenza B test samples were made using Influenza B/Florida/4/2006-like virus. The virus stocks were diluted in influenza-negative clinical sample matrix that was comprised of pooled, residual, de-identified nasopharyngeal swab specimens. Low positive specimens where diluted to 2X the LoD, Moderate positives were made to 10X the LoD. Influenza A and Influenza B negative samples represent dilution levels that are 0.001x LoD.
The 10-member panel plus 3 controls were tested by 2 different technologists each day for 6 days. The overall percent agreement for the artus Infl A/B RG RT-PCR test is summarized below.
11
Panel member
Agreement with expected
result Average CT CV%
95% confidence interval
Influenza A Neg
33/36 (91.7%) 29.76 2.2 78–97%
Influenza A Low Pos
72/72 (100%) 31.37 1.1 95–100%
Influenza A
Mod Pos 72/72 (100%) 29.23 1.5 95–100%
Influenza B
Neg 36/36 (100%) 29.78 2.1 90–100%
Influenza B
Low Pos 72/72 (100%) 30.42 1.2 95–100%
Influenza B
Mod Pos 72/72 (100%) 28.32 1.2 95–100%
Influenza A
Control 36/36 (100%) 34.25 2.2 90–100%
Influenza B
Control 36/36 (100%) 31.14 2.3 90–100%
Negative control 36/36 (100%) 27.42 1.8 90–100%
The average Ct for the negative samples is based on the IC.
b. Linearity/assay reportable range:
Not Applicable
c. Traceability, Stability, Expected values (controls, calibrators, or methods):
Controls
Controls provided with the artus Infl A/B RG RT-PCR Kit:
Internal Control
The Influenza A/B Internal Control (IC) is a 1280 bp in vitro transcript of an
artificial sequence with no homologies to influenza sequences. It is provided
with the artus Infl A/B RG RT-PCR Kit. The IC is added to each sample by
the EZ1 Advanced XL during the nucleic acid extraction process and to the
control at PCR set-up by the user.
12
For the negative control (No Template) and the positive controls (Influenza A Control and Influenza B Control): The IC is added to the Influenza A/B Master mix aliquot that is prepared specifically for use with Controls. (Separate Influenza A/B Master mixes are prepared for Controls and specimens; the Master mix for samples does not contain IC because it is added to each sample prior to RNA extraction.)
In the No Template Control, a result for the IC that is outside of the acceptance ranges identifies a failure of the PCR while a result within the acceptance range indicates that the IC primers and probes are performing as expected. In influenza-negative samples, the Influenza A/B Internal Control identifies failure of the RNA extraction process or inhibition of the PCR reaction.
Positive Controls
Two positive controls, the Influenza A Control and the Influenza B Control, are provided with the artus Infl A/B RG RT-PCR Kit. The positive controls are added in place of extracted sample RNA to individual PCR reaction tubes containing Influenza A/B Master mix and Internal Control. The positive controls identify failures of the PCR caused by reagent problems, PCR set-up error, or failure of the Rotor-Gene Q MDx instrument. A result within the acceptance range for both controls indicates the assay is functioning as intended. Both controls must generate a valid result in order for the run to be reported as valid by the artus Influenza software. (The Internal Control Channel is not evaluated for the Positive Controls.)
The Influenza A Control is an in vitro transcript (IVT) corresponding to the amplicon generated with the Influenza A primers. The IVT is present at a concentration three times the limit of detection of the artus Infl A/B RG RT-PCR Kit.
The Influenza B Control is an IVT corresponding to the amplicon generated with the Influenza B primers. The IVT is present at a concentration five times the limit of detection of the artus Infl A/B RG RT-PCR Kit.
Negative (No Template) Control
PCR grade water is provided with the artus Infl A/B RG RT-PCR Kit and serves as the No Template control for the Influenza A/B Master. It is added in place of extracted sample RNA to an individual reaction tube containing the Influenza A/B Master mix with Internal Control. The No Template control result identifies possible sample-to-sample carryover or contamination of the master mix with target nucleic acid.
Controls not provided with the artus Infl A/B RG RT-PCR Kit:
13
Process Controls
The package insert for the artus Infl A/B RG RT-PCR Kit recommends to include influenza A positive, influenza B positive, and influenza negative Process Controls to be used starting from the extraction step. Since these controls are intended to mimic patient samples, characterized clinical samples can be used for this purpose.
Sample Stability
The stability of nasopharyngeal swab specimens, pre and post nucleic acid purification, was evaluated by testing simulated clinical samples stored at conditions reflecting the storage and handling instructions in the package insert of the artus Infl A/B RG RT-PCR Kit. The stability of nasopharyngeal swab specimens stored at -65 to -90oC (-70oC) was also demonstrated in the clinical study using prospectively collected specimens.
Simulated clinical samples were prepared by spiking cultured influenza virus strains A/California/7/09-like or B/Florida/4/2006-like into clinical sample matrix. Each virus strain was present at a concentration of three times the Limit of Detection (LoD) of the artus Infl A/B RG RT-PCR assay.
The study evaluated routine storage conditions for pre-processed samples and purified nucleic acid samples. Additionally, the impact of leaving the purified nucleic acid on the EZ1 Advanced XL for up to three hours was evaluated. Although this is outside of routine storage conditions (short term at 2 – 8°C or
long term storage at -65 to -90°C). Prolonged storage of purified samples on
the EZ1 was also evaluated as it is reasonable to anticipate that a user will
occasionally not immediately retrieve the purified nucleic acids at the
conclusion of the EZ1 Advanced XL run.
For evaluation of pre-processed samples, 3 ml of each simulated sample was
placed in an empty Copan vial along with a nasopharyngeal swab and stored
at the designated temperature condition. Purified nucleic acid eluates (60μl)
were stored in the elution vials provided with the EZ1 DSP Virus Kit. A
freeze / thaw cycle is defined as the number of thaws minus one.
Storage of samples at 2 – 8oC for up to eight days.
For analysis of short term refrigerated storage of pre-processed samples,
simulated samples were stored at -65°C to -90°C for four weeks and then
stored for eight days at 2 - 8°C. During storage at 2 – 8°C, samples were
tested after three days, five days and eight days. (The experimental design was
chosen to conserve the negative clinical sample matrix by allowing evaluation
of frozen and 4°C storage with the same samples. The preceding storage at -
65°C to -90°C for four weeks and the resulting freeze thaw provides added
assurance of sample stability at 2 – 8°C for up to eight days by exposing the
14
samples to additional storage conditions.)
Storage of samples for up to six weeks at -65°C to -90oC with one freeze /
thaw at week four.
For analysis of -70°C storage and freeze-thaw stability, 3 ml of each simulated
sample was prepared and one aliquot of 0.4 ml was tested at Test Time Pont 0.
The remaining 2.6 ml was stored at -65°C to -90°C. After four weeks the
sample was thawed (5 h at 2-8°C) and split into aliquots of 0.4 ml. One
aliquot was processed and tested, the other aliquot was returned to the freezer.
After two additional weeks the remaining aliquot was thawed, processed and
tested. For each sample type, the observed result agreed with the expected
result for all replicates at each time point. For the simulated negative sample,
the IC of each replicate was within the acceptance range of Ct 26 – 36 at each
time point.
Storage of purified RNA at 2 – 8oC
For analysis of short term stability, eluates of simulated samples were initially
tested immediately after processing. The residual eluate was placed at 2-8°C
and tested again after six hours and eight hours of storage. All measurements
agreed with the expected results, demonstrating the stability of purified RNA
stored at 2 – 8°C for up to eight hours.
Storage of purified RNA at -70oC
For analysis of long term and freeze/thaw stability of purified RNA, eluates of
simulated samples were initially tested directly after processing. The residual
eluate was then stored at -65°C to -90°C. After two weeks the eluate was
thawed at 2 – 8°C for one hour and returned to storage at -65 to -90°C
(without testing). At four weeks, the eluate was thawed again for five hours at
2-8°C and tested. The remaining eluate was returned to the freezer. At six
weeks the eluate was thawed for the third time and tested. All measurements
agreed with the expected results demonstrating the stability of purified RNA
for two freeze-thaw cycles and six weeks storage at -65° to -90°C.
Storage of purified RNA on the EZ1 Advanced XL for up to three hours.
For analysis of short term stability of purified RNA on the EZ1 Advanced XL
instrument, eluates of Simulated Samples were left on the instrument for three
hours after the EZ1 Advanced XL run was finished. Testing was performed
immediately after the EZ1 Advanced XL run was complete. The eluates were
returned to the instrument platform and tested again at two hours and three
hours. All measurements agreed with the expected results, demonstrating the
stability of purified RNA that remains on the EZ1 Advanced XL instrument
for up to three hours.
Stability of nasopharyngeal swab specimens and of purified RNA from those
15
specimens was demonstrated by testing simulated samples stored under defined conditions. Samples were prepared by diluting Influenza A strain A/California/7/09-like virus or Influenza B strain B/Florida/4/2006-like virus in clinical sample matrix to a concentration of three times the LoD. Samples were processed for nucleic acid purification using EZ1 DSP Virus Kit with the EZ1 Advanced XL instrument. Testing was performed with the artus Infl A/B RG RT-PCR Kit on the RGQ instrument. The observed results agreed with the expected result for each sample and each time point.
Stability of simulated nasopharyngeal swab specimens and purified RNA was demonstrated for each of the sample types and storage conditions shown in the table below:
Sample Tested Storage Condition Simulated NP Swab Sample 8 days at 2-8 °C
6 weeks at -65 to -90°C (2 freeze thaws)
Purified RNA 8h at 2-8 °C
6 weeks at -65 to -90 (3 freeze thaws)
3h onboard EZ1 Advanced XL Instrument
d. Detection limit:
The limit of detection (LoD) of the artus Infl A/B RG RT-PCR Kit was determined and confirmed for six influenza A strains (two strains representing each of the influenza A subtypes of H1N1, H3N2, and 2009 H1N1) and two influenza B strains. Samples were prepared from re-cultured and re-titered virus diluted in nasopharyngeal clinical matrix. The LoD of each strain was initially determined by limited dilution testing of three replicates per dilution level. The result was confirmed by testing an additional 20 replicates at the LoD concentration. The LoD, defined as the level of virus that yields at least a 95% (19/20) detection rate with the artus Infl A/B RG RT-PCR Kit, ranged from 10e1.1 to 10e-0.1 TCID50/ml. The strains included in the analysis and the confirmed LoD are summarized in the table below.
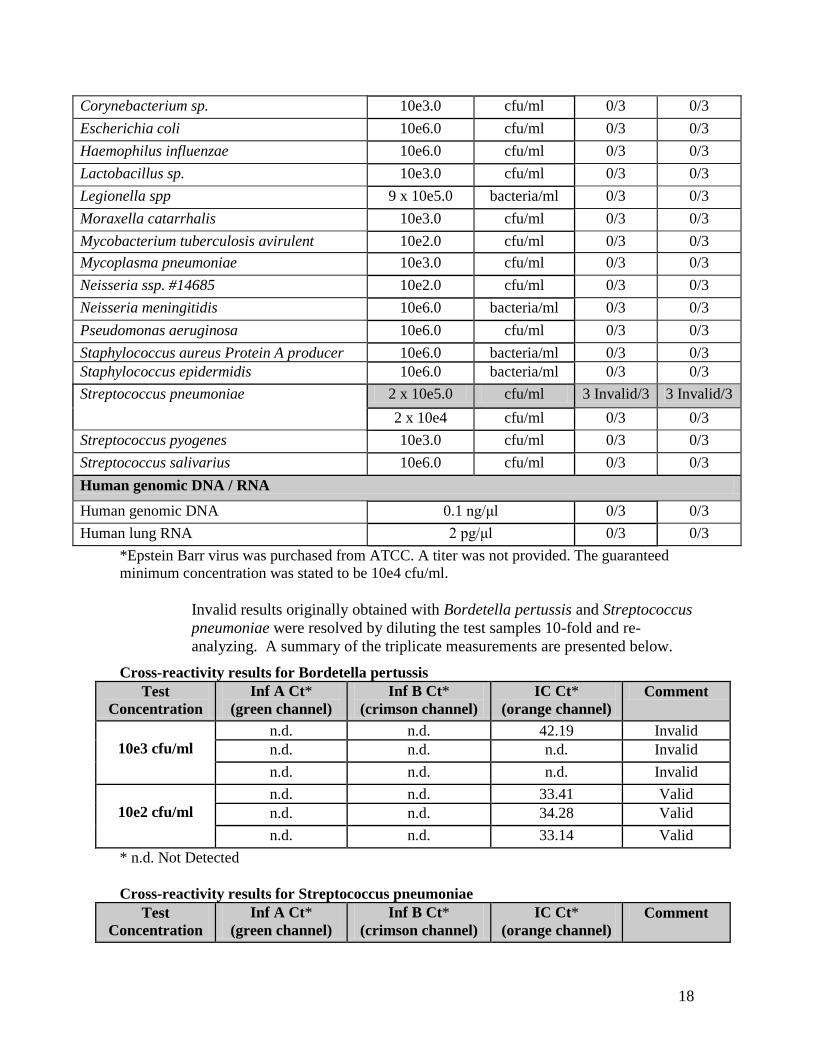
The analytical specificity of the artus Infl A/B RG RT-PCR Kit was evaluated by testing a panel of respiratory pathogens consisting of 31 virus strains (including seven influenza A and three influenza B strains) and 18 bacterial strains. The pathogens were tested at medically relevant levels. Human genomic DNA and RNA were also evaluated. Test samples were prepared by diluting the pathogen culture stock in Universal Transport Medium (UTM). Initial test concentrations of the potentially cross-reactive pathogens ranged from 10e3.2 to 10e6.1 TCID50/ml for viruses and from 10e2 to 10e6 cfu/ml for bacteria. Purified human genomic DNA (hDNA) and human genomic RNA (hRNA) were purchased and prepared at 0.1 ng/μl and 2 pg/μl,
respectively. A volume of 10μl was added directly to the master mix.
The artus Infl A/B RG RT-PCR Kit did not cross-react with 10 influenza
strains, 21 other respiratory viral pathogens, or 16 of 18 bacterial pathogens
present at medically relevant levels. Two of the 18 bacterial pathogens,
Bordetella pertussis and Streptococcus pneumoniae, generated invalid results
at concentrations of 10e3 cfu/ml and 2 x 10e5 cfu/ml, respectively. The
invalid results were generated by either absence of Ct values for the IC or Ct
values for the IC that fell out of the acceptable range. Re-extraction and
analysis of samples spiked with Streptococcus pneumoniae also generated
invalid results, suggesting the presence of a potential inhibitor. Upon dilution
of the eluates valid results were obtained. A spiked specimen was made with
a concentration 1 log lower than the initial preparation. Similarly, a new
spiked specimen containing Bordetella pertussis was also made to a final
concentration of 1 log lower than the original sample, yielding valid results.
There were no instances of cross-reactivity causing a false positive result for
Influenza A or Influenza B. A limitation has been added to the package insert
to indicate that the presence of Bordetella pertussis or Streptococcus pneumoniae can yield invalid results.
Cross-reactivity results for the artus Infl A/B RG RT-PCR Kit.
Pathogen Test Concentration Positive Replicates/ Total
Staphylococcus aureus Protein A producer 10e6.0 bacteria/ml 0/3 0/3 Staphylococcus epidermidis 10e6.0 bacteria/ml 0/3 0/3
Streptococcus pneumoniae 2 x 10e5.0 cfu/ml 3 Invalid/3 3 Invalid/3
2 x 10e4 cfu/ml 0/3 0/3
Streptococcus pyogenes 10e3.0 cfu/ml 0/3 0/3
Streptococcus salivarius 10e6.0 cfu/ml 0/3 0/3
Human genomic DNA / RNA
Human genomic DNA 0.1 ng/μl 0/3 0/3
Human lung RNA 2 pg/μl 0/3 0/3
*Epstein Barr virus was purchased from ATCC. A titer was not provided. The guaranteed minimum concentration was stated to be 10e4 cfu/ml.
Invalid results originally obtained with Bordetella pertussis and Streptococcus pneumoniae were resolved by diluting the test samples 10-fold and re-analyzing. A summary of the triplicate measurements are presented below.
Cross-reactivity results for Bordetella pertussis Test
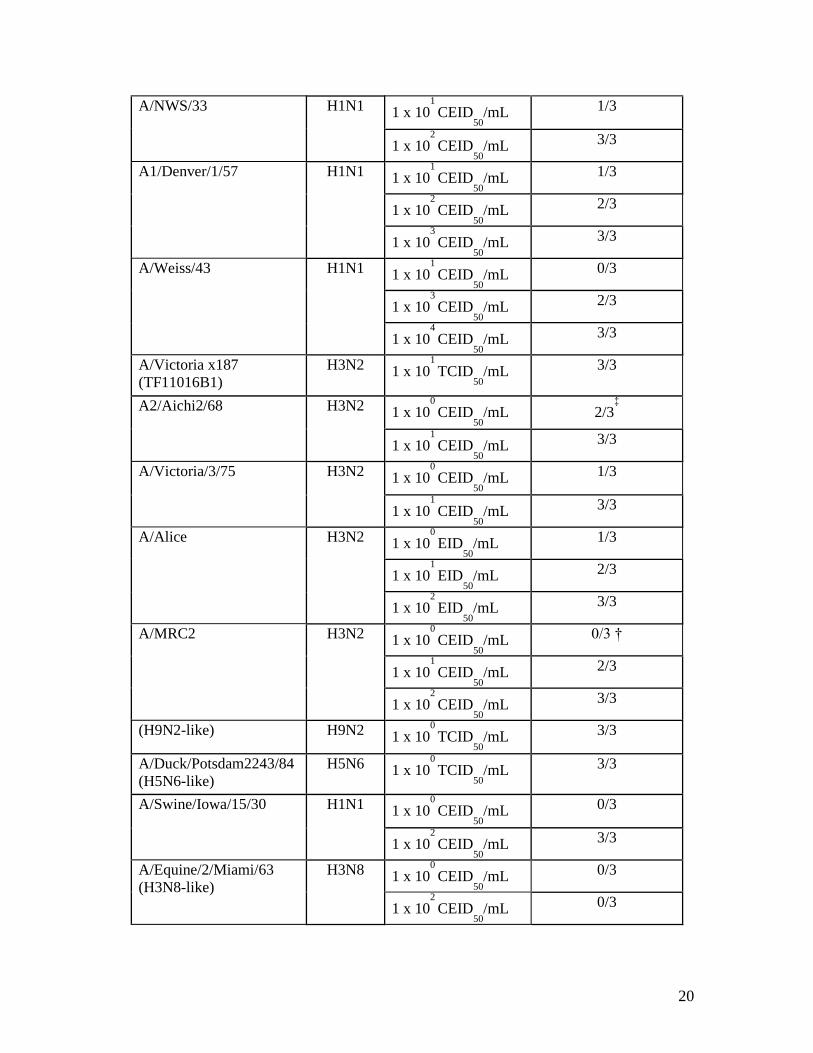
The analytical reactivity of the artus Infl A/B RG RT-PCR Kit was demonstrated by testing 18 strains of influenza A, including four strains originally identified in non-human species, and six strains of influenza B at concentrations near the limit of detection (LoD) of the test. Samples were prepared from whole virus diluted in clinical sample matrix and were selected to represent temporal and geographic diversity. The initial test concentration of each virus strain was the highest LoD concentration previously determined for the respective type or subtype. Viral stocks were obtained from ATCC or Novartis. For each strain, three aliquots at the initial test concentration were processed for nucleic acid extraction and purification using the EZ1 Advanced XL. The resulting three eluates for each strain were tested with the artus Infl A/B RG RT-PCR Kit on the RGQ. Reactivity was considered to be successfully demonstrated if three of three eluates generated a positive result in the appropriate target-specific channel. For strains generating fewer than three (of three) positive results, three aliquots of a higher concentration were processed and tested. This process was repeated until a virus concentration generating three of three positive results was obtained. Results from the analysis are summarized below.
Influenza A Virus Strain
Subtype Concentration Number Positive for Influenza A /
Number Tested A/Virginia/ATCC2/2009 2009
H1N1 1 x 10
1 TCID
50/mL 1/3
1 x 10² TCID
50/mL 3/3
A/PR/8/34 H1N1 1 x 101 TCID
50/mL 3/3
A/FM/1/47 H1N1 1 x 101 CEID
50/mL 3/3
A/Solomon Islands/3/2006 (H1N1)-like virus
H1N1 1 x 101 TCID
50/mL 3/3
A/Mal/302/54 H1N1 1 x 101 CEID
50/mL 3/3
A/New Jersey/8/76 H1N1 1 x 101 CEID
50/mL 3/3
20
A/NWS/33 H1N1 1 x 101 CEID
50/mL 1/3
1 x 10² CEID
50/mL 3/3
A1/Denver/1/57 H1N1 1 x 101 CEID
50/mL 1/3
1 x 10² CEID
50/mL 2/3
1 x 10³ CEID
50/mL 3/3
A/Weiss/43 H1N1 1 x 101 CEID
50/mL 0/3
1 x 10³ CEID
50/mL 2/3
1 x 10⁴ CEID
50/mL 3/3
A/Victoria x187 (TF11016B1)
H3N2 1 x 101 TCID
50/mL 3/3
A2/Aichi2/68 H3N2 1 x 100 CEID
50/mL 2/3
‡
1 x 101 CEID
50/mL 3/3
A/Victoria/3/75 H3N2 1 x 100 CEID
50/mL 1/3
1 x 101 CEID
50/mL 3/3
A/Alice H3N2 1 x 100 EID
50/mL 1/3
1 x 101 EID
50/mL 2/3
1 x 10² EID
50/mL 3/3
A/MRC2 H3N2 1 x 100 CEID
50/mL 0/3 †
1 x 101 CEID
50/mL 2/3
1 x 10² CEID
50/mL 3/3
(H9N2-like) H9N2 1 x 100 TCID
50/mL 3/3
A/Duck/Potsdam2243/84 (H5N6-like)
H5N6 1 x 100 TCID
50/mL 3/3
A/Swine/Iowa/15/30 H1N1 1 x 100 CEID
50/mL 0/3
1 x 10² CEID
50/mL 3/3
A/Equine/2/Miami/63 (H3N8-like)
H3N8 1 x 100 CEID
50/mL 0/3
1 x 10² CEID
50/mL 0/3
21
1 x 10⁴ CEID
50/mL 3/3
‡
For A2/Aichi2/68, one replicate at 1 x 100
CEID50
/mL was initially invalid. The sample
was re-processed for RNA purification and gave a valid result of negative for Inf A on re-test.
† For A/MRC2, one replicate at 1 x 100
CEID50
/ml was invalid. The sample was not re-
tested because the other two replicates were negative, requiring testing of this
Influenza B Virus
Strain Concentration Number Positive for
Influenza B / Number Tested
B/Lee/40 1 x 101 TCID
50/mL 3/3
B/Allen/45 1 x 101 CEID
50/mL 3/3
B/Taiwan/2/62 1 x 101 CEID
50/mL 3/3
B/Hong Kong/5/72 1 x 101 CEID
50/mL 3/3
B/Maryland/1/59 1 x 101 CEID
50/mL 3/3
B/Malaysia/2506/2004 1 x 101 TCID
50/mL 3/3
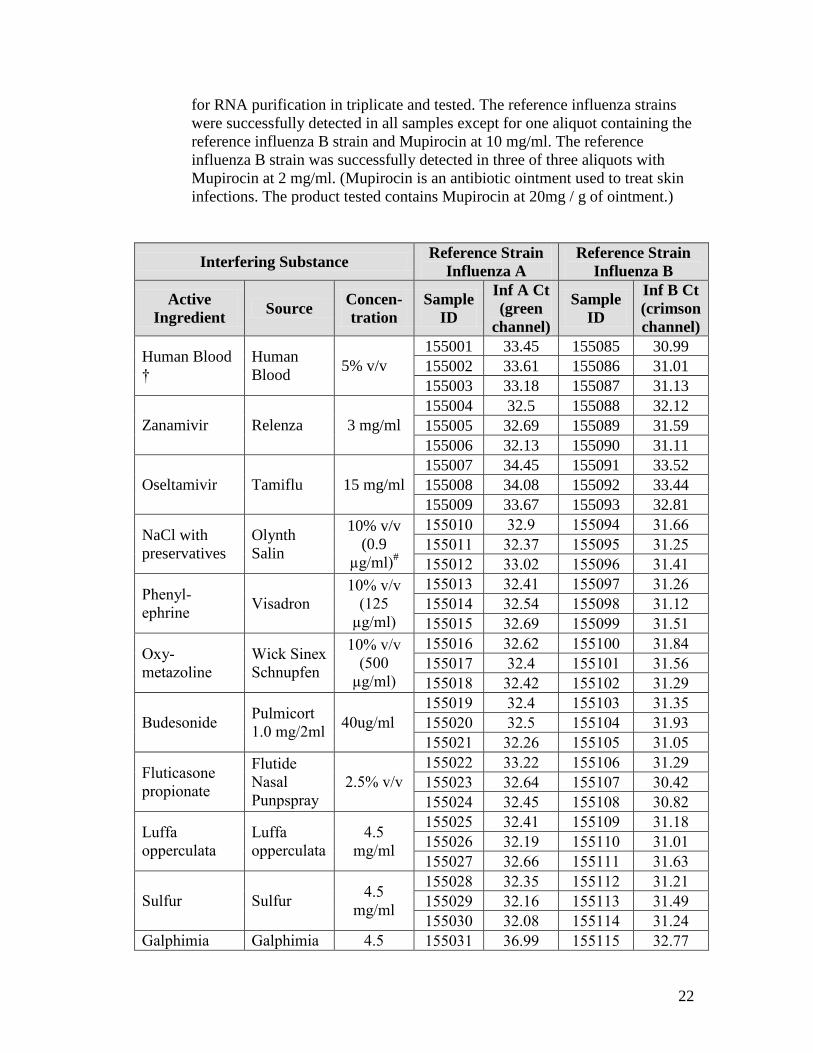
Interfering Substances
The potential for blood or medications that might be present in a nasopharyngeal swab specimen to interfere with the detection of low levels of influenza A or influenza B by the artus Infl A/B RG RT-PCR test was evaluated. A total of 24 substances representing the active ingredient in over-the-counter or prescription medications were tested against two influenza strains: A/California/7/09-like virus or B/Florida/4/2006-like virus. For each test sample, three aliquots were processed for RNA purification using the EZ1 DSP Virus Kit with the EZ1 Advanced XL instrument. The resulting three eluates were tested with the artus Infl A/B RG RT-PCR Kit in separate runs on one Rotor-Gene Q MDx (RGQ).
If one or more of the three replicates was negative for the influenza A or influenza B reference strain, testing was repeated with a lower concentration of the interfering substance until the reference strain was successfully detected in three of three replicates. The active ingredients from 24 over-the-counter or prescription medications and whole blood were evaluated for interference with the artus Infl A/B RG RT-PCR test. Samples containing the influenza strain A/California/7/09-like virus or B/Florida/4/2006-like virus at the LoD concentration of 10e1 TCID50/ml and the potential interferent were processed
22
for RNA purification in triplicate and tested. The reference influenza strains were successfully detected in all samples except for one aliquot containing the reference influenza B strain and Mupirocin at 10 mg/ml. The reference influenza B strain was successfully detected in three of three aliquots with Mupirocin at 2 mg/ml. (Mupirocin is an antibiotic ointment used to treat skin infections. The product tested contains Mupirocin at 20mg / g of ointment.)
Interfering Substance Reference Strain Influenza A
† The human blood sample was stored frozen before testing.
# Saline solution: a commonly used term for a sterile solution of sodium chloride
(NaCl) of 0.90% w/v, about 300mOsm/L or 9.0g per liter. Therefore it can be
assumed that a concentration of 0.9g/L was tested.
¥ Guaifenesin serves the same function as mucin. The source material, Fagusan, is
an alternative to Mucinex.
* Sample 155173 is a repeat (including RNA purification and testing) of the
originally invalid result from sample 155063. The original result was invalid
because the IC Ct was outside of the acceptance range required for samples
negative for Inf A and Inf B.
** Sample 155152 was valid and negative for Inf B. A new sample was prepared
with a five fold lower concentration of Mupirocin. The new sample was re-
extracted in triplicate and tested as sample IDs 155177 – 155179. The influenza B
reference strain was successfully detected in three of three replicates with the
lower concentration of Mupirocin.
25
§ The FluMist vaccine was tested without Influenza A and Influenza B reference
strains. Testing was performed as part of the Cross-Reactivity analytical
verification study (DHF-114-VER-006). Positive results for influenza A and B
were expected with the artus Infl A/B RG RT-PCR Kit because the vaccine contains RNA from Influenza A strains A/California/7/2009 (H1N1) and A/Perth/16/2009(H3N2) and from Influenza B strain B/Brisbane/60/2008.
f. Carry over/Contamination The potential for carryover or cross-contamination to occur during nucleic acid purification, using the EZ1 Advanced XL instrument with the EZ1 DSP Virus Kit, or during amplification / detection using the artus Infl A/B RG RT-PCR Kit with the Rotor-Gene Q MDX was evaluated by processing and testing samples with a high concentration of Influenza A in alternating sequence with samples containing the same analyte at a concentration that tested positive approximately 10% of the time (high negative). The artus Infl A/B RG RT-PCR test (including extraction using the EZ1 DSP Virus Kit with the EZ1 Advanced XL) showed no evidence of carryover or cross-contamination when 5 runs of a panel of 6 members of mock samples containing influenza A at a concentration just below the limit of detection of the assay were extracted and tested in alternating order with a panel of 6 members of mock samples of the same strain present at a high concentration. Analysis of the negative rate of the high negative samples is not affected by the presence of high positive samples and supporting the conclusion that carryover and cross-contamination do not occur during RNA purification with the EZ1 DSP Virus Kit on the EZ1 Advanced XL instrument or during testing with the artus Infl A/B RG RT-PCR Kit on the RotoGene Q MDx.
g. LoB Study:
The Limit of Blank (LoB) was established by testing sixty influenza-negative nasopharyngeal swab specimens with the artus Infl A/B RG RT-PCR Kit. The robustness of the Internal Control (IC) signal was evaluated by assessing the IC signals in the same set of samples.
Sixty residual, de-identified nasopharyngeal swab specimens collected in UTM were tested in the study. The specimens were negative for Influenza A and Influenza B by culture. Each of the sixty specimens was processed for RNA purification and tested once. Specimens that generate a Ct value in the Infl A or Infl B channel of the RGQ within 45 cycles are determined to be positive for Influenza A or Influenza B RNA, respectively. For the Limit of Blank study, the number of PCR cycles was changed from the usual 45 cycles to 50 cycles to ensure that influenza-negative specimens do not generate a Ct close to (but later than) the assay cutoff of 45 cycles. The use of a pre-launch version of the RGQ software allows the PCR cycling profile to be manually applied. RNA purification was performed with one lot of EZ1 DSP Virus Kits
26
on three EZ1 Advanced XL instruments. Testing included three lots of the artus Infl A/B RG RT-PCR Kit, three RGQ instruments and three operators.
Sixty influenza-negative (by culture) NPS specimens were processed for RNA purification and tested with the artus Infl A/B RG RT PCR Kit. The Influenza A/B Internal Control demonstrated robust performance in the artus Infl A/B RG RT PCR test. None of the 60 specimens generated a Ct for Influenza A or Influenza B through 50 PCR cycles, indicating that the LoB for the assay is greater than 50 Ct. The Internal Control Ct of each of the 60 specimens was within the acceptance range of 26 – 36 Ct. The average Ct for the Internal
Control was 31.17 with a CV of 1.6%. These results support the assay cutoff
of less than 45 Ct for discriminating positive from negative specimens.
2. Comparison studies:
a. Method comparison with predicate device:
Not Applicable
b. Matrix comparison:
The impact of freezing on the performance characteristics of the artus Infl A/B RG RT-PCR Assay was assessed using prospectively collected nasopharyngeal swab specimens. All prospectively collected specimens were originally characterized when the UTM was fresh (i.e., portions of UTM were subjected to viral culture and nucleic acid extraction prior to freezing). An aliquot from all prospectively collected nasopharyngeal swab specimens were stored at -70°C or lower for at least 21 days before retesting with the artus Infl A/B RG RT-PCR Assay. Nucleic acid was extracted from a 400 μL portion of
frozen UTM using the EZ1 Advanced XL/DSP Virus system for testing by the
artus Infl A/BRT-PCR Kit; the eluate was either tested immediately or stored at −70°C or below for later testing. The aliquot used for this study was the
primary backup specimen for the prospective analysis in the event that a
specimen failed or was lost. A total of 244 specimens were evaluable when
comparing the investigational artus method to viral culture, or the artus Infl
A/B RG RT-PCR result from specimens tested prior to freezing. The overall
positive agreement of testing frozen UTM with the artus Infl A/B RG RT-
PCR test relative to fresh UTM was 100% for Influenza A and 98.2% for
Influenza B. The overall negative agreement for both Influenza A and
Influenza B was 100%. The results are summarized below in a 2x2
comparison of fresh vs. frozen NP swab specimens in UTM.
Influenza A Test Results from Frozen UTM Relative to Fresh UTM among Prospectively Collected NP Swab Specimens
27
Influenza A
Performance Fresh UTM – artus
Influenza A Calculated
Result 95% Confidence
Interval Positive Negative Total Metric % Lower CI Upper CI
Frozen UTM artus Infl A
Positive 27 0 27 Positive
Agreement 100 0.88 1
Negative 0 217 217 Negative
Agreement 100 0.98 1
Total 27 217 244
Influenza B Test Results from Frozen UTM Relative to Fresh UTM among Prospectively Collected NP Swab Specimens
Influenza B
Performance Fresh UTM – artus
Influenza B Calculated
Result 95% Confidence
Interval Positive Negative Total Metric % Lower CI Upper CI
Frozen UTM artus Infl B
Positive 54 0 54 Positive
Agreement 98.2 0.90 1
Negative 1 189 190 Negative
Agreement 100 0.98 1
Total 55 189 244
3. Clinical studies:
To assess performance of the artus Infl A/B RG RT-PCR Kit a multi-center study was performed. Three independent clinical trial testing sites, separated geographically within the United States, were used.
The study was conducted in three parts. The first part included testing fresh prospectively collected nasopharyngeal swab specimens from individuals with a respiratory tract infection wherein said infection was suspected of being caused by a respiratory virus. Only one specimen was collected per subject; specimens were subjected to viral culture, and nucleic acids were extracted from these specimens within 36 hours of collection for investigational artus testing. The second part of the trial involved testing (at two clinical sites, Site 1 and Site 2) of prospectively collected and archived clinical samples over two influenza seasons from the Site 2. The third part of the trial involved multisite testing of retrospectively collected specimens acquired from the CDC Influenza Banking Program. In total, the results of 928 specimens were evaluated in this clinical evaluation. Each part of the study is discussed in detail below.
28
Part 1 A total of 272 subjects were enrolled in the fresh prospective clinical study during the 2010/2011 flu season. In order to be eligible for the study, subjects must have signed an informed consent and must have had symptoms of an acute respiratory tract infection for less than five days. Considering these criteria, a total of 18 subjects were considered ineligible due to unconfirmed consent (i.e. improper consenting etc.), or subjects were excluded due to (a) the duration of the subjects symptoms exceeding five days, or (b) the subject’s symptoms were not properly
documented. Consequently, there were 254 subjects that met the study eligibility
criteria from three sites.
The demographics for the prospective study are as follows:
Age Group (Years)
Site 1 Site 2 Site 3 All Sites N % N % N % N %
<5 0 0 0 0 90 45.0 90 35.4
≥5 and £21 3 11.1 1 3.7 102 51.0 106 41.7
≥22 and £59 23 85.2 22 81.5 6 3.0 51 20.1
>60 1 3.7 3 11.1 2 1.0 6 2.4
Total 27 100 27 100 200 100 254 100
All Sites Combined – Influenza A
Performance Culture/DFA Influenza A
Calculated Result
95% Confidence Interval
Positive Negative Total Metric % Lower CI Upper CI
artus Infl A/B RG RT-PCR
Test
Positive 15 12 27 Sensitivity 100 0.80 1
Negative 0 227 227 Specificity 95.0 0.91 0.97
Total 15 239 254
Results at Each Site – Influenza A
Site 1 Performance
Culture/DFA Influenza A
Calculated Result
95% Confidence Interval
Positive Negative Total Metric % Lower CI Upper CI
artus Infl A/B RG RT-PCR
Test
Positive 2 2 4 Sensitivity 100 0.34 1
Negative 0 23 23 Specificity 92.0 0.75 0.98
Total 2 25 27
29
Site 2 Performance
Culture/DFA Influenza A
Calculated Result
95% Confidence Interval
Positive Negative Total Metric % Lower CI Upper CI
artus Infl A/B RG RT-PCR
Test
Positive 4 3 7 Sensitivity 100 0.51 1
Negative 0 20 20 Specificity 86.9 0.68 0.95
Total 4 23 27
Site 3 Performance
Culture/DFA Influenza A
Calculated Result
95% Confidence Interval
Positive Negative Total Metric % Lower CI Upper CI
artus Infl A/B RG RT-PCR
Test
Positive 9 7 16 Sensitivity 100 0.70 1
Negative 0 184 184 Specificity 96.3 0.93 0.98
Total 9 191 200
All Sites Combined – Influenza B
Performance Culture/DFA Influenza B
Calculated Result
95% Confidence Interval
Positive Negative Total Metric % Lower CI Upper CI
artus Infl A/B RG RT-PCR
Test
Positive 45 11 56 Sensitivity 100 0.92 1
Negative 0 198 198 Specificity 94.7 0.91 0.97
Total 45 209 254
Results at Each Site – Influenza B
Site 1 Performance
Culture/DFA Influenza B
Calculated Result
95% Confidence Interval
Positive Negative Total Metric % Lower CI Upper CI
artus Infl A/B RG RT-PCR
Test
Positive 1 1 2 Sensitivity 100 0.21 1
Negative 0 25 25 Specificity 96.2 0.81 0.99
Total 1 26 27
Site 2 Performance
Culture/DFA Influenza B
Calculated Result
95% Confidence Interval
30
Positive Negative Total Metric % Lower CI Upper CI
artus Infl A/B RG RT-PCR
Test
Positive 2 0 2 Sensitivity 100 0.34 1
Negative 0 25 25 Specificity 100 0.87 1
Total 2 25 27
Site 3 Performance
Culture/DFA Influenza B
Calculated Result
95% Confidence Interval
Positive Negative Total Metric % Lower CI Upper CI
artus Infl A/B RG RT-PCR
Test
Positive 42 10 52 Sensitivity 100 0.92 1
Negative 0 148 148 Specificity 93.7 0.89 0.96
Total 42 158 200
The overall sensitivity of the artus Infl A/B RG RT-PCR test relative to viral culture was 100% for both Influenza A and Influenza B. The overall specificity of the investigational artus test for Influenza A and Influenza B was 95.0% and 94.7%, respectively. There were a total of 23 discordant results in the fresh prospective clinical evaluation. All discordant results were positive by the artus Infl A/B test, but negative by standard viral culture. Twelve of these were Influenza A positive, while 11 were Influenza B positive. The Ct-values of the 12 discordant Influenza A specimens are compared with the Ct-values of the 15 concordant positive specimens in as well as the Ct-values of the 11 discordant Influenza B specimens are compared with the Ct-values of the 45 concordant positive specimens were compared. The distribution of Ct-values between the concordant positive specimens and the discordant specimens formed two distinct populations for both Influenza A and Influenza B. The comparison is presented below.
Analysis of the artus Infl A/B RG RT-PCR Test Ct-Values among Culture Positive and Culture Negative Specimens for Flu A and Flu B Positive Specimens
Influenza A Ct-Values Influenza B Ct-Values
Culture Positive
Culture Negative
All artus A/B Positive
Culture Positive
Culture Negative
All artus A/B Positive
N 15 12 27 45 11 56 Mean 22.99 32.44 27.19 21.24 31.57 23.27 St. Dev. 2.70 4.01 5.80 3.32 4.48 5.44 Lower CI* 21.49 29.88 24.89 20.24 28.56 21.81 Upper CI* 24.48 34.99 29.48 22.24 34.58 24.73 Min 18.46 29.15 18.46 15.65 24.55 15.65 Max 26.80 42.74 42.74 28.05 37.03 37.03 Range 8.34 13.59 24.28 12.40 12.48 21.38 Median 23.27 31.09 26.80 20.85 33.19 22.31
31
Bi-directional sequencing was performed on 24 of the 27 Influenza A positive specimens, and all 56 Influenza B positive specimens. Three Influenza A positive specimens from Site 2 were not tested with bi-directional sequencing and all three were culture negative.
Of the remaining 24 Influenza A positive specimens, only two specimens could not be confirmed as Influenza A; both specimens were culture negative. Both specimens had high Ct-values relative to other discordant culture negative specimens.
All 56 Influenza B positive specimens were submitted for bi-directional sequencing; a total of 49 were confirmed as Influenza B.
Part 2
In the second part of the clinical evaluation prospectively collected and archived clinical specimens from Site 2 were used. The specimens enrolled in the study spanned two influenza seasons (between 8/24/2009-1/13/2010 and 1/14/2011-5/10/2011) and represented an all-comers study. They were included in the study based on the inclusion criteria of the study protocol. Samples from this study were analyzed at two sites. A total of 198 specimens were shipped to Site 1 for artus Infl A/B testing, while 265 were tested at Site 2 with the artus Infl A/B test. The reference method used for this study was one of two FDA cleared high performance molecular tests for influenza. The following tables represent the results of performance evaluation through comparison to each FDA cleared molecular device individually at each site, at all sites combined, and finally at all sites combined
The demographics for the prospectively collected and archived study are as follows:
Age Group (Years)
Site 1 SITE 2 All Sites N % N % N %
<5 5 2.5 2 0.8 7 1.5
≥5 and £21 27 13.7 16 6.0 43 9.3
≥22 and £59 138 70.1 189 71.3 327 70.8
>60 24 12.2 56 21.1 80 17.3
Total 197 100 265 100 462 100
Comparison of artus Infl A/B RG RT-PCR Test Results in the Site 2 Prospectively collected and Archived Specimen Study Relative to an FDA Cleared Molecular Reference Result for Influenza A
32
All Sites Combined – Influenza A
Performance FDA Cleared Molecular (1) Influenza A
Calculated Result
95% Confidence Interval
Positive Negative Total Metric % Lower CI Upper CI
artus Infl A/B RG RT-PCR
Test
Positive 73 9 82 Positive
Agreement 98.6 0.93 1
Negative 1 162 163 Negative
Agreement 94.7 0.90 0.97
Total 74 171 245
Performance FDA Cleared Molecular (2) Influenza A
Calculated Result
95% Confidence Interval
Positive Negative Total Metric % Lower CI Upper CI
artus Infl A/B RG RT-PCR
Test
Positive 21 10 31 Positive
Agreement 95.5 0.78 0.99
Negative 1 185 186 Negative
Agreement 94.9 0.91 0.97
Total 22 195 217
Results at Each Site – Influenza A
Site 1 Performance
FDA Cleared Molecular (1) Influenza A
Calculated Result
95% Confidence Interval
Positive Negative Total Metric % Lower CI Upper CI
artus Infl A/B RG RT-PCR
Test
Positive 30 0 30 Positive
Agreement 100.0 0.89 1
Negative 0 4 4 Negative
Agreement 100.0 0.51 1
Total 30 4 34
Performance FDA Cleared Molecular (2) Influenza A
Calculated Result
95% Confidence Interval
Positive Negative Total Metric % Lower CI Upper CI
artus Infl A/B RG RT-PCR
Test
Positive 20 10 30 Positive
Agreement 95.2 0.77 0.99
Negative 1 132 133 Negative
Agreement 93.0 0.88 0.96
Total 21 142 163
Results at Each Site – Influenza A
Site 2 Performance
33
FDA Cleared Molecular (1) Influenza A
CalculatedResult
95% Confidence Interval
Positive Negative Total Metric % Lower CI Upper CI
artus Infl A/B RG RT-PCR
Test
Positive 43 9 52 Positive
Agreement 97.7 0.88 1
Negative 1 158 159 Negative
Agreement 94.6 0.90 0.97
Total 44 167 211
Performance FDA Cleared Molecular (2) Influenza A
CalculatedResult
95% Confidence Interval
Positive Negative Total Metric % Lower CI Upper CI
artus Infl A/B RG RT-PCR
Test
Positive 1 0 1 Positive
Agreement 100.0 0.21 1
Negative 0 53 53 Negative
Agreement 100.0 0.93 1
Total 1 53 54
Comparison of artus Infl A/B RG RT-PCR Test Results in the Site 2 Prospectively collected and Archived Specimen Study Relative to the Combined Reference Results for Influenza A
All Sites Combined – Influenza A
Performance Combined FDA
Cleared Molecular Influenza A
CalculatedResult
95% Confidence Interval
Positive Negative Total Metric % Lower CI Upper CI
artus Infl A/B RG RT-PCR
Test
Positive 94 19 113 Positive
Agreement 97.9 0.93 0.99
Negative 2 347 349 Negative
Agreement 94.8 0.92 0.97
Total 96 366 462
Comparison of artus Infl A/B RG RT-PCR Test Results in the SITE 2 Prospectively collected and Archived Specimen Study Relative to an FDA Cleared Molecular Reference Result for Influenza B
34
All Sites Combined – Influenza B
Performance FDA Cleared Molecular (1) Influenza B
Calculated Result
95% Confidence Interval
Positive Negative Total Metric % Lower CI Upper CI
artus Infl A/B RG RT-PCR
Test
Positive 13 2 15 Positive
Agreement 100.0 0.77 1
Negative 0 230 230 Negative
Agreement 99.1 0.97 1
Total 13 232 245
Performance FDA Cleared Molecular (2) Influenza B
Calculated Result
95% Confidence Interval
Positive Negative Total Metric % Lower CI Upper CI
artus Infl A/B RG RT-PCR
Test
Positive 1 0 1 Positive
Agreement 100.0 0.20 1
Negative 0 216 216 Negative
Agreement 100.0 0.98 1
Total 1 216 217
Results at Each Site – Influenza B
Site 1 Performance
FDA Cleared Molecular (1) Influenza B
Calculated Result
95% Confidence Interval
Positive Negative Total Metric % Lower CI Upper CI
artus Infl A/B RG RT-PCR
Test
Positive 0 0 0 Positive
Agreement - - -
Negative 0 34 34 Negative
Agreement 100.0 0.90 1
Total 0 34 34 Performance
FDA Cleared Molecular (2) Influenza B
Calculated Result
95% Confidence Interval
Positive Negative Total Metric % Lower CI Upper CI
artus Infl A/B RG RT-PCR
Test
Positive 0 0 0 Positive
Agreement - - -
Negative 0 163 163 Negative
Agreement 100.0 0.98 1
Total 0 163 163
Results at Each Site – Influenza B
Site 2 Performance
35
FDA Cleared Molecular (1) Influenza B
CalculatedResult
95% Confidence Interval
Positive Negative Total Metric % Lower CI Upper CI
artus Infl A/B RG RT-PCR
Test
Positive 13 2 15 Positive
Agreement 100 0.77 1
Negative 0 196 196 Negative
Agreement 99.0 0.96 1
Total 13 198 211
Performance FDA Cleared Molecular (2) Influenza B
CalculatedResult
95% Confidence Interval
Positive Negative Total Metric % Lower CI Upper CI
artus Infl A/B RG RT-PCR
Test
Positive 1 0 1 Positive
Agreement 100.0 0.21 1
Negative 0 53 53 Negative
Agreement 100.0 0.93 1
Total 1 53 54
Comparison of artus Infl A/B RG RT-PCR Test Results in the Prospectively collected and Archived Specimen Study Relative to the Combined Reference Results for Influenza B
All Sites Combined – Influenza B
Performance Reference Result
Influenza B Calculated
Result 95% Confidence
Interval Positive Negative Total Metric % Lower CI Upper CI
artus Infl A/B RG RT-PCR
Test
Positive 14 2 16 Positive
Agreement 100 0.79 1
Negative 0 446 446 Negative
Agreement 99.6 0.98 1
Total 14 448 462
4. Clinical cut-off:
Not applicable
5. Expected values/Reference range:
Influenza viruses often change from one season to the next, or even within a season, due to antigenic drift. Distribution of virus types and subtypes can also vary by geographic region. According to reports from the Centers for Disease Control and Prevention (CDC), during the 2010–11 flu season in the United
States, the most commonly reported virus was influenza A (H3N2) although high
36
levels of 2009 influenza A (H1N1) and influenza B viruses circulated as well. Of 246,128 specimens tested for influenza viruses, 54,226 (22%) were positive. Of the positive specimens, 40,282 (74%) were influenza A viruses, and 13,944 (26%) were influenza B viruses. By comparison, in the southeast region of the United States, 10,026 specimens were positive for influenza, of which 6,071 (61%) were influenza A viruses and 3,955 (39%) were influenza B viruses.
In the prospective clinical study for the artus Infl A/B RG RT-PCR Kit, nasopharyngeal swab specimens were prospectively collected from 254 patients with symptoms of respiratory tract infection from February to April 2011 and analyzed fresh. Of the 254 specimens, 60 (23.6%) were positive. Of the positive specimens, 15 (25%) were positive for influenza A and 45 (75%) were positive for influenza B. There was no Influenza A and B dual positive specimen detected by the artus Infl A/B RG RT-PCR Kit or the reference method during the prospective clinical study.
In addition, a total of 462 prospectively collected archived specimens from patients with symptoms of respiratory tract infection from August 2009 to May 2011 were tested. Of the 462 specimens, 110 (23.8%) were positive. Of the positive specimens, 96 (87.3%) were positive for influenza A and 14 (12.7%) were positive for influenza B. There was no Influenza A and B dual positive specimen detected by the artus Infl A/B RG RT-PCR Kit or the reference methods during the clinical study.
N. Proposed Labeling:
The labeling is sufficient and it satisfies the requirements of 21 CFR Part 809.10.
O. Conclusion:
The submitted information in this premarket notification is complete and supports a substantial equivalence decision.