Provider A 3Provider B 3Provider C 2.25Provider D 3Provider E 3Provider F 3
HOURS per session Mon AM Mon PM Total Tues AM Tues PM Total Wed AM Wed PM Total Thu AM Thu PM Total Fri AMProvider A 3.5 4 22.5 4 12 3.5 2 16.5 4 12 3.5Provider B 0 2.5 3 16.5 2.5 3 16.5 0 2.5Provider C 2.5 4 14.625 0 4 9 3.5 4 16.875
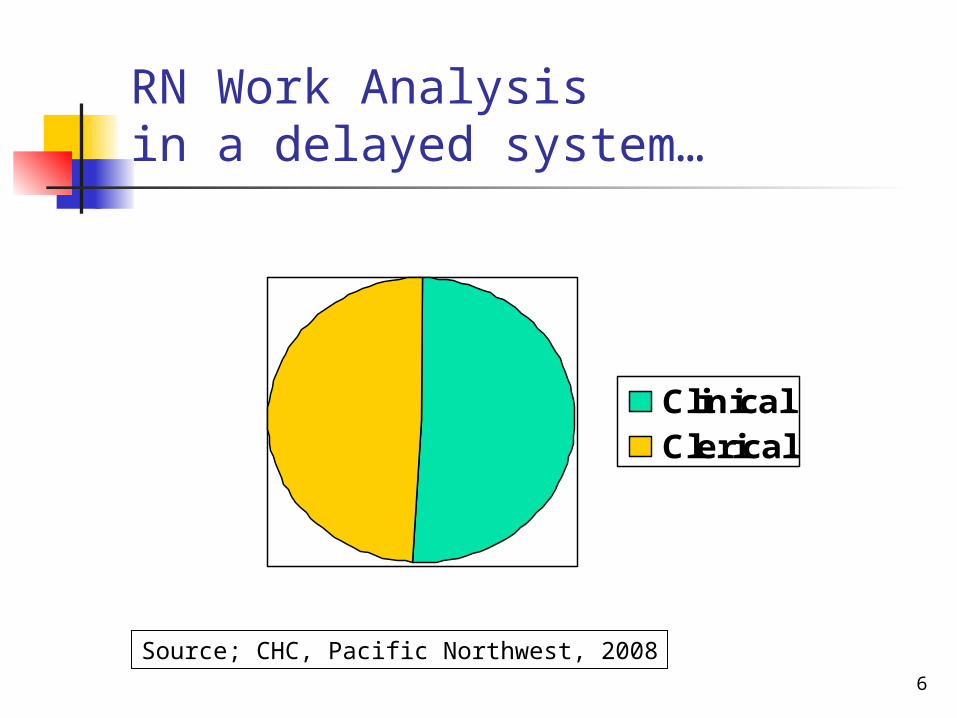
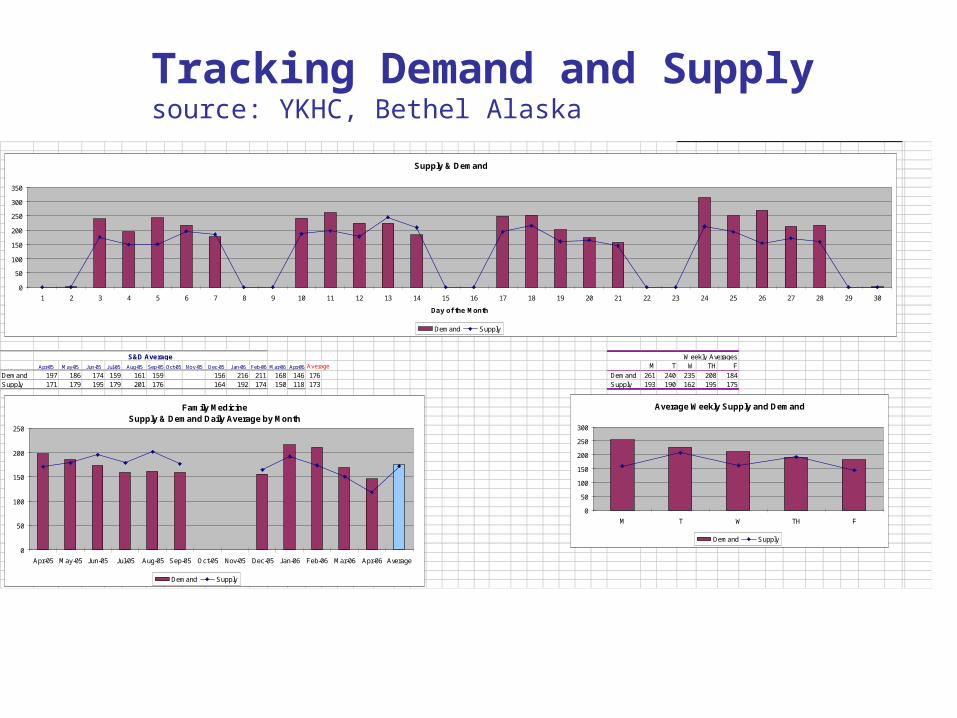
Appointment Capacity versus Demand
0
10
20
30
40
50
60
70
80
90
100
Monday Tuesday Wednesday Thursday Friday
Provider capacity Measured demand
Measured demand
Calls for visits
Other external demand
Internal demand
# appt per day
Monday 0Tuesday 0Wednesday 0Thursday 0Friday 0
Provider capacity
# appt per day
Monday 0Tuesday 0Wednesday 0Thursday 0Friday 0
VISIT RATEVisits per hour
Provider AProvider BProvider CProvider DProvider EProvider F
HOURS per session Mon AM Mon PM Total Tues AM Tues PM Total Wed AM Wed PM Total Thu AM Thu PM Total Fri AM Fri PM TotalProvider A 0 0 0 0 0Provider B 0 0 0 0 0Provider C 0 0 0 0 0Provider D 0 0 0 0 0Provider E 0 0 0 0 0Provider F 0 0 0 0 0
Mon Total 0 Tue Total 0 Wed Total 0 Thu Total 0 Fri Total 0
Appointment Capacity versus Demand
0
0.1
0.2
0.3
0.4
0.5
0.6
0.7
0.8
0.9
1
Monday Tuesday Wednesday Thursday Friday
Provider capacity Measured demand
16
Supply Macro Supply…dept level Deployment of Supply…bookable hours Measures
Measure when schedule is released. Appts per session for each day of week per provider. Estimate % long and shorts based on prior schedules
Hours per session ? Productivity standard? Office FTE modification
Process of Supply… What is the work? Who does the work? What can we try doing differently?
Provider A 3Provider B 3Provider C 2.25Provider D 3Provider E 3Provider F 3
HOURS per session Mon AM Mon PM Total Tues AM Tues PM Total Wed AM Wed PM Total Thu AM Thu PM Total Fri AMProvider A 3.5 4 22.5 4 12 3.5 2 16.5 4 12 3.5Provider B 0 2.5 3 16.5 2.5 3 16.5 0 2.5Provider C 2.5 4 14.625 0 4 9 3.5 4 16.875
What’s your situation?How do you know? D>S ? D<S ? D:S ?------------------------------------------------ “Our schedules are jammed every day.
Our Demand must outstrip our Supply”(??????)
“We’ve had the same Delay for months.” “We measure D and S, continuously and
map the trends.”
27
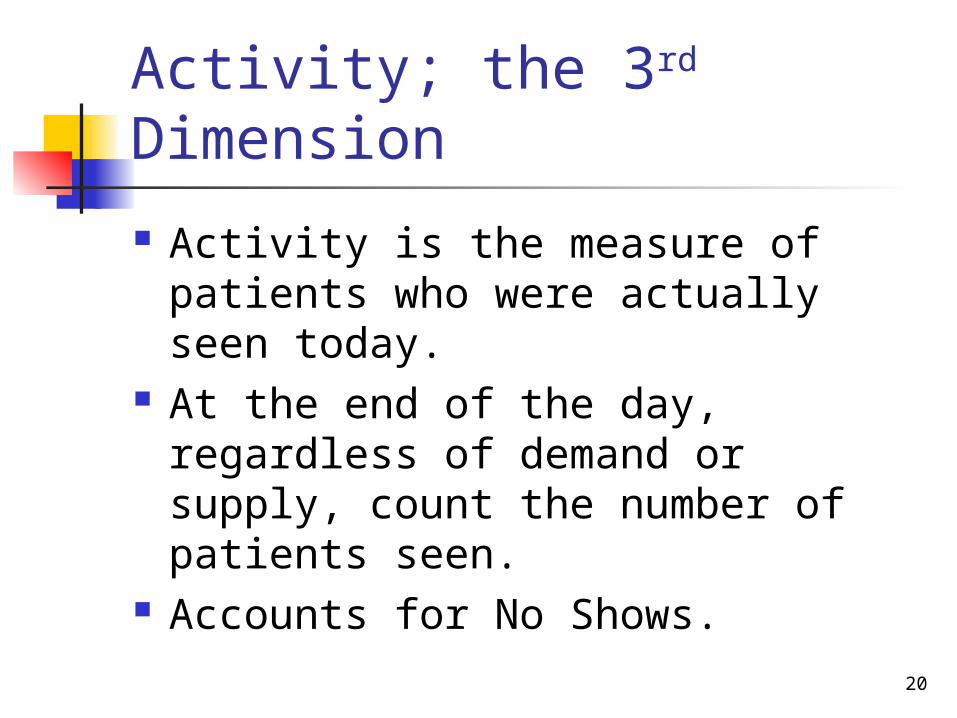
Show and Tell
Teams share their data Ask questions Discuss next steps
28
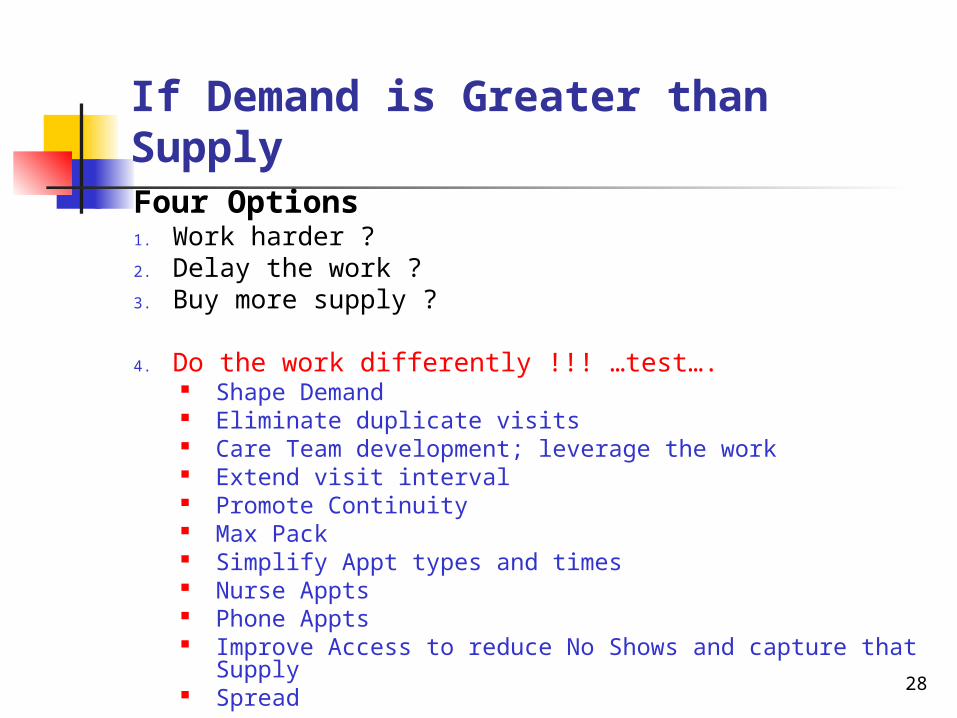
If Demand is Greater than SupplyFour Options1. Work harder ?2. Delay the work ?3. Buy more supply ?
4. Do the work differently !!! …test…. Shape Demand Eliminate duplicate visits Care Team development; leverage the work Extend visit interval Promote Continuity Max Pack Simplify Appt types and times Nurse Appts Phone Appts Improve Access to reduce No Shows and capture that
Supply Spread
29
Identify source of demand and ask, “Why?”
Internal External Discontinuity Single issue visits to ramp up visit count? Bumping Delays and defensive booking Sub-optimized Care Team Growth