16
1 ANOVA Homework Solutions EPP 245/298 Statistical Analysis of Laboratory Data
| Date post: | 19-Dec-2015 |
| Category: |
Documents |
| View: | 217 times |
| Download: | 2 times |

1
ANOVA Homework Solutions
EPP 245/298
Statistical Analysis of
Laboratory Data

November 10, 2004 EPP 245 Statistical Analysis of Laboratory Data
2
Exercise 6.1
> library(ISwR)Loading required package: survival Loading required package: splines > data(zelazo)> zelazo$active[1] 9.00 9.50 9.75 10.00 13.00 9.50
$passive[1] 11.00 10.00 10.00 11.75 10.50 15.00
$none[1] 11.50 12.00 9.00 11.50 13.25 13.00
$ctr.8w[1] 13.25 11.50 12.00 13.50 11.50

November 10, 2004 EPP 245 Statistical Analysis of Laboratory Data
3
> age.walk <- c(zelazo$active,zelazo$passive,zelazo$none,zelazo$ctr.8w)> group <- rep(c("active","passive","none","ctr.8w"),c(6,6,6,5))> group <- as.factor(group)> group [1] active active active active active active passive passive passive[10] passive passive passive none none none none none none [19] ctr.8w ctr.8w ctr.8w ctr.8w ctr.8w Levels: active ctr.8w none passive> anova(lm(age.walk ~ group))Analysis of Variance Table
Response: age.walk Df Sum Sq Mean Sq F value Pr(>F)group 3 14.778 4.926 2.1422 0.1285Residuals 19 43.690 2.299> plot(age.walk ~ group)

November 10, 2004 EPP 245 Statistical Analysis of Laboratory Data
4
November 10, 2004 EPP 245 Statistical Analysis of Laboratory Data
5
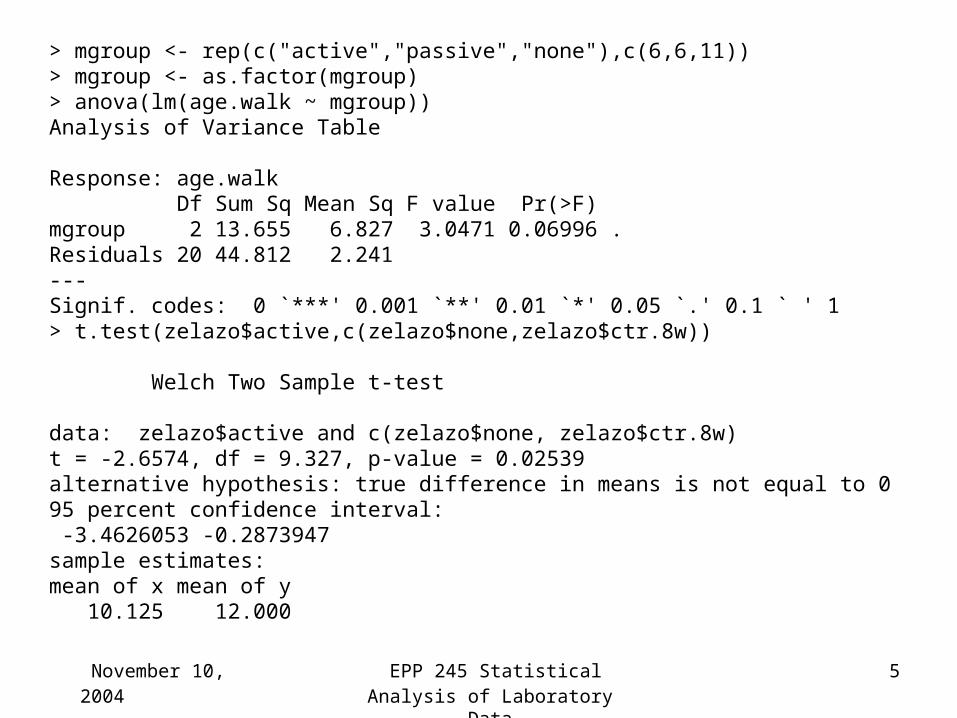
> mgroup <- rep(c("active","passive","none"),c(6,6,11))> mgroup <- as.factor(mgroup) > anova(lm(age.walk ~ mgroup))Analysis of Variance Table
Response: age.walk Df Sum Sq Mean Sq F value Pr(>F) mgroup 2 13.655 6.827 3.0471 0.06996 .Residuals 20 44.812 2.241 ---Signif. codes: 0 `***' 0.001 `**' 0.01 `*' 0.05 `.' 0.1 ` ' 1> t.test(zelazo$active,c(zelazo$none,zelazo$ctr.8w))
Welch Two Sample t-test
data: zelazo$active and c(zelazo$none, zelazo$ctr.8w) t = -2.6574, df = 9.327, p-value = 0.02539alternative hypothesis: true difference in means is not equal to 0 95 percent confidence interval: -3.4626053 -0.2873947 sample estimates:mean of x mean of y 10.125 12.000

November 10, 2004 EPP 245 Statistical Analysis of Laboratory Data
6
Exercise 6.2
• Lung data set has columns– volume = measured lung volume– method = method of measurement– subject = subject
• Compare the methods. Are they different? Which ones differ?

November 10, 2004 EPP 245 Statistical Analysis of Laboratory Data
7
> attach(lung)> lm(volume ~ method + subject)
Call:lm(formula = volume ~ method + subject)
Coefficients:(Intercept) methodB methodC subject2 subject3 subject4 3.17222 0.28333 0.60000 -0.83333 0.10000 -0.06667 subject5 subject6 -0.03333 -0.60000
> lung.lm <- lm(volume ~ method + subject)> anova(lung.lm)Analysis of Variance Table
Response: volume Df Sum Sq Mean Sq F value Pr(>F) method 2 1.08111 0.54056 6.4953 0.01557 *subject 5 2.18278 0.43656 5.2457 0.01271 *Residuals 10 0.83222 0.08322 ---Signif. codes: 0 `***' 0.001 `**' 0.01 `*' 0.05 `.' 0.1 ` ' 1

November 10, 2004 EPP 245 Statistical Analysis of Laboratory Data
8
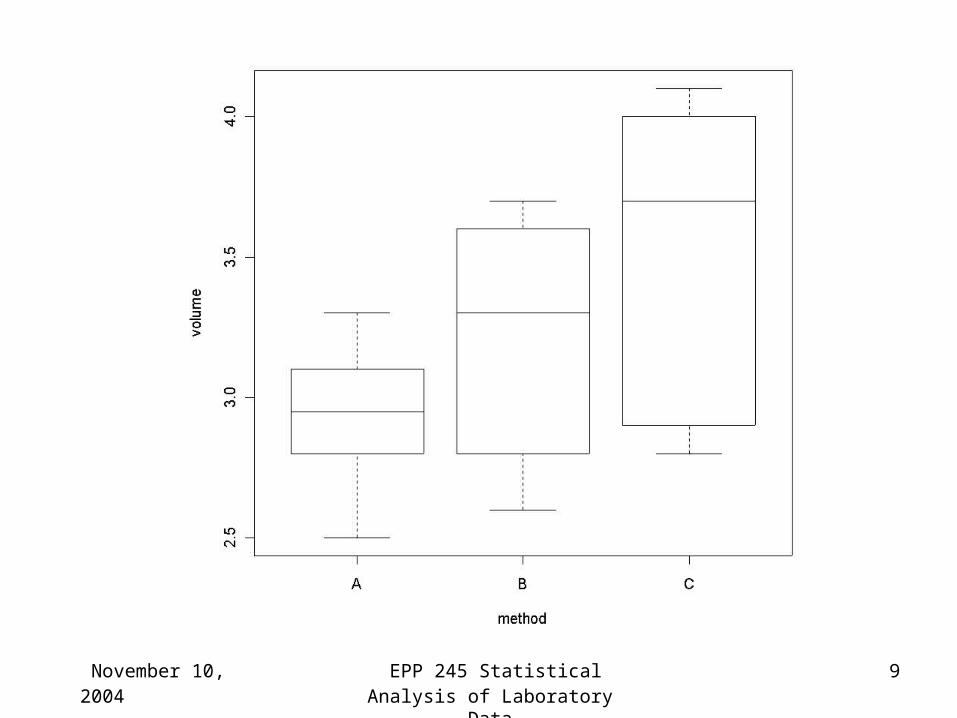
> tapply(volume,method,mean) A B C 2.933333 3.216667 3.533333 > tapply(volume,subject,mean) 1 2 3 4 5 6 3.466667 2.633333 3.566667 3.400000 3.433333 2.866667 > diff(sort(tapply(volume,method,mean))) B C 0.2833333 0.3166667
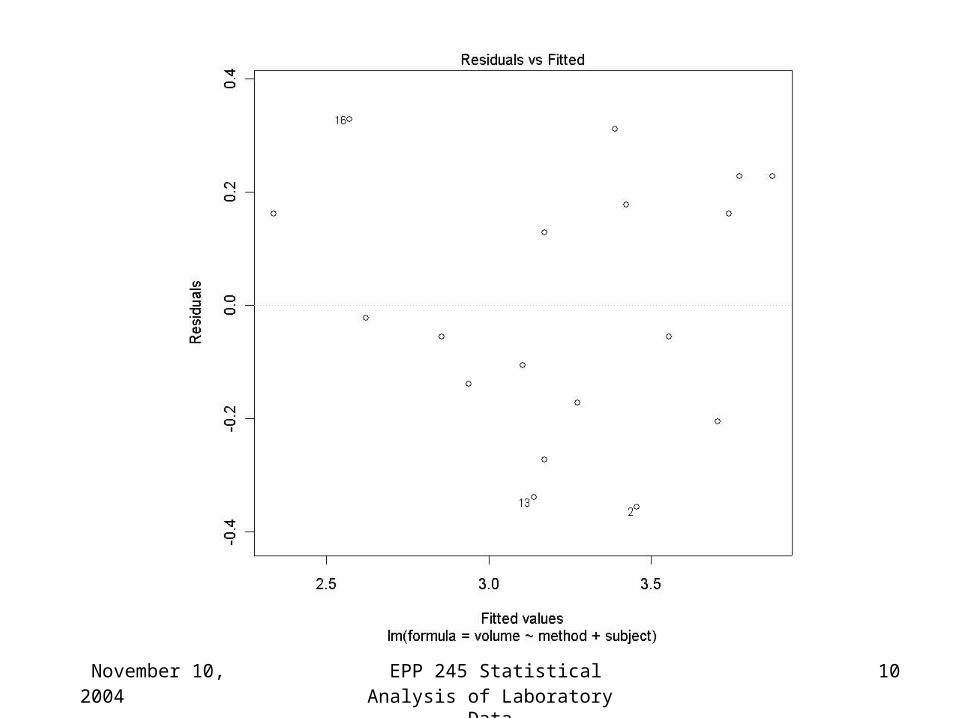
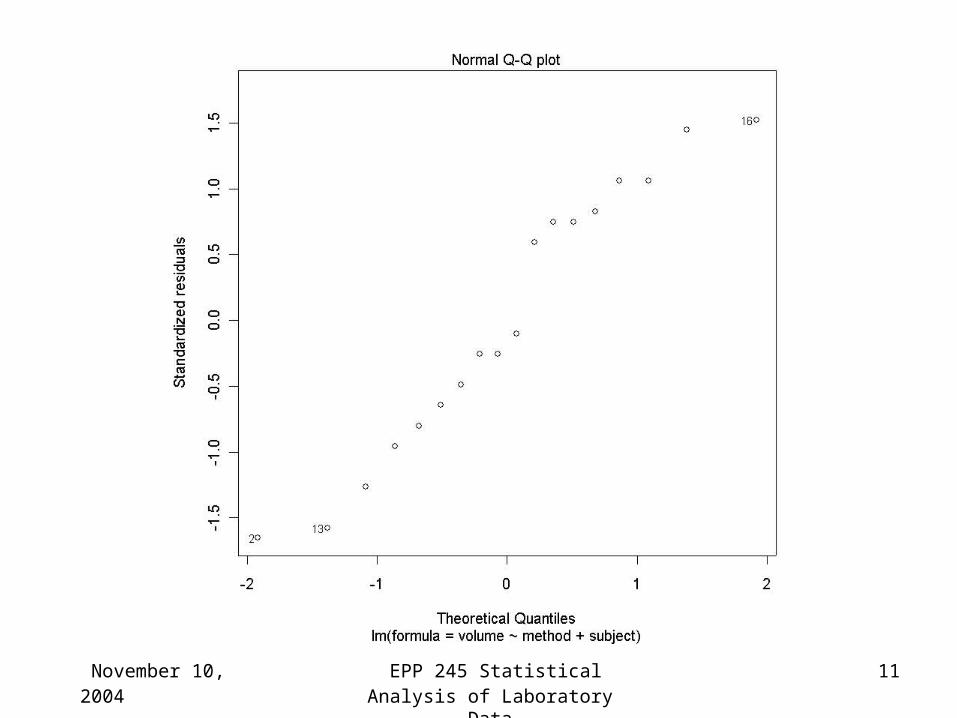
> plot(volume ~ method)> plot(lung.lm)Hit <Return> to see next plot: Hit <Return> to see next plot: Hit <Return> to see next plot: Hit <Return> to see next plot: > help(plot.lm)> plot(lung.lm$resid ~ method)
November 10, 2004 EPP 245 Statistical Analysis of Laboratory Data
9
November 10, 2004 EPP 245 Statistical Analysis of Laboratory Data
10
November 10, 2004 EPP 245 Statistical Analysis of Laboratory Data
11

November 10, 2004 EPP 245 Statistical Analysis of Laboratory Data
12

November 10, 2004 EPP 245 Statistical Analysis of Laboratory Data
13

November 10, 2004 EPP 245 Statistical Analysis of Laboratory Data
14

November 10, 2004 EPP 245 Statistical Analysis of Laboratory Data
15

November 10, 2004 EPP 245 Statistical Analysis of Laboratory Data
16
LSD (.975, ) MSE(2 / )
(.975,10) (0.0832)(2 / 6)
2.228 (0.0832)(2 / )
0.3710
t df n
t
n
> anova(lung.lm)Analysis of Variance Table
Response: volume Df Sum Sq Mean Sq F value Pr(>F) method 2 1.08111 0.54056 6.4953 0.01557 *subject 5 2.18278 0.43656 5.2457 0.01271 *Residuals 10 0.83222 0.08322 > diff(sort(tapply(volume,method,mean))) B C 0.2833333 0.3166667


![Draupne EPP Interface Description · The EPP interface is based on the Extensible Provisioning Protocol (EPP) described in RFC5730 [1], together with the standard EPP extensions for](https://static.documents.pub/doc/80x56/5e49cd8834fa9c2b9d35d276/draupne-epp-interface-description-the-epp-interface-is-based-on-the-extensible-provisioning.jpg)


