COPYRIGHT: No part of this document may be reproduced without the explicit written permission of QNBFS Page 1 of 6 Daily Technical Trader – Qatar Wednesday, 01 April 2015 Stocks Covered Today Ticker Price Target IHGS 117.00 112.00 QFLS 181.00 186.00 QSE Index Level % Ch. Vol. (mn) Last 11,711.40 1.1 6.0 Resistance/Support Levels 1 st 2 nd 3 rd Resistance 11,760 11,850 11,960 Support 11,500 11,450 11,350 QSE Index Commentary Overview: The QSE Index broke above another resistance level (11,700 points) on higher volumes. Having said that, the Index has to breach above the 11,760 level to add another 100-150 points to the upside. On a different note, the Index rallied for 4 straight days. As a result, a correction might take place caused by some profit booking. Expected Resistance Level: 11,760 Expected Support Level: 11,500 QSE Index (Daily) Source: Bloomberg, QNBFS Research QE Summary Market Indicators 31 Mar 15 30 Mar 15 %Ch. Value Traded (QR mn) 564.9 394.7 43.1 Ex. Mkt. Cap. (QR bn) 633.5 627.2 1.0 Volume (mn) 10.3 7.7 33.4 Number of Trans. 5,927 5,604 5.8 Companies Traded 40 41 -2.4 Market Breadth 24:15 27:10 – QE Indices Market Indices Close 1D% RSI Total Return 18,198.59 1.1 50.6 All Share Index 3,133.60 0.9 49.3 Banks 3,170.40 0.5 47.9 Industrials 3,884.03 2.0 51.8 Transportation 2,408.77 1.0 44.4 Real Estate 2,395.73 0.5 51.7 Insurance 4,184.34 0.9 57.7 Telecoms 1,326.21 0.1 41.0 Consumer 6,908.83 0.9 40.5 Al Rayan Islamic 4,276.43 0.7 50.1 RSI 14 (Over Bought) Ticker Close 1D% RSI RSI 14 (Over Sold) Ticker Close 1D% RSI CBQK 55.00 -2.5 22.5 ORDS 99.70 -0.2 25.7 UDCD 21.10 0.2 27.7 QSE Index (30min) Source: Bloomberg, QNBFS Research
Transcript
COPYRIGHT: No part of this document may be reproduced without the explicit written permission of QNBFS Page 1 of 6
Daily Technical Trader – Qatar
Wednesday, 01 April 2015
Stocks Covered Today
Ticker Price Target
IHGS 117.00 112.00
QFLS 181.00 186.00
QSE Index
Level % Ch. Vol. (mn)
Last 11,711.40 1.1 6.0
Resistance/Support
Levels 1st
2nd
3rd
Resistance 11,760 11,850 11,960
Support 11,500 11,450 11,350
QSE Index Commentary
Overview: The QSE Index broke above another resistance level (11,700 points) on higher volumes. Having said that, the Index has to breach above the 11,760 level to add another 100-150 points to the upside. On a different note, the Index rallied for 4 straight days. As a result, a correction might take place caused by some profit booking. Expected Resistance Level: 11,760 Expected Support Level: 11,500
QSE Index (Daily)
Source: Bloomberg, QNBFS Research
QE Summary
Market Indicators 31 Mar 15 30 Mar 15 %Ch.
Value Traded (QR mn) 564.9 394.7 43.1
Ex. Mkt. Cap. (QR bn) 633.5 627.2 1.0
Volume (mn) 10.3 7.7 33.4
Number of Trans. 5,927 5,604 5.8
Companies Traded 40 41 -2.4
Market Breadth 24:15 27:10 –
QE Indices
Market Indices Close 1D% RSI
Total Return 18,198.59 1.1 50.6
All Share Index 3,133.60 0.9 49.3
Banks 3,170.40 0.5 47.9
Industrials 3,884.03 2.0 51.8
Transportation 2,408.77 1.0 44.4
Real Estate 2,395.73 0.5 51.7
Insurance 4,184.34 0.9 57.7
Telecoms 1,326.21 0.1 41.0
Consumer 6,908.83 0.9 40.5
Al Rayan Islamic 4,276.43 0.7 50.1
RSI 14 (Over Bought)
Ticker Close 1D% RSI
RSI 14 (Over Sold)
Ticker Close 1D% RSI
CBQK 55.00 -2.5 22.5
ORDS 99.70 -0.2 25.7
UDCD 21.10 0.2 27.7
QSE Index (30min)
Source: Bloomberg, QNBFS Research
COPYRIGHT: No part of this document may be reproduced without the explicit written permission of QNBFS Page 2 of 6
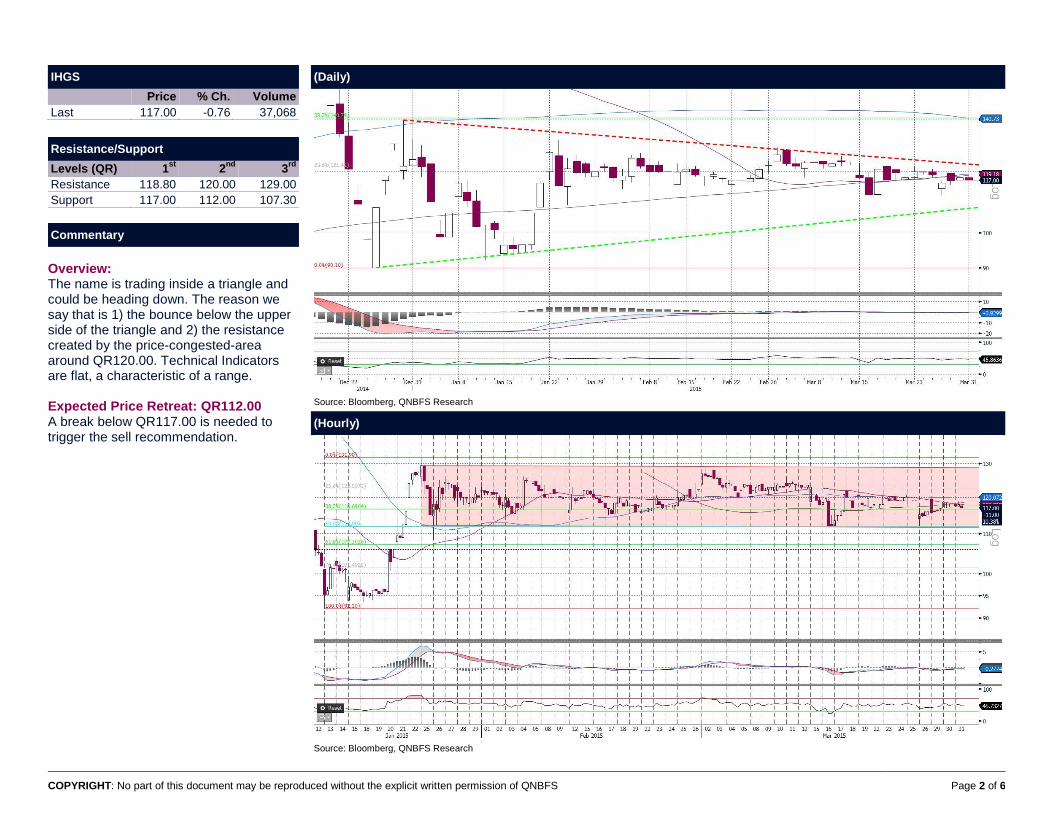
IHGS
Price % Ch. Volume
Last 117.00 -0.76 37,068
Resistance/Support
Levels (QR) 1st
2nd
3rd
Resistance 118.80 120.00 129.00
Support 117.00 112.00 107.30
Commentary
Overview: The name is trading inside a triangle and could be heading down. The reason we say that is 1) the bounce below the upper side of the triangle and 2) the resistance created by the price-congested-area around QR120.00. Technical Indicators are flat, a characteristic of a range. Expected Price Retreat: QR112.00 A break below QR117.00 is needed to trigger the sell recommendation.
(Daily)
Source: Bloomberg, QNBFS Research
(Hourly)
Source: Bloomberg, QNBFS Research
COPYRIGHT: No part of this document may be reproduced without the explicit written permission of QNBFS Page 3 of 6
QFLS
Price % Ch. Volume
Last 181.00 1.80 98,738
Resistance/Support
Levels (QR) 1st
2nd
3rd
Resistance 182.00 186.00 191.60
Support 177.00 174.00 172.50
Commentary
Overview: QFLS dropped sharply since last February (over 22%). The name is trading in a clear medium-term downtrend channel (denoted in red on the daily chart) and reached the lower boundary of that channel. The MACD and the RSI are exhibiting bullish momentum could be on the way. Expected Target Price: QR186.00 A break above 182.00 is needed to trigger the buy recommendation. Suggested Stop-loss Price: QR177.00
(Daily)
Source: Bloomberg, QNBFS Research
(Hourly)
Source: Bloomberg, QNBFS Research
COPYRIGHT: No part of this document may be reproduced without the explicit written permission of QNBFS Page 4 of 6
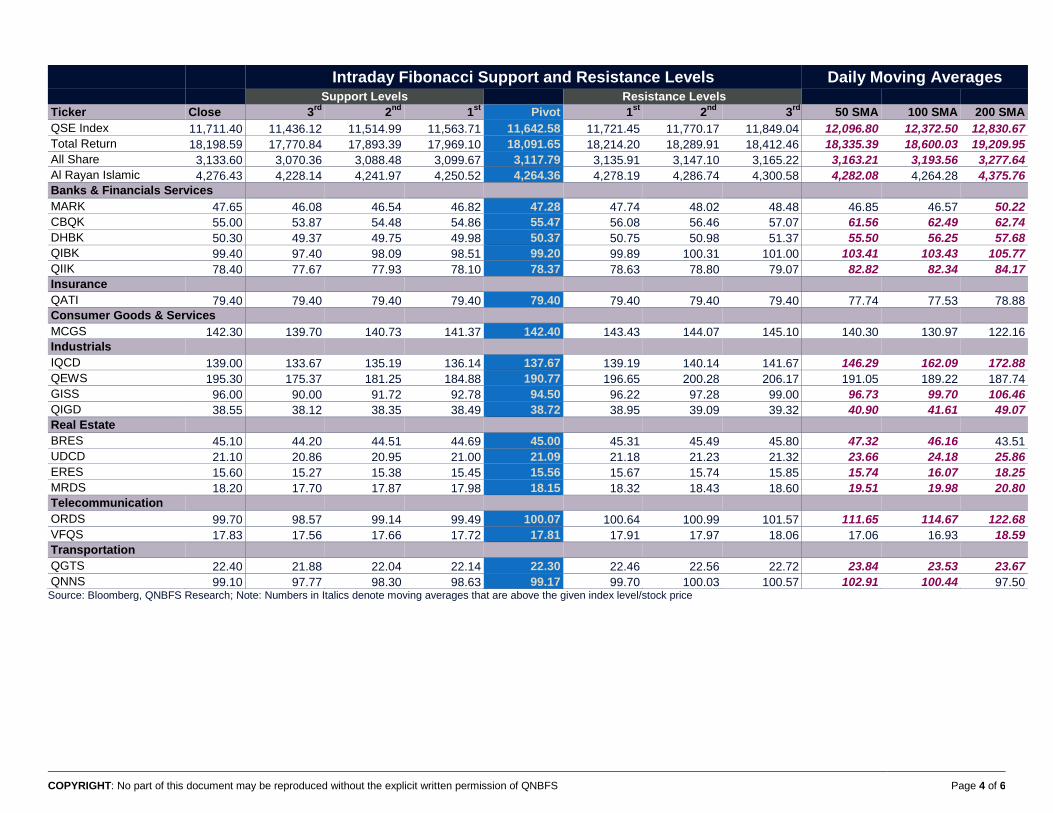
Intraday Fibonacci Support and Resistance Levels Daily Moving Averages Support Levels Resistance Levels
QNNS 99.10 97.77 98.30 98.63 99.17 99.70 100.03 100.57 102.91 100.44 97.50 Source: Bloomberg, QNBFS Research; Note: Numbers in Italics denote moving averages that are above the given index level/stock price
COPYRIGHT: No part of this document may be reproduced without the explicit written permission of QNBFS Page 5 of 6
Definitions:
Candlestick: A chart that displays the high, low, opening and closing prices for a security in a single period. The body of the candle is made up by the opening
and the closing prices, i.e., the taller the body the greater the range between these two prices and vice versa. A colored candle denotes a closing price that is
lower than the opening price, while a white candle shows the opposite. The candlestick's shadows or wicks show the period's high and low prices and how they
compare to the opening and closing price. In general, the shape of the candle will vary upon the positions of the period's high, low, opening and closing prices.
Support: A level that could cause more buyers to step in in order to prevent the security from falling or causing the security price to head higher.
Resistance: An inverse of a support level. A resistance area or level could cause more sellers to step in in order to prevent the security from rising or causing the
security price to head lower.
SMA (Simple Moving Average): Is an arithmetic average, which calculates the average price of a security over a defined number of periods and is thus
considered a lagging indicator. SMAs used in our analysis refer to closing prices. In general, SMAs serve many purposes, such as a smoothing tool, an indicative
price direction and potential support/resistance levels.
Market Breadth: Breadth indicates the number of securities that have closed higher vs. the number of decliners in a particular exchange.
MACD (Moving Average Convergence/Divergence): Is a trading indicator, which shows changes in the strength, direction, momentum and duration of a trend in
a stock's price through a collection of three time series calculated from historical closing price data.
RSI (Relative Strength Index): Is a momentum indicator that compares a security’s price gains to its losses for a predetermined number of periods (we generally
use 14 periods). The RSI attempts to point out how a security, in relative terms, is in the overbought/oversold zone. Securities with a RSI above 70 could be
considered as overbought, and below 30 could be considered as oversold.
Pattern/Formation: Is a graphical presentation of a security’s price activity over a certain period of time. Formations come in different shapes (such as, head &
shoulders, triangles, flags, and so on). They can be used to identify potential trends, reversal of trends, price targets, entry and exit points, etc.
Fibonacci Retracements: Are horizontal lines that indicate expected areas of support/resistance for a security based on a predetermined price movement. These
levels are usually indicated by Fibonacci ratios of 23.6%, 38.2%, 50.0%, 61.8% and 100% from that particular movement.
Fibonacci Pivot and Intra-day Support/Resistance: A Pivot Point is generally used to formulate expected future support/resistance levels. From the base Pivot
Point, Fibonacci multiples of the high-low differential are added to form resistance levels and subtracted to form support levels.
COPYRIGHT: No part of this document may be reproduced without the explicit written permission of QNBFS Page 6 of 6
Disclaimer and Copyright Notice: This publication has been prepared by QNB Financial Services SPC (“QNBFS”) a wholly-owned subsidiary of QNB SAQ (“QNB”). QNBFS is regulated by the Qatar Financial Markets Authority and the Qatar Exchange QNB SAQ is regulated by the Qatar Central Bank. This publication expresses the views and opinions of QNBFS at a given time only. It is not an offer, promotion or recommendation to buy or sell securities or other investments, nor is it intended to constitute legal, tax, accounting, or financial advice. QNBFS accepts no liability whatsoever for any direct or indirect losses arising from use of this report. Any investment decision should depend on the individual circumstances of the investor and be based on specifically engaged investment advice. We therefore strongly advise potential investors to seek independent professional advice before making any investment decision. Although the information in this report has been obtained from sources that QNBFS believes to be reliable, we have not independently verified such information and it may not be accurate or complete. QNBFS does not make any representations or warranties as to the accuracy and completeness of the information it may contain, and declines any liability in that respect. For reports dealing with Technical Analysis, expressed opinions and/or recommendations may be different or contrary to the opinions/recommendations of QNBFS Fundamental Research as a result of depending solely on the historical technical data (price and volume). QNBFS reserves the right to amend the views and opinions expressed in this publication at any time. It may also express viewpoints or make investment decisions that differ significantly from, or even contradict, the views and opinions included in this report. This report may not be reproduced in whole or in part without permission from QNBFS.