64
1 Battery Storage Systems 1 White Paper #1 – Draft 2 Topic: Battery Storage Systems 3 Authored by: 4 5

1
Battery Storage Systems 1
White Paper #1 – Draft 2
Topic: Battery Storage Systems 3
Authored by: 4
5

2
Battery Storage Systems 1
2
CONTRIBUTORS 3
4
IEEE Smart Grid Battery Storage Working Group 5
6
Chair 7
8
Wei-Jen Lee IEEE Industry Applications Society 9
10
Members and Contributors 11
12
Merlinda Andoni IEEE ABCD Society 13
Salam Bani-Ahmed IEEE ABCD Society 14
David Flynn IEEE ABCD Society 15
Balint Hartmann IEEE ABCD Society 16
John Hewson IEEE ABCD Society 17
Josh Lamb IEEE ABCD Society 18
Afshin Majd IEEE Industry Applications Society 19
Valentin Robu IEEE ABCD Society 20
Mehrdad Rostami IEEE ABCD Society 21
Chris Searles IEEE ABCD Society 22
Sima Seidi IEEE ABCD Society 23
Istvan Taczi IEEE ABCD Society 24
Istvan Vokony IEEE ABCD Society 25
Gaetano Zizzo IEEE ABCD Society 26
27
Staff 28
29
Phyllis Caputo IEEE Smart Grid 30
Angelique Rajski Parashis IEEE Smart Grid 31
32
33
34
35 36
37
38

3
ACKNOWLEDGEMENT 1
2
IEEE Smart Grid Initiative brings together IEEE’s broad array of technical societies and 3
organizations through collaboration to encourage the successful rollout of technologically 4
advanced, environment-friendly and secure smart-grid networks around the world. As the 5
professional community and leading provider of globally recognized Smart Grid information, IEEE 6
Smart Grid Initiative is intended to organize, coordinate, leverage and build upon the strength of 7
various entities within IEEE with Smart Grid expertise and interest. Additional information on IEEE 8
Smart Grid can be found at http://smartgrid.ieee.org. 9
10

4
Table of Contents 1
1. Introduction .............................................................................................................................. 6 2
2. Overview of the Energy Storage Technologies ......................................................................... 7 3
2.1. Lead acid batteries ............................................................................................................ 7 4
2.2. Nickel–Cadmium batteries ............................................................................................... 8 5
2.3. Nickel–metal hydride batteries ........................................................................................ 8 6
2.4. Lithium-ion batteries ........................................................................................................ 8 7
2.5. Flow batteries ................................................................................................................. 10 8
2.6. Sodium–sulfur batteries ................................................................................................. 11 9
2.7. Sodium-nickel-chloride batteries ................................................................................... 11 10
2.8. Electric double layer capacitors ..................................................................................... 11 11
2.9. Comparison of battery storage technologies ................................................................. 12 12
3. Current Applications of Battery Storage ................................................................................. 16 13
3.1. Transmission level ........................................................................................................... 16 14
3.1.1. Current Installations and plans ............................................................................. 16 15
3.1.2. Area of Applications ............................................................................................. 17 16
3.1.2.1. Integration of Distributed Renewable Energy Sources .......................... 17 17
3.1.2.2. Merchant Electricity Storage .................................................................. 17 18
3.1.2.3. Transmission upgrade deferral and congestion relief ............................ 18 19
3.1.2.4. Energy arbitrage ..................................................................................... 19 20
3.1.2.5. Load following ........................................................................................ 19 21
3.1.2.6. Power quality improvement ................................................................... 20 22
3.1.2.7. Power reliability ...................................................................................... 20 23
3.1.2.8. Ancillary services .................................................................................... 20 24
3.2. Distribution level ............................................................................................................. 23 25
3.2.1. Current activities .................................................................................................. 23 26
3.2.2. Area of applications ............................................................................................. 24 27
3.2.2.1. Distribution upgrade deferral ................................................................. 24 28
3.2.2.2. Voltage excursion support ...................................................................... 24 29

5
3.2.2.3. Grid support ............................................................................................ 24 1
3.2.2.4. Duck curve improvement ....................................................................... 25 2
3.2.2.5. Microgrid/Nanogrid development ......................................................... 28 3
3.2.2.6. EV battery and charging station ............................................................. 31 4
3.3. Residential level ............................................................................................................... 35 5
3.4. Transportation ................................................................................................................. 39 6
4. Potential Solutions to the Energy Storage issues ................................................................... 47 7
4.1. Introduction ..................................................................................................................... 47 8
4.2. Generation ....................................................................................................................... 47 9
4.2.1. Renewable Energy Storage Units ....................................................................... 47 10
4.3. Transmission .................................................................................................................... 48 11
4.4. Distribution ...................................................................................................................... 49 12
5. Electrochemical energy storage and safety ............................................................................ 52 13
5.1. Introduction ..................................................................................................................... 52 14
5.2. Reliability and aging ........................................................................................................ 52 15
5.3. Effects of scale ................................................................................................................. 53 16
5.4. Lithium-ion systems ........................................................................................................ 53 17
5.4.1. Risks associated with batteries .......................................................................... 53 18
5.4.2. Classification of failures ...................................................................................... 55 19
5.4.3. Criteria for initial failure ..................................................................................... 55 20
5.5. Criteria for cascading propagation .................................................................................. 58 21
5.6. General battery hazards and other chemistries ............................................................. 60 22
5.7. Risk assessment of arcing ................................................................................................ 61 23
Appendix ....................................................................................................................................... 67 24
Recommended Standards/Regulations/Government Policies ............................................... 67 25
26

6
1. Introduction 1
Electrical power infrastructures are changing dramatically around the globe due to smart 2
grid initiatives, the establishment of renewables and the resulting distributed nature of creating 3
electricity, the need for independent microgrids to ensure grid reliability, new demands from 4
end users, the need to reduce greenhouse gas emissions, as well as the capability to 5
accommodate mixed energy resources. As a result, the power network faces great challenges in 6
generation, transmission and distribution to meet new and many times unpredictable demands 7
of providing coherent electricity supply. Electrical Energy Storage (EES) has been considered a 8
game-changer with a number of technologies that have great potential in meeting these 9
challenges. According to the U.S. Department of Energy the suitability of a storage technology is 10
determined primarily by its power and energy capacity and the rate at which these can be 11
stored and delivered. Other characteristics to consider are round-trip efficiency, cycle life, 12
calendar life, safety, reliability, effect on the environment and ramp rate (how fast the 13
technology can respond to a command). 14
However, the wide variety of options and complex performance matrices can make it 15
difficult to appraise a specific EES technology for a particular application. This white paper 16
intends to contribute information that will give a Smart Grid user a clearer picture of the state-17
of-the-art electrochemical technologies available, and where they would be suited for 18
integration into a power generation and distribution system. The white paper starts with an 19
overview of the operation principles, technical and economic performance features and the 20
current research and development of important EES technologies, sorted into six main 21
categories based on the types of energy stored. Other energy storage technologies such as 22
compressed air, fly wheel, and pump storage do exist, but this white paper focuses on battery 23
energy storage systems (BESS) and its related applications. 24
There is a body of work being created by many organizations, especially within IEEE, but it is 25
the intent of this white paper to complement those activities and provide solid insight into the 26
role of energy storage, especially as it relates to the Smart Grid. 27
28
29

7
2. Overview of the Energy Storage Technologies 1
Today, most common battery chemistries are based on lead, nickel, sodium and lithium 2
electrochemestries. Emerging technologies like flow batteries utilize various transition metals 3
like vanadium, chromium and iron as the electroactive element. Carbon electrodes are a 4
critical part of several of these battery systems. . Each storage type has distinct characteristics, 5
namely, capacity, energy and power output, charging/discharging rates, efficiency, life-cycle 6
and cost that need to be taken into consideration for possible applications. Understanding 7
their chemical characteristics and related regulations are critical steps for possible use. This 8
includes the application, siting, installation, operation and maintenance, as well as shipping and 9
disposing of used batteries. This chapter presents a review of available and emerging battery 10
technologies and their design and performance characteristics. Electric Double Layer Capacitors 11
(often referred to as ultracapacitors or supercapacitors) are also addressed in this chapter. 12
13
2.1. Lead acid batteries 14
The lead-acid battery was invented in 1859 by French physicist Gaston Planté and it is the 15
oldest and most mature rechargeable battery technology. There are several types of lead-acid 16
batteries that share the same fundamental configuration. The battery consists of a lead (Pb) 17
cathode, a lead-dioxide (PbO2) anode and sulfuric acid electrolyte (H2SO4). The deep 18
cycle/traction and the traditional stationary battery types are the most commonly used in 19
Smart Grid applications. The deep cycle battery is composed of very thin plates and has a low 20
energy density; however, its relatively high power density makes it attractive for use in motor 21
vehicles to provide the high current required for power engine starters. 22
The larger format and thicker plate stationary battery is used in a number of applications 23
where interruption to the load cannot be tolerated. Common use in the energy space includes 24
standby backup power for switchgear, turbine motors, data centers and any other application 25
where reliability of the load is critical. Lead-acid batteries are widely used because they are less 26
expensive compared to many of the newer technologies and have a proven track record for 27
reliability and performance. 28
In North America the use of calcium along with other alloys is common for vented lead-acid 29
(VLA) cell. In Europe and other parts of the world, lead-selenium along with a small amount of 30
antimony (low antimony) cells are commonly used for standby applications. However, the leas-31
selenium, low-antimony battery has been more widely used in North America in recent years. 32
Valve-regulated lead-acid (VRLA) cells also use a calcium alloy in the plate structure, 33
however, they differ in the way the electrolyte is incorporated. The two most common types 34
are an absorbed glass mat (AGM), often referred to as a “starved electrolyte” topology, or with 35
the use of specialized silica that is called a gelled electrolyte. VLA and VRLA batteries are can be 36
designed for optimal performance in either a power application and/or an energy application. 37
There are several designs and chemistries, (both old and new) such as a tubular plate design 38
coupled with a gelled electrolyte that provides a very decent cycling capability. Another uses a 39
carbon electrode in which the battery becomes a battery-supercapacitor hybrid. These various 40
VRLA types present distinct advantages and disadvantages. While the technology is well-known 41

8
and can offer a lower-cost advantage, lead-acid batteries have greater weight due to their 1
lower energy density; they may also have life-cycle performance and long term performance 2
issues depending on the type, which make the technology not less suitable for many 3
applications. 4
5
2.2. Nickel–Cadmium batteries 6
The nickel–cadmium battery (NiCd) is a rechargeable battery using nickel oxide hydroxide 7
and metallic cadmium as electrodes. Wet-cell nickel-cadmium batteries were invented in 1899. 8
A NiCd cell delivers around 1.2 volts output voltage until nearly the end of discharge. Compared 9
with other types of rechargeable batteries, NiCd batteries offer satisfactory life-cycle 10
characteristics and improved performance at low temperatures with a good capacity retention 11
at high rates. However, the material costs are higher than that of the lead acid batteries. 12
Moreover, NiCd cells experience the so called “memory effect” and high self-discharge rates 13
which have a great impact to their performance characteristics. In addition, environmental 14
concerns on the disposal of the toxic metal cadmium has dramatically reduced the use of NiCd 15
batteries. As a result, NiCd rapidly lost market share to nickel-metal-hydride (NiMH) and Li-ion 16
batteries in the 1990s. Within the EU, NiCd batteries can only be supplied for replacement 17
purposes and their use is limited for certain types of new equipment such as medical devices. 18
19
2.3. Nickel–metal hydride batteries 20
A nickel–metal hydride battery (NiMH) is also a type of rechargeable battery. Similarly to 21
NiCd batteries, NiMH cells use nickel oxide hydroxide (NiOOH), which is formed in the positive 22
electrode. The use of Cd in the negative electrode is replaced by a hydrogen-absorbing alloy. A 23
NiMH battery can have two to three times the capacity of an equivalent size NiCd, and its 24
specific energy of 80Wh/kg is about 50% of a lithium-ion battery. Main applications of the 25
NiMH batteries are found in consumer electronics and plug-in electric vehicles and hybrid 26
vehicles due to the technology maturity and their competitive cost to Li-ion batteries. However, 27
Li-ion batteries are considered to most promising for the EV industry mainly due to their 28
continuously falling cost and improved performance. 29
30
2.4. Lithium-ion batteries 31
In 1991, Sony and Asahi Kasei released the first commercial lithium-ion battery. A lithium-32
ion battery (Li-ion) is a type of rechargeable battery where lithium ions move from the negative 33
electrode to the positive electrode during discharge. The process is reversed during charging. 34
With a high energy density, negligible memory effect and low self-discharge, Li-ion batteries are 35
one of the most popular types of rechargeable batteries for portable electronics. In recent 36
years, they are also growing in popularity for military, Plug-in electric vehicle (PEV), and 37
aerospace applications. Different types of Li-ion battery chemistries present different 38
performance, cost and safety features that can suit a variety of applications. For example, 39
lithium cobalt oxide (LiCoO2) batteries are used in most handheld electronics due to their high 40
energy density and low weight. Other types such as Lithium iron phosphate (LiFePO4), lithium 41

9
ion manganese oxide batteries (LiMn2O4, Li2MnO3, or LMO) and lithium nickel manganese 1
cobalt oxide (LiNiMnCoO2 or NMC) offer lower energy density, but can provide longer lifetime 2
and inherent safety. These types are widely used for electric tools and medical equipment. The 3
newer emerging type of lithium–sulfur batteries promise the highest performance-to-weight 4
ratio. Li-ion batteries present a high efficiency and a long lifespan. The technology is still under 5
development, therefore further performance improvements may be expected in the future. 6
Their cost currently lies at approximately $700/kWh but it is expected to continue to drop in 7
the following years due to massive manufacturing developments and the resulting economies 8
of scale. In January 2017, Tesla Motors began production of lithium-ion battery cells for energy 9
storage at its Gigafactory in Nevada, a in what will be a sprawling 5.5 million-square-foot 10
manufacturing facility (see Fig. 2-1). The high-performance cylindrical “2170” cell, jointly 11
designed by Tesla and its Japanese partner Panasonic, will be used in Tesla’s Powerpack 2 and 12
Powerwall 2. In 2018, it is expected to be used for its Model 3 electric vehicles as well. 13
14
15 Fig. 2-1 Tesla Motors’ lithium-ion battery “Gigafactory” outside Sparks, Nevada broke ground in June 16
2014 and began production in January 2017 even though it was only 30% complete [1] 17
18
Li-ion batteries can pose safety hazards since they contain a flammable electrolyte. There 19
have been several battery-related recalls by different companies, including earlier laptop 20
computer batteries and the 2016 Samsung Galaxy Note 7 recall for battery fires due to 21
overcharging. Because of these risks, testing standards are more stringent than those for acid-22
electrolyte counter parts. There are concerns related to the availability of Lithium, which are 23
mainly concentrated in reserves in South America. The price of nickel and cobalt (lithium 24
related alloys) have doubled over the last two years. This is a concern as to the effects for 25
promised cost reductions. 26
27

10
2.5. Flow batteries 1
Flow batteries are considered unique in that the power and energy of the battery are 2
entirely decoupled. A flow battery is consists of multiple electrochemical cells connected in 3
series in a stack. These stacks are then connected in series and/or stacks to form a Flow Battery 4
Energy Storage System (FBESS). The stack configuration dictates the power of the cell while the 5
energy is controlled by the chemical energy contained in the electrolyte tanks that are external 6
to the stack. Positive and negative electrolyte solutions are pumped into the stack where they 7
are separated by ion-exchange membranes or a porous separator. Ion exchange (accompanied 8
by flow of electric current) occurs through the membrane while both liquids circulate in their 9
own respective space. There are several types of flow batteries such as Fe-Cr, Fe-V (vanadium 10
redox) and hybrid flow systems such as Zinc-Bromide (Zn-Br2) and Zinc-Chloride (Zn-C12). 11
These are typically aqueous based solutions, and thus cell voltages are limited between 1.0 to 12
1.8 volts to prevent hydrolysis of the water. Non-aqueous electrolyte flow battery systems have 13
the potential for higher energy density due to high open circuit voltage and a potential for more 14
than 1 electron per mole of the active species. However, these are still under development. 15
Currently, the most cost effective flow battery that exhibits good performance and safety is 16
the all vanadium redox flow battery. The Pacific Northwest National Laboratory (PNNL) have 17
demonstrated newer mixed sulfuric-hydrochloric acid technology with a vanadium 18
concentration up to 2.5M with an energy density near 40Wh/l in an operating window of -10°C 19
to 50°C. 20
Since the power and energy of the flow battery are separate, specialized cost performance 21
models are required to determine the optimal energy to power rations for grid storage 22
applications. Flow batteries are analogous to a fuel cell to the extent that reactants flow past or 23
through the electrodes. The conversion is less than 100% per pass. Flow batteries have several 24
technical advantages over conventional rechargeable batteries, but a monitoring and control 25
mechanisms is required. 26
Flow batteries are inherently safe as the aqueous electrolyte is non-flammable. They have 27
demonstrated long cycle life and the cycle life is not dependent on the depth of discharge. 28
Energy is determined by the tank volume and electrolyte concentaration while power is 29
determined by the stack area. Charge and discharge times will vary as a function of the energy 30
to power ratio, thus recharge times will vary. Flow batteries may not be cost effective for very 31
short duration applications since the stack costs dominate. Flow batteries are most cost-32
effective for longer duration, energy intensive applications. However, they do retain their 33
ability to do fast ramp rates. This enables them to provide multiple power and energy services. 34
This operational flexibility makes the flow battery very attractive for grid scale applications. 35
36
2.6. Sodium–sulfur batteries 37
A sodium–sulfur (NaS) battery is a molten-salt battery constructed from liquid sodium (Na) 38
and sulfur (S). NaS batteries are fabricated from inexpensive materials, which forms one of the 39
main advantages of this technology type. NaS batteries have high energy density, high 40
efficiency of charging/discharging (89–92%) and long cycle life. The main drawbacks of the NaS 41

11
battery are the operating temperatures of 300oC to 350oC and the highly corrosive nature of 1
the sodium polysulfides. Battery cells become more economical with increasing size, therefore 2
NaS batteries are considered more suitable for stationary energy storage applications. Typical 3
applications of NaS batteries are distribution network support and grid services and renewable 4
energy integration. The technology has a great potential for grid services since it has a long 5
discharge time and can respond precisely to improve power quality issues in the grid. 6
7
2.7. Sodium-nickel-chloride batteries 8
Sodium-nickel-chloride (NaNiCl2) are high-temperature batteries similarly to NaS batteries. 9
Their operating temperature lies within the 270 C-350 C range. During the charging process, 10
salt (NaCl) and nickel (Ni) are transformed into nickel-chloride (NiCl2) and molten sodium (Na). 11
The process is reversed during discharge. Typical applications of NaNiCl2 batteries are grid 12
support services and renewable energy integration. 13
14
2.8. Electric double layer capacitors 15
Electric Double Layer Capacitors (EDLCs), also known as “ultracapacitors” or 16
“supercapacitors” store electrical charge in an electric double layer (non-Faradic) at the 17
interface between a high-surface-area carbon electrode and a liquid electrolyte. This 18
mechanism is highly reversible and therefore just as with ECs, conventional capacitors, can be 19
charged and discharged at high power rates with low capacitance fade for hundreds of 20
thousands of cycles. The electrode surface area in capacitors determines the capacitance and 21
thus, the energy storage capability of the device. The amount of energy stored by EDLCs is very 22
large compared to conventional capacitors because of the use of a porous carbon-based 23
electrode material of high surface area. While ultracapacitors have very high specific power 24
(10-20 kW/kg), and longer lifetime relative to batteries, they have a low specific and volumetric 25
energy density (<8Wh/kg). 26
Ultracapacitors exhibit significantly less sensitivity to temperature than Li-ion batteries with 27
possible operating temperatures in the range of -40 to 65oC. DC lifetime (where a cell is 28
continuously held at rated voltage) is typically 1500 h at elevated temperature (65˚C). In terms 29
of cycling behaviour, 500K to >1M cycles are common. Ultracapacitors are well-suited for high-30
power applications in a variety of areas, with applicability at Transmission, sub-transmission, as 31
well as distribution voltage levels. The key features of ultracapacitors are extremely appealing 32
in electricity grids: fast response time in milliseconds, high-energy efficiency (> 95%), high 33
power density and long calendar and cycle life. Driven by economies of scale and advancements 34
in manufacturing, the cost of EDLCs has decreased dramatically for their deployment in grid 35
energy storage systems. At present, fully installed costs are estimated to be $1000/kW, 36
decreasing to $517/kW by 2021 [1] Given this customer value improvement and the ability to 37
pair with batteries to “stack” grid services and improve battery lifetime, ultracapacitors are now 38
being piloted in systems across the globe. 39
Deployment of EDLCs has accelerated greatly over the last 15 years; they are now widely 40
commercialized in hybrid bus, rail, and automotive applications, as well as back-up power 41

12
applications such as wind pitch control systems and uninterrupted power supplies. Moreover, 1
there are several trials and pilot projects that study the utilization of supercapacitors for grid 2
energy storage systems. They can be a stand-alone technology or hybridized with a second, low 3
cost high energy density technology such as flow batteries or high energy Li-ion batteries. 4
5
2.9. Comparison of battery storage technologies 6
A summary of the energy storage technologies discussed above is presented at Table 2-1. 7
Different types are compared by their main technical characteristics, such as cycle life 8
performance and efficiency. Main pros and cons of different types are also highlighted in Table 9
2.9.1. 10 11
Table 2-1. A comparative summary of different battery technologies by current state-of-the-art [4-7] 12
Storage technology
Cycle life at 80% DOD
Efficiency Advantage Disadvantage
Lead Acid 300-3000 [5] 70-90% - Inexpensive - Mature technology
- Limited cycling capability for most standard types
- Low energy density - Environmental hazard
NiCd 3000 80 %
- Good cycle life - Good performance
at low temperatures
- More tolerant to hostile environments or conditions
- Memory effect - High self-discharge rate - Environmental hazard
NiMH 2000 50-80 %
- High energy density - Good abuse
tolerance - Good performance
at low temperatures
- Damage may occur with complete discharge
- High costs
Li-ion 3000 75-90 % [6]
- High energy density - Low self-discharge
rate - No memory effect
- Expensive although costs are decreasing
- Not safe depending on type
Flow batteries
2,000-20,000 65-85 % - Scalability - Lifespan not
dependent on DOD
- Need for electrolyte tanks - High maintenance - Complex monitoring and
control mechanisms
NaS 4500 89 % - High efficiency and
cycle life - High operating
temperatures

13
- Low cost battery materials
- High energy density
- -Temperature is to be maintained close to 300oC which might affect battery performance [7]
- Corrosive materials
NaNiCl2 1,500-3,000 85-95 % - Long cycle life - High energy density
- High operating temperatures
- Thermal management requirement
EDLC 1,000,000 95%
- High power Density, fast response
- Lifetime - Safety - Wide operating
temperature range (-40 to 65oC)
- Low energy density
1
In addition a conceptual classification of energy storage devices is shown in Fig. 2-2 in terms 2
of their power and energy relationship and potential use-cases and applications focusing to grid 3
services provision. 4
5

14
1 Fig. 2-1 Energy storage technologies and their main applications (Source: EPRI [8]) 2
3
4
5 6 7
8 9
10 11 12
13 14 15 16
17 18 19 20
21
22

15
References: 1
[1] Randall T. Tesla Flips the Switch on the Gigafactory. Bloomberg Technology. 2
https://www.bloomberg.com/news/articles/2017-01-04/tesla-flips-the-switch-on-the-3
gigafactory, Accessed: 2017-12-04. 4
[2] Navigant Research, Energy Storage for the Grid and Ancillary Services, May 2016. 5
[3] Global EV. Outlook 2016, Beyond one million electric cars. International Energy Agency: 6
Paris, France. 2016. 7
[4] Navigant Research “Advanced Hybrid Battery Markets”, June 2017. 8
[5] Zakeri, B.; Syri, S., “Electrical energy storage systems: A comparative life cycle cost 9
analysis” Renewable and Sustainable Energy Reviews, 2015, vol. 42, issue C, 569-596. 10
[6] Ferreira HL, Garde R, Fulli G, Kling W, Lopes JP. Characterisation of electrical energy 11
storage technologies. Energy. May 2013. 1;53:288-98. 12
[7] Luo X, Wang J, Dooner M, Clarke J. Overview of current development in electrical energy 13
storage technologies and the application potential in power system operation. Applied 14
Energy. Jan 2015. 1;137:511-36.1 15
[8] Electric Power Research Institute (Report: 1020676), “Electric Energy Storage Technology 16
Options: A White Paper Primers on Applications, Costs, and Benefits.” December 2010. 17
18

16
3. Current Applications of Battery Storage 1
Companies deploy storage technologies for a number of different purposes. Coordinating 2
and rearranging energy from diverse resources to optimize the overall production/operation 3
cost is only one of the many applications of energy storage. Energy storage can also improve 4
the quality of power through frequency regulation and provide an uninterruptible source of 5
power for critical infrastructure and services. 6
7
3.1. Transmission level 8
3.1.1. Current Installations and plans 9
Energy storage using grid-connected electrochemical battery systems has widely been 10
considered as a potential solution for seamless integration of renewables, improving grid 11
flexibility, and enhancing grid reliability. Several examples are provided in this section. 12
In the US, battery storage is now clearly an established market. According to the first 13
quarter report from GTM Research and the Energy Storage Association (ESA), battery storage 14
deployments grew to 336 MWh in 2016, doubling megawatt-hours deployed in 2015. As shown 15
in Fig. 3-1, 230 MWh came online in the final quarter of 2016 alone, which is more than the 16
sum of the previous 12 quarters combined. 17
Fig. 3-1 U.S. energy storage deployments (MWh). [1]
According to the U.S. Department of Energy’s Global Energy Storage Database, about 733 18
grid-connected electrochemical projects with a total rated power of 1.8 GW (of varying 19
duration) have been installed around the world by April 2017. 20
According to Ofgem, the UK regulator, 550 MW of battery capacity was contracted in 2016 21
to come online by 2020. 22
Terna S.p.A., the Italian TSO (Transmission System Operators), installed two battery energy 23
storage plants connected to the HV transmission grid with a total rated power of 12.5 MW and 24
planned to install a total capacity of 40 MW by 2020. The installation site in Codrongianos 25
(Sardinia) is, nowadays, one of the biggest battery energy storage plant in Europe. 26

17
An Ontario utility company in (Festival Hydro) is going to install one of the largest North 1
American BESSs including four 2 to 2.4MW inverters and 6-14.4MWh batteries, providing 2
8.8MW power and 40.8MWh energy storage capacity for 27.6kV local distribution network. 3
Such a large-scale battery energy storages can support frequency control and share the load in 4
peak operating times beside of reactive support and voltage control in other periods. [2] 5
6
3.1.2. Area of Applications 7
3.1.2.1 Integration of Distributed Renewable Energy Sources 8
Integration of large scale wind generation or other distributed renewable energy sources 9
into the electric supply and transmission systems, by creating voltage and frequency instability, 10
poses some well-characterized challenges. In response, utilities, governments and regulators 11
are now imposing strict grid interconnection requirements, including frequency control (i.e. 12
inertia), voltage control and power injection to the transmission grid. Interconnectivity 13
Solutions include complete VAR compensation and voltage control, enabling wind and solar 14
energy generation systems to meet these new and emerging requirements. STATCOM and 15
hybrid STATCOM-Energy Storage (Battery and/or Ultracapacitor) systems provide a solution 16
that allows power plants to stay online and prevent the nuisance tripping that may be caused 17
by solar inverters and wind turbine generators. 18
This value proposition combines renewable integration electricity storage benefits with 19
“locational” benefits associated with distributed storage, such as storing “low value” energy to 20
distribute it during peak demand. 21
The same storage system can also be used to provide most of the “ancillary services” 22
needed by grid system operators to keep the electricity grid operating in a stable and reliable 23
manner. Depending on the location of the storage, it may also provide benefits related to 24
improved local electric service reliability and power quality. 25
As an example, Nova Scotia Power Inc. (NSPI), in a recent pilot project in Canada, runs a 1.5MW 26 BESS in Nova Scotia province, which supports the wind farm, located more than 20km far from point of 27 connection on a same feeder. BESS can act as micro grid and support 300 selected households during 28 the outages while regulating feeder voltage when feeder is lightly or heavily loaded. [3] 29
3.1.2.2 Merchant Electricity Storage 30
The merchant business model is a very important value proposition for battery storage. 31
Although situations vary among markets, benefits derived from operation of a merchant 32
storage plant include: a) electric energy time-shift (peak-shaving), b) electric supply capacity 33
(power) and c) the ancillary services that are needed to maintain a stable and reliable electrical 34
grid. Other potential benefits could include transmission support and/or transmission 35
congestion relief. 36
Currently there are GigaWatts of merchant storage capacity in operation or planned – 37
primarily pumped hydroelectric, but interest in compressed air energy storage (CAES) is 38
growing. Battery storage will become one of the major players once it becomes more 39
economically feasible. 40
18
Storage systems can be owned by the utility companies or independent storage providers, 1
who can either have direct access and trade in the wholesale energy, capacity, balancing and 2
ancillary services markets or have a contractual agreement with a utility company or a third-3
party to whom they provide their services. The model requires significant changes from a 4
regulatory perspective. Ownership of BESS is in fact crucial as it may inhibit healthy competition 5
in the marketplace. Ofgem, the UK regulator, is planning to take an action in order to 6
discourage ownership or operation of storage systems, as flexibility assets, by utility companies. 7
Such models may also refer to storage aggregators emerging in the marketplace that operate a 8
portfolio of multiple smaller-scale storage technologies that act as a single virtual storage 9
provider. Advanced artificial intelligence algorithms, data analytics and machine learning 10
techniques are increasingly playing an important role in managing distributed storage devices in 11
such settings. 12
13
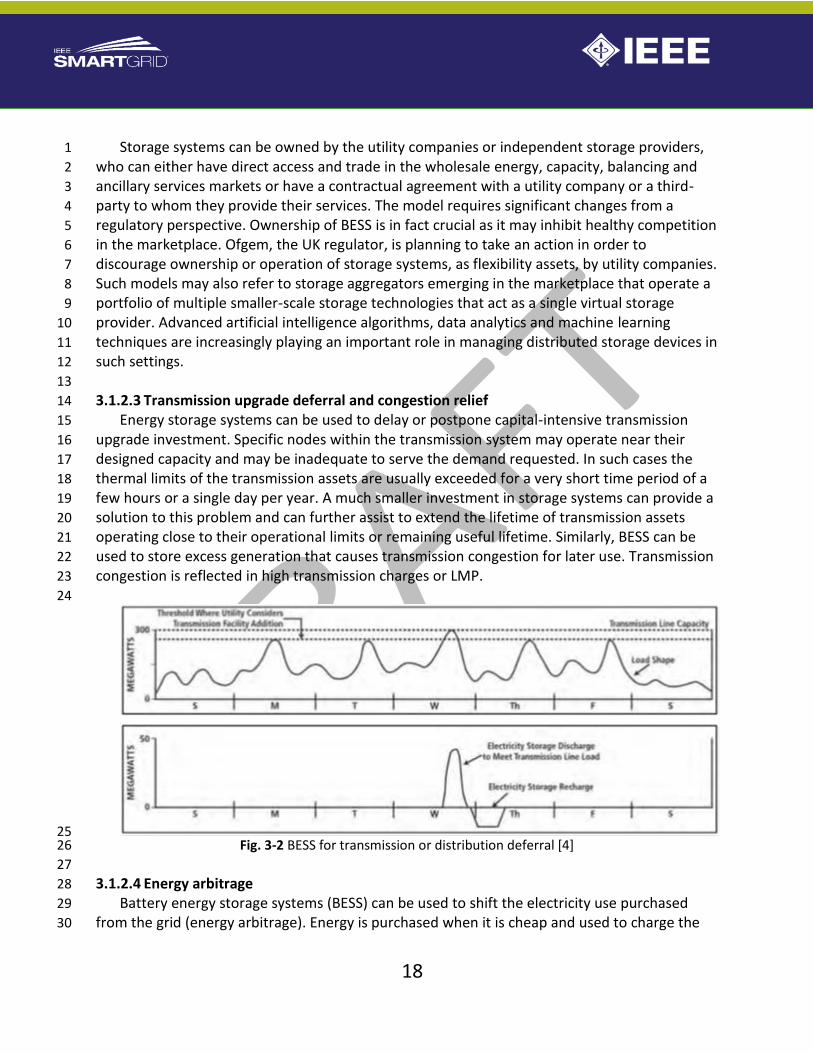
3.1.2.3 Transmission upgrade deferral and congestion relief 14
Energy storage systems can be used to delay or postpone capital-intensive transmission 15
upgrade investment. Specific nodes within the transmission system may operate near their 16
designed capacity and may be inadequate to serve the demand requested. In such cases the 17
thermal limits of the transmission assets are usually exceeded for a very short time period of a 18
few hours or a single day per year. A much smaller investment in storage systems can provide a 19
solution to this problem and can further assist to extend the lifetime of transmission assets 20
operating close to their operational limits or remaining useful lifetime. Similarly, BESS can be 21
used to store excess generation that causes transmission congestion for later use. Transmission 22
congestion is reflected in high transmission charges or LMP. 23
24
25 Fig. 3-2 BESS for transmission or distribution deferral [4] 26
27
3.1.2.4 Energy arbitrage 28
Battery energy storage systems (BESS) can be used to shift the electricity use purchased 29
from the grid (energy arbitrage). Energy is purchased when it is cheap and used to charge the 30

19
storage system, typically when demand is low or availability from renewable resources exists in 1
abundance. Later, batteries are discharged when price or costs of energy is high, typically 2
during peak demand times. In a similar fashion, batteries are used to store the energy surplus 3
of renewable energy systems that needs to be curtailed as it cannot be absorbed by the power 4
system, due to low demand or insufficient transmission capacity. The use of batteries for such 5
applications depends on the relation of the costs incurred for installing the battery system and 6
its use, to the value of the energy and potential revenues when it is sold back to the grid. As a 7
result, in addition to cost considerations, fit-for-purpose battery performance is required that is 8
characterized by high round-trip battery efficiency, low energy losses and satisfactory lifetime 9
and battery degradation mechanism. 10
11
3.1.2.5 Load following 12
Technical requirements for integration of RES are similar to load following, when generating 13
assets adjust their power outputs according to the changes in demand in a specific area. 14
Adjustments are typically required every several minutes. BESS is suitable for this service as it 15
can operate at partial power output without having a significant impact in its lifetime 16
performance and can act very fast. BESS can be used both for ramp-up and ramp-down. On the 17
contrary, conventional power plants can have reduced efficiency, as they consume more fuel 18
and have increased emissions when operated below their desired technical set points. 19
3.1.2.6 Power quality improvement 20
Utility companies need to provide electricity to consumers that fulfils specific technical 21
requirements. However, in certain occasions, a customer may experience short-term or long-22
term voltage variations, frequency variations, harmonics, low power factor and power supply 23
interruptions. Battery or ultracapacitor energy storage systems can be placed on the customer 24
side to prevent such violations and improve power quality characteristics. 25
3.1.2.7 Power reliability 26
BESS can be used as an alternative electrification source when power cannot be supplied by 27
the main grid due to a severe failure event. With the help of battery systems, areas of the grid 28
can operate in islanded mode until the fault is mitigated and normal operation is restored. 29
Storage systems can operate alone or in synergy with backup diesel generators. 30
31
3.1.2.8 Ancillary services 32
Control Performance Standards 1 (CPS1) of NERC requires the system operator to maintain 33
the system frequency within certain range. To achieve the goal, ISO/RTO acquires different 34
Ancillary Services (AS) from generators and load to perform Regulation Up/Down, Responsive 35
Reserve, Non-Spinning Reserve, and Replacement Reserve services. Each of these methods has 36
pros and cons, and the implementation of these methods takes from a millisecond to 30 37
minutes. In the group of “ancillary services” provided in the open market management of the 38
grid, frequency regulation has the highest value. It typically takes minutes rather than seconds 39
if the frequency regulation is provided by ramping (up and/or down) of generation assets. 40

20
Electricity storage has the capability for doing the job in milliseconds, and Pacific Northwest 1
National Laboratory (PNNL) has suggested millisecond electricity storage should have a value of 2
at least twice that of 20 minute assets. In ERCOT, a new category of AS, Fast Responsive 3
Reserve, is added. Taking advantages of quick charging/discharging capability of the battery 4
storage system, millage (receive credit on both charge and discharge) is implemented in some 5
ISOs/RTOs such as PJM. 6 Regulation 7
Regulation is used to compensate for short-time fluctuations between generation and the 8
demand. When the service is provided by conventional fossil-fuel based generators that adjust 9
their power output as the demand fluctuates, these assets may operate below their designated 10
operational constraints leading to reduced lifetime and decreased performance. In addition to 11
reducing damage to generation assets, fast-ramp energy storage can provide regulation 12
services with great accuracy. 13
14 Fig. 3-3 BESS for regulation services [4] 15
16
Responsive, non-spinning and supplemental reserves 17
There are services of reserve capacity that can be utilized when there is a sudden deficit on 18
the generation supply, loss of transmission/distribution lines or sudden increase of the demand 19
that was not predicted. The service comprises generators that are synchronized to the grid but 20
operate at no-load conditions, generators that are not connected to the grid but can respond at 21
short notice, demand reduction services and interruptible loads and additional reserves that act 22

21
as a second line reserve capacity service in the case that previous measures do not work. 1
Storage would need to be discharged only when similar events occur typically 100-200 h per 2
year. 3
Frequency response 4
Frequency response depends on the system’s inertia or the aggregated inertial response of 5
all synchronous generators and rotating masses connected in the power system. Primary 6
response may include governor or demand responsive mechanisms and acts from the first 7
seconds of the disruption. After 30 s, secondary response is initiated through the automatic 8
generation response which is followed by the tertiary response by dispatched generators that 9
aims to restore the system’s frequency within operational limits. Energy storage systems can 10
act very fast to frequency disruptions and can assist to achieve a smoother transition until the 11
frequency is restored. The effectiveness of the storage systems depends on its location with 12
respect to other system components within a specific region of the grid. 13
Black start services 14
BESS has black start capabilities that can assist in restoring normal operation of the power 15
system after a blackout or a catastrophic failure has occurred. In this occasion, battery storage 16
can be used to recharge power lines, startup backup diesel generators and restart power plants 17
that have gone offline. 18
19 Figure 3-4 Black start service by BESS (image redrawn by [4] 20
21
Reactive Support Voltage Control (RSVC) 22
Batteries exchange power to the grid through high power inverters. Those inverters are 23
capable to work in four quadrants which allow them to inject or absorb reactive power as well 24

22
as active power sourced from stored energies in batteries. In some applications, the inverter 1
rating is chosen higher than batteries to feed full power of batteries to the grid plus injecting or 2
absorbing reactive power for supporting reactive power demand and controlling the bus 3
voltage (RSVC). 4
The service provided by battery storage systems is usually required for a period of 30 5
min, before additional services are utilized for voltage stabilization and support. 6
7 Fig. 3-5 BESS for voltage support [4] 8
9
3.2. Distribution level 10
In addition to large-scale implementation of Battery Energy Storage Systems at the 11
transmission level, multiple benefits can be achieved by implementation of BESS at the 12
distribution level. These applications are discussed in this section. 13
14
3.2.1. Current activities 15
The concept of community energy storage (CES) or the community UPS has captured the 16
imagination of the growing ranks of stakeholders with interest in electricity storage (storage). 17
CES is a good example of grid-connected and utility owned and operated distributed energy 18
storage systems (DESS). DESSs are modular storage systems that are located at or near end-19
user homes and businesses. Although it is not a value proposition per se, CES embodies many 20
attractive facets of the broader storage value proposition for the electricity grid and 21
marketplace of the future. 22
Community energy storage entails utility deployment of modular, distributed energy 23
storage systems (DESS) at or near points in the utility distribution system that are close to 24
residential and business end users. The genesis of the CES concept was investigations by 25
American Electric Power (AEP), starting in about 2005, to evaluate the prospects for and merits 26
of locating advanced sodium sulfur (NaS) battery storage, rated at about two MegaWatts (MW), 27
at substations. Eventually, AEP added a different twist on the concept involving numerous 28
much smaller units – rated at 25 kiloWatts (kW) for three hours, or 75 kiloWatt-hours (kWh) – 29
that are distributed and located at or near end-user sites. Recently, Oncor Electric Delivery has 30
installed five 25kWh Li-ion battery next to its Pad-Mount transformer to improve the reliability 31
of certain residential areas that require high service continuity. One notable advantage of using 32
many smaller units is “unit diversity”. Because there are so many units, it is unlikely that a 33

23
substantial amount of CES power will be out-of-service at any time. Said another way, at any 1
time one or maybe a few CESs may be out-of-service. That is helpful if reliability is especially 2
important. 3
3.2.2 Area of applications 4
3.2.2.1 Distribution upgrade deferral 5
BESS can be used to defer building new or reinforcing existing distribution assets such as 6
transformers and distribution lines, by accommodating peaks that typically occur for a duration 7
of a few hours per year. In addition to the investment deferral, BESS can have additional 8
benefits. For example, when a new transformer is upgraded, the planning procedure needs to 9
account for potential load growth in a 20-years’ time horizon, which leads inevitably to low 10
utilization of the distribution assets built. BESS can be transportable to other locations 11
maximizing the value of storage investment and simultaneously minimizing the risks and 12
uncertainties in the planning procedure. 13
14
3.2.2.2 Voltage excursion support 15
When placed in the distribution network, BESS can assist network operators to deal with 16
voltage excursions caused by high RES penetration, especially at sunny/windy periods of low 17
local demand. In residential areas, demand peak occurs typically in the early evening, while PV 18
power production is high around noon. When the volume solar installations is high, this can 19
lead to reverse power flows and overvoltage. DSOs respond to voltage excursions by altering 20
the tap changers position or by utilizing capacitor banks. However, the lifetime of this voltage 21
support equipment is reduced with usage. BESS can provide an alternative to this issue that 22
might extend the lifetime of distribution assets. 23
24
3.2.2.3 Grid support 25
In Italy, energy storage systems must contribute to the improvement of the security of the 26
National Electric Power System by providing specific grid services. In particular, grid connected 27
systems must assure: 28
● Low voltage ride through function; 29
● Active power regulation; 30
● Voltage regulation. 31
● Voltage support in case of short-circuit (only for MV grids). 32 33
These services must be granted by the static converters connecting the batteries to the AC 34
grid. Voltage regulation by reactive power injection can follow local control logics. 35
In order to drive the choice of the most suitable energy storage technology to use in a given 36
situation for providing the above grid services, manufactures are obliged to specify in 37
datasheets some critical parameters, such as: discharge rated power, charge rated power, 38
discharge maximum power, charge maximum power, and useful capacity. In all cases, system 39
behaviour must comply with specific capability curves established by two mandatory technical 40
rules [5]. 41

24
3.2.2.4 Duck curve improvement 1
In 2013 the California Independent System Operator (CAISO) published a net load curve 2
representing the difference between the forecasted load and expected electricity production 3
from variable generation sources including wind and solar. In certain times of the year, 4
especially during spring afternoons, the curve produces a “belly” curve shape followed by a 5
quick ramp similar to the “neck of a duck”. Fig. 3-6 shows the duck chart in a typical spring day 6
in California. 7
8 Fig. 3-6 the California Duck Curve [6] 9
10
California’s energy and environmental policy targets including 50% of retail electricity from 11
renewable sources by 2030 and GHG reduction goal to 1990 levels, has significantly increased 12
the capacity of installed renewables on both sides of the meter, causing the duck curve to 13
arrive earlier than originally estimated. Similar patterns have also been observed in other 14
countries including Austria. 15
California’s climate conditions i.e. sunny and cool spring days with abundant wind result in 16
increased solar, wind and run-of-the river hydro generation, which combined with reduced 17
demand produce the duck belly in the net load curve. Approaching the late afternoon hours, 18
the decrease in the solar output and peak demand causes a steep ramp of almost 13,000 MW 19
during early evening hours. The challenge is how to curtail free and green renewable energy 20
during overgeneration periods, since during hot summer days all renewable energy including 21
solar, wind, biomass and biogas is used and hence essential for the system. 22
In order to operate reliably in these conditions, the ISO requires flexible resources that 23
insure the following: 24
● Balanced supply and demand to mitigate overgeneration: store energy or modify use. 25

25
● Resource flexibility: to insure upward or downward ramping flexibility for a defined 1
period and start and stop multiple times a day as the current resources including 2
nuclear, CHP, biomass and other resources either cannot ramp down or have binding 3
contracts allowing them to operate at full capacity. 4
● Automated frequency response measures. 5 6 Energy storage is a fast acting and flexible resource that can help flatten the duck curve by: 7
● Reducing the net load ramp that other resources must meet. 8
● Reducing overgeneration because less generation is needed online. 9 10
Fig. 3-7 shows ramping capability of energy storage technologies compared to traditional 11
slow-ramping generators. 12
13
14 Fig. 3-7 Ramping Performance of Energy Storage vs. Traditional Generators (Source: 15
NRSTOR) 16
As seen flexible energy storage technologies can provide quick response to dispatching 17
signals with ramping rates that in some cases are hundreds of times faster than traditional 18
generation. Additional factors that limit traditional generators to provide flexible ramping 19
during California duck curve ramps are long start-up time and minimum run-times of these 20
resources. Fig. 3-8 shows a ramping scenario with and without energy storage. 21

26
1 Fig. 3-8 Ramping with and without Energy Storage (Source: California ISO [7]) 2
3
As battery storage charges during the low-price periods and discharges during peak hours 4
when the price is high, it also acts as a down reserve in the system. Application of battery 5
storage in combination with solar PV or in stand-alone utility scale form not only helps to 6
flatten the duck belly and provide economic arbitrage, but also indirectly improves the stability 7
margin and flexibility of the grid by allowing the thermal units to work at higher power points. 8
California mandates the utilities to acquire 1,325 MW of storage by 2020 and encourages 9
behind the meter energy storage. 10
Current Practices 11
CAISO has been developing new policy and market mechanisms to support the 12
development of flexible resources including energy storage to cope with the Duck Curve 13
phenomena: 14
● Mandates the utilities to acquire 1,325 MW of energy storage by 2020 and encourages 15
behind the meter storage technologies. The state’s storage capacity as of Sept. 2016 16
was 73.2 MWs. 17
● Encourage electric vehicle adaptation. 18
● California Government’s September 2016 directive to the California Public Utilities 19
Commission to: 20
○ Evaluate the role of large-scale storage for integration of renewable energy 21
○ Urge the state’s IOUs (investor owned utilities) to invest in up to 500 MW of storage 22
in addition to the existing 1,325 MW target [8] 23
○ Create an independent body to resolve storage interconnection disputes [9] 24
○ Increase SGIP (Self Generation Incentive Program) funding by $249 million: the 25
revised SGIP program has a much bigger focus on energy storage, however, with 26
eligible storage projects receiving 85% of the additional SGIP funds, with 90% going 27
to (non-residential) projects larger than 10 kW (overall, 75% of all SGIP funds are 28
dedicated to energy storage projects) 29
3.2.2.5 Microgrid/Nanogrid development 30
Microgrids are groupings of LV or MV distributed energy resources (DERs) and loads that 31
work together and are connected to the grid from a single (or multiple) point of connection. A 32

27
microgrid should be capable of working in the grid-connected mode as well as the islanded or 1
autonomous mode. Different energy storage mechanisms including battery storage, flywheels, 2
etc. have been used in microgrid applications; however due to their positive impacts on system 3
operation (including energy management and power quality improvement) and falling costs, 4
battery storage technologies have received greater attention. Battery storage benefits the 5
microgrid and nanogrid by providing generation and load balance, mitigating variable nature of 6
renewable energy systems, and unlocking additional revenues from energy arbitrage. An 7
application of BESS is under implementation in Nova Scotia in Canada, which supports 300 8
households in absence of grid power as an Islanded DG. This application, guarantees quick 9
restoration of power for selected consumer till the main supply energizes back the substation. 10
The benefits of battery storage in microgrids is summarized in Table 3-1 [10], [11]. 11
12 Table 3-1 Battery Storage Benefits at Microgrid/Nanogrid Capacity Level 13
Benefit Description Capacity and Duration
Energy Management
Daily load shifting and peak shaving for home, commercial and industrial
10s to 100s kW Hours
Power Quality Avoiding voltage sags and power disruptions for home, commercial and industrial
10s to 100s kW Minutes
Reliability Islanding backup during grid outages for home, commercial and industrial, UPS bridge
10s to 100 kW Hours
Distributed Energy Storage System
On utility side of meters, feeders and substations
10s to 100s kW Hours
T&D System Support
Urban and rural T&D systems upgrade deferrals. Congestion management
10s kW to 10s MW Hours
Renewable Integration
Ramp and voltage support, off-peak storage, time-shift, rapid demand support
100s kW to 10s MW Minutes to hours

28
Wholesale Services
Frequency regulation, ancillary services, arbitrage, spinning reserve
> MW Minutes to Hours
1
Battery storage system interacts with the utility grid and provides service at different levels 2
including end-use customers, community and distribution system. 3
4
Fig. 3-9 shows the utilization of energy storage systems (including battery storage) in 5
the microgrid sector in 2015 and 2016. 6
7 Fig. 3-9 Energy Storage System Utilization by Microgrid Segment, World Markets: 4Q 8
2015 and 2Q 2016 [12] 9 10
Battery technologies for Microgrid/Nanogrid applications 11
Depending on the capacity and applications, different battery storage technologies that can 12
be used in microgrid/nanogrid applications include Lithium-Ion (Li-ion) batteries, Lead-Acid, 13
flow batteries, etc. 14
Table 3-2 shows a comparison between the most common battery storage technologies 15
that can be implemented in microgrid/nanogrid applications. 16
17 Table 3-2 Battery Storage Technologies for Microgrid/Nanogrid Applications 18
Technology Benefits Drawback Applications

29
Sodium Sulfur (NaS)
High energy and power density High round-trip efficiency Long life cycle Fast discharge capability No self-discharge
Safety concerns due to high working temperature
Energy management Power quality improvement
Vanadium Redox Flow Batteries (VRB)
No energy to power ratio constraints High life cycle which does not depend of Depth of Discharge (DoD) Adjustable power rating Limited self-discharge Rapid response time
Poor energy-to-volume ratio Heavyweight
Energy management Power quality Ideal for solar-storage combination due to no DoD limits
Lead Acid (PbA)
High maturity Low cost High efficiency
Low power and energy density Low reliability Low cycle life
Power and energy applications In use in some off-grid microgrids
Lithium-Ion (Li-ion)
Very high efficiency Very high energy density High cycle life High DoD capability Fast response time Resilience to irregular discharging
Relatively expensive (cost going down rapidly) Lower energy to power ratio
Power applications Energy applications Residential microgrids
1

30
3.2.2.6 EV battery and charging station 1
According to IEA (International Energy Agency) Global EV Outlook 2016 [13], 1.26 million 2
electric cars were added to the global vehicle fleet in 2015, and from this number 80% of in-use 3
EVs are in United States, China, Japan, the Netherlands and Norway. 4
Major factors that impact the commercialization growth of Battery Electric Vehicles (BEV) 5
and Plug-in Hybrid Electric Vehicles (PHEV) include: 6
● Cost per kilowatt-hour of battery packs which has been cut by a factor four (4) since 7
2008 8
● Battery energy density improvement to allow longer ranges 9
● EV charging technology and infrastructure 10
Fig. 3-10 shows the evolution and projection of battery energy density and cost from 2008 11
to 2022. 12
13
14 Fig. 3-10 Battery Energy Density and Cost [13] 15
16
Fig. 3-11 shows available global EV charging stations (public and private Electric Vehicle 17
Supply Equipment or EVSE) which reached 1.15 million in 2015. 18
19

31
1 Fig. 3-11 Global EV Charging Outlets [13] 2
3
EV Battery Technologies 4
The most popular technologies used in EV batteries include: 5
● Lithium-Ion: the most common battery type in EVs in 2015 due to its light weight, good 6
power density, and high charge/discharge efficiency. Used in Tesla model S and X, 7
Nissan Leaf, BMW i3, and other cars [14]. 8
● Lead-Acid: common EV batteries in the past due to mature technology, and low cost. 9
● Solid state batteries: Solid state design replaces the flammable liquid electrolyte in 10
Lithium Ion type. These battery types are already in use by BlueCars (Bolloré BlueCar), 11
developed for a car-sharing service company in France [15]. Other car manufacturers 12
such as Hyundai [16], Toyota and Volkswagen have also started developing solid state 13
battery technologies for EVs [17], [18]. 14
● Metal-Air: consist of metal anode (aluminum, iron, lithium, magnesium, vanadium, and 15
zinc have been discussed) and ambient air (oxygen) cathode which significantly reduces 16
the battery weight. The battery manufacturer Phinergy claimed to have built an 17
Aluminum-Air battery that lasts 3,000 km per charge [19]. Electric car manufacturer 18
Tesla has been recently looking into hybrid lithium-ion/metal-air batteries to power 19
electric vehicles [20]. The main drawback of these batteries is the need to replace the 20
battery instead of simply recharging. 21
● Aluminum Ion: similar to Li-ion batteries but using Al as anode. 22
● Lithium-Sulfur: typically have Lithium anode and Sulfur-Carbon cathode. 23
24 Table 3-3 Different EV Battery Technologies 25
Battery Type
Benefits Drawbacks Car Brands

32
Lithium-Ion
Light weight High energy density Good power density High charge/discharge efficiency New models have lower power density and higher safety and very long lifespan
Liquid electrolyte leak Fire hazard and safety concerns Short cycle life Degradation with age
Most used in EVs including: Tesla, BMW, Nissan, Kia, Chevrolet, etc.
Solid State High power to weight ratio No electrolyte leaks or fire hazard Minimized self-discharge rate Extended lifetime Reduced cooling requirement Extended temperature range
Low power density due to high current limitations of solid material
Blue Cars, Hyundai, Toyota, Volkswagen
Lead Acid Mature technology Low cost Highly available
Low energy density Low efficiency Temperature sensitivity of efficiency and capacity
EV1, RAV4 EV
Metal Air Very high energy density Very high range Low weight
Limited cyclability Limited lifetime Not rechargeable via plugging-in
Experimental
Aluminum Ion
Higher safety (compared to Li-ion) Lower cost
Low cycle life (under improvement)
Experimental

33
Lithium Sulfur
Higher energy density Lower cost
Low cycle life due to reactions with the electrolyte
Experimental
As a highly dynamic and quick source of energy, BESSs (Battery Energy Storage Systems) are 1
required to be studied for possible impacts while connecting to utility feeder as follows [21, 22, 2
23]: 3
1. Study of charge/discharge ramp rates 4
2. Study of flicker 5
3. Ensuring of 4 quadrant operation capability 6
4. Steady state voltage under the feeder light and peak loading conditions 7
5. Distribution system equipment thermal loading, identifying any equipment to be 8
upgraded 9
6. Anti-Islanding operation and protection 10
7. Fault current contribution and relay coordination 11
8. Energization and sudden trip 12
9. Surge arrester rating 13
10. Need for transfer trip 14
15
Currently most of utilities require performing comprehensive study, called DCIA (Detailed 16
Connection Impact Assessment) for BESS projects to ensure having less problems to utilize the 17
energy storage system or prepare substation by upgrading some equipment ratings for the 18
constant and safe operation of the BESS. Currently, DCIA becomes serious requirement of 19
battery energy storage projects in North America. 20
21
3.3. Residential level 22
When used at the residential level, battery energy storage systems can provide several 23
benefits including: 24
Load Shifting: the cost of grid electricity and Time of Use rates are two major drivers for 25
application of residential battery storage for energy management purposes. If used in 26
parallel with the grid, batteries can charge during off-peak hours and discharge during 27
peak hours to provide load shifting and subsequent economic benefits to residential 28
customers. 29
Reliability and Resilience: battery storage can act as backup energy provider for home-30
owners during planned and unplanned grid outages. 31
Coupling with Renewable Energy Systems: home battery storage can be coupled with 32
roof-top solar PV to cope with intermittent nature of solar power and maximize the self-33
consumption. Installing batteries allows charging during day-time when solar energy is 34
abundant and probably on-site generation more than consumption and using the stored 35
energy during peak load period. 36 37

34
GTM Research predicts that behind the meter storage segment in U.S. will grow from a 20% 1
share of the annual storage market in 2016 to 52% in 2022 [24]. Fig. 3-12 shows GTM 2
Research’s projection of U.S. energy storage deployment by sector between 2013 and 2016. 3
Among different technologies, the residential sector is dominated by battery storage and 4
specifically Li-ion technology. 5
6
7 Fig. 3-12 U.S. Energy Storage Deployment by Sector in 2013-2016 [25] 8
9
In addition, storage devices in Smart Homes and EVs can provide flexibility behind the 10
meter and offer grid services through demand side management and demand response 11
schemes. Consumers can obtain greater control of their own energy use and reduce their 12
energy bills, while utility companies can benefit from the flexibility services offered by end-13
consumers. Storage can play a vital role in achieving a more flexible and smarter energy system. 14
It can be a critical enabler for the decentralization of the system and new business models, such 15
as P2P energy trading between prosumers and consumers. 16
Battery technologies for residential applications 17
Due to specific application of home battery storage, i.e. multiple daily cycles especially 18
when paired with solar PV, the battery technology must have a high cycle life. Due to declining 19
cost, high cycling capability, and charge and discharge efficiency Li-ion batteries are the most 20
popular choice in the residential battery storage market at the moment, however deep cycle 21
Lead-Acid and flow batteries are also being used in residential applications. 22
The number of vendor and developer companies in residential battery storage is increasing 23
rapidly, however Tesla and Sunverge are among the leading vendors. Other companies such as 24

35
LG Chem, Panasonic, Samsung and Mercedes Benz are also entering this market. Table 3-4 1
shows the specifications of the most popular technologies currently available in the market. 2
Data is collected from different manufacturers’ websites. 3
4 Table 3-4 Home Battery Storage Technologies 5
Vendor Technology Specifications Applications
Tesla
Li-ion
13.5 kWh 7 kWp DC and AC system 91.8% and 89% roundtrip efficiency 1150mmx755mm*155mm 125 kg
Capable of coupling with solar PV Solar self-consumption Time of use load shifting Backup Off grid Mobile app automatic management
Sunverge Li-ion 7.7 kWh, 11.6 kWh, 15.5 kWh & 19.4 kWh 6 kWp and 7 kWp DC and AC coupled 92.5% and 93% CEC weighted efficiency for 6kWp and 7 kWp 1920mmx860mmx360mm 272 kg to 403 kg
Capable of coupling with solar PV Solar self-consumption Energy management Backup power Virtual power plant Cloud-based mobile software platform Dedicated connections for solar and critical load panels included in the AC system

36
LG Chem Li-ion 5 models 3.3 kWh to 19.6 kWh In 48 V and 400 V packs 95% DC round trip efficiency Inverter not included Dimensions variable depending on capacity 31 kg to 99.8 kg
Capable of coupling with solar PV Energy management Self-consumption Backup power
LG ESS Li Polymer 6.4 kWh 5 kWp (AC) 95.7% max system efficiency DC coupled PCS: 670mmx493mmx185mm Battery: 682mmx408mmx180mm PCS weight: 34 kg Battery weight: 58 kg
Available in Germany PV self-consumption Smart energy management system with 7inch touchscreen display Web monitoring with PC, tablet or smart phone Three-phase connection
Panasonic Li-ion 8 kWh and 5.3 kWh 2 kW Built-in inverter 93% max inverter efficiency 1380mmx966mmx279mm 84 kg
Capable of coupling with solar PV Energy solutions Maximize self-consumption Programmed charge/discharge Back-up Charge/discharge remote control

37
Samsung SDI
Li-ion 1 kWh and 4.8 kWh battery module Scalable up to 16 and 188 kWh Inverter not included 8 kg and 37 kg per module Dimensions variable depending on capacity
Capable of coupling with solar PV Energy solutions Backup
Sunrun Li-ion LG Chem batteries combined with Sunrun solar PV
PV self-consumption Backup power Energy optimization
1
3.4. Transportation 2
The environmental issues, the economic situations, and energy security have reshaped the 3
way people think about energy. Looking for the alternative energy sources that are both 4
sustainable and clean will be substantial and fundamental for the generations to come. 5
On the environment side, as the evidence of climate change is getting more and more 6
apparent, it becomes a global consent that actions must be taken to curbing greenhouse gas 7
emission. According to the report from Energy Information Administration (Fig. 3-13), the 8
transportation sector alone takes up to 33.1 percent of all energy-related emissions and is the 9
largest producer of carbon dioxide emission in US. This presents the urgent needs for the 10
transportation sector in the U.S. to act on emissions abatement. 11
12 Fig. 3-13 U.S. energy-related Carbon Dioxide Emission by End User, 2009 13
14
To promote the deployment and public acceptance of PEV, it is necessary to 15
reduce/eliminate the range anxiety of PEV users. A well-planned fast (Level 3) charging 16
infrastructure plays an important role for PEV penetration. Therefore, one should consider the 17
EV charging infrastructure from the regional point of view. In addition, it is desired to integrate 18

38
renewable energy sources including wind and solar energy with electricity from power grid into 1
PEV charging station for sustainable future development. 2
The PEV charging station with distributed energy storage system can also participate in 3
deregulated market. Since the wholesale price of the electricity shows considerably volatility in 4
the deregulated market, accuracy of market price prediction is one of the most important tasks 5
to maximize the profit of the charging station. 6
Regional EV charging station system [26, 27] 7
The EV fast charging station is necessary for EV adoption. To avoid the negative impact on 8
the distribution network and fully utilize the renewable energy, it should equip with distributed 9
energy storage system that uses solar, wind energy, and electricity from power grid to 10
simultaneously charge multiple EVs. The participation of this PEV charging station system in the 11
deregulated market highlights the benefit of wind and solar energy as well as distributed 12
energy storage system with the optimal operational strategies. However, the operation 13
charging station should be determined from the regional point of view (Virtual Power Plant 14
(VPP)) to achieve global optimization. Hence, the conceptual regional PEV charging station 15
system is shown in Fig. 3-14 and overall regional with centralized control is shown in Fig. 3-15. 16
To improve the renewable energy utilization, the PEV charging station can serve as source of 17
flexibility by changing the charging rate to compensate the source of variability from the 18
renewable energy. 19
20 Fig. 3-14 PEV Charging Station 21
22

39
1 Fig. 3-15 Configuration of PEV Charging Infrastructure 2
3
Wayside Rail Energy Storage 4
Light rail and trolleys generally operate at voltages between 600-1500V DC, and these 5
system voltages are derived from the available grid power. Grid power is susceptible to changes 6
and fluctuations based on overall load on the system. As an example, if multiple train lines are 7
running and stopping and starting simultaneously, the grid voltage could drop sufficiently to 8
affect the performance of the train or tram. Ultracapacitor energy storage systems are 9
deployed to mitigate the effects of grid system overload by rapidly accepting rail braking 10
energy, and then discharging to support train acceleration out of the station. 11
Automotive Start Stop 12
Start/stop technology enables the engine in a conventional, electric or hybrid-electric 13
vehicle to shut down when it comes to a stop at a red light or while sitting in traffic. The system 14
is based on an intelligent combination of engine, brake and power management. Given that this 15
application requires instantaneous response and high cycling, ultracapacitors are commonly 16
deployed and have been deployed in over 1 million start/stop vehicles to support the restart of 17
the engine during a start/stop event. 18
Hybrid Bus 19
Mass transit buses are now able to reduce emissions by as much as 75% using hybrid-20
electric propulsion systems. Ultracapacitors are often deployed in urban diesel and hybrid 21
electric busses as the energy storage component in the regenerative braking system to rapidly 22
store kinetic energy from braking, and release for propulsion. 23
Onboard Rail 24
Ultracapacitors and BESS can be deployed on-board in the same manner they are deployed 25
at a wayside station, in this instance to reduce energy consumption during transit or eliminate 26

40
the need of catenary lines in some sections that installing OCL (Overhead Catenary Lines) is 1
difficult or expose hazard to surrounding area. Additionally, ultracapacitors and BESS can be 2
being used to provide locomotive engine starting, and assisted starting (battery and 3
ultracapacitor combined system) as a mechanism to eliminate large batteries, or in some cases, 4
to extend the life of the large batteries historically used in locomotive engine starting 5
applications. 6
Offshore Vessel with BESS 7
On-board batteries are the way of the future. Energy storage is the right approach to make 8
energy systems on board ships more intelligent and efficient. Energy storage systems can be 9
especially beneficial on vessels with a widely fluctuating fuel consumption profile. 10
Nidec ASI, retrofitted a Norwegian ship, the Viking Queen (a 6,000 tonne vessel built in 11
2008), with a battery energy storage system to help reduce fuel consumption and emissions for 12
greener, more efficient power supply [28]. 13
Eidesvik Offshore is a Norwegian ship company that specializes in offshore logistics, seismic 14
and underwater operations. With two dozen ships in its fleet, the environmentally sensitive 15
company has a keen interest in finding ways to reduce fuel consumption, emissions and 16
maintenance costs. For The Viking Queen, one of its offshore support vessels, Eidesvik sought 17
an energy storage solution that would help it achieve these goals. 18
To improve the energy efficiency, Eidesvik made the decision to retrofit the Viking Queen 19
with a BESS, making it the first operating offshore vessel to benefit from such a system. 20
Provided by Nidec ASI, the 650kWh, 1600kW containerized solution was custom-designed to 21
match the vessel’s operating profile. 22
The use of battery storage reduces the vessel’s fuel consumption by approximately 18%. 23
The BESS also makes it possible for Viking Queen to reduce nitrogen oxide, carbon dioxide and 24
other greenhouse gas emissions by approximately 25%. 25
The project has demonstrated that the battery configuration can help manage energy use. 26
For instance, when the ship has different loads, it normally has two generator sets running at 27
low load settings. When a heavier-than-usual power load is required, a second generator is 28
needed to quickly provide additional power. By adding a battery, it’s possible to operate on just 29
one generator set by allowing the battery to take the surge. The primary generator is then run 30
at a higher, more efficient load. Different settings are also needed when in transit or using 31
dynamic positioning. Here batteries replace the motor, alternating between running the 32
generator set at much higher load to power the ship and recharge the battery. The ship can also 33
run for an extended time on batteries only, useful for entering into harbours. 34

41
1 Fig 3-16 Offshore vessel with BESS 2
3
4
5
6
7
8
9
10
11
12
13 14
References: 15
[1] Mike Munsel, In Shift to Longer-Duration Applications, US Energy Storage Installations Grow 16
100% in 2016, Q4 marked a turning point in the U.S. utility-scale energy storage market.GTM, 17
March 2017 18

42
[2] Stantec Consultant Co., Report on Festival Hydro BESS DCIA (Detailed Connection Impact 1
Assessment), Aug. 2017 2
[3] Stantec Consultant Co., Report on NSPI BESS DCIA (Detailed Connection Impact 3
Assessment), July 2017 4
[4] A.A. Akhil, G. Huff, A.B. Currier, B.C. Kaun, D.M. Rastler, S.B. Chen, A.L. Cotter, D.T. 5
Bradshaw, W.D. Gauntlett. “DOE/EPRI 2013 Electricity storage handbook in collaboration with 6
NRECA,” Sandia National Laboratories; 2013. 7
[5] CEI Standard 0-21 for LV systems and CEI 0-16 for MV systems 8
[6] California Independent System Operator. (2016). Duck Curve [Online], Available: 9
https://www.caiso.com/Documents/FlexibleResourcesHelpRenewables_FastFacts.pdf 10
[7] Reneweconomy. (2016). California’s duck curve has arrived earlier than expected [Online]. 11
Available: http://reneweconomy.com.au/californias-duck-curve-has-arrived-earlier-than-12
expected-36106/ 13
[8] California Legislative Information. (2016). Assembly Bill no. 2868 [Online]. Available: 14
https://leginfo.legislature.ca.gov/faces/billTextClient.xhtml?bill_id=201520160AB2868 15
[9] California Legislative Information. (2016). Assembly Bill no. 2861 [Online]. Available: 16
https://leginfo.legislature.ca.gov/faces/billTextClient.xhtml?bill_id=201520160AB2861 17
[10] M. Amin, “Microgrids and Battery Storage: In search of enlightened poly to build a better 18
business case”. Public Utilities Fortnightly Magazine, January 2016. 19
[11] H. Alharbi, “Optimal Planning and Scheduling of Battery Energy Storage Systems for 20
Isolated Microgrids”, Master’s Thesis, University of Waterloo, 2015 21
[12] Navigant Research. (2016). The Growing Role of Energy Storage on Microgrids [Online]. 22
Available: https://www.navigantresearch.com/tag/energy-storage-microgrids 23
[13] International Energy Agency (2016). Global EV Outlook 2016 [Online]. Available: 24
https://www.iea.org/publications/freepublications/publication/Global_EV_Outlook_2016.pdf 25
[14] Brookings (2015). Five emerging battery technologies for electric vehicles [Online]. 26
Available: https://www.brookings.edu/blog/techtank/2015/09/15/five-emerging-battery-27
technologies-for-electric-vehicles/ 28
[15] Green Car Reports (2015). Solid-State Batteries Already Powering Electric Cars: BlueCars, In 29
Fact [Online]. Available: https://www.greencarreports.com/news/1098904_solid-state-30
batteries-already-powering-electric-cars-bluecars-in-fact 31
[16] The Korea Herald. (2017). Hyundai Motor solely developing EV batteries [Online]. Available: 32
http://www.koreaherald.com/view.php?ud=20170405000762 33
[17] CNBC. (2017). UPDATE 2-Toyota to market over 10 battery EV models in early 2020s 34
[Online]. Available: https://www.cnbc.com/2017/12/18/reuters-america-update-2-toyota-to-35
market-over-10-battery-ev-models-in-early-2020s.html 36

43
[18] CleanTechnica. (2017). BMW & Solid Power To Jointly Develop Solid-State Batteries For 1
Electric Vehicles [Online]. Available: https://cleantechnica.com/2017/12/18/bmw-solid-power-2
jointly-develop-solid-state-batteries-electric-vehicles/ 3
[19] CBC News. (2014). Electric car with massive range in demo by Phinergy, Alcoa [Online]. 4
Available: http://www.cbc.ca/news/technology/electric-car-with-massive-range-in-demo-by-5
phinergy-alcoa-1.2664653 6
[20] Green Car Reports (2017). Tesla granted patent on metal-air battery charging [Online]. 7
Available: https://www.greencarreports.com/news/1108951_tesla-granted-patent-on-metal-8
air-battery-charging 9
[21] M.Boloorrchi, M.Rostami, V.Green, “BESS Connection Impact Assessment,Considerations, 10
Modeling and Case Study”, 2017 IEEE 30th conference on Electrical and Computer Engineering 11
(CCECE), Windsor, Ontario – Canada, May 2017 12
[22] IEEE Standard for Interconnecting Distributed Resources with Electric Power Systems, IEEE 13
Std 1547-2003 14
[23] IEEE Standard for Interconnecting Distributed Resources with Electric Power Systems - 15
Amendment 1. IEEE Std 1547a-2014 (Amendment to IEEE Std 1547-2003) 16
[24] GreenTech Media. (2017). A Record-Breaking Quarter for America’s Behind-the-Metee 17
Energy Storage Market [Online]. Available: 18
https://www.greentechmedia.com/articles/read/record-breaking-quarter-for-u-s-behind-the-19
meter-energy-storage-market#gs.D4vweL4 20
[25] GTM Research, ENERGY STORAGE SERVICE [Online]. Available: 21
https://www.greentechmedia.com/research/subscription/energy-storage-22
service#gs.GUMMc_g 23
[26] Piampoom Sarikprueck, Wei-Jen Lee, Asama Kulvanitchaiyanunt, Victoria Chen, and Jay 24
Rosenberger, “Novel Hybrid Market Price Forecasting Method with Data Clustering Techniques 25
for EV Charging Station Application”, IEEE Transactions on Industry Applications. Volume: 26
51, No. 3, May/June 2015. Pp1987 – 1996. 27
[27] Piampoom Sarikprueck, Wei-Jen Lee, Asama Kulvanitchaiyanunt, Victoria C.P. Chen, and 28
Jay Rosenberger, “Bounds for Optimal Control of a Regional Plug-In Electric Vehicle Charging 29
Station System”, IEEE-IAS, I&CPS Annual Conference, Niagara Falls, Canada. May 2017. 30
[28] Energy Storage News, “The first offshore vessel with a battery energy storage system in 31
operation”, March 2017. 32
33

44
4. Potential Solutions to the Energy Storage issues 1
4.1. Introduction 2
In this chapter, we discuss the application of the energy storage units as a solution to some 3
of the power issuers in different generation, transmission, and distribution systems: 4
5
4.2. Generation 6
Conventional (fossil fuel based) plants mostly rely on battery storage units for the 7
emergency power. They use either batteries or flywheel type of energy storage units to obtain 8
power once part of their generation system is down. Both of these technologies are utilized in 9
UPS systems. This takes us to the discussion of different type of UPS systems. Not to mention a 10
generation unit needs additional back-up units if a long term shut down becomes necessary. 11
There are two type of UPS systems, that is, static, and rotary UPS. Static UPS utilizes batteries to 12
fill the gap between the time the main power source is out till the diesel (other sources) come 13
online. Rotary UPS systems rely on flywheel technology to fill the gap between when the main 14
power source is out until other sources come online. There are many differences between 15
these two types of technology. There are also some manufacturers of flywheels, who offer their 16
devices to increase the stability of the grid. That is, those devices will be spinning offline, and 17
they will come online once there is a drop in the frequency. These devices need to be closely 18
monitored to inject or absorb “real” power if the frequency decreases or increases. All these 19
devices can be used with renewables, as well. The difference, though, is renewables such as 20
wind, and solar don’t normally have the large inertia that conventional power plants do. 21
Generators have a large moment of inertia due to the rotor, and stator mass. Wind turbines 22
lack that element, and solar is even worse due to going through a full inverter. Below we will 23
look at some renewable energy sources, and how energy storage units can be integrated with 24
them. 25
26
4.2.1 Renewable Energy Storage Units 27
This portion comes from the NREL report titled “The Role of Energy Storage with Renewable 28
Electricity” in Jan 2010: 29
Renewable energy sources, such as wind and solar, have vast potential to reduce 30
dependence on fossil fuels and greenhouse gas emissions in the electric sector. Climate change 31
concerns, state initiatives including renewable portfolio standards, and consumer efforts are 32
resulting in increased deployments of both technologies. Both solar photovoltaics (PV) and 33
wind energy have variable and uncertain (sometimes referred to as “intermittent”) [1] To 34
determine the potential role of storage in the grid of the future, it is important to examine the 35
technical and economic impacts of variable renewable energy sources. Renewable energy 36
resources are sometimes used for peak shaving purposes. That is, utilizing them for the 37
situations, where the consumption exceeds the predicted generation, hence normal generation 38
units won’t be able to meet the grid demand. 39

45
If renewables such as wind, solar, etc… are utilized as a primary source of electricity, they 1
most often are controlled through the voltage, and frequency of the grid at the point of 2
common coupling. That is, there should be mechanisms to control the reactive or active power 3
generation so regulate the P, and Q in the system. In case of the drop of the frequency we need 4
a source of energy storage. Battery storage units can be one viable option to meet this demand. 5
There are response time, stability, power regulation, and other parameters involved, which the 6
energy storage needs to meet. 7
NREL report titled “The Role of Energy Storage with Renewable Electricity” in Jan 2010: 8
“The challenges associated with meeting the variation in demand while providing reliable 9
services has motivated historical development of energy storage. While a number of pumped 10
hydro storage (PHS) plants were built in the United States before 1970, significant interest, 11
research, and funding for new storage technologies began in the early 1970s, associated with 12
dramatic increases in oil prices” 13
For wind applications, FERC order 661 or IEEE 1547 lays out the rules in terms of voltage, 14
and frequency regulations. This will then translate to the requirements for an energy storage 15
unit and its response time when it needs to come online. The demand from the industry is push 16
the battery energy storage units to be more compact, capable of dispatching large amounts of 17
energy in a very small amount of time. In this area, they can be competing with other 18
technologies such as rotating flywheels. 19
20
4.3. Transmission 21
Transmission systems will utilize energy storage units in terms of all different power factor 22
or reactive power compensators. FACTS (Flexible AC Transmission Systems) are good example 23
of energy storage units application. These devices mostly regulate the voltage magnitude, 24
which means they are directly dependent on the storage units. However, most of them are 25
capable of injecting or absorbing active power, if necessary. STATCOM, and SVC’s are good 26
examples of such devices. 27
Another important aspect to consider is the impact of the installation of battery storage 28
units on the long-term transmission expansion planning [2]. 29
Indeed, the fulfilment of COP21 targets by 2020 will lead to the rise of new RES-based 30
generation plants in EU, US and China. New transmission lines will be built in order to deliver 31
the new installed capacity to the load centres, as demonstrated by the most recent grid 32
expansion plans worldwide [3]-[4]. 33
A very significant limit to the implementation of the above-mentioned plans is the delay in 34
the authorization and construction of new lines that, often, causes also a delay in the 35
connection of new plants to the transmission grid. 36
Battery storage systems coupled with wind or PV plants and suitably operated can be used 37
for peak shaving actions, reducing the power injection and, consequently, the power flows on 38
the existing transmission lines. This is particularly advantageous in areas characterized by old 39
lines with low transmission capacity or by low load density. 40

46
Therefore, the installation of battery units offers the possibility of deferring in time the 1
construction of new lines, maintaining the power flow on the existing lines below a desired 2
value with the following main advantages: 3
● usually a reduction of energy losses in lines and transformers; 4
● reduction of the maximum voltage drop (corresponding to the circulation of the current 5
due to the peak of production); 6
● increase of the lifetime of the conductors (due to the reduction of the maximum current 7
flowing in the line) [5]. 8
The same advantages can be achieved installing battery storage systems in strategic buses 9
of the transmission grid. 10
For this reasons, future research on transmission grid planning should include the study of 11
the possible contribution from storage. In this case, the optimal sizing and siting problem and 12
the optimal management problem for battery storage systems must be formulated and solved. 13
The problems can be mathematically expressed as multi-objective optimization problems, 14
considering both technical and economical functions and constraints, such as: 15
● the overall cost of new lines and storage facilities; 16
● the energy losses in lines and transformers; 17
● the voltage profile in the grid; 18
● the battery total installed capacity; 19
● the maximum number of charge/discharge cycles in a period, etc. 20
21
4.4. Distribution 22
Distribution systems will utilize energy storage for Demand Response programs both in AC 23
and in DC microgrids [6]-[7]. Electric storage can be designed and managed for providing 24
various grid services. 25
At distribution grid, electric storage systems can be used for facing some serious issues due 26
to the increasing of load demand and to high levels of DG penetration. Indeed, batteries can be 27
sized, located and operated in order to: 28
● Mitigate DG production variability. In this case, batteries are connected to generation 29
buses or in substations where inversion of real power flow may occur; 30
● Mitigate load variability. In this case, batteries are connected close to the load that 31
show the most significant variability during the day, usually at MV level; 32
● Reduce voltage drops and provide a more uniform grid voltage profile. In this case, 33
batteries are connected to buses characterized by the lowest voltage values. 34
The installation of battery units connected to the LV grid, as in rural areas, will favour the 35
installation of DG units, whose operation is often limited during peak production periods by the 36
unsuitableness of the lines. 37
The above applications of electric storage systems require an in-depth knowledge of the 38
distribution grid and of its specific problems and, for a coordinated operation of the battery 39
units, need the realization of a suitable monitoring and control system Error! Reference source 40

47
not found.. Often, new connections between existing buses must be realized for avoiding 1
power losses increases, due to the batteries management. 2
In the same way as in transmission networks applications, research studies on electric 3
storage systems application in distribution grid are looking at the definition of suitable 4
optimization algorithm for optimal design and management of batteries. 5
6
7
References: 8
[1] NREL report titled “The Role of Energy Storage with Renewable Electricity”, Jan 2010. 9
Paul Denholm, Erik Ela, Brendan Kirby, and Michael Milligan. 10
[2] J.A. Aguado, S. de la Torre, A. Trivino, “Battery energy storage systems in transmission 11
network expansion planning”, Electric Power Systems Research vol 145 (2017), pp. 63–12
72. 13
[3] The 13th five-year plan for economic and social development of the people’s republic 14
of China (2016-2020), July 2017. 15
[4] The ten year network development plan, 2016, Executive report, available at: 16
http://tyndp.entsoe.eu/, accessed on may 15th 2017 17
[5] CEI Standard 11-60 “Carrying capacity at thermic limit of overhead lines exceeding 100 18
kV”, 2002. 19
[6] S. A. Saleh; A. A. Aldik; E. Castillo-Guerra, “Distributed energy storage unit-based 20
active demand response for residential loads”,2017 IEEE Industry Applications Society 21
Annual Meeting, pp. 1-9. 22
[7] H. Bašić, T. Dragičević, H. Pandžić, F. Blaabjerg, “DC microgrids with energy storage 23
systems and demand response for providing support to frequency regulation of 24
electrical power systems”, 2017 19th European Conference on Power Electronics and 25
Applications (EPE'17 ECCE Europe), pp. 1-10. 26
[8] M.G. Ippolito, M.L. Di Silvestre, E. Riva Sanseverino, G. Zizzo, G. Graditi, “Multi-27
objective optimized management of electrical energy storage systems in an islanded 28
network with renewable energy sources under different design scenarios”, ENERGY 29
vol 64 (2014), pp. 648-662. 30
31

48
5. Electrochemical energy storage and safety 1
5.1. Introduction 2
The need for and benefits of enhanced energy storage and especially enhanced 3
electrochemical energy storage to enable better utilization of grid resources have been 4
discussed in the previous chapters. This chapter addresses the potential safety issues 5
associated with large scale energy storage. Unintended release of the stored energy can be 6
hazardous. For this, it is vital to note that the quantities of energy involved in grid applications 7
are significant. The energy stored in a 1 MW-hr system is of the same approximate magnitude 8
as 1000 kg of typical fuels (i.e. gasoline or diesel); this is based on an energy content of 44 9
MJ/kg of fuels and a conversion efficiency of 80%. Because grid scale storage systems are held 10
to high safety standards, incidents are infrequent and the broader community is not often 11
familiar with the potential consequences of system failures, though they do occur; several 12
recent incidents with grid-scale storage facilities include [1-3]. It is important to note that this 13
is not unique to electrochemical energy storage, and failures associated with pumped 14
hydroelectric [4] or flywheel systems can still occur. 15
We divide this chapter into several sections, addressing first reliability and aging of cells as it 16
relates to safety, then several sections addressing the hazards associated with the actual energy 17
storage with an emphasis on lithium-ion systems that have the greatest need for mitigation, 18
then the potential arcing hazard of DC systems and then the safety of power conversion 19
systems. 20
21
5.2. Reliability and aging 22
Cell cycling leads to volumetric variations in cell components that put mechanical strain on 23
electrodes, potentially leading to internal detachment of particles from the matrix. In many 24
cases, this limits the number of phase transitions that can be used and reduces capacity below 25
theoretical capacities. The SEI layer in lithium ion cells is an example of a side reaction 26
occurring in the early stages of cell operation. A stable SEI layer is required for operational 27
stability since the normal operating voltages lead to degradation of the electrolyte by the 28
charged negative electrode. Ethylene carbonate is a typical electrolyte component that has 29
been associated with SEI formation, and vinyl-carbonate has been identified as a slightly more 30
reactive trace additive that helps form stable SEI layers. Poor SEI formation can lead to 31
excessive SEI layer growth and impedance; lithium plating can occur over the top of excessive 32
SEI layer growth [5]. 33
Lithium plating can also occur at very low temperatures, and this provides a lower limit to 34
lithium-cell operation temperatures along with limits on electrolyte phase change. 35
Lithium-ion cathodes are also reactive enough to oxidize the electrolyte at operating 36
voltages and at elevated temperatures some products of the alkyl-carbonate electrolyte 37
oxidation have been detected. This and the decomposition of the SEI layer at higher 38
temperatures places upper limits on operating temperatures for lithium-ion cells, often in the 39
vicinity of 60 C. Some cathode materials are also subject to undesirable phase change in the 40
charged state that can lead to capacity loss; this is true of layered metal oxide cathodes of the 41

49
class LiMO2, the most commonly employed cathodes in current lithium-ion systems. Metal 1
dissolution from the cathode into the electrolyte is also possible with dissolved metals likely 2
reacting in the electrolyte to form passivating metal salts that might increase impedance [6]. 3
In general, all of these side reactions lead to reduced cell capacity and increased cell 4
impedance. 5
6
5.3. Effects of scale 7
Because of the susceptibility of batteries to degradation by overheating, the heat generated 8
during cycling is a concern. For high power battery systems, the requirement to remove heat 9
generated can be significant. Cooling removes heat from the exterior of the system or 10
wherever cooling is installed. For large energy storage systems, the effective distance between 11
heat generation and cooling might be significant. For example, if the volumetric power 12
generated internally to be dissipated (i.e. Joule heating per volume) is �̇� and the characteristic 13
length to the surface where heat is dissipated is l, the effective thermal conductivity within the 14
system is and the effective heat transfer coefficient between the battery pack and the cooling 15
system or surrounding air is h, then the approximate temperature rise within the system is 16
estimated as (𝛥𝑇𝑖) ≈ �̇�𝑙2/𝜆, and the approximate temperature rise between the side of the 17
cell and the cooling system is (𝛥𝑇∞) ≈ �̇�𝑙/ℎ. These temperature increments are additive, and 18
in both cases as the length scale of the system increases the temperature increment will 19
increase. 20
21
5.4. Lithium-ion systems 22
5.4.1 Risks associated with batteries 23
Electrochemical energy storage is a safety concern because the technology is evolving 24
rapidly at the same time applications are growing rapidly. The issue is primarily related to the 25
increased energy density and reactivity of recent technologies, in particular lithium and sodium-26
based technologies, and a lack of familiarity with the changing hazards associated with evolving 27
technologies. This is particularly true of lithium-ion cells [7], and the majority of recent work 28
addresses these systems. 29
With their relatively high energy density, lithium-ion batteries are highly desirable for energy 30
storage, but this brings challenges. First, the voltage window over which lithium operates is 31
such that aqueous electrolytes are infeasible and alkyl carbonate electrolytes are the norm. 32
Even with these electrolytes, passivation layers are required to reduce reactivity under normal 33
operating conditions, and at elevated temperatures the electrolyte reacts exothermically with 34
both the anode and cathode. Second, the energy density is high enough that the sudden 35
release of the stored energy can bring the battery system up to temperatures where these 36
reactions are dangerous, leading to thermal runaway. Finally, the electrolytes are flammable in 37
air and this can lead to dramatic fires when electrolyte venting during thermal runaway is 38
ignited. 39
While thermal runaway is a concern in most lithium ion batteries, there is a significant 40
impact from the specific cathode chemistry used by the batteries. Fig. 5-1 shows Accelerating 41

50
Rate Calorimetry (ARC) data that compares the thermal runaway events of various cathode 1
chemistries. This shows how higher chemistry cathode materials like LiCoO2 have more 2
significant runaway events compared to more stable materials like LiFePO4 (LFP). However, 3
there is also a price paid in energy density of these materials as well. 4
5 Fig. 5-1 Comparison of normalized thermal runaway curves comparing various li-ion chemistries 6
collected using Accelerating Rate Calorimetery 7
While individual cell reliability is very high, generally exceeding six-sigma quality levels, the 8
assembly of a large number of cells into module, packs and systems to provide large scale 9
storage provides a situation where the probability of a single failure is non-negligible. With the 10
value of system-scale investments being significant, it is important to design systems to detect 11
incipient failure early and to be robust against these single point failures increases. 12
A challenge in system design exists because small variations in batteries across a coupled 13
system can be exacerbated through operation. A cell that has an initial reduced capacity due to 14
some variation may cycle at a deeper effective depth of discharge if it is connected to a single 15
battery management system. Since other cells in the pack can take up small differences during 16
cycling, it is difficult for the BMS to detect these variations. Operating at higher depths of 17
discharge tends to accelerate cell aging, leading to a faster capacity loss. When this occurs, the 18
cells become progressively imbalanced in their capacity. This can lead to overcharging or over 19
discharging of cells that can lead to failure of individual cells. 20
21
5.4.2 Classification of failures 22
Field failures of lithium ion batteries have been well documented due to their prolific use in 23
consumer electronic devices. Catastrophic failures of lithium ion batteries most dramatically 24
entered the public eye in 2006 when incidents of laptop battery fires led to a widespread and 25
costly recall, however even by that point the potential issues surrounding lithium ion batteries 26

51
were known and anecdotal evidence abounded concerning the overheating of small cell phone 1
batteries. Because of this, safety testing has traditionally focused on the response of small 2
single cells, with the greatest concern being the potential outcome of a spontaneous field 3
failure. 4
Abusive failures, in contrast to field failures, happen not during normal operation of a cell or 5
battery, but due to the application of conditions outside the normal operating range of the 6
battery. These can come from a variety of sources, but can generally be categorized into 7
electrical, thermal and mechanical abusive conditions. Examples of abusive conditions can 8
include (but are not limited to) an external short circuit, overcharge or overvoltage of a cell, 9
overheating of a cell, and mechanical crushing. Multiple test procedures have been developed 10
to characterize how cells and batteries might respond to abusive conditions. [8-11] 11
Historically battery abuse testing results for lithium ion batteries have been looked at 12
somewhat skeptically, reasoning that in small consumer electronic devices that 1) abusive 13
failure was unlikely and 2) that any failure that did occur would be limited to the device and its 14
most immediate surroundings. The use of lithium ion batteries outside of small devices is 15
changing this view, however. The use of large stationary storage platforms introduce new 16
questions. How might these devices perform during a building fire? How would the system 17
respond if a spontaneous field failure were to occur in a single cell and cascade to other cells 18
within the system? 19
20
5.4.3 Criteria for initial failure 21
Experience with field failures in consumer electronics has led to significant improvements in 22
reliability against manufacturing defects and other issues that might lead to failure within the 23
normal operating parameters. However, the gradual development of short circuits is a rare 24
possibility. It is important to identify these developing hazards before they become an issue, 25
and research and development efforts are underway to develop diagnostics that will detect 26
incipient cell failure. 27
Batteries will generally be defined with a maximum operating temperature that is set to 28
prevent long term degradation. At still higher temperatures batteries can undergo 29
thermochemical processes that release some of the stored energy. Depending on the system, 30
this can be a separator failure that leads to the release of stored energy through an internal 31
short circuit associated with separator failure. Separator failure will lead to the release of the 32
stored energy at a rate determined by the resistance of the internal short circuit. Separator 33
failure depends on the material used, but typical separators used in lithium-ion batteries are 34
designed to shutdown at temperatures in the vicinity of 130 C to prevent an external short 35
circuit from leading to thermal runaway, while the materials themselves soften and can fail at 36
temperatures above 160 C [12-14] 37
Other separator failures or inadvertent internal short circuits can also lead to heat release 38
and be the initiating event. If the short circuit resistance is small, the heating will be rapid and 39
the temperature rise is basically the ratio of the stored energy to the heat capacity of the 40
system, or 𝛥𝑇𝑠 ≈ 𝐸/𝑚𝑐𝑝; here E is the stored energy and mcp is the product of the mass and 41

52
the specific heat of the system. For many systems with aqueous electrolytes the combined 1
thermal capacity of water and the lower energy density of those systems can reduce dangerous 2
temperature excursions, and hazards like hydrogen generation through side reactions become 3
the concern. If the stored energy discharge is less fast because the resistance of the internal 4
short circuit is not small, then cooling to the environment or to the thermal management 5
system will reduce the temperature rise to one below the limit give above. In this case the 6
heating is closer to that given above in our discussion regarding the effect of scale on heat 7
dissipation: (𝛥𝑇∞) ≈ �̇�𝑙/ℎ. As noted above, �̇� is the volumetric power generated internally by 8
a short circuit, h is the effective heat transfer coefficient to the cooling system or environment 9
and l is the characteristic length scale for the system between cooling surfaces. In general, the 10
lower of the estimated temperature rises (𝛥𝑇𝑠) 𝑎𝑛𝑑 (𝛥𝑇∞) will be the relevant one. 11
This temperature rise described in the previous paragraph is very approximate, and can be 12
refined with detailed numerical simulations. Such simulations are straightforward using 13
modern finite-element thermal modeling programs given assumptions about the short circuit 14
rate of heating (i.e. an assumed internal short circuit resistance) [15]. However, the actual 15
resistance of an internal short circuit is generally unknown, so estimates for heating as given 16
above can be sufficient. Lower bounds on the internal resistance can be estimated from the 17
cell performance itself; for a hard short circuit the actual cell internal resistance can be the 18
limiting resistance. Fortunately, hard short circuits like this are most likely in mechanical abuse 19
scenarios that seem less probably in grid energy storage when compared to energy storage for 20
vehicles or consumer electronics. For example, a nail puncture test is commonly considered as 21
highly relevant for these vehicles and to some degree consumer devices and can result in short 22
circuits with low internal resistances. 23
For lithium-ion systems, exothermic reactions described above can also occur. A summary 24
of the processes is provided in [16]. Calorimetry measurements like those shown in Figure 6-1 25
have been made [16-20] and these can be translated into thermal sources [21-23]. The 26
question of whether thermal runaway will occur depends on whether the heat release rates for 27
a cell will exceed the heat losses. Since rates for chemical decomposition reactions generally 28
increase strongly with temperature (following an Arrhenius form) there is generally an ignition 29
temperature above which thermal runaway will occur. One characteristic test that can identify 30
the thermal runaway condition is referred to as an oven test; a cell is placed in a heated 31
environment and the temperature at which the cell goes into runaway is identified. This 32
provides a representative temperature at which runaway will occur, and systems should be 33
designed to avoid temperature excursions of this magnitude. 34
For most lithium-ion systems in use today, the limiting reactions that determine whether 35
thermal runaway will occur are reactions between the cathode and the electrolyte. This is true 36
of most metal oxides of the form LiMO2 including the LiCoO2 and the mixed metal oxides where 37
M is a combination of nickel, cobalt, manganese or aluminum. For most of these materials 38
thermal runaway will occur for temperatures above a critical value that ranges from around 150 39
C to the low 200’s C. Lower heat losses that might occur in larger grid-scale storage systems 40
might lead to lower temperatures for thermal runaway as discussed in the section Effects of 41

53
Scale, above. Lithium-ion chemistries based on LiFePO4 cathodes are an exception to cathode 1
driven thermal runaway. 2
For LiFePO4 the cathode-electrolyte reaction seems to be negligible, reducing somewhat the 3
total heat release but mostly reducing the rate of heat release, as reflected in the curve for 4
LiFePO4 cathodes in Figure 5-1. Heat release associated with lithium in the anode reacting with 5
the electrolyte does still occur in LiFePO4 batteries and any stored energy can be discharged 6
through a short circuit if the cell separator fails. Fortunately, the reaction rates between the 7
anode and the electrolyte are limited, probably by the SEI layer, especially for temperatures up 8
to around 200oC. 9
The prevalence of the cathode heat release around 150 to 200oC in determining the 10
occurrence of thermal runaway has led past calorimetry studies to focus on that cathode-11
electrolyte system and in that temperature range. The increasing interest in LiFePO4 batteries 12
and also the needs to better understand high temperature heat release rates needed to 13
understand cascading failure discussed in the next section has led to recent work at Sandia better 14
characterizing the anode-electrolyte reaction. Recent results considering a range of 15
experimental measurements both at Sandia [24], from the Bar-Ilan University group [25] among 16
others suggest that the anode reaction rates are strongly dependent on the anode particle 17
surface characteristics and the probably breakdown of passivation layers at higher temperatures. 18
A newly developed model has had some success in matching a wider range of calorimetry 19
measurements; some results using this new model are shown in Figure 5-2 [26]. There model 20
predictions are compared with selected differential scanning calorimetry measurements 21
available in the literature beyond those for which the original model by the Dahn group was 22
developed [20, 23]. Accounting for the area dependence seems to allow a better prediction of 23
the heat release occurring below 200 C while the incorporation of a model for the breakdown of 24
the passivation layers allows a prediction of the spike in heat release rates observed above 200oC. 25
While the original model set assembled by the Dahn group [22] has been exceptionally useful for 26
initial thermal runaway in the LiCoO2 system, the evolution of technology to new material 27
systems necessitates a revisiting of the models and an extension to more general capabilities as 28
is underway. 29
30
31

54
1 Fig. 5-2 Anode + electrolyte DSC data from Sandia [24]and Bar-Ilan University [25] compared to the 2
original anode model (brown dotted line) [27] and to the proposed revision incorporating surface area 3
effects (red dashed line) and the extension of this model to account for higher temperature breakdown 4
of the SEI layer (green dashed line) from [26]. The SEI decomposition step (small peak at 100 C) has 5
been neglected for simplicity for both models shown. 6
5.5. Criteria for cascading propagation 7
To date, much research on safety has focused on preventing the initial thermal runaway. 8
While this is an important objective, the possibility of a thermal runaway, including from 9
external sources, does exist and some limited work has addressed cascading failure from a 10
single cell to a larger number of cells. This is a significant concern for large-scale storage 11
systems since the cost of a complete facility is orders of magnitude greater than the cost a 12
single cell failures. 13
Fig. 5-3 [28] shows how a single cell failure can propagate through a module or pack. In this 14
test, a nail penetration failure was used to fail a single cell within a 5 cell series string (5S1P). 15
The initial runaway is severe enough and the cells in close enough thermal contact to trigger 16
thermal runaway in neighboring cells, which in turn triggers the next cells in the pack eventually 17
consuming the entire battery over the course of several minutes. This both increases the 18
intensity and prolongs the duration of the failure. 19
Some measurements of thermal runaway propagation from cell to cell have been 20
conducted recently [29, 30], but the analysis of these results is still in its early stages. The 21
authors here will draw on premixed flame propagation theory to interpret the results. This 22
theory suggests that the propagation speed, s, for an exothermic reacting front can be 23
estimated as 𝑠 ≈ √𝜔/𝛼; here is the heat release rate in units of inverse time and is the 24
effective thermal diffusivity of the pack [31]. The heat release rate is not well measured under 25
higher temperature conditions characteristic of cascading propagation, and this is a current 26
research challenge. The role of thermal properties is easier to identify, though. The cited 27
measurements show that the heat transfer between cells plays an important role in inhibiting 28
propagation [27, 28]. For example, an air gap that might exist between packs of cylindrical cells 29
can, in some of the measured scenarios, prevent cascading failure. This can be understood by 30

55
the reduction in the thermal diffusivity through the air gap that slows the propagation and heat 1
release, giving time for heat dissipation to occur. Heat dissipation cooling the system will 2
reduce the rates of propagation further because the heat release rates, while not quantitatively 3
known generally increase strongly with temperature. The fact that reasonable configurations 4
lead to a failure to propagate suggests that this problem is surmountable with some additional 5
research. Other configurations with less of an air gap, for example with pouch cells closely 6
packed, are more prone to propagation [29, 30]. 7
8 Fig. 5-3 Failure behavior of a 5 cell series (5S1P) pack after failing the central cell in the stack. This test 9
was performed on 3 AH LiCO2 cathode pouch cells. For more detail please see Lamb et al. [28] 10
A topic of current investigation is the role of the heat capacity in mitigating propagation 11
since the heat capacity occurs in the denominator of the thermal diffusivity. Increasing the 12
heat capacity is expected to reduce propagation rates and lead to a failure to propagate with a 13
modest increase in heat capacity as has been observed in some recent experimental work at 14
Sandia. In grid scale storage systems, if battery packs can be thermally connected to structural 15
systems that might provide additional heat capacity, this might provide a beneficial increment 16
in safety, though quantitative numbers are still to be determined through additional research. 17
Some of these aspects have been investigated recently by the authors through computational 18
models, though validation is still ongoing [32]. 19
Another factor that will be significant in large-scale energy storage systems is the electrical 20
connectivity of cells in the pack. When cells are connected in a manner that allows energy from 21
multiple cells to discharge through a failed cell, as when cells are connected in parallel without 22
any other protection, lead to more severe failure [29]. 23
24

56
5.6. General battery hazards and other chemistries 1
All forms of stored energy create a potential hazard if that energy is discharged in an 2
uncontrolled fashion. This is of particular concern with batteries, as there is no way to fully 3
remove the stored energy in a charged electrochemical cell other than the discharge of said 4
energy. Stranded energy is a specific problem created when a system is damaged beyond the 5
point of operability, but individual cells within the battery still hold significant stored energy. 6
This creates a stored energy hazard that will be continually present within the damaged system. 7
Typically, this hazard is largely unmitigated for low voltage batteries, due to the limited hazard 8
posed by low voltage systems. Electric vehicle and stationary storage systems, however, may be 9
capable of hundreds of volts or more. The presence of uncontrolled high voltage increases the 10
risks related to arcing (described more fully below). 11
Some aqueous cell chemistries are subject to hydrogen evolution. Hydrogen is particularly 12
hazardous because of its wide flammability limits and the likelihood that a deflagration will 13
transition into a detonation. Hydrogen evolution is well-known in lead-acid cells. Valve-14
regulated lead-acid cells are constructed in a way that hydrogen evolution is mitigated through 15
subsequent reaction with oxygen within the system. This has significantly improved the safety 16
of lead-acid systems when they are properly installed and operated. 17
18
5.7. Risk assessment of arcing 19
The potential arcing hazards of DC is a mounting concern with the recent development of 20
battery storage system, electric vehicles, DC tracking system, photovoltaic arrays, and DC buses. 21
Though the first commercially operation DC system was established in 1882, modeling and 22
testing for DC arc hazard assessment have been limited. Table 1 summaries four common DC 23
arc models used to estimate the DC arc flash in power systems, where Varc is arcing voltage in 24
volts, Ibf is bolted fault current in kilo-amperes, Iarc is arcing current in amperes for (2) and kilo-25
amperes for (3), and L and G are the gap width in millimeters and inches respectively. The 26
typical DC arc test circuit and equivalent circuit are shown in Fig. 5-4, where L represents the 27
gap width between two electrodes. The detail review of these DC arc models can be found in 28
[33]. 29
L
R
Varc
Iarc
+
-
V
Source Resistance, Rs
Varc
Iarc
+
-
RarcSource Voltage, Vs
(a) DC arc test circuit (b) DC equivalent circuit 30

57
Fig. 5-4 DC arc test circuit and equivalent circuit [34]. 1
2
The theoretical mode, referred by the latest National Fire Protection Associate (NFPA) 3
standard 70E [34], is derived based on the maximum power transfer theorem, which may 4
provide an arc flash estimation on the relative conservative side. Besides, this model cannot be 5
used with nonlinear systems such as photovoltaic (PV) systems due to its nonlinear I-V 6
characteristics [35]. 7
Ammerman’s DC arc model, the mathematical model of Stoke and Oppenlander [36], is also 8
cited by the latest NPFA 70E 2015 edition. It can be considered as the most complete DC arc 9
model because it covers broader ranges and provides more accurate estimations than other DC 10
arc models. Similarly to other DC arc models, Ammerman’s DC arc model considers arcing 11
voltage to have almost linear relationship with gap width; however, practically, the arcing 12
voltage is determined by the arc length [37-39]. A commercial software package [40], mainly for 13
AC arc analysis, has been modified to include DC arc study based upon the assumption that it 14
exists 1D temperature field inside the arc and using finite difference method to solve electric 15
field and temperature. Its results were verified based on arc flash tests performed in Bruce 16
Power [40]. However. The 600-V open air DC arc model is derived based on 125V and 250V DC 17
systems [41]. 18
In order to provide more accurate estimations of DC arc flash in modern power systems, a 19
new DC arc model is necessary to overcome the limitations of previous models. Recently, 20
researches have been performed by using Code Saturne® to simulate the DC electric arc to 21
develop a new model based on the 3D Magnetohydrodynamic (MHD) modeling of a DC electric 22
arc [42-45]. 23 Table 5-1 Commonly used DC Arc Models 24
DC Arc Model Description
Theoretical Model [42,43] 0.5
0.5
arc s
arc bf
V V
I I
(1)
Ammerman’s Model [44] 0.12(20 0.534 )arc arcV L I (2)
Commercial Software [40] A commercial software, verified by Bruce Power arc flash tests
600-V open air [42] 0.10930.89270.9063 0.1051 ( 1)bfI
arc bfI I e G (3)
3D Magnetohydrodynamic (MHD) DC electric arc model [49]
1.238 0.154(13.11 0.287 )arc arcV L I (4) 1.238 0.846(13.11 0.287 )arc arcR L I
25
26 27

58
References: 1
[1] U. Irfan, "Battery Fires Pose New Risks to Firefighters," in ClimateWire, ed. 2
http://www.scientificamerican.com/article/battery-fires-pose-new-risks-to-firefighters/ 3
Scientific American, 2015. 4
[2] J. Ferguson, "APS fire probed," ed. http://azdailysun.com/news/local/aps-fire-5
probed/article_1de2e924-ab0a-5e71-9a3a-6942c2d1c9bb.html Arizona Daily Sun, 2013. 6
[3] NGKinsulators, "Cause of NAS Battery Fire Incident, Safety Enhancement Measures and 7
Resumption of Operations," ed. http://www.ngk.co.jp/english/news/2012/0607.html, 8
2012. 9
[4] J. L. Ehasz and K. Paul, "Taum Sauk Upper Reservoir Failure: Report On Technical 10
Reasons for the Breach," ed. https://www.bpa.gov/power/PG/NW-HydroOperators-11
Forum/Materials/CaseStudyT-Sauk_Ehasz-Paul.pdf: Bonneville Power Administration, 12
2006. 13
[5] M. Broussely, P. Biensan, F. Bonhomme, P. Blanchard, S. Herreyre, K. Nechev, et al., 14
"Main aging mechanisms in Li ion batteries," J. Power Sources, vol. 146, pp. 90-96, Jul 15
2005. 16
[6] S. T. Myung, F. Maglia, K. J. Park, C. S. Yoon, P. Lamp, S. J. Kim, et al., "Nickel-Rich 17
Layered Cathode Materials for Automotive Lithium-Ion Batteries: Achievements and 18
Perspectives," Acs Energy Letters, vol. 2, pp. 196-223, Jan 2017. 19
[7] B. Scrosati and J. Garche, "Lithium batteries: Status, prospects and future," Journal of 20
Power Sources, vol. 195, pp. 2419-2430, May 1 2010. 21
[8] S. International, "Recommended Practices (RP) for Shipping Transport and Handling of 22
Automotive-Type Battery System - Lithium Ion," vol. J2950, ed: SAE International, 2012. 23
[9] S. International, "Electric and Hybrid Electric Vehicle Rechargeable Energy Storage 24
System (RESS) Safety and Abuse Testing," vol. J2464, ed: SAE International, 2009. 25
[10] D. H. Doughty and C. C. Crafts, "FreedomCAR Electrical Energy Storage System Abuse 26
Test Manual for Electric and Hybrid Electric Vehicle Applications," Sandia National 27
Laboratories, Albuquerque, NM2006. 28
[11] U. Laboratories, "EESAs for light electric vehicle (LEV) applications," vol. UL 2271, ed. 29
[12] C. J. Orendorff, "The role of separators in lithium-ion cell safety," Electrochemical 30
Society Interface, vol. 21, pp. 61-6565, Summer 2012. 31
[13] P. Arora and Z. M. Zhang, "Battery separators," Chemical Reviews, vol. 104, pp. 4419-32
4462, Oct 2004. 33
[14] P. G. Balakrishnan, R. Ramesh, and T. P. Kumar, "Safety mechanisms in lithium-ion 34
batteries," J. Power Sources, vol. 155, pp. 401-414, Apr 21 2006. 35
[15] G.-H. Kim, A. Pesaran, and R. Spotnitz, "A three-dimensional thermal abuse model for 36
lithium-ion cells," J. Power Sources, vol. 170, pp. 476-489, Jul 10 2007. 37
[16] E. P. Roth, C. C. Crafts, D. H. Doughty, and J. McBreen, "Advanced Technology 38
Development Program for Lithium-Ion Battereis: Thermal Abuse Performance of 18650 39
Li-Ion Cells, SAND2004-0584.," Sandia National Laboratories2004. 40

59
[17] D. D. MacNeil, L. Christensen, J. Landucci, J. M. Paulsen, and J. R. Dahn, "An autocatalytic 1
mechanism for the reaction of LixCoO2 in electrolyte at elevated temperature," J. 2
Electrochem. Soc., vol. 147, pp. 970-979, Mar 2000. 3
[18] D. D. MacNeil and J. R. Dahn, "The reaction of charged cathodes with nonaqueous 4
solvents and electrolytes - II. LiMn2O4 charged to 4.2 V," J. Electrochem. Soc., vol. 148, 5
pp. A1211-A1215, Nov 2001. 6
[19] D. D. MacNeil and J. R. Dahn, "The reactions of Li0.5CoO2 with nonaqueous solvents at 7
elevated temperatures," J. Electrochem. Soc., vol. 149, pp. A912-A919, Jul 2002. 8
[20] M. N. Richard and J. R. Dahn, "Accelerating rate calorimetry study on the thermal 9
stability of lithium intercalated graphite in electrolyte I. Experimental," J. Electrochem. 10
Soc., vol. 146, pp. 2068-2077, Jun 1999. 11
[21] R. M. Spotnitz, J. Weaver, G. Yeduvaka, D. H. Doughty, and E. P. Roth, "Simulation of 12
abuse tolerance of lithium-ion battery packs," J. Power Sources, vol. 163, pp. 1080-1086, 13
Jan 2007. 14
[22] T. D. Hatchard, D. D. MacNeil, A. Basu, and J. R. Dahn, "Thermal model of cylindrical and 15
prismatic lithium-ion cells," J. Electrochem. Soc., vol. 148, pp. A755-A761, Jul 2001. 16
[23] M. N. Richard and J. R. Dahn, "Accelerating rate calorimetry study on the thermal 17
stability of lithium intercalated graphite in electrolyte II. Modeling the results and 18
predicting differential scanning calorimeter curves," J. Electrochem. Soc., vol. 146, pp. 19
2078-2084, Jun 1999. 20
[24] E. P. Roth and D. H. Doughty, "Thermal abuse performance of high-power 18650 Li-ion 21
cells," Journal of Power Sources, vol. 128, pp. 308-318, Apr 2004. 22
[25] O. Haik, S. Ganin, G. Gershinsky, E. Zinigrad, B. Markovsky, D. Aurbach, et al., "On the 23
Thermal Behavior of Lithium Intercalated Graphites," Journal of the Electrochemical 24
Society, vol. 158, pp. A913-A923, 2011. 25
[26] R. Shurtz and J. C. Hewson, "Modeling Thermochemical Sources for a Broader Range of 26
Materials and Conditions, SAND2017-5671 C," in 231st Electrochemical Society Meeting, 27
New Orleans, LA, 2017. 28
[27] T. D. Hatchard, D. D. MacNeil, A. Basu, and J. R. Dahn, "Thermal model of cylindrical and 29
prismatic lithium-ion cells," Journal of the Electrochemical Society, vol. 148, pp. A755-30
A761, Jul 2001. 31
[28] J. Lamb, C. J. Orendorff, L. A. M. Steele, and S. W. Spangler, "Failure propagation in 32
multi-cell lithium ion batteries," Journal of Power Sources, vol. 283, pp. 517-523, Jun 1 33
2015. 34
[29] J. Lamb, C. J. Orendorff, L. A. M. Steele, and S. W. Spangler, "Failure propagation in 35
multi-cell lithium ion batteries," J. Power Sources, vol. 283, pp. 517-523, Jun 2015. 36
[30] C. F. Lopez, J. A. Jeevarajan, and P. P. Mukherjee, "Experimental Analysis of Thermal 37
Runaway and Propagation in Lithium-Ion Battery Modules," Journal of the 38
Electrochemical Society, vol. 162, pp. A1905-A1915, 2015. 39
[31] F. A. Williams, Combustion Theory. Menlo Park, CA: Addison-Wesley, 1985. 40

60
[32] R. Shurtz and J. C. Hewson, "Modeling Thermal Runaway in Li-ion Packs as a Function of 1
Scale and Heat Source, SAND2017-5670C," in 231st Electrochemical Society Meeting, 2
New Orleans, LA, 2017. 3
[33] T. Gammon, W. J. Lee, Z. Zhang, B. C. Johnson, “A review of commonly used DC arc 4
models,” IEEE Trans. Ind. Appl., vol. 51, no. 2, pp. 1398-1407, Mar./Apr. 2015. 5
[34] Standard for Electrical Safety in the Workplace, National Fire Protection 6
AssociationStandard 70E, 2015. 7
[35] K. Klement, “DC arc flash studies for solar photovoltaic systems: Challenges and 8
recommendations,” IEEE Trans. Ind. Appl., vol. 51, no. 5, pp. 4239-4244, Sep./Oct. 2015. 9
[36] A. D. Stokes and W. T. Oppenlander, “Electric arcs in open air,” J. Phys. D, Appl. Phys., 10
vol. 24, no. 1, pp. 26-35, Jan. 14, 1991. 11
[37] T. H. Lee, “Plasma physics and the interruption of an electric circuit,” Proceedings of the 12
IEEE, vol. 57, no. 3, pp. 307-323, Mar. 1969. 13
[38] H. Ayrton, The Electric Arc. London, U.K.: Electrician, 1902. 14
[39] C. P. Steinmetz, “Electric power into light, Section VI. The Arc,” Trans. Amer. Inst. Elect. 15
Eng., vol. 25, p. 802, 1906. 16
[40] User’s Guide for ARCPRO, Kinetrics, Toronto, ON, Canada, 2000. 17
[41] C. Keyes, C. Maurice, “DC arc hazard assessment phase II,” Kinetrics Inc. Report No., K-18
012623-RA-0002-R00, 2007. 19
[42] K. S. Y. Cheng, S. L. Cress, and D. J. Minini, “Arc hazard assessment for DC applications in 20
the transit industry,” in Proc. APTA Rail Conf., Boston, MA, USA, Jun. 12–15, 2011, pp. 1–21
7. 22
[43] D. R. Doan, “Arc flash calculations for exposures to DC systems,” IEEE Trans. Ind. Appl., 23
vol. 46, No. 6, pp. 2299-2302, Nov./Dec. 2010. 24
[44] R. Lee, “The other electrical hazard: Electrical arc blast burns,” IEEE Trans. Ind. Appl., vol. 25
IA-18, no. 3, pp. 246-251, May/Jun. 1982. 26
[45] R. F. Ammerman, T. Gammon, P. K. Sen, J. P. Nelson, “DC-Arc Models and Incident-27
Energy Calculations,” IEEE Trans. Ind. Appl., vol. 46, No. 5, pp. 1810-1819, Sep./Oct. 28
2010. 29
[46] A. Lebouvier, C. Delalondre, F. Fresnet, V. Boch, V. Rohani, F. Cauneau, L. Fulcheri, 30
“Three-dimensional unsteady MHD modeling of a low-current high-voltage 31
nontransferred DC plasma torch operating with air,” IEEE Trans. Plasma Sci. 39, pp. 32
1889-1899, 2011. 33
[47] C. Rehmet, V. Rohani, F. Cauneau, L. Fulcheri, “ 3D Unsteady State MHD Modeling of a 34
3-Phase AC Hot Graphite Electrodes Plasma Torch,” Plasma Chemistry and Plasma 35
Processing, vol. 33, Issue 2, pp. 491-515, Apr. 2013. 36
[48] Shiuan-Hau Rau, Zhenyuan Zhang, and Wei-Jen Lee, “3D Magnetohydrodynamic 37
Modeling of DC Arc in Power System”, IEEE Transactions on Industry Applications. 38
Volume: 52, No. 6, November/December 2016. Pp4549 – 4555. 39

61
[49] Shiuan-Hau Rau, Wei-Jen Lee, “DC Arc Model Based on 3D DC Arc Simulation”, IEEE 1
Transactions on Industry Applications. Volume: 52, No. 6, November/December 2016. 2
Pp5255 – 5261. 3
4

62
Appendix 1
Recommended Standards/Regulations/Government Policies* 2
3
Energy Storage System Components Standard
Molded-Case Circuit Breakers, Molded-Case Switches, and Circuit-Breaker Enclosures
UL 489
Electrochemical Capacitors UL 810A
Lithium Batteries UL 1642
Inverters, Converters, Controllers and Interconnection System Equipment for Use With Distributed Energy Resources
UL 1741
Batteries for Use in Stationary Applications UL 1973 4
Energy Storage System Type Standard
Stationary Energy Storage Systems with Lithium Batteries – Safety Requirements (under development)
IEC 62897
Flow Battery Systems For Stationary Applications – Part 2-2: Safety requirements
IEC 62932-2-2
Recommended Practice and Requirements for Harmonic Control in Electric Power Systems
IEEE 519
Standard for Interconnecting Distributed Resources with Electric Power Systems
IEEE 1547
Recommended Practice and Procedures for Unlabeled Electrical Equipment Evaluation
NFPA 791-2014
Outline for Investigation for Safety for Energy Storage Systems and Equipment
UL 9540
Modular Energy Storage Architecture (MESA) Standards Alliance
SunSpec
5 6
Energy Storage Installation Standard
Transportation Testing for Lithium Batteries UN 38.3
Safety of primary and secondary lithium cells and batteries during transport.
IEC 62281
Shipping, receiving and delivery of ESS and associated components and all materials, systems, products, etc. associated with the ESS installation.
DOT Regulations
Worker safety Federal and state OSHA
Competency of Third Party Field Evaluation Bodies NFPA 790

63
Fire and smoke detection NFPA 1, NFPA 101, NFPA 5000, IBC, IFC, state and local codes
Fire suppression NFPA 1, NFPA 13, NFPA 15, NFPA 101, NFPA 850, NFPA 851, NFPA 853, NFPA 5000, IBC, IFC, state and local codes
Fire and smoke containment NFPA 1, NFPA 101, NFPA 5000, IBC, IFC, state and local codes
Ventilation, exhaust, thermal management and mitigation of the generation of hydrogen or other hazardous or combustible gases or fluids
NFPA 1, IEEE/ASHRAE 1635, IMC, UMC, state and local codes
Egress (operating and emergency) NFPA 1, NFPA 101, NFPA 5000, IBC, IFC, state and local codes
Access (operating and emergency) NFPA 1, NFPA 101, NFPA 5000, IBC, IFC, state and local codes
Working space OSHA 29 CFR 1910.305(j)(7) and OSHA 29 CFR 1926.441 (if applicable), NFPA 70E, Article 320
Physical security NFPA 1, NFPA 101, NFPA 5000, IBC, IFC, state and local codes
Illumination (operating and emergency) NFPA 1, NFPA 101, NFPA 5000, IBC, IFC, state and local codes
Fire department access NFPA 1, NFPA 101, NFPA 5000, IBC, IFC, state and local codes
Anchoring and seismic protection NFPA 5000, IBC, state and local codes
Buildings, enclosures and protection from the elements IEC 60529, UL 96A, NFPA 5000, IBC, state and local codes
Signage ANSI Z535, IEEE C-2, NFPA 1, NFPA 70E, NFPA 101, NFPA

64
5000, IBC, IFC, state and local codes
Emergency shutoff IEEE C-2, NFPA 1, NFPA 101, NFPA 5000, IBC, IFC, state and local codes
Spill containment, neutralizing and disposal NFPA 1, IPC, UPC, IFC, IEEE1578, state and local codes
Electrical safety IEEE C-2 (National Electrical Safety Code), NFPA 70E, FM Global DS 5-10, DS 5-1, DC 5-19
Communications networks and management systems IEC 61850
1
Energy Storage Commissioning Standard
Recommended Practice for Commissioning of Fire Protection and Life Safety Systems
NFPA 3
Building and Systems Commissioning ICC 1000
2
Energy Storage Operations and Maintenance Standard
Hazardous materials storage, handling and use NFPA 400
Standard on Maintenance of Electrical Equipment NFPA 70B
3
Incident Preparedness Standard
Standard for Technical Rescuer Professional Qualifications NFPA 1006
Standard for Fire Fighter Professional Qualifications NFPA 1001
Standard for Fire Department Occupational Safety NFPA 1500
Standard System for the Identification of the Hazards of Materials for Emergency Response
NFPA 704
Guide for Substation Fire Protection IEEE 979
Fire Fighting EPCRA
Fire and Explosion Investigations NPFA 921
Fire Safety Concepts Tree NFPA 550
4
* The information of the appendix is mainly extracted from: David Rosewater, “Energy Storage 5
System Safety – Codes & Standards”, EMA Energy Storage Workshop, Singapore. August 2015 6


