46
1 Capacity Analysis Capacity Analysis CE 453 Lecture #14 CE 453 Lecture #14
| Date post: | 18-Dec-2015 |
| Category: |
Documents |
| Upload: | maud-dixon |
| View: | 217 times |
| Download: | 0 times |

11
Capacity AnalysisCapacity AnalysisCE 453 Lecture #14CE 453 Lecture #14
22
ObjectivesObjectives
Review LOS definition and determinantsReview LOS definition and determinants Define capacity and relate to “ideal” Define capacity and relate to “ideal”
capacitiescapacities Review calculating capacity using HCM Review calculating capacity using HCM
procedures for basic freeway sectionprocedures for basic freeway section Focus on relations between capacity, Focus on relations between capacity,
level-of-service, and designlevel-of-service, and design

33
Level of Service (LOS)Level of Service (LOS)
Concept – a qualitative measure Concept – a qualitative measure describing operational conditions within a describing operational conditions within a traffic stream and their perception by traffic stream and their perception by drivers and/or passengers drivers and/or passengers Levels represent range of operating Levels represent range of operating conditions defined by measures of conditions defined by measures of effectiveness (MOE)effectiveness (MOE)

44
LOS A (Freeway)LOS A (Freeway)
Free flow Free flow conditionsconditions
Vehicles are Vehicles are unimpeded in their unimpeded in their ability to maneuver ability to maneuver within the traffic within the traffic streamstream
Incidents and Incidents and breakdowns are breakdowns are easily absorbedeasily absorbed
55
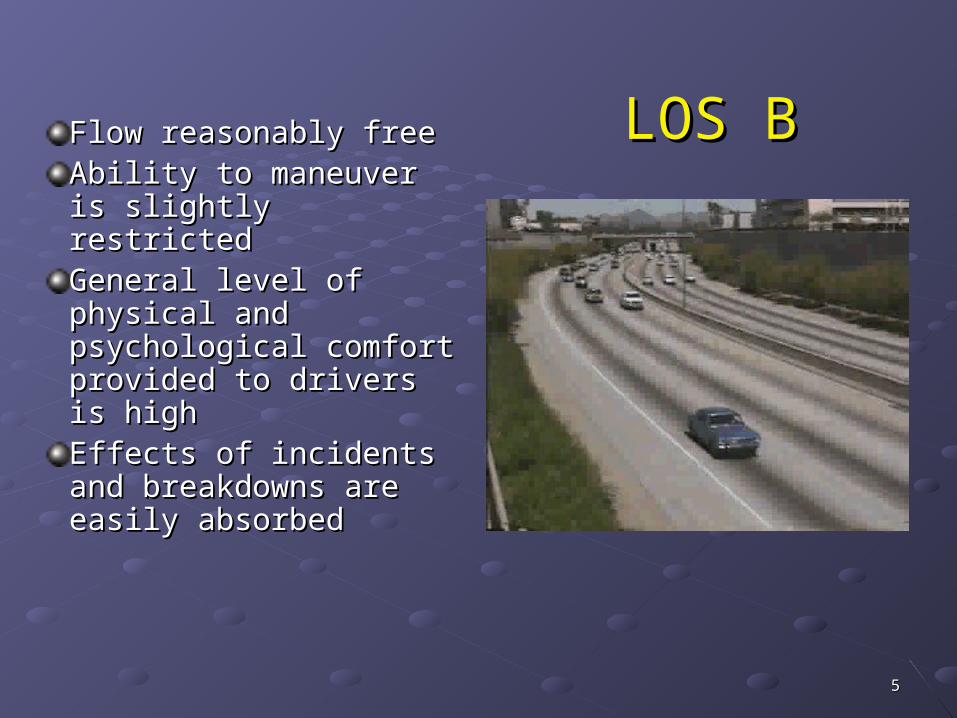
LOS BLOS BFlow reasonably freeFlow reasonably freeAbility to maneuver is Ability to maneuver is slightly restrictedslightly restrictedGeneral level of General level of physical and physical and psychological comfort psychological comfort provided to drivers is provided to drivers is highhighEffects of incidents and Effects of incidents and breakdowns are easily breakdowns are easily absorbedabsorbed

66
LOS CLOS CFlow at or near FFSFlow at or near FFSFreedom to maneuver Freedom to maneuver is noticeably restrictedis noticeably restrictedLane changes more Lane changes more difficultdifficultMinor incidents will be Minor incidents will be absorbed, but will absorbed, but will cause deterioration in cause deterioration in serviceserviceQueues may form Queues may form behind significant behind significant blockageblockage
77
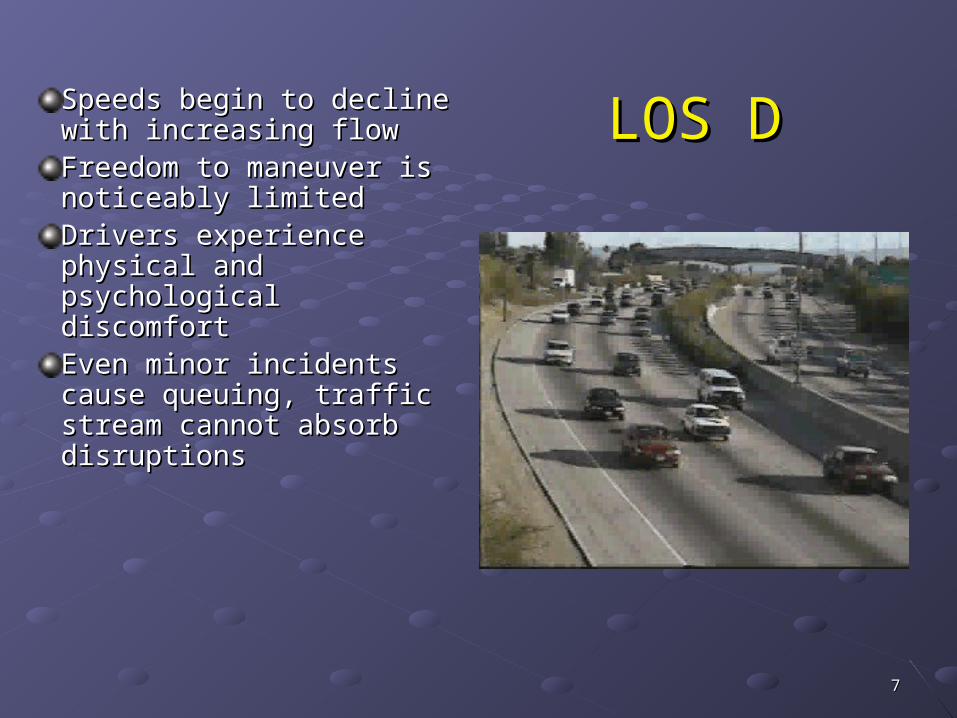
LOS DLOS DSpeeds begin to decline Speeds begin to decline with increasing flowwith increasing flowFreedom to maneuver Freedom to maneuver is noticeably limitedis noticeably limitedDrivers experience Drivers experience physical and physical and psychological psychological discomfortdiscomfortEven minor incidents Even minor incidents cause queuing, traffic cause queuing, traffic stream cannot absorb stream cannot absorb disruptionsdisruptions
88
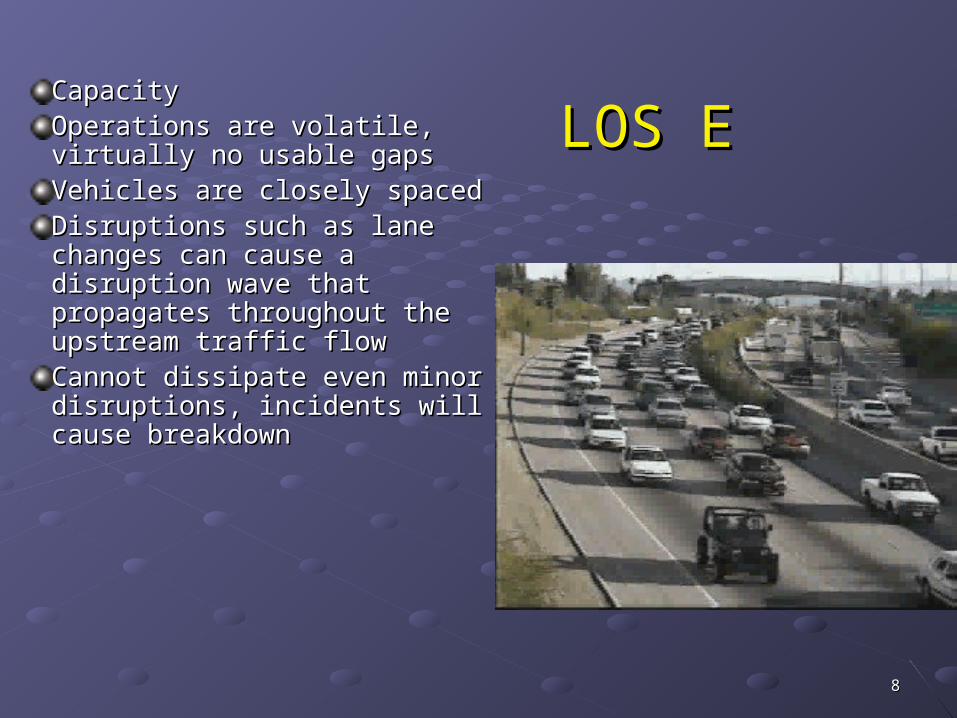
LOS ELOS ECapacityCapacityOperations are volatile, Operations are volatile, virtually no usable gapsvirtually no usable gapsVehicles are closely spacedVehicles are closely spacedDisruptions such as lane Disruptions such as lane changes can cause a changes can cause a disruption wave that disruption wave that propagates throughout the propagates throughout the upstream traffic flowupstream traffic flowCannot dissipate even Cannot dissipate even minor disruptions, incidents minor disruptions, incidents will cause breakdownwill cause breakdown

99
LOS FLOS FBreakdown or forced flowBreakdown or forced flowOccurs when:Occurs when: Traffic incidents cause a Traffic incidents cause a
temporary reduction in temporary reduction in capacitycapacity
At points of recurring At points of recurring congestion, such as merge congestion, such as merge or weaving segmentsor weaving segments
In forecast situations, In forecast situations, projected flow (demand) projected flow (demand) exceeds estimated exceeds estimated capacitycapacity

1010
Design Level of ServiceDesign Level of ServiceThis is the desired quality of traffic conditions from a This is the desired quality of traffic conditions from a driver’s perspective (used to determine number of driver’s perspective (used to determine number of lanes)lanes)
Design LOS is higher for higher functional classesDesign LOS is higher for higher functional classes Design LOS is higher for rural areasDesign LOS is higher for rural areas LOS is higher for level/rolling than mountainous LOS is higher for level/rolling than mountainous
terrainterrain Other factors include: adjacent land use type and Other factors include: adjacent land use type and
development intensity, environmental factors, development intensity, environmental factors, and aesthetic and historic valuesand aesthetic and historic values
Design all elements to same LOS (use HCM to Design all elements to same LOS (use HCM to analyze)analyze)

1111
Design Level of Service Design Level of Service (LOS)(LOS)

1212
Capacity – DefinedCapacity – Defined Capacity: Maximum Capacity: Maximum hourly ratehourly rate of of vehicles vehicles or persons or persons that can that can reasonably be expectedreasonably be expected to pass a point, to pass a point, or traverse a uniform section of or traverse a uniform section of lane or roadwaylane or roadway, during a specified , during a specified time period time period under under prevailing conditionsprevailing conditions (traffic and roadway)(traffic and roadway)
Different for different facilities (freeway, Different for different facilities (freeway, multilane, 2-lane rural, signals)multilane, 2-lane rural, signals)
Why would it be different? Why would it be different?
1313
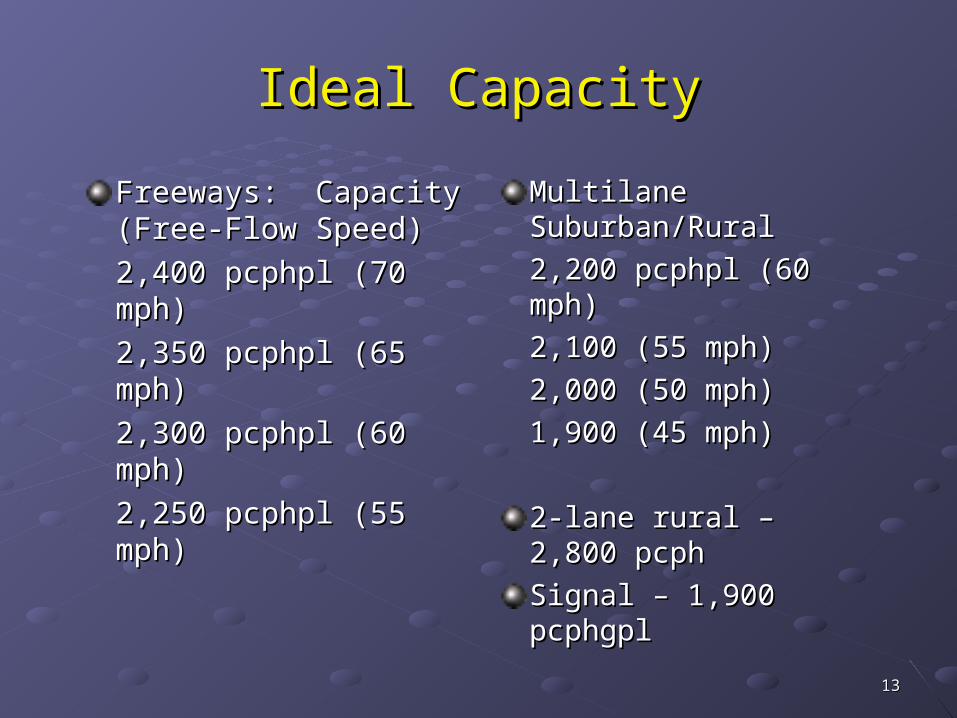
Ideal CapacityIdeal Capacity
Freeways: Capacity Freeways: Capacity (Free-Flow Speed)(Free-Flow Speed)
2,400 pcphpl (70 2,400 pcphpl (70 mph)mph)
2,350 pcphpl (65 2,350 pcphpl (65 mph)mph)
2,300 pcphpl (60 2,300 pcphpl (60 mph)mph)
2,250 pcphpl (55 2,250 pcphpl (55 mph)mph)
Multilane Multilane Suburban/RuralSuburban/Rural
2,200 pcphpl (60 2,200 pcphpl (60 mph)mph)
2,100 (55 mph)2,100 (55 mph)
2,000 (50 mph)2,000 (50 mph)
1,900 (45 mph)1,900 (45 mph)
2-lane rural – 2,800 2-lane rural – 2,800 pcphpcph
Signal – 1,900 Signal – 1,900 pcphgplpcphgpl

1414
Principles for Acceptable Principles for Acceptable Degree of Congestion:Degree of Congestion:
1.1. Demand <= capacity, even for short timeDemand <= capacity, even for short time
2.2. 75-85% of capacity at signals75-85% of capacity at signals
3.3. Dissipate from queue @ 1500-1800 vphDissipate from queue @ 1500-1800 vph
4.4. Afford some choice of speed, related to trip Afford some choice of speed, related to trip lengthlength
5.5. Freedom from tension, esp long trips, < 42 Freedom from tension, esp long trips, < 42 veh/mi.veh/mi.
6.6. Practical limits - users expect lower LOS in Practical limits - users expect lower LOS in expensive situations (urban, mountainous)expensive situations (urban, mountainous)
1515
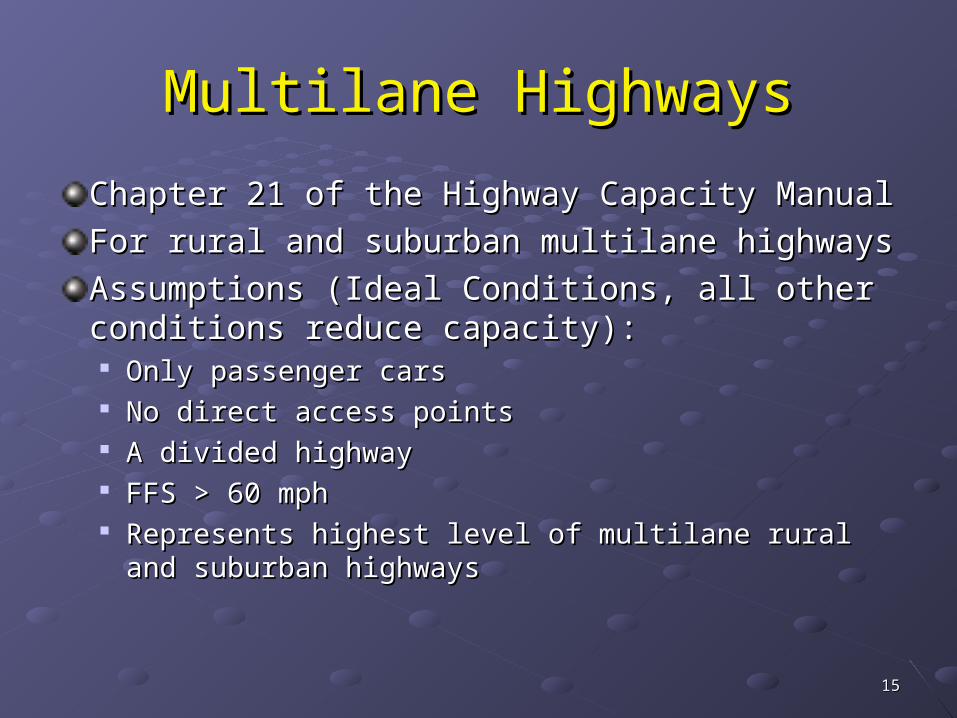
Multilane HighwaysMultilane Highways
Chapter 21 of the Highway Capacity ManualChapter 21 of the Highway Capacity Manual
For rural and suburban multilane highwaysFor rural and suburban multilane highways
Assumptions (Ideal Conditions, all other Assumptions (Ideal Conditions, all other conditions reduce capacity):conditions reduce capacity): Only passenger carsOnly passenger cars No direct access points No direct access points A divided highwayA divided highway FFS > 60 mphFFS > 60 mph Represents highest level of multilane rural and Represents highest level of multilane rural and
suburban highwayssuburban highways
1616
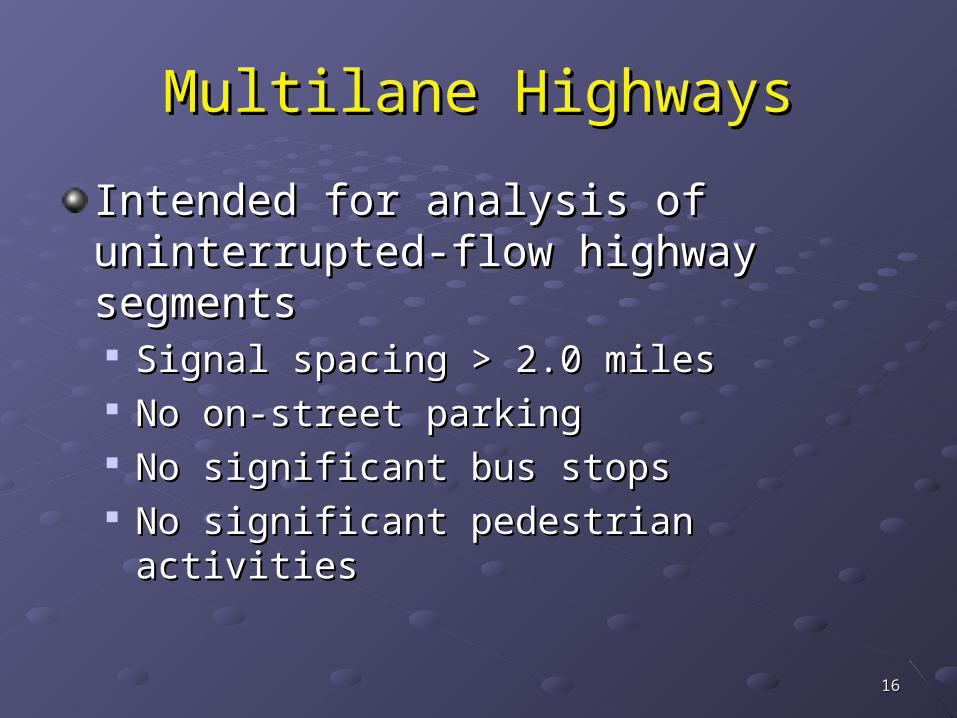
Multilane HighwaysMultilane Highways
Intended for analysis of Intended for analysis of uninterrupted-flow highway uninterrupted-flow highway segmentssegments Signal spacing > 2.0 milesSignal spacing > 2.0 miles No on-street parkingNo on-street parking No significant bus stopsNo significant bus stops No significant pedestrian activitiesNo significant pedestrian activities

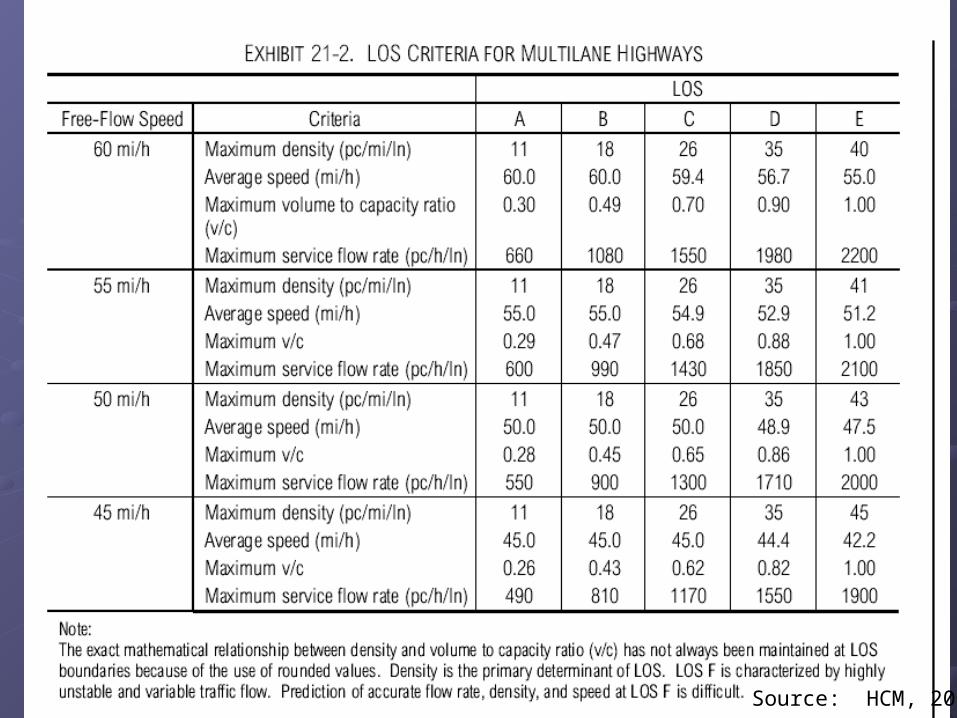
1717
Source: HCM, 2000

1818 Source: HCM, 2000
Step 1: Gather data
Step 2: Calculate capacity (Supply)
1919 Source: HCM, 2000
2020
Source: HCM, 2000
2121
Source: HCM, 2000
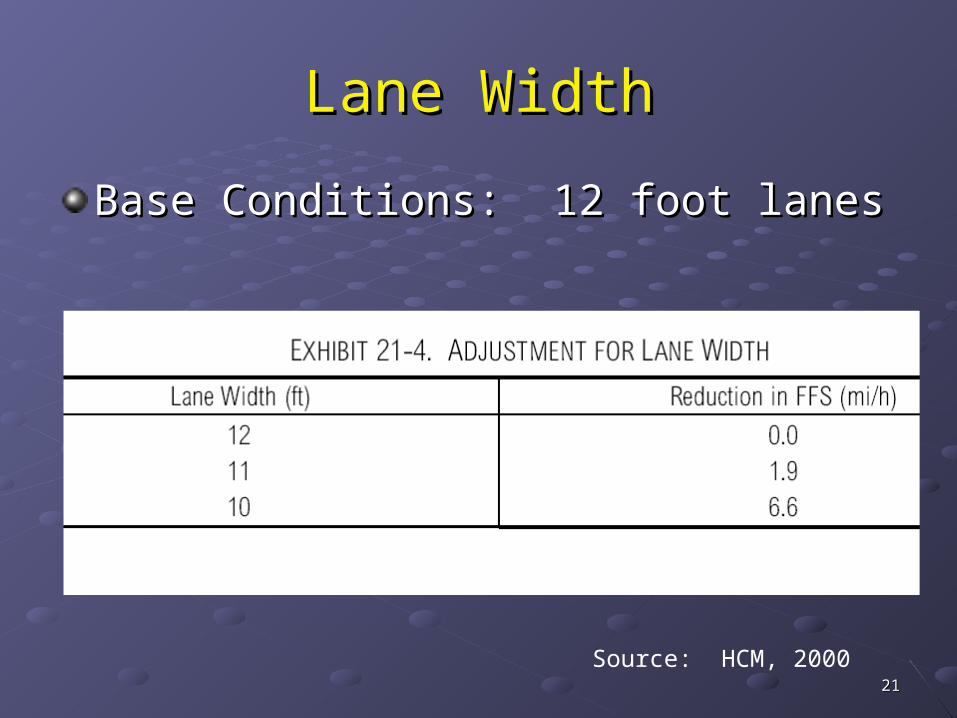
Lane WidthLane Width
Base Conditions: 12 foot lanesBase Conditions: 12 foot lanes

2222
Source: HCM, 2000
Lane Width (Example)Lane Width (Example)
How much does use of 10-foot lanes decrease free flow speed?
Flw = 6.6 mph
2323
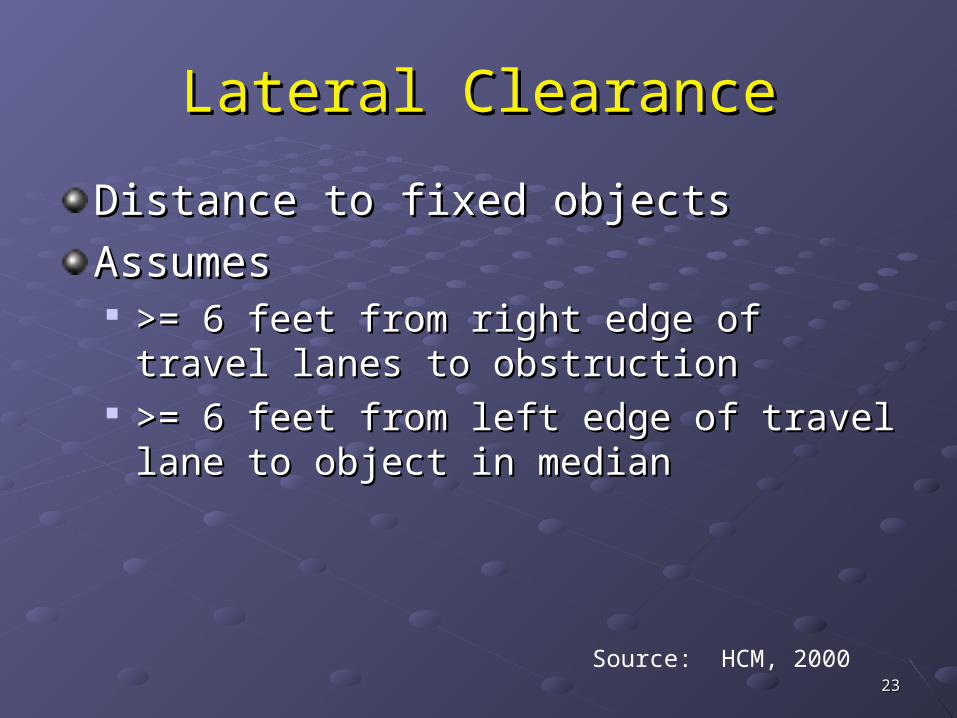
Lateral ClearanceLateral Clearance
Distance to fixed objectsDistance to fixed objects
AssumesAssumes >= 6 feet from right edge of travel lanes >= 6 feet from right edge of travel lanes
to obstructionto obstruction >= 6 feet from left edge of travel lane >= 6 feet from left edge of travel lane
to object in medianto object in median
Source: HCM, 2000
2424
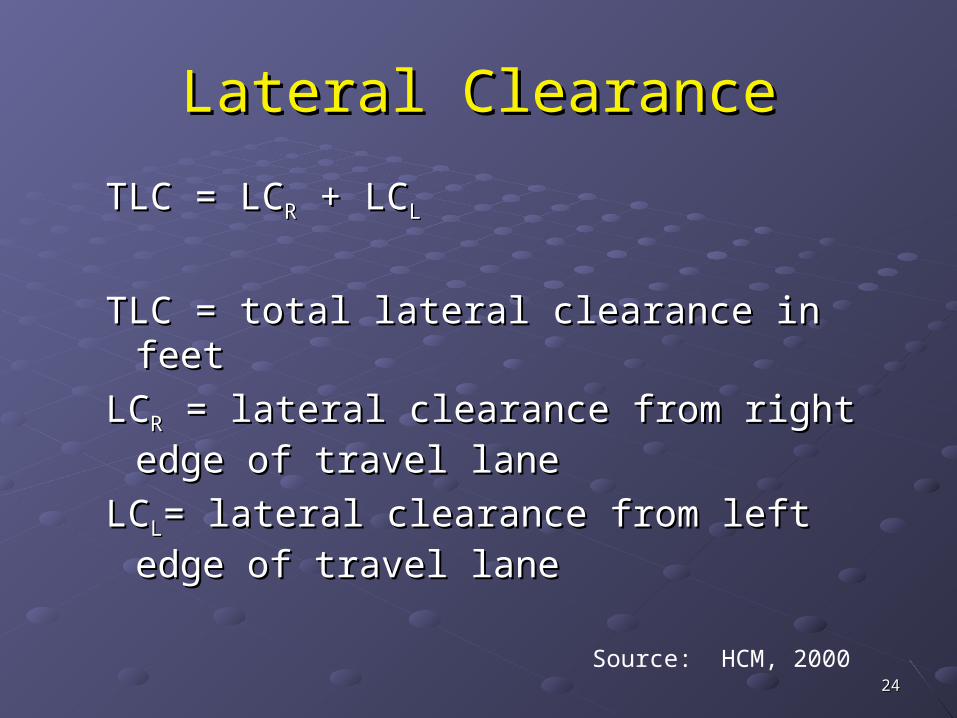
Lateral ClearanceLateral Clearance
TLC = LCTLC = LCRR + LC + LCLL
TLC = total lateral clearance in feetTLC = total lateral clearance in feet
LCLCRR = lateral clearance from right edge of = lateral clearance from right edge of travel lanetravel lane
LCLCLL= lateral clearance from left edge of = lateral clearance from left edge of travel lanetravel lane
Source: HCM, 2000

2525
Source: HCM, 2000

2626
Example: Calculate lateral clearance adjustment for a 4-lane divided highway with milepost markers located 4 feet to the right of the travel lane.
TLC = LCR + LCL = 6 + 4 = 10
Flc = 0.4 mph Source: HCM, 2000
2727
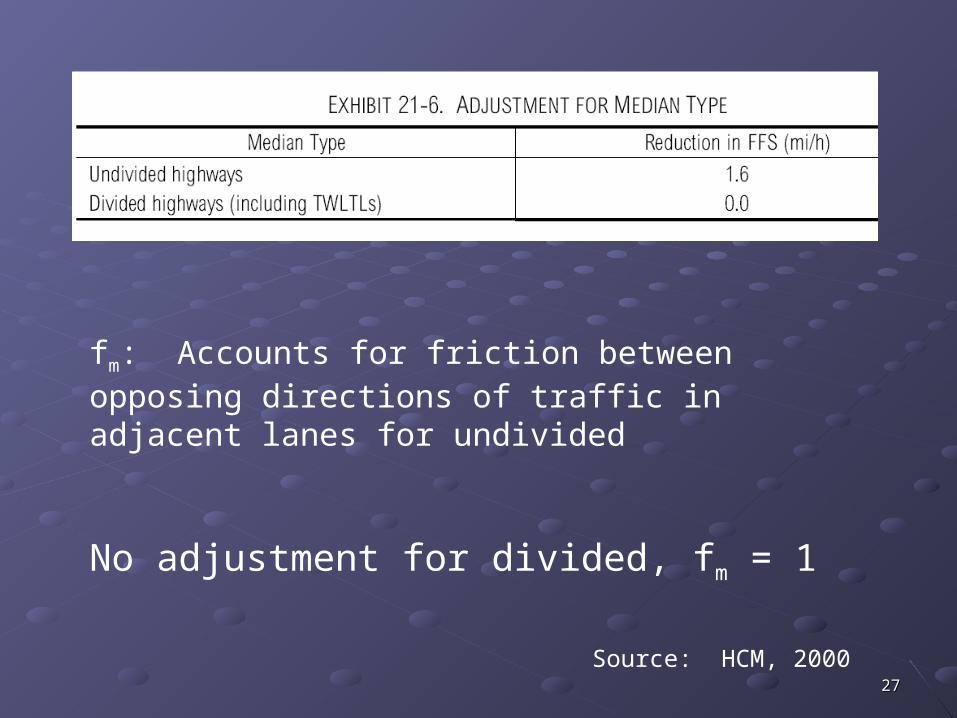
fm: Accounts for friction between opposing directions of traffic in adjacent lanes for undivided
No adjustment for divided, fm = 1
Source: HCM, 2000

2828
Fa accounts for interruption due to access points along the facility
Example: if there are 20 access points per mile, what is the reduction in free flow speed?
Fa = 5.0 mph

2929
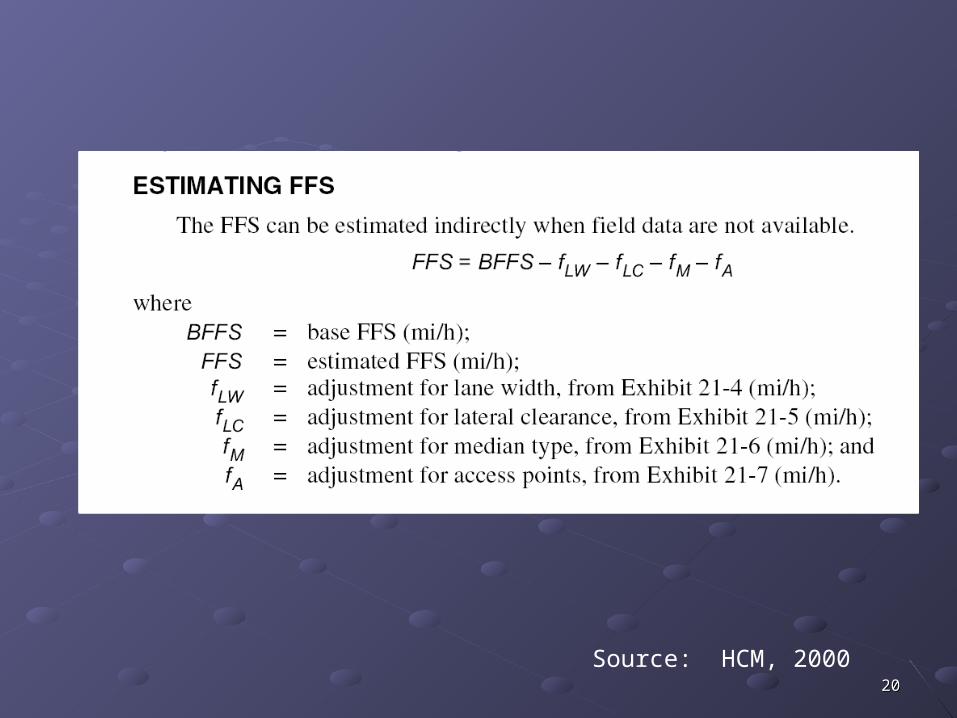
Estimate Free flow SpeedEstimate Free flow Speed
BFFS = free flow under ideal conditionsFFS = free flow adjusted for actual conditionsFrom previous examples:
FFS = 60 mph – 6.6 mph - 0.4 mph – 0 – 5.0 mph = 48 mph ( reduction of 12 mph)
3030
Source: HCM, 2000
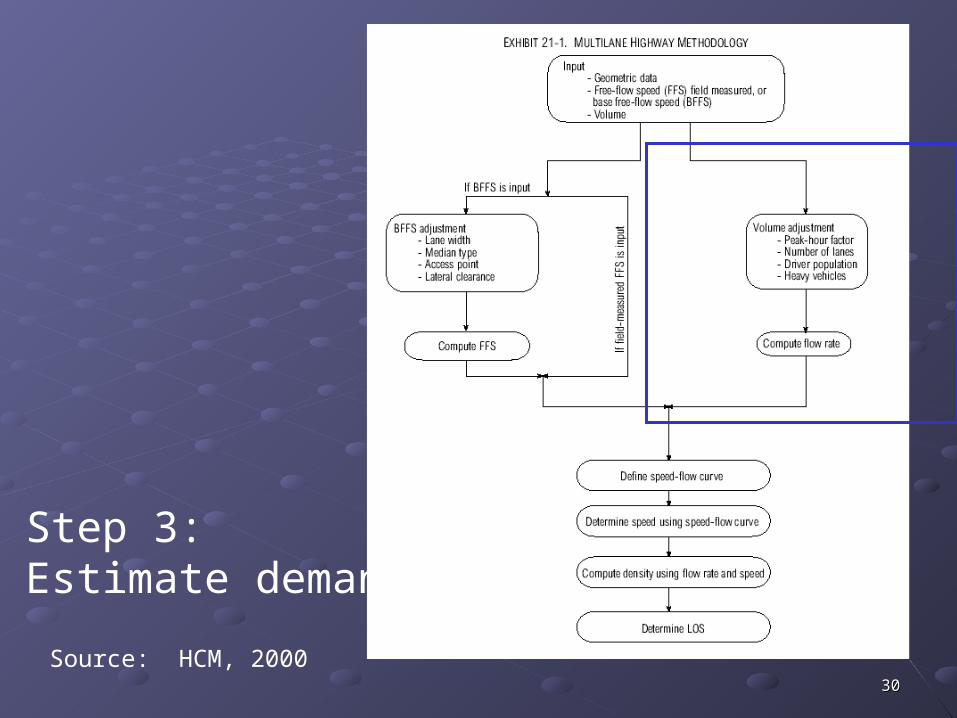
Step 3: Estimate demand
3131
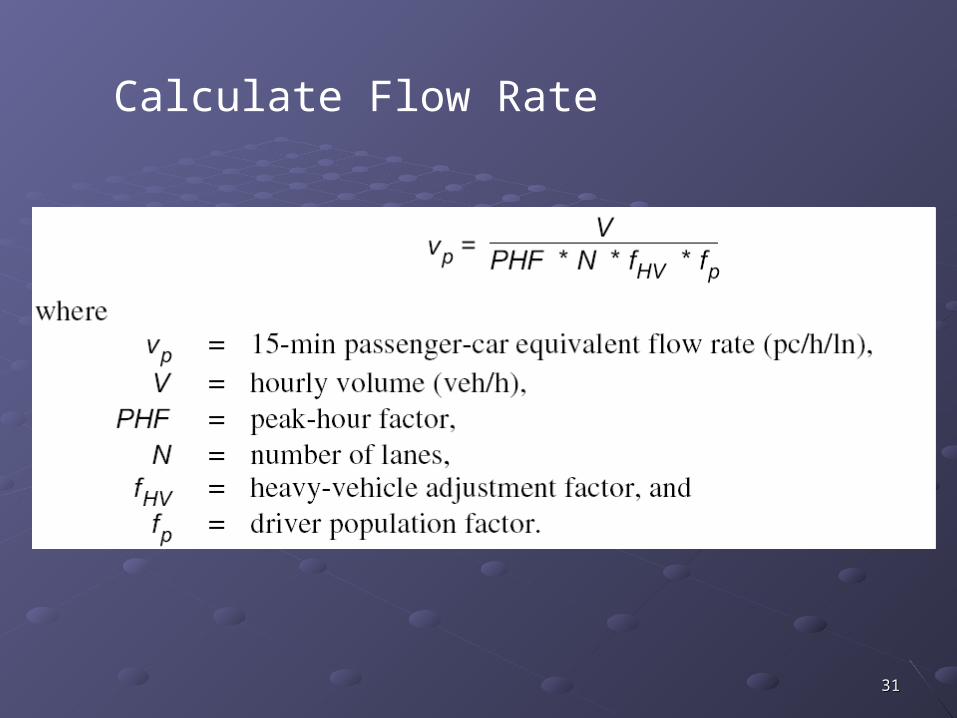
Calculate Flow Rate
3232
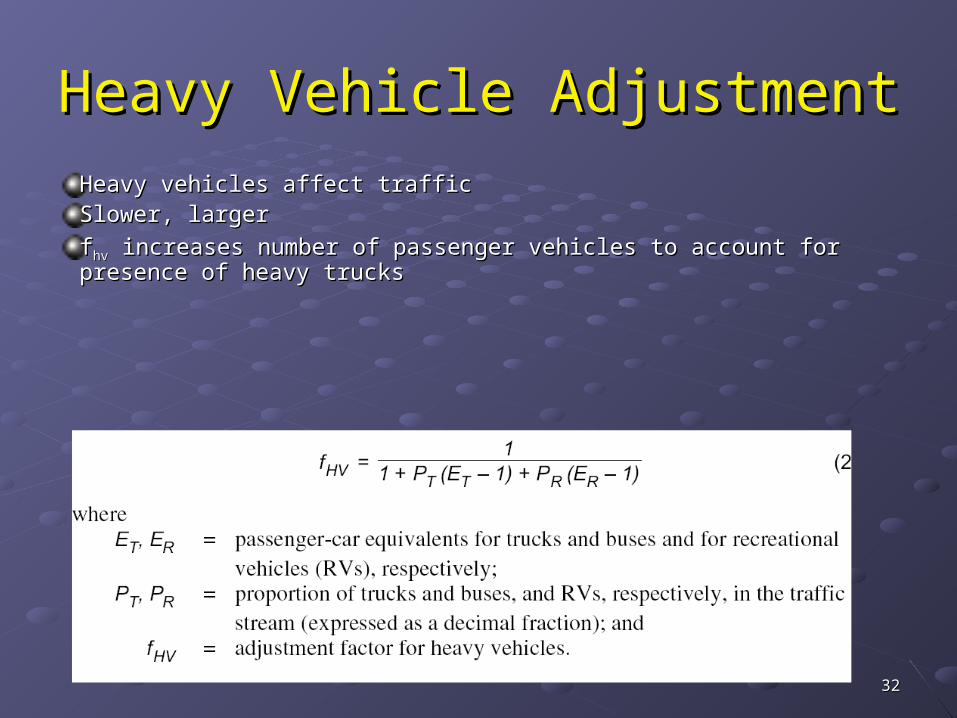
Heavy Vehicle AdjustmentHeavy Vehicle AdjustmentHeavy vehicles affect trafficHeavy vehicles affect trafficSlower, largerSlower, larger
ffhvhv increases number of passenger vehicles to account for presence increases number of passenger vehicles to account for presence of heavy trucksof heavy trucks

3333
f(hv) General Grade Definitions:f(hv) General Grade Definitions:
Level: combination of alignment (horizontal Level: combination of alignment (horizontal and vertical) that allows heavy vehicles to and vertical) that allows heavy vehicles to maintain same speed as pass. cars (includes maintain same speed as pass. cars (includes short grades 2% or less)short grades 2% or less)
Rolling: combination that causes heavy Rolling: combination that causes heavy vehicles to reduce speed substantially below vehicles to reduce speed substantially below P.C. (but not crawl speed for any length)P.C. (but not crawl speed for any length)
Mountainous: Heavy vehicles at crawl speed Mountainous: Heavy vehicles at crawl speed for significant length or frequent intervalsfor significant length or frequent intervals
Use specific grade approach if grade less Use specific grade approach if grade less than 3% is more than ½ mile or grade more than 3% is more than ½ mile or grade more than 3% is more than ¼ mile)than 3% is more than ¼ mile)
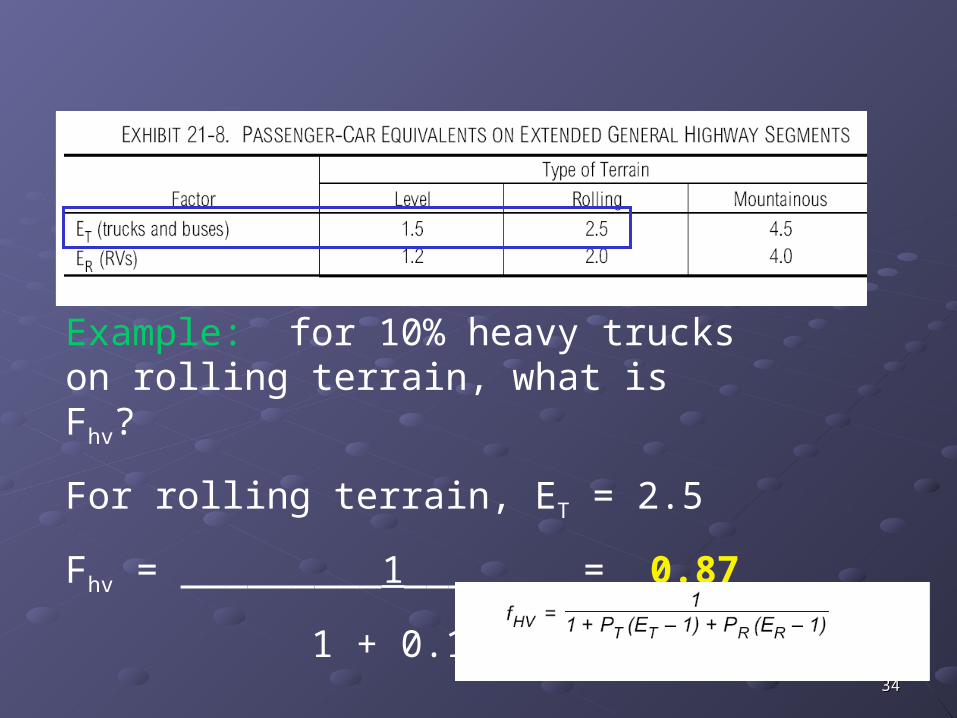
3434
Example: for 10% heavy trucks on rolling terrain, what is Fhv?
For rolling terrain, ET = 2.5
Fhv = _________1_______ = 0.87
1 + 0.1 (2.5 – 1)

3535
Driver Population Factor (fDriver Population Factor (fpp))
Non-familiar users affect capacityNon-familiar users affect capacity
ffpp = 1, familiar users = 1, familiar users
1 > f1 > fpp >=0.85, unfamiliar users >=0.85, unfamiliar users
3636
Source: HCM, 2000
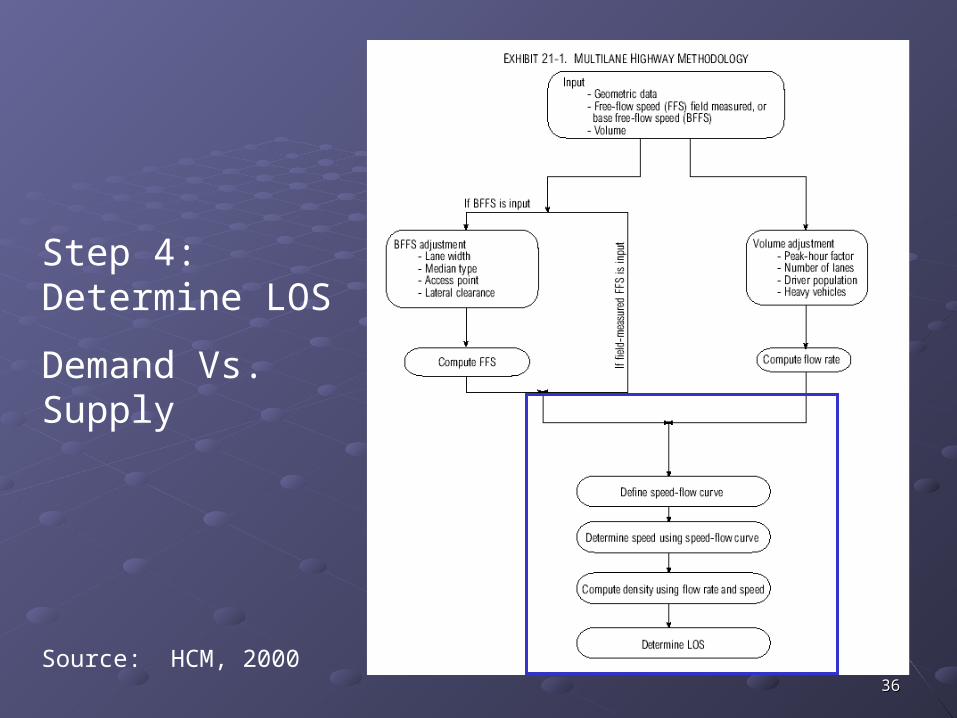
Step 4: Determine LOS
Demand Vs. Supply

3737
Calculate vCalculate vpp
Example:Example: base volume is 2,500 veh/hour base volume is 2,500 veh/hour
PHF = 0.9, N = 2PHF = 0.9, N = 2
ffhvhv from previous, f from previous, fhvhv = 0.87 = 0.87
Non-familiar users, fNon-familiar users, fpp = 0.85 = 0.85
vp = _____2,500 vph _____ = 1878 pc/ph/pl
0.9 x 2 x 0.87 x 0.85

3838
Calculate DensityCalculate Density
Example: for previous
D = _____1878 vph____ = 39.1 pc/mi/lane
48 mph

3939
LOS = E
Also, D = 39.1 pc/mi/ln, LOS E

4040
Design DecisionDesign Decision
What can we change in a design to What can we change in a design to provide an acceptable LOS?provide an acceptable LOS?
Lateral clearance (only 0.4 mph) Lateral clearance (only 0.4 mph)
Lane widthLane width
Number of lanesNumber of lanes

4141
Source: HCM, 2000
Lane Width (Example)Lane Width (Example)
How much does use of 10 foot lanes decrease free flow speed?
Flw = 6.6 mph

4242
Recalculate DensityRecalculate Density
Example: for previous (but with wider lanes)
D = _____1878 vph____ = 34.1 pc/mi/lane
55 mph
4343
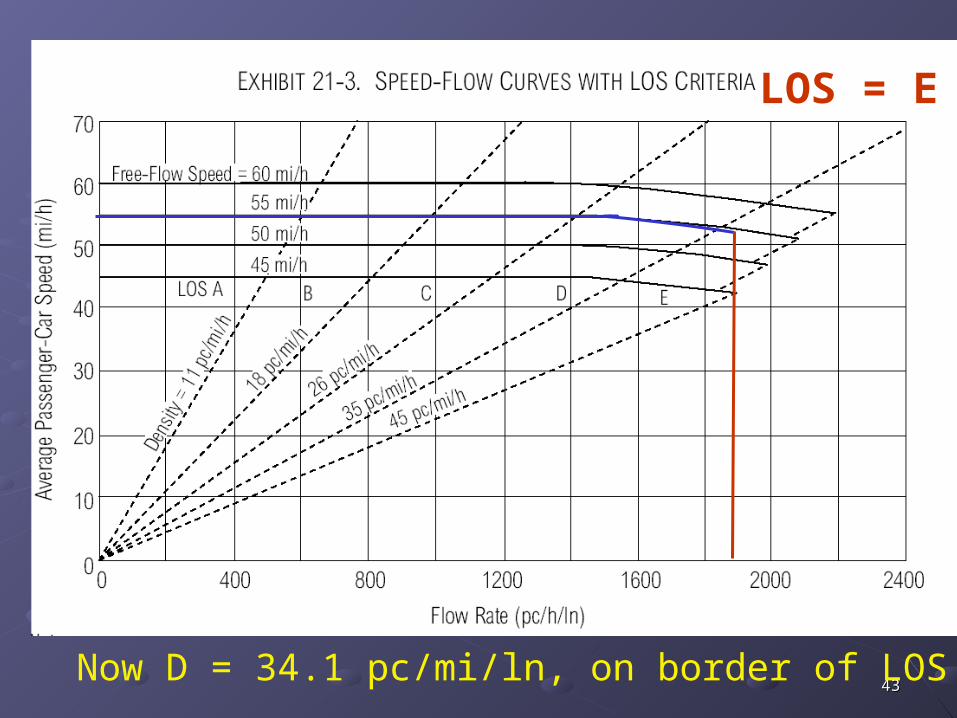
LOS = E
Now D = 34.1 pc/mi/ln, on border of LOS E

4444
Recalculate vRecalculate vpp, while adding a lane, while adding a lane
Example:Example: base volume is 2,500 veh/hour base volume is 2,500 veh/hour
PHF = 0.9, N = 3PHF = 0.9, N = 3
ffhvhv from previous, f from previous, fhvhv = 0.87 = 0.87
Non-familiar users, fNon-familiar users, fpp = 0.85 = 0.85
vp = _____2,500 vph _____ = 1252 pc/ph/pl
0.9 x 3 x 0.87 x 0.85
4545
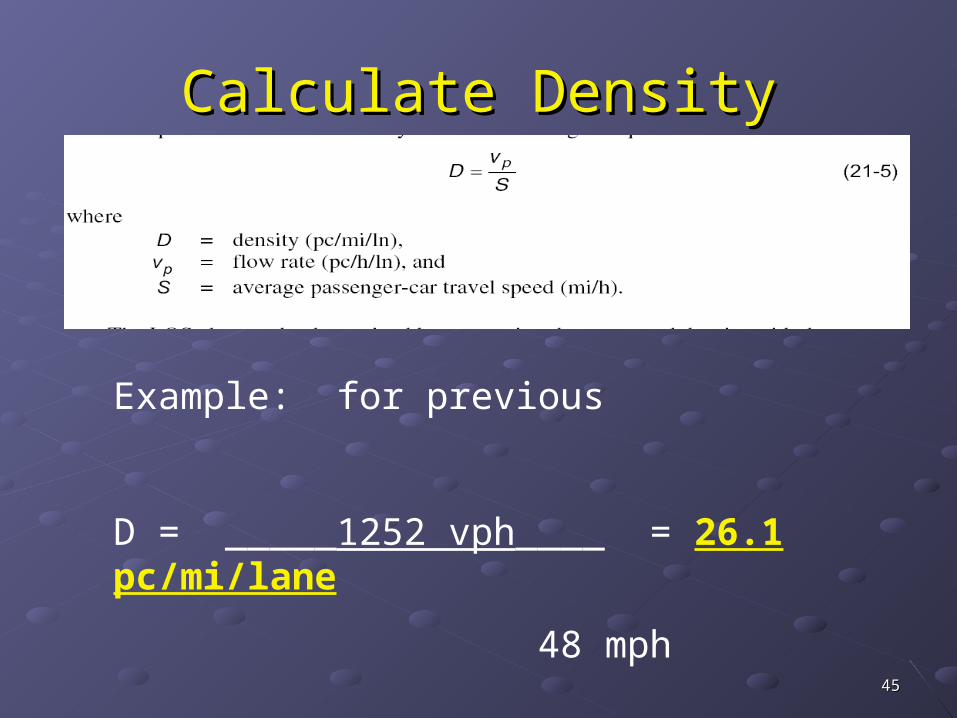
Calculate DensityCalculate Density
Example: for previous
D = _____1252 vph____ = 26.1 pc/mi/lane
48 mph

4646
LOS = D
Now D = 26.1 pc/mi/ln, LOS D (almost C)


