1 Ch 12: Capital Budgeting Decision Criteria Topics Overview Methods Payback, discounted payback NPV IRR, MIRR Profitability Index Evaluating projects with unequal lives Economic life
Transcript
1
Ch 12: Capital Budgeting Decision Criteria
Topics Overview Methods
Payback, discounted payback NPV IRR, MIRR Profitability Index
Evaluating projects with unequal lives Economic life
2
What is capital budgeting?
Analysis of potential additions to the capital budget.
Long-term decisions; often involve large outlays.
3
Steps in Capital Budgeting
1. Estimate ________________.2. Assess ____________ of cash flows.3. Determine required return (r).4. ___________________ cash flows.Chapter 12 focuses on step 4:
evaluation of cash flows.
4
Capital Budgeting Techniques
The best capital budgeting techniques:1. Use cash flows (not unadjusted
accounting numbers)2. Consider the time value of money. We refer to them as _________ (discounted
cash flow) methods.
Not all DCF techniques are equally useful.
5
Capital Budgeting Techniques
Non-DCF technique: payback
DCF techniques:
6
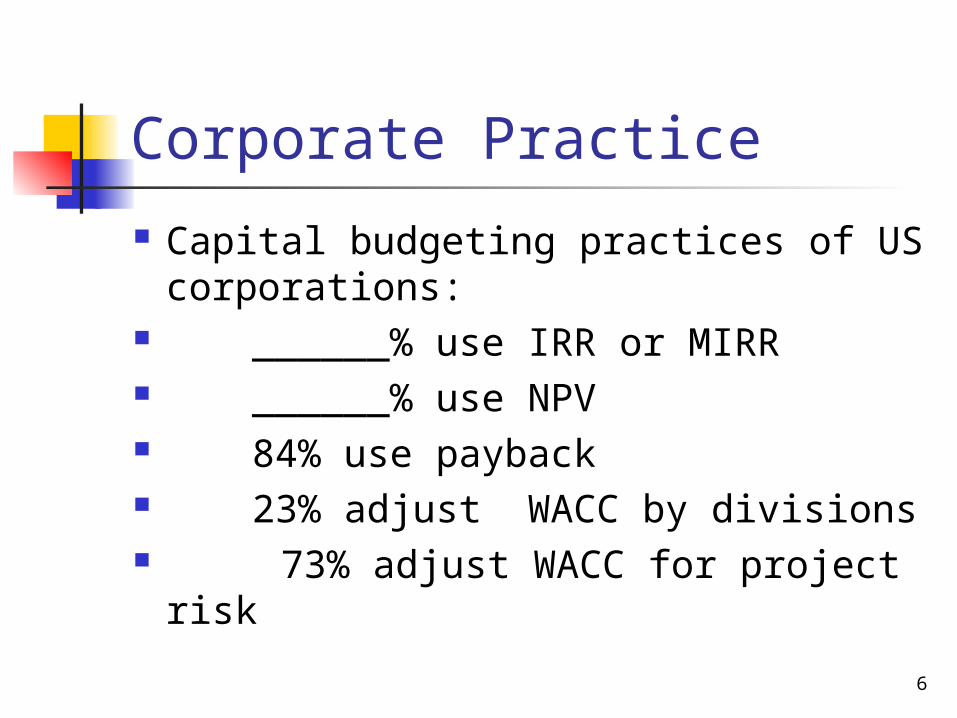
Corporate Practice
Capital budgeting practices of US corporations:
______% use IRR or MIRR ______% use NPV 84% use payback 23% adjust WACC by divisions 73% adjust WACC for project risk
7
Payback
Payback: # of years to recover a project’s cost.
Discounted payback: # of years for the PV of cash flows to equal cost.
8
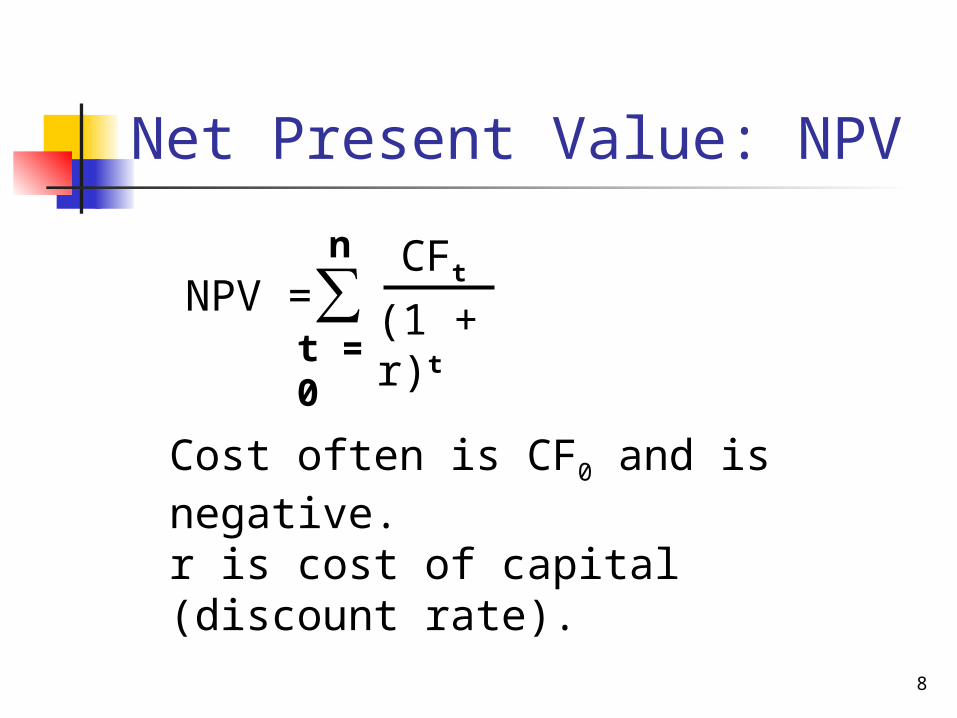
Net Present Value: NPV
Cost often is CF0 and is negative.r is cost of capital (discount rate).
NPV = ∑n
t = 0
CFt
(1 + r)t
9
Rationale for the NPV Method
NPV = PV inflows – Initial investment
NPV measures change in firm value, so accept project if NPV ___ 0.
Rank mutually exclusive projects on basis of higher __________.
10
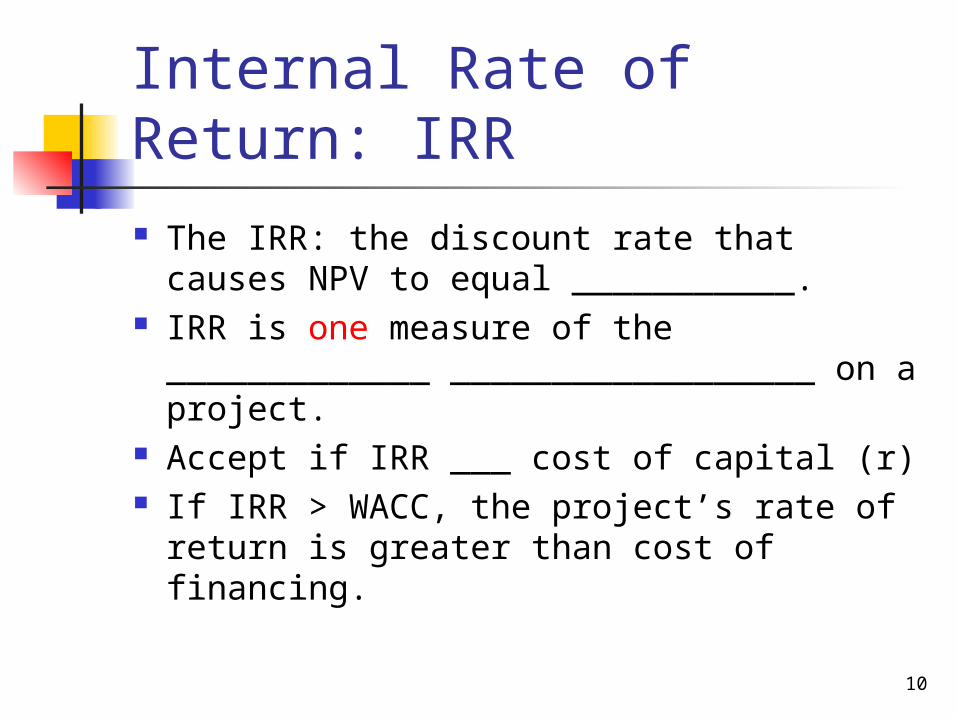
Internal Rate of Return: IRR The IRR: the discount rate that causes
NPV to equal ___________. IRR is one measure of the _____________
__________________ on a project. Accept if IRR ___ cost of capital (r) If IRR > WACC, the project’s rate of
return is greater than cost of financing.
11
Example Project
Cash flows for project X:
Year CFX
0 (100) 1 10 2 60 3 80
12
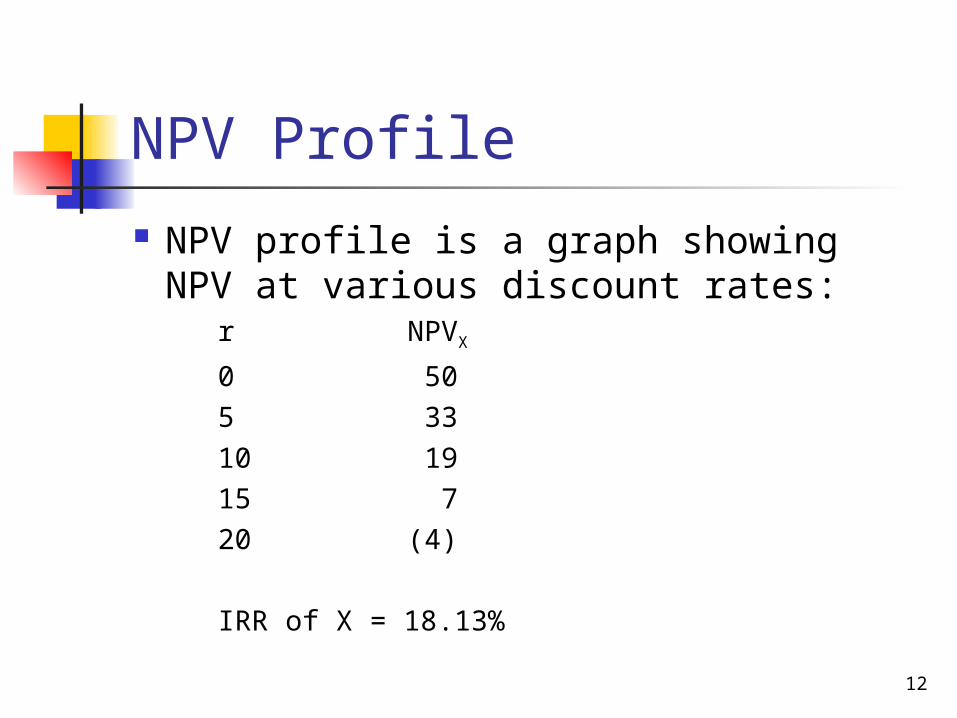
NPV Profile
NPV profile is a graph showing NPV at various discount rates:
r NPVX
0 505 3310 1915 720 (4)
IRR of X = 18.13%
13
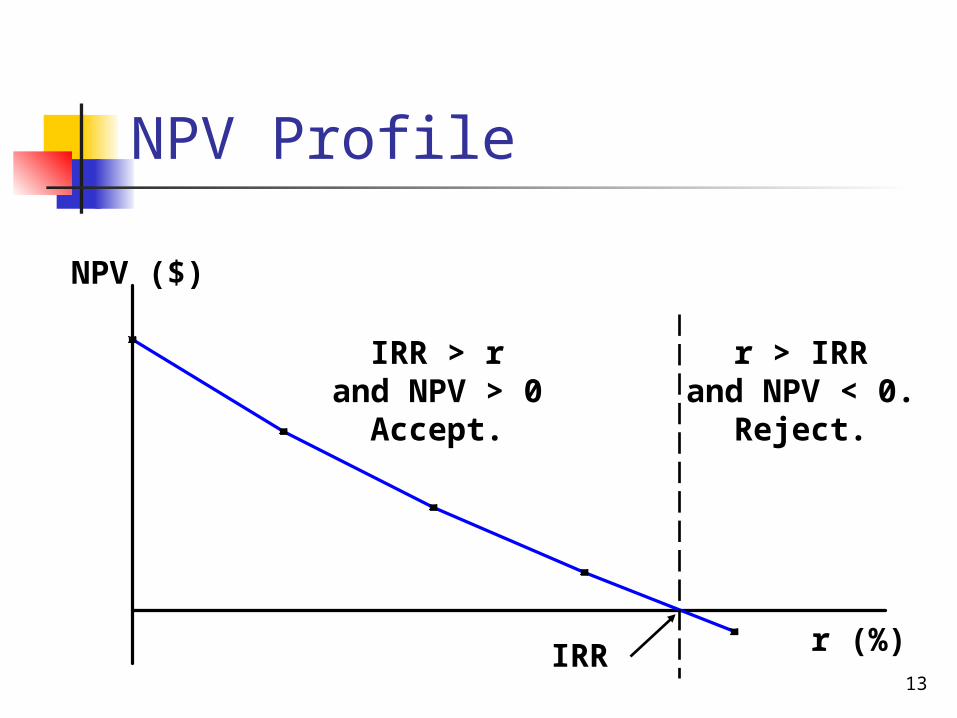
r > IRRand NPV < 0.
Reject.
NPV ($)
r (%)IRR
IRR > rand NPV > 0
Accept.
NPV Profile
NPV Profile
Define project X’ as identical to X except sign of every cash flow is reversed. What is the effect on NPV, IRR and NPV profile?
14
NPV Profiles
We often put two NPV profiles on the same axis.
If profiles cross, a _______________ exists.
If profiles don’t cross, one project dominates the other.
15
16
Reasons NPV Profiles Cross
Size (scale) differences. Timing differences.
17
Reinvestment Rate Assumptions: NPV & IRR
NPV assumes reinvestment at _______ __________________.
IRR assumes reinvestment at _______.
Reinvestment at cost of capital, r, is more realistic. This is one reason NPV is better method than IRR.
18
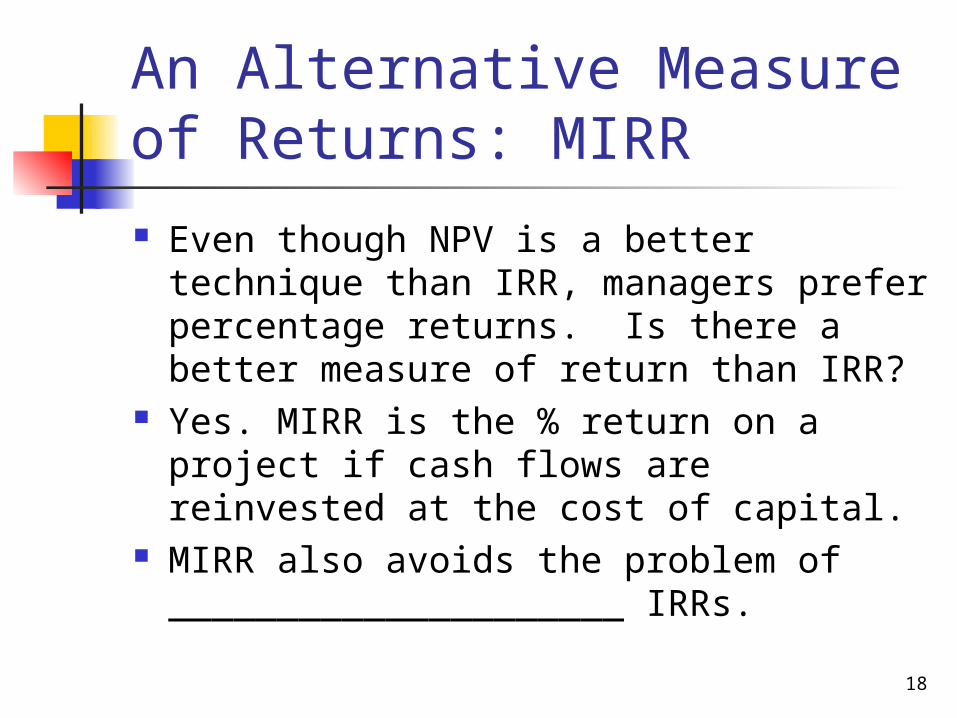
An Alternative Measure of Returns: MIRR Even though NPV is a better technique
than IRR, managers prefer percentage returns. Is there a better measure of return than IRR?
Yes. MIRR is the % return on a project if cash flows are reinvested at the cost of capital.
MIRR also avoids the problem of _____________________ IRRs.
19
Normal vs. Nonnormal Cash Flows Normal Cash Flow Project:
Cost (negative CF) followed by a series of positive cash inflows.
One change of __________________. Nonnormal Cash Flow Project:
Two or more changes of __________________. Most common: Cost (negative CF), then
string of positive CFs, then cost to close project.
Examples: nuclear power plant or strip mine.
20
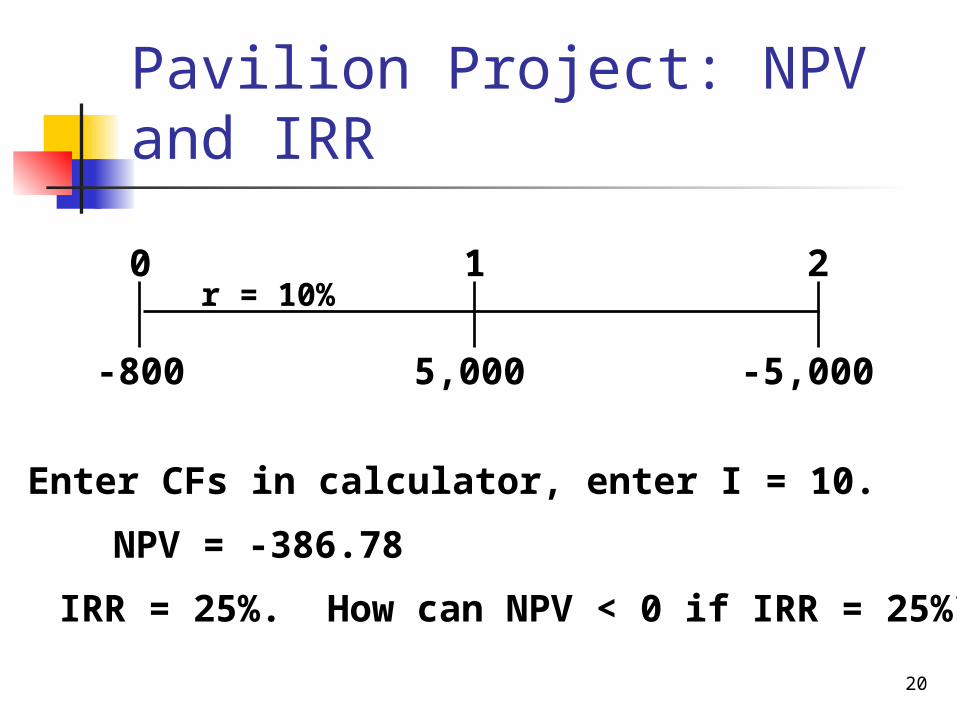
Pavilion Project: NPV and IRR
5,000 -5,000
0 1 2r = 10%
-800
Enter CFs in calculator, enter I = 10.
NPV = -386.78
IRR = 25%. How can NPV < 0 if IRR = 25%?
21
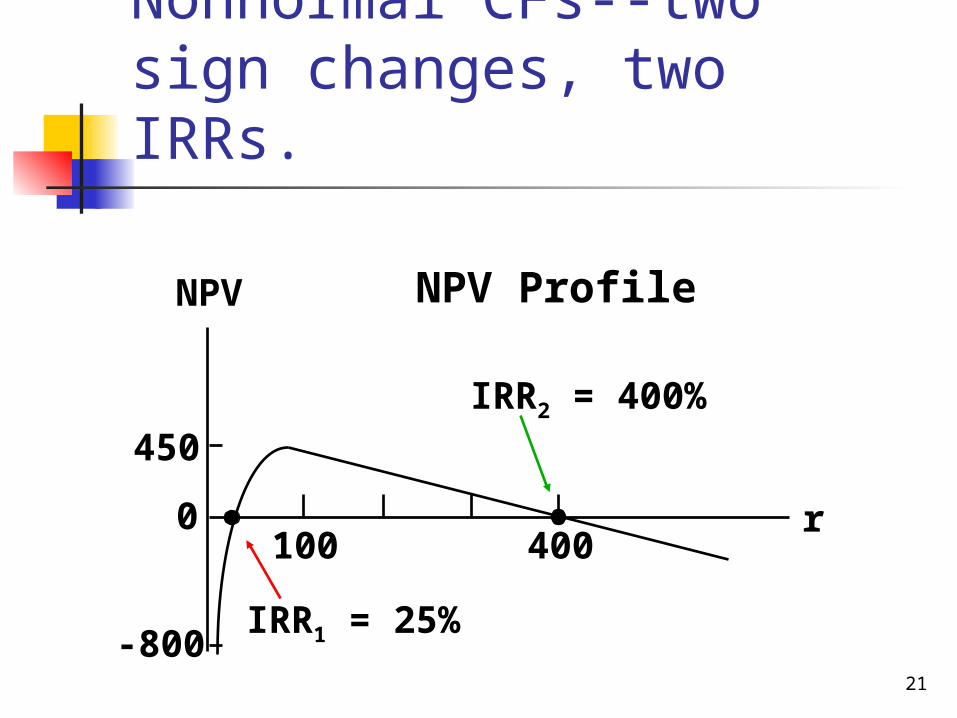
NPV Profile
450
-800
0400100
IRR2 = 400%
IRR1 = 25%
r
NPV
Nonnormal CFs--two sign changes, two IRRs.
22
Nonnormal CFs
Projects with nonnormal CFs: Can have one IRR, no IRR or more
than one IRR. Even if IRRs exist, they have no _____________________ interpretation.
Use MIRR &/or NPV for such projects.
23
Profitability Index
The profitability index (PI) is the present value of future cash flows divided by the initial cost.
It measures “bang for the buck.”
24
0 1 2 3 4
Project S:(100)
Project L:(100)
60
33.5
60
33.5 33.5 33.5
S and L are mutually exclusive and will be repeated. r = 10%.
25
NPVL > NPVS. But is L better?
S L
CF0 -100,000 -100,000
CF1 60,000 33,500
N 2 4
I 10 10
NPV 4,132 6,190
26
Put Projects on Common Basis
Note that Project S can be repeated after 2 years to generate additional returns.
Use replacement chain to put on common life.
27
Replacement Chain Approach (000s).Franchise S with Replication:
RCNPV = $7,547.
0 1 2 3 4
Franchise S:(100) (100)
60 60
60(100) (40)
6060
6060
28
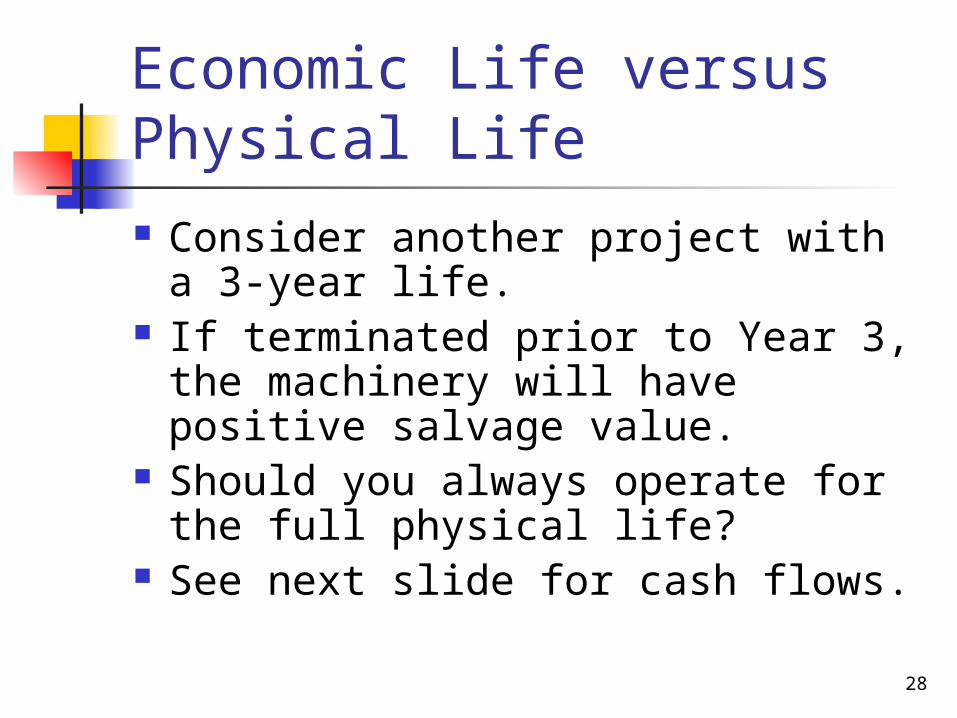
Economic Life versus Physical Life Consider another project with a 3-
year life. If terminated prior to Year 3, the
machinery will have positive salvage value.
Should you always operate for the full physical life?
See next slide for cash flows.
29
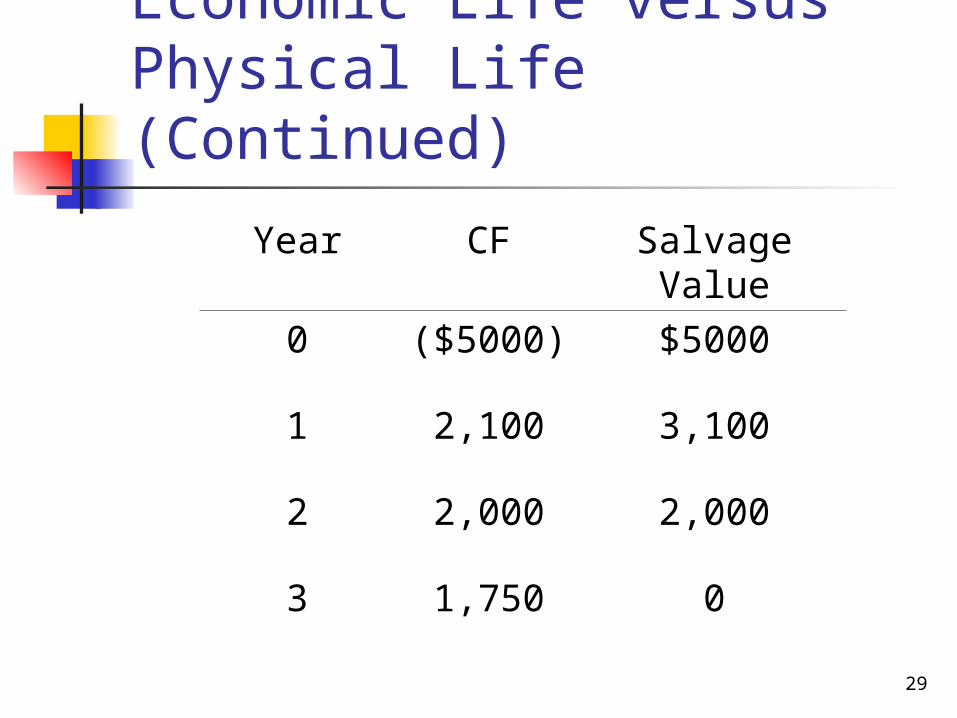
Economic Life versus Physical Life (Continued)
Year CF Salvage Value
0 ($5000) $5000
1 2,100 3,100
2 2,000 2,000
3 1,750 0
30
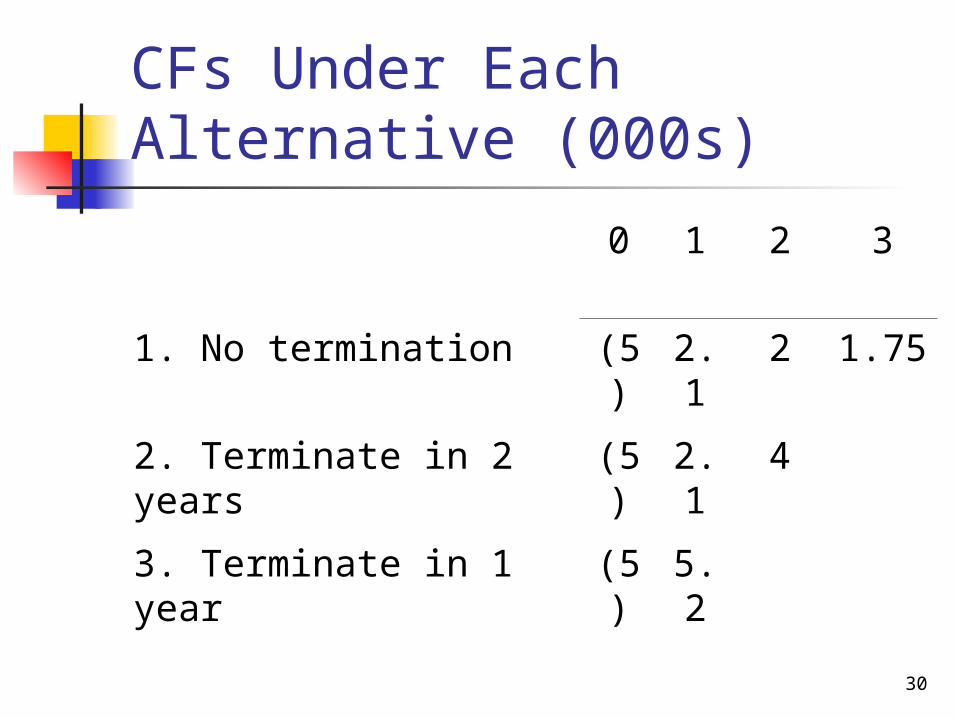
CFs Under Each Alternative (000s)
0 1 2 3
1. No termination (5) 2.1
2 1.75
2. Terminate in 2 years (5) 2.1
4
3. Terminate in 1 year (5) 5.2
31
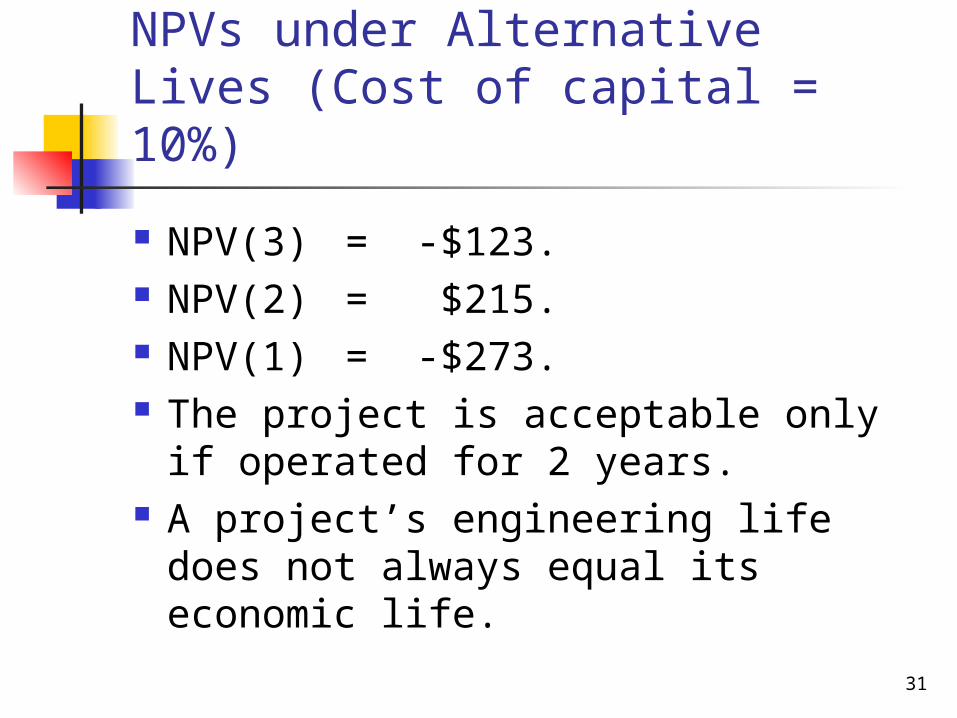
NPVs under Alternative Lives (Cost of capital = 10%)
NPV(3) = -$123. NPV(2) = $215. NPV(1) = -$273. The project is acceptable only if
operated for 2 years. A project’s engineering life does
not always equal its economic life.
32
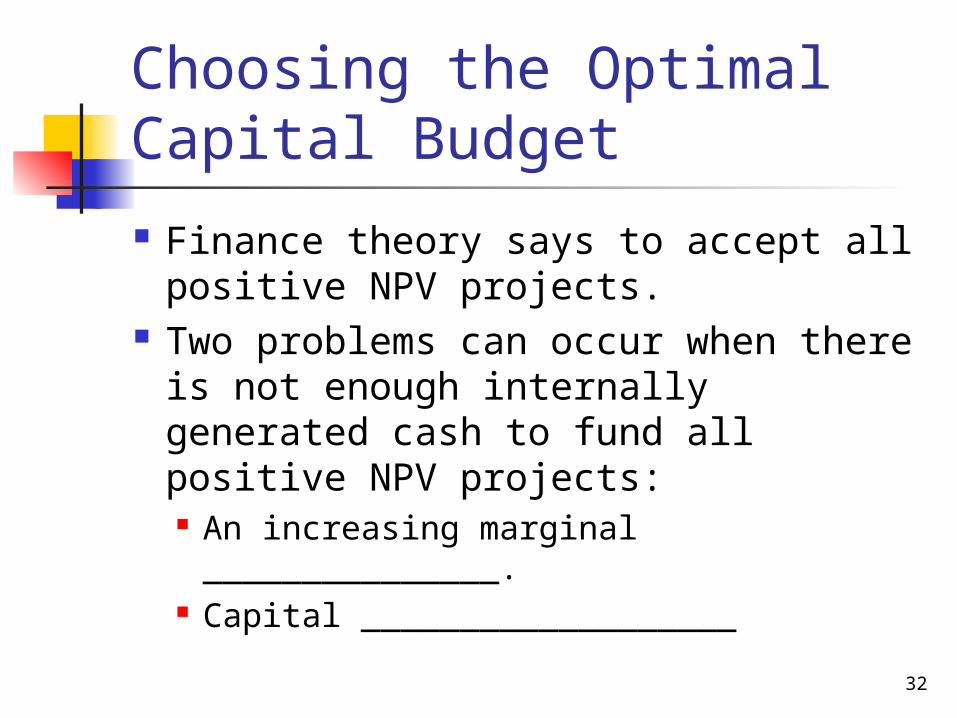
Choosing the Optimal Capital Budget
Finance theory says to accept all positive NPV projects.
Two problems can occur when there is not enough internally generated cash to fund all positive NPV projects: An increasing marginal _______________. Capital ___________________
33
Increasing Marginal Cost of Capital
Externally raised capital can have large flotation costs, which increase the cost of capital.
If external funds are raised, the NPV of all projects should be estimated using the marginal cost of capital.
34
Capital Rationing
Capital rationing occurs when a company does not fund all positive NPV projects.
The company typically sets an upper limit on the total amount of capital expenditures that it will make in the upcoming year.
35
Capital Rationing
One solution when faced with capital rationing is to select the group of projects with the highest ___________.


![9 IRR dan MIRR [Mode Kompatibilitas]€¦ · NPV vs. IRR • NPV dan IRR secara umum memberikan keputusan yang sama • Perkecualian –Non-konvensionalcashflows •Perubahan cash](https://static.documents.pub/doc/80x56/6098962414ea7310d0608782/9-irr-dan-mirr-mode-kompatibilitas-npv-vs-irr-a-npv-dan-irr-secara-umum-memberikan.jpg)

