1 Ch. 6: What to Produce? Where we’ve been … How much to produce? (Ch. 4) “Factor-product” decision rules say increase production until the marginal cost from an extra unit of output equals the marginal benefit. How to produce? (Ch. 5) With a least cost combination of inputs. “Factor-factor” decision rules say maintain production, but replace one input for another until the cost of a replaced input equals the cost of adding another input.
Transcript
1
Ch. 6: What to Produce?
Where we’ve been… How much to produce? (Ch. 4)
“Factor-product” decision rules say increase production until the marginal cost from an extra unit of output equals the marginal benefit.
How to produce? (Ch. 5)With a least cost combination of inputs.“Factor-factor” decision rules say maintain production, but replace one input for another until the cost of a replaced input equals the cost of adding another input.
2
Ch. 6: What to Produce?NOT on Exam 1, but fair game for FINAL
Where we’re going…Now we add additional types of outputs.
Before: Now:milk milk and cheesePB Cups Reg. and Crunchy PB Cupssweet corn sweet corn and tomatoes
Now there are competing “ends” for our limited resources.(Think opportunity costs.)
Today’s Goals: Two new tools, and a decision rule
3
Assumptions
1. The firm produces two outputs.(a complication)
2. The firm has a fixed set of resources.(a simplification)
3. The firm is a price taker (both in inputs and outputs).
4
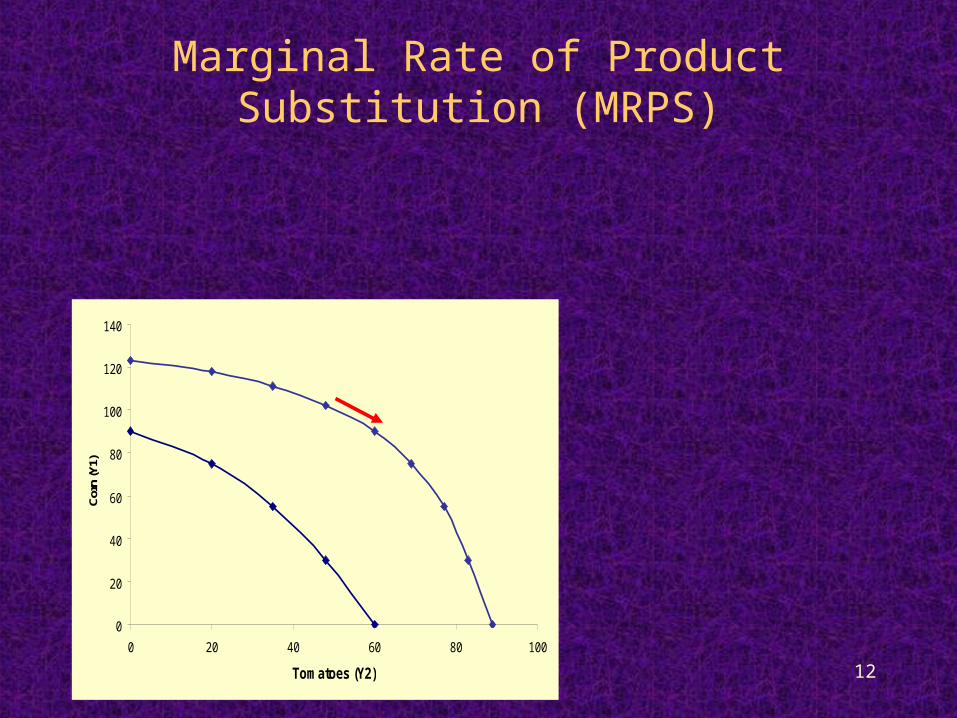
Production Possibilities Frontier (PPF)
Ch. 6 Tool #1
The Production Possibilities Frontier (PPF) is a curve depicting all the combinations of two products than can be produced using a given level of inputs.
Sometimes called the production possibilities curve (PPC).
5
Deriving the Production Possibilities Frontier
A Farmers Market Example:
Before, we examined a farmer who was just growing and selling sweet corn.Now we want to expand operations to include tomatoes.
Inputs: Fertilizer, equipment, seed, and other inputs –
These are already purchased, so they’re fixed. Labor – I can hire additional labor, so labor is