Program Environmental Draft Impact Statement/Report 12-1 – April 2011 Chapter 12.0 Hydrology – Groundwater 1 This chapter describes the environmental and regulatory settings of groundwater, 2 including environmental consequences and mitigation, as they pertain to implementation 3 of program alternatives. Groundwater resources describe the water resources related to 4 water flowing in the subsurface through porous sediments. Implementing the action 5 alternatives could affect groundwater resources associated with the San Joaquin River 6 from Friant Dam to the Delta and in CVP/SWP water service areas. Two geographic 7 regions, the San Joaquin River upstream from Friant Dam and the Delta, were dismissed 8 from further consideration because there would be no impacts to these regions under any 9 of the program alternatives. This chapter also focuses on presenting general information 10 about regional groundwater resources directly affected by Interim and Restoration flow 11 operations in the Restoration Area. 12 12.1 Environmental Setting 13 The San Joaquin Valley Groundwater Basin (see Figure 12-1) makes up the southern 14 two-thirds of the 400-mile-long, northwest trending asymmetric trough of the Central 15 Valley regional aquifer system in the southern extent of the Great Valley Geomorphic 16 Province (Page 1986). The San Joaquin Valley is bounded to the west by the Coast 17 Ranges, to the south by the San Emigidio and Tehachapi mountains, to the east by the 18 Sierra Nevada, and to the north by the Delta and Sacramento Valley (DWR 2003). 19 The San Joaquin Valley Groundwater Basin comprises the San Joaquin River Hydrologic 20 Region and Tulare Lake Hydrologic Region. The San Joaquin Valley Groundwater 21 Basin is composed of 16 subbasins: 9 in the San Joaquin River Hydrologic Region and 7 22 in the Tulare Lake Hydrologic Region (DWR 2003). The subbasins encompass most of 23 the study area, including the San Joaquin River upstream from Friant Dam, the 24 Restoration Area, the San Joaquin River from the Merced River confluence to the Delta, 25 the Delta, and much of the CVP/SWP water service areas. Detailed site-specific 26 information on all groundwater subbasins potentially affected by Settlement 27 implementation is limited and is not uniformly available or always current, but where 28 available, such information is included in this chapter. 29
Transcript
Program Environmental Draft Impact Statement/Report 12-1 – April 2011
Chapter 12.0 Hydrology – Groundwater 1
This chapter describes the environmental and regulatory settings of groundwater, 2 including environmental consequences and mitigation, as they pertain to implementation 3 of program alternatives. Groundwater resources describe the water resources related to 4 water flowing in the subsurface through porous sediments. Implementing the action 5 alternatives could affect groundwater resources associated with the San Joaquin River 6 from Friant Dam to the Delta and in CVP/SWP water service areas. Two geographic 7 regions, the San Joaquin River upstream from Friant Dam and the Delta, were dismissed 8 from further consideration because there would be no impacts to these regions under any 9 of the program alternatives. This chapter also focuses on presenting general information 10 about regional groundwater resources directly affected by Interim and Restoration flow 11 operations in the Restoration Area. 12
12.1 Environmental Setting 13
The San Joaquin Valley Groundwater Basin (see Figure 12-1) makes up the southern 14 two-thirds of the 400-mile-long, northwest trending asymmetric trough of the Central 15 Valley regional aquifer system in the southern extent of the Great Valley Geomorphic 16 Province (Page 1986). The San Joaquin Valley is bounded to the west by the Coast 17 Ranges, to the south by the San Emigidio and Tehachapi mountains, to the east by the 18 Sierra Nevada, and to the north by the Delta and Sacramento Valley (DWR 2003). 19
The San Joaquin Valley Groundwater Basin comprises the San Joaquin River Hydrologic 20 Region and Tulare Lake Hydrologic Region. The San Joaquin Valley Groundwater 21 Basin is composed of 16 subbasins: 9 in the San Joaquin River Hydrologic Region and 7 22 in the Tulare Lake Hydrologic Region (DWR 2003). The subbasins encompass most of 23 the study area, including the San Joaquin River upstream from Friant Dam, the 24 Restoration Area, the San Joaquin River from the Merced River confluence to the Delta, 25 the Delta, and much of the CVP/SWP water service areas. Detailed site-specific 26 information on all groundwater subbasins potentially affected by Settlement 27 implementation is limited and is not uniformly available or always current, but where 28 available, such information is included in this chapter. 29
San Joaquin River Restoration Program
Draft Program Environmental 12-2 – April 2011 Impact Statement/Report
1 Figure 12-1. 2
Groundwater Subbasins of the San Joaquin Valley Groundwater Basin Within San 3 Joaquin River and Tulare Lake Hydrologic Regions 4
Chapter 12.0 Hydrology – Groundwater
Program Environmental Draft Impact Statement/Report 12-3 – April 2011
The San Joaquin River Hydrologic Region is heavily groundwater-reliant, with 1 groundwater making up approximately 30 percent of the annual supply for agricultural 2 and urban uses (DWR 2003). The San Joaquin River Hydrologic Region consists of 3 surface water basins draining into the San Joaquin River system, from the Cosumnes 4 River basin on the north through the southern boundary of the San Joaquin River 5 watershed (DWR 1999). The San Joaquin River Hydrologic Region also includes 6 Yosemite Valley, Los Banos, and Creek Valley groundwater basins, and, as mentioned, 7 the San Joaquin Valley Groundwater Basin (DWR 1994). The Yosemite, Los Banos, and 8 Creek Valley groundwater basins are discrete, peripheral basins, unconnected to the San 9 Joaquin Valley Groundwater Basin, and will not be further discussed in this chapter. 10 Aquifers in the San Joaquin Valley Groundwater Basin are thick and typically extend to 11 depths of up to 800 feet. Groundwater subbasins in the northern half of the San Joaquin 12 Valley Groundwater Basin, lying in the San Joaquin River Hydrologic Region, include 13 Eastern San Joaquin, Modesto, Turlock, Merced, Chowchilla, Madera, Delta-Mendota, 14 Tracy, and Cosumnes (DWR 1994). Groundwater in this region accounts for 5 percent of 15 the State’s total agricultural and urban water use (DWR 1998). 16
The Tulare Lake Hydrologic Region has also been historically heavily reliant on 17 groundwater supplies. The Tulare Lake Hydrologic Region is a closed drainage basin at 18 the south end of the San Joaquin Valley, south of the San Joaquin River watershed, 19 encompassing surface water basins draining to the Kern Lake bed, Tulare Lake bed, and 20 Buena Vista Lake bed (DWR 1999). The Tulare Lake Hydrologic Region consists of 12 21 distinct groundwater basins and 7 subbasins of the San Joaquin Valley Groundwater 22 Basin. The primary aquifer in the San Joaquin Valley Groundwater Basin extends to as 23 deep as 1,000 feet below ground surface in the southern portion of the basin (DWR 24 2003). Groundwater subbasins in the southern half of the San Joaquin Valley 25 Groundwater Basin, lying in the Tulare Lake Hydrologic Region, include Kings, 26 Westside, Pleasant Valley, Kaweah, Tulare Lake, Tule, and Kern County. Groundwater 27 use in this hydrologic region has historically accounted for 41 percent of the total annual 28 water supply and for 35 percent of all groundwater use in the State. Groundwater use in 29 the hydrologic region represents approximately 10 percent of the State’s total agricultural 30 and urban water use (DWR 1998). 31
Settlement implementation could potentially result in changes in groundwater pumping 32 practices throughout the water districts (WD)/ IDs, and M&I user regions in the San 33 Joaquin Valley Groundwater Basin because of reductions to the users’ CVP surface water 34 deliveries. Groundwater conditions in the WDs/IDs and M&I regions are briefly 35 discussed when information is available for their respective hydrologic regions. 36
Table 12-1 provides a list of WD/ID and M&I water users. 37
San Joaquin River Restoration Program
Draft Program Environmental 12-4 – April 2011 Impact Statement/Report
Table 12-1. 1 Water Districts, Irrigation Districts and Municipal and Industrial Regions 2
Considered in the Groundwater Analysis 3 Arvin-Edison WSD Porterville ID City of Orange Cove Delano-Earlimart ID Saucelito ID City of Lindsay Exeter ID Shafter-Wasco ID Fresno County Water Works Fresno ID Southern San Joaquin MUD Madera County Garfield WD Stone Corral ID Fresno County International WD Tea Pot Dome WD Tulare County Ivanhoe WD Terra Bella ID Hills Valley ID Lewis Creek WD Tulare ID Kern-Tulare WD Lindmore ID Chowchilla WD Lower Tule River ID Lindsay-Strathmore ID Madera ID Pixley ID Lower Tule River ID Gravelly Ford WD Rag Gulch WD Orange Cove ID City of Fresno Tri-Valley WD Key: ID = Irrigation District MUD = Municipal Utilities District WD = Water District WSD = Water Storage District
12.1.1 Groundwater Resources of San Joaquin River Hydrologic Region 4 This section discusses regional and subbasin hydrogeology, groundwater storage and 5 production, groundwater levels, land subsidence, groundwater quality, agriculture 6 subsurface drainage, and seepage and water logging in the San Joaquin River Hydrologic 7 Region. 8
Hydrogeology 9 The following subsections describe regional hydrogeology and subbasin hydrogeology in 10 the San Joaquin River Hydrologic Region. 11
Regional Hydrogeology. As reported in the Draft PEIS for the CVPIA (Reclamation 12 1997), groundwater in the San Joaquin River Hydrologic Region historically flowed from 13 the valley flanks to the axis of the valley during predevelopment conditions, then north 14 toward the Delta. In the 1920s, development of a deep-well turbine pump and increased 15 availability of electricity led to expansion of agriculture, and ultimately declining 16 groundwater levels between 1920 and 1950 (DWR 2003). Groundwater pumping and 17 recharge from imported irrigation water have resulted in a change in regional flow 18 patterns. Flow largely occurs from areas of recharge towards areas of lower groundwater 19 levels because of groundwater pumping (Bertoldi et at. 1991). Vertical movement of 20 water in the aquifer has been altered in this region as a result of thousands of wells 21 constructed with perforations above and below the confining unit (Corcoran Clay 22 Member), where present, providing a direct hydraulic connection (Bertoldi et al. 1991). 23 This may have been partially offset by a decrease in vertical flow resulting from the 24 inelastic compaction of fine-grained materials in the aquifer system. 25
The San Joaquin Valley is located in an asymmetric structural trough in the Central 26 Valley of California. The San Joaquin Valley has accumulated up to 6 vertical miles of 27 sediment, including marine and continental rocks and deposits (Page 1986). The eastern 28
Chapter 12.0 Hydrology – Groundwater
Program Environmental Draft Impact Statement/Report 12-5 – April 2011
side of the valley is underlain by granitic and metamorphic rocks that slope gently from 1 the outcrops of the Sierra Nevada. The western side, and part of the eastern side, of the 2 valley are underlain by a mafic and ultramafic complex that is also part of the Sierra 3 Nevada. The continental and marine rocks deposited in the San Joaquin Valley range in 4 thickness from tens of feet to more than 2,000 feet (Page 1986). Although these 5 sediments contain freshwater, the depth of the unit prevents it from being considered an 6 important source of water (Page 1986). 7
The aquifer system of the San Joaquin Valley Groundwater Basin is divided into two 8 major aquifers: an unconfined to semiconfined aquifer above the E-clay and a confined 9 aquifer beneath the E-clay (Mitten et al. 1970, Williamson et al. 1989). The unconfined to 10 semiconfined aquifer can be divided into three hydrogeologic units based on the source 11 of the sediment: Coast Range alluvium, Sierra Nevada sediments, and flood-basin 12 deposits (see Figures 12-2 and 12-3). 13
The Coast Range alluvial deposits are derived largely from the erosion of marine rocks 14 from the Coast Range. These deposits are up to 850 feet thick along the western edge of 15 the valley and taper off to the east as they approach the center of the valley floor (Belitz 16 and Heimes 1990). The alluvial deposits contain a large proportion of silt and clay, are 17 high in salts, and also contain elevated concentrations of selenium and other trace 18 elements. The Sierra Nevada sediments on the eastern side of the region are derived 19 primarily from granitic rock and consist of predominantly well-sorted micaceous sand 20 (Miller et al. 1971). These deposits make up most of the total thickness of sediments 21 along the valley axis and gradually thin to the west until pinching out near the western 22 boundary. The Sierra Nevada sediments are relatively permeable with hydraulic 23 conductivities three times the conductivities of the Coast Range deposits (Belitz and 24 Heimes 1990). The flood-basin deposits are relatively thin and were derived in recent 25 time from sediments of the Coast Ranges to the west and from sediments of the Sierra 26 Nevada to the east. These deposits occur along the center of the valley floor and consist 27 primarily of moderately to densely compacted clays ranging between 5 and 35 feet thick 28 (Belitz and Heimes 1990). 29
On a regional scale, the E-clay, a thick zone of clay deposited as part of the sequence of 30 lacustrine and marsh deposits underlying Tulare Lake, divides the groundwater system. 31 The E-clay is considered equivalent to the Corcoran Clay Member of the Tulare 32 Formation, ranges from zero to 160 feet thick, and is found between 80 feet deep near 33 Chowchilla, to 400 feet below the land surface to the southwest (Mitten et al. 1970). The 34 confined aquifer is overlain by the Corcoran Clay Member of the Tulare Formation and 35 consists of mixed origin sediments. 36
San Joaquin River Restoration Program
Draft Program Environmental 12-6 – April 2011 Impact Statement/Report
1 San Joaquin River Hydrologic Region
Tulare Lake Hydrologic Region
Source: Reclamation et al. 1990a 2
Figure 12-2. 3 Generalized Hydrogeologic Cross Sections in San Joaquin River 4
and Tulare Lake Hydrologic Regions 5
Chapter 12.0 Hydrology – Groundwater
Program Environmental Draft Impact Statement/Report 12-7 – April 2011
1 Source: Modified from Page 1986 and Reclamation et al. 1990a 2
Figure 12-3. 3 Approximate Boundary of Corcoran Clay and Transect Lines 4
for Hydrogeologic Cross Sections 5
San Joaquin River Restoration Program
Draft Program Environmental 12-8 – April 2011 Impact Statement/Report
The semiconfined aquifer system of the San Joaquin Valley has historically been 1 recharged by mountain rain and snowmelt along the valley margins (McBain and Trush 2 2002). Recharge has generally occurred by stream seepage, deep percolation of rainfall, 3 and subsurface inflow along basin boundaries. As agricultural practices expanded in the 4 region, recharge was augmented with deep percolation of applied agricultural water and 5 seepage from the distribution systems used to convey this water. Recharge of the lower 6 confined aquifer consists of subsurface inflow from the valley floor and foothill areas to 7 the east of the eastern boundary of the Corcoran Clay Member. Present information 8 indicates that the clay layers, including the Corcoran Clay, are not continuous in some 9 areas, and some seepage from the semiconfined aquifer above does occur through the 10 confining layer. It has been reported that the hydraulic head in the semiconfined aquifer 11 has been less than that in the confined aquifer, and the pressure differential has led to an 12 upward gradient (artesian condition), allowing groundwater to discharge at the surface to 13 the river and valley (McBain and Trush 2002). 14
Subbasin Hydrogeology. The primary water-bearing units of the San Joaquin Valley 15 Groundwater Basin subbasins in the San Joaquin River Hydrologic Region (see Figure 16 12-1) are described by DWR in California’s Groundwater – Bulletin 118 (DWR 2003). 17 The water-bearing formations of the Tracy and Delta-Mendota subbasins in the 18 northwestern region of the San Joaquin Valley Groundwater Basin consist of continental 19 deposits of Late Tertiary to Quaternary age, and include the Tulare Formation, older 20 alluvium, flood-basin deposits, and younger alluvium (DWR 2003). Water-bearing 21 formations of the Delta-Mendota Subbasin also include terrace deposits. Deposits in the 22 subbasins range in thickness between a few hundred feet at the foothills of the Coast 23 Range to approximately 3,000 feet along the eastern edge of the subbasins. To the east, 24 the Cosumnes Subbasin also consists of continental deposits of similar age and 25 Miocene/Pliocene Volcanics of the Mehrten Formation. The older alluvium of the 26 Cosumnes Subbasin consists of sediments of the Modesto, Riverbank, Victor, and 27 Laguna formations. South of the Cosumnes Subbasin, the Eastern San Joaquin Subbasin 28 consists of Alluvium and the Modesto/Riverbank formations, flood-basin deposits, the 29 Laguna Formation, and Mehrten Formation (DWR 2003). Water-bearing deposits of the 30 Modesto, Turlock, and Merced subbasins consist of consolidated and unconsolidated 31 sedimentary deposits of the Ione, Valley Springs, and Mehrten formations. The 32 Chowchilla and Madera subbasins consist of unconsolidated water-bearing deposits of 33 Pleistocene and Holocene age. The unconsolidated deposits consist of continental 34 deposits of Tertiary and Quaternary age. 35
Groundwater Storage and Production 36 The following subsections describe historical and existing groundwater storage and 37 production conditions in the San Joaquin River Hydrologic Region. 38
Groundwater Storage. The cumulative change in groundwater storage from 1970 to 39 1992 for the San Joaquin River and Tulare Lake hydrologic regions combined is shown 40 in Figure 12-4. As illustrated in Figure 12-4, groundwater storage in the San Joaquin 41 Valley reached a low point in 1978 in response to the 1976 − 1977 drought. However, by 42 the early 1980s, groundwater storage had returned to predrought conditions. Groundwater 43 storage declined again as a result of the drought during 1987 − 1992, and reached a low 44
Chapter 12.0 Hydrology – Groundwater
Program Environmental Draft Impact Statement/Report 12-9 – April 2011
for 1970 – 1992 at the end of the drought in 1992. Groundwater storage at the end of the 1 1990 water year, the fourth year of the 6-year drought, was similar to groundwater 2 storage conditions recorded in 1978, which was the third year following the onset of a 3 2-year drought from 1976 − 1977. The 1976 − 1977 drought resulted in a greater rate of 4 decline compared to the 6-year drought. The 6-year drought resulted in continued 5 declines in groundwater storage in 1991 and 1992 to levels lower than recorded during 6 the previous low in 1978. The groundwater storage fluctuations presented in Figure 12-4 7 are representative of area-wide fluctuations in the San Joaquin River and Tulare Lake 8 hydrologic regions. The U.S. Geological Survey (USGS) simulated cumulative change in 9 groundwater storage in the Central Valley as a whole, including the hydrologic regions of 10 interest, San Joaquin River and Tulare Lake, referred to as the San Joaquin Basin and the 11 Tulare Lake Basin in Faunt 2009 using the Central Valley Hydrologic Model (CVHM) 12 illustrated in Figure 12-5. The simulated cumulative change in groundwater storage for 13 the Central Valley from USGS generally captures the same behavior illustrated in Figure 14 12-4, but the magnitude is shifted because the Central Valley groundwater storage also 15 accounts for the change in groundwater storage in the Sacramento Hydrologic Region 16 and the Delta and eastside streams. Results from the USGS study found that simulated 17 annual recharge and discharge between 1962 and 2003 estimated a net loss of 57.7 18 million acre-feet (MAF) from aquifer storage in the Central Valley (Faunt 2009). 19 According to DWR Bulletin 160-09, the net change in groundwater storage for water 20 years 1998, 1999, 2000, 2001, 2002, 2003, 2004, and 2005 was negative 444, negative 21 1,858, negative 96, and negative 1,260, negative 1,839, negative 992, negative 2,976, and 22 negative 1,251 TAF, respectively (DWR 2009). 23
Usable storage capacity for the San Joaquin River Hydrologic Region is estimated to be 24 24 MAF in DWR Bulletin 160-93 (1994). (DWR’s definition of usable storage capacity 25 is based on aquifer properties (i.e., permeability), groundwater quality, and economic 26 considerations such as the cost of well drilling and energy costs (DWR 1994)). DWR 27 Bulletin 160-93 defined perennial yield as “…the amount of groundwater that can be 28 extracted without lowering groundwater levels over the long-term” (1994). Perennial 29 yield of the San Joaquin River Hydrologic Region is estimated to be 3.3 MAF (DWR 30 1994). This estimated perennial yield is directly dependent on the amount of recharge 31 received by the groundwater basin, which can change over time. 32
San Joaquin River Restoration Program
Draft Program Environmental 12-10 – April 2011 Impact Statement/Report
1 Source: DWR 1994 2
Figure 12-4. 3 Cumulative Change in Groundwater Storage by Water Year for 4
San Joaquin River and Tulare Lake Hydrologic Regions 5
Chapter 12.0 Hydrology – Groundwater
Program Environmental Draft Impact Statement/Report 12-11 – April 2011
1 Source: USGS 2009 2
Figure 12-5. 3 Simulated Cumulative Change in Groundwater Storage by Water Year for 4
Central Valley and San Joaquin River and Tulare Lake Hydrologic Regions 5 from 1962 – 2003 6
Groundwater Production. Figure 12-6 shows the relationship between historical 7 groundwater pumping and irrigated agricultural acreage in the San Joaquin River 8 Hydrologic Region from 1922 through 1980 using data developed as part of the Central 9 Valley Ground-Surface Water Model (GSM) (Reclamation et al. 1990b). Table 12-2 10 highlights the timeline of events that have affected groundwater production in the San 11 Joaquin River Hydrologic Region for the period shown in Figure 12-6. 12
San Joaquin River Restoration Program
Draft Program Environmental 12-12 – April 2011 Impact Statement/Report
011223
012345 1920
1930
1940
1950
1960
1970
1980
1990
Irrigated Agricultural Acreage (millions of acres)
Groundwater Pumping (millions of acre-feet)
End-
of-W
ater
Yea
r
1935
-194
4:
WET
PE
RIO
D19
59-1
961:
D
RY
PER
IOD
1976
-197
7:
DR
OU
GH
T PE
RIO
D19
28-1
934:
D
RO
UG
HT
PER
IOD
GR
OU
ND
WAT
ER D
ISC
HAR
GED
TO S
TREA
MS
LITT
LE N
ET G
RO
UN
DW
ATER
SUR
FAC
E W
ATER
INTE
RAC
TIO
N
1987
-19
92:
DR
OU
GH
T PE
RIO
D
GR
OU
ND
WAT
ER R
ECH
ARG
ED F
RO
M S
TREA
MS
BASI
N IN
OVE
RD
RAF
T D
UR
ING
SO
ME
YEAR
S
S
ourc
e: R
ecla
mat
ion
et a
l. 19
90b.
N
ote:
D
ata
avai
labl
e fo
r 192
2 th
roug
h 19
80.
Dat
a de
velo
ped
as p
art o
f the
Cen
tral V
alle
y G
roun
d-S
urfa
ce W
ater
Mod
el (R
ecla
mat
ion
et a
l. 19
90b)
. Le
gend
: Irr
igat
ed a
gric
ultu
ral a
crea
ge
G
roun
dwat
er P
umpi
ng
Figu
re 1
2-6.
H
isto
rical
Gro
undw
ater
Pum
ping
and
Irrig
ated
Agr
icul
tura
l Acr
eage
for
San
Joaq
uin
Riv
er H
ydro
logi
c R
egio
n
Chapter 12.0Hydrology – Groundwater
Program Environmental Draft Impact Statement/Report 12-13 – April 2011
S
ourc
e: U
SG
S 2
009
Figu
re 1
2-7.
Si
mul
ated
Gro
undw
ater
Pum
ping
in C
entr
al V
alle
y fr
om 1
962
– 20
03
San Joaquin River Restoration Program
Draft Program Environmental 12-14 – April 2011 Impact Statement/Report
Table 12-2. 1 Timeline of Historical Events Affecting Groundwater Production in San Joaquin 2
River Hydrologic Region 3 Date Historical Event
1928 – 1934 Drought Period 1935 – 1944 Wet Period
1941 Friant Dam Online 1943 Madera Canal Online 1949 Friant-Kern Canal Online 1951 Delta-Mendota Canal Online 1967 San Luis Dam/Canal Online 1967 California Aqueduct Online 1967 Oroville Dam Online
1976 – 1977 Drought Period 1987 – 1992 Drought Period
The groundwater pumping data presented in this figure are based on pumping, estimated 4 water demands, and historical surface water supplies estimated by USGS (USGS 2009). 5 The agricultural acreage data used in the analysis are based on DWR estimates developed 6 as part of depletion studies. The data presented in the figure extend through 1980; 7 however, a recent study by USGS (Faunt 2009) reports simulated pumpage for the whole 8 Central Valley using CVHM from 1962 – 2003, illustrated in Figure 12-7. Groundwater 9 pumping in the San Joaquin Hydrologic Region from 1922 – 1980 ranged between 1.6 10 MAF in 1922 and 4.7 MAF in 1977. Groundwater pumping in the San Joaquin 11 Hydrologic Region and the whole Central Valley rose steadily through the 1970s, but 12 varied greatly depending on hydrologic conditions, and reached a peak during the largest 13 year-to-year fluctuations in the 1976 − 1977 drought period. Hydrologic conditions for 14 the years immediately following the drought, 1978, 1979, and 1980, were characterized 15 using the San Joaquin index as Wet, Above-Normal, and Wet, respectively, which 16 allowed for a reduction in pumping following the drought period because more surface 17 water was available to eliminate the need for heavy pumping. 18
As illustrated in Figure 12-7, reduced surface water deliveries and critically dry 19 hydrologic conditions during the 1987 through 1992 drought period also resulted in 20 increased pumping in the 1990s (DWR 1994). In 1990, an estimated 3.5 MAF of 21 groundwater were pumped from the San Joaquin River Hydrologic Region. The 22 groundwater pumped from the region in 1990 exceeded the estimated perennial yield by 23 approximately 200 TAF (DWR 1994). Groundwater extractions in the San Joaquin 24 Valley during the first 5 years of the 1987 through 1992 drought exceeded recharge by 11 25 MAF, causing land subsidence in some areas (DWR 2005b). All of the subbasins in the 26 San Joaquin River Hydrologic Region experienced some overdraft (DWR 1994). 27 (Groundwater overdraft describes the condition of a basin in which the amount of water 28 withdrawn by pumping exceeds the amount of water that recharges the basin over a 29 period of years during which water supply conditions approximate average conditions 30 (DWR 2005b).) At a 1995 level of development, annual average groundwater overdraft 31 was estimated at about 240 TAF in the San Joaquin River Hydrologic Region (DWR 32 1998). 33
Chapter 12.0 Hydrology – Groundwater
Program Environmental Draft Impact Statement/Report 12-15 – April 2011
Although a comprehensive assessment of overdraft in California’s subbasins has not been 1 completed since 1980, the California Water Plan Update reports that three of the 2 subbasins in the San Joaquin River Hydrologic Region (Chowchilla, Eastern San Joaquin, 3 and Madera) are in a critical condition of overdraft (DWR 2009). 4
Following the 1987 – 1992 drought, USGS simulated a reduction in groundwater 5 pumping in the Central Valley during a Wet hydrologic period from 1993 – 1998 using 6 CVHM (Faunt 2009). Groundwater pumping in the Central Valley began to increase in 7 1998 during a “Variable” to Dry hydrologic period, as illustrated in Figure 12-7. 8 Although groundwater pumping increased on average during the Wet 1999 – 2003 9 hydrologic period, improved irrigation systems and changes to lower-water-use crops 10 resulted in a decrease in the average agricultural pumping period from the 1993 – 1998 11 period. Consequently, a reduction in irrigation water resulted in a reduction in recharge to 12 the aquifer and approximately 19.1 MAF loss of groundwater storage (Faunt 2009). 13 DWR estimated that approximately 33 percent of the water supply in the San Joaquin 14 River Hydrologic Region was provided by groundwater in 2000 (DWR 2005a). 15
Typical production in the subbasins in the San Joaquin River Hydrologic Region is 16 shown in Table 12-3 (DWR 1998, 2003). Burt developed estimates of gross irrigation 17 well pumping for some of the Friant Division contractors for 1987 through 2003 (2005). 18 Gross irrigation well pumping is not equivalent to net groundwater extraction volumes 19 because inefficiencies associated with pumping a groundwater well are not accounted for 20 with this estimation method. However, the gross estimates provide information for 21 pumping economics analysis. In the San Joaquin River Hydrologic Region, Burt 22 estimated gross groundwater pumping for the Chowchilla WD, Gravelly Ford WD, and 23 Madera ID (2005). Information was not available for other Friant Division contractors in 24 the San Joaquin River Hydrologic Region, including Fresno County Water Works No. 18 25 and Hidden Lakes Estates. Estimates developed by Burt were used by Schmidt to 26 develop a tool (2005) to analyze the potential changes in groundwater levels associated 27 with changes in gross groundwater pumping. The Schmidt Tool is further described in 28 Section 12.3, “Environmental Consequences” and Appendix H, “Modeling.” Table 12-4 29 summarizes average annual gross groundwater pumping in the Friant Division service 30 areas described above. 31
San Joaquin River Restoration Program
Draft Program Environmental 12-16 – April 2011 Impact Statement/Report
Table 12-3. 1 Typical Groundwater Production in 2
San Joaquin River Hydrologic Region 3 Subbasin Extraction
Source: DWR 1998 and 2003 Key: TAF = thousand acre-feet
Table 12-4. 4 Gross Groundwater Pumping for Friant Division Contractors in 5
San Joaquin River Hydrologic Region 6
District Average Gross Groundwater Pumping (TAF/year)
1987−1992 1987−1999 1987−2003 Chowchilla WD 137 104 107 Gravelly Ford WD 25 20 20 Madera ID 215 157 165 Source: Burt 2005 Key: ID = Irrigation District TAF = thousand acre-feet WD = Water District
Estimates of gross groundwater pumping for Friant Division long-term contractors in 7 Table 12-4 potentially overestimate actual groundwater pumping, but no historical 8 pumping records are publicly available to validate the estimates. Because these estimates 9 are based on cropping patterns, changes to the crops in production could result in changes 10 to gross groundwater pumping in more recent years. 11
Groundwater Levels 12 Between 1920 and 1950, expansion of agricultural practices caused declines in 13 groundwater levels in many areas of the San Joaquin River Hydrologic Region. Along the 14 east side of the region, declines have ranged between 40 and 80 feet since 15 predevelopment conditions (estimated conditions for 1860) (Williamson et al. 1989). 16 Groundwater levels declined significantly in Chowchilla, Madera, western Kings, 17 Pleasant Valley, Tule, and Kern counties, which depended heavily on groundwater for 18 irrigation (Williamson et al. 1989). However, in 1950, the Friant-Kern Canal began 19 delivering surface water to part of the eastern side of the San Joaquin Valley and, as a 20 result, water level declines reversed because of the decrease in groundwater pumping 21 (Williamson et al. 1989). 22
Chapter 12.0 Hydrology – Groundwater
Program Environmental Draft Impact Statement/Report 12-17 – April 2011
Water levels declined along the west side of the San Joaquin River Hydrologic Region, 1 beginning in the 1940s, and dropped more than 30 feet by 1960. Groundwater levels in 2 deeper wells drilled into the confined aquifer of northwestern Fresno County were 3 recorded as ranging from 200 feet below msl to sea level in spring 1960 (reported by 4 Reclamation 1997). Groundwater levels in this area were recorded as ranging between 5 200 feet and 100 feet below msl by spring 1970. In central San Joaquin County, 6 groundwater levels reached 50 feet below msl in spring 1970, which led to saline 7 groundwater intrusion problems for the City of Stockton (Reclamation 1997). Predrought 8 groundwater levels in spring 1970 in the San Joaquin River and Tulare Lake hydrologic 9 regions are presented in Figure 12-8. 10
Beginning in 1967, surface water from the California Aqueduct became the primary 11 source of irrigation supply to the area south of Mendota, replacing groundwater as the 12 primary source (Belitz and Heimes 1990). Groundwater levels in the unconfined to 13 semiconfined aquifer were impacted by drought conditions that occurred in 1976 − 1977, 14 and were lower between spring 1970 (Figure 12-8) and spring 1980, but had recovered to 15 near predrought levels by the end of 1980 (Reclamation 1997). The groundwater contours 16 presented in Figure 12-8 were created using the average spring 1970 groundwater 17 elevations downloaded from the DWR Web site (DWR 2008). The decrease in 18 groundwater pumping allowed time for the confined aquifer to recover from extensive 19 pumping. Between 1967 and 1984, the hydraulic head in the confined aquifer rose 20 between 200 and 300 feet along the western boundary of the study area in Fresno County 21 (Belitz and Heimes 1990). The confined aquifer groundwater levels in northwestern 22 Fresno County and western Merced County increased up to 100 feet by spring 1980. 23
San Joaquin River Restoration Program
Draft Program Environmental 12-18 – April 2011 Impact Statement/Report
1 Source: DWR 2008 2
Figure 12-8. 3 Groundwater Elevations in Spring 1970, San Joaquin Valley Groundwater Basin 4
Chapter 12.0 Hydrology – Groundwater
Program Environmental Draft Impact Statement/Report 12-19 – April 2011
During the drought of the late 1980s and early 1990s (1987 − 1992), there were 1 substantial deficiencies in surface water deliveries to WDs in the San Joaquin Valley 2 Groundwater Basin, resulting in increased groundwater pumping of the unconfined to 3 semiconfined and confined units of the aquifer system (Groundwater Management 4 Technical Committee 1999, Reclamation 1997). A regional response to the drought was 5 evident in the San Joaquin Valley Groundwater Basin, with water levels in the central 6 and eastern portions declining by 20 to 30 feet (Westlands WD 1995). Following the 7 drought, groundwater depression areas were present on the east side of the San Joaquin 8 River Hydrologic Region in Merced and Madera counties, where groundwater was less 9 than 50 feet above msl. Groundwater levels declined on the eastern side of the San 10 Joaquin River Hydrologic Region until 1995 (DWR 2003). 11
Postdrought conditions in the basin in 1995 are presented in Figure 12-9. The 12 groundwater contours shown in Figure 12-9 were modified from a map of spring 1995 13 groundwater elevations downloaded from the DWR Web site (DWR 2008). The 14 groundwater contours illustrated in Figure 12-9 depict groundwater elevations in the 15 unconfined to semiconfined aquifers of the San Joaquin Valley Groundwater Basin. The 16 groundwater contours illustrated in Figure 12-9 indicate that groundwater elevations in 17 the San Joaquin Valley Groundwater Basin were beginning to recover to predrought 18 conditions. Groundwater levels in the San Joaquin River Hydrologic Region began to 19 recover in some of the subbasins in 1994 and continued through 2000 to water levels near 20 1970 predrought levels (DWR 2003). 21
Figure 12-10 presents the most recent (2007) groundwater level conditions in the San 22 Joaquin River and Tulare Lake hydrologic regions, developed by DWR (DWR 2009). 23 These groundwater contours illustrate groundwater elevations in the unconfined and 24 semiconfined aquifers of the San Joaquin Valley. The groundwater elevations indicate 25 that the San Joaquin Valley Groundwater Basin had approximately recovered from the 26 previous drought (1987 – 1992). Groundwater elevations for spring 2007 conditions 27 were presented in a series of groundwater basin contour maps available on the DWR Web 28 site (DWR 2009). Table 12-5 summarizes the ranges in groundwater elevations in the 29 semiconfined aquifer reported on the groundwater basin contour maps available on the 30 DWR Web site. 31
San Joaquin River Restoration Program
Draft Program Environmental 12-20 – April 2011 Impact Statement/Report
1 Source: DWR 2008 2
Figure 12-9. 3 Groundwater Elevations in Spring 1995, San Joaquin Valley Groundwater Basin 4
Chapter 12.0 Hydrology – Groundwater
Program Environmental Draft Impact Statement/Report 12-21 – April 2011
1 Source: DWR 2008 2
Figure 12-10. 3 Groundwater Elevations in Spring 2007, San Joaquin Valley Groundwater Basin 4
San Joaquin River Restoration Program
Draft Program Environmental 12-22 – April 2011 Impact Statement/Report
Table 12-5. 1 Spring 2006 Contour Map Groundwater 2
Elevations in Subbasins of 3 San Joaquin River Hydrologic Region 4
• Groundwater elevations in the semiconfined aquifers of the Modesto Subbasin 5 ranged between 30 feet and 100 feet above msl in spring 2006, and increased 6 from west to east towards the Sierra Nevada. 7
• Groundwater elevations in the Turlock Subbasin ranged between 40 feet and 100 8 feet above msl in spring 2006. 9
• Groundwater elevations in the semiconfined aquifer of the Merced Subbasin 10 ranged between 60 feet and 190 feet above msl in spring 2006. 11
• Groundwater elevations in this subbasin also generally increased from west to 12 east towards the Sierra Nevada, with localized cones of depression. 13
• Groundwater elevations in the semiconfined aquifers of the Chowchilla Subbasin 14 ranged between 0 feet and 100 feet above msl in spring 2006. 15
• Groundwater elevations in the semiconfined aquifers of the Madera Subbasin 16 ranged between 30 feet and 200 feet above msl in spring 2006. 17
• Groundwater elevations in the semiconfined aquifers in the Delta-Mendota 18 Subbasin ranged between 40 feet and 150 feet above msl in spring 2005. 19
Land Subsidence 20 Four types of land subsidence occur in the San Joaquin Valley: aquifer-system 21 compaction due to groundwater level decline, near-surface hydrocompaction, subsidence 22 due to fluid withdrawal from oil and gas fields, and subsidence caused by deep-seated 23 tectonic movements (Ireland et al. 1984). The first two types of subsidence are the 24 primary causes in the region, therefore the latter two types of subsidence are not 25 discussed below. Land subsidence contours in the San Joaquin River and Tulare Lake 26 hydrologic regions from 1926 through 1970 are shown in Figure 12-11. In the San 27
Chapter 12.0 Hydrology – Groundwater
Program Environmental Draft Impact Statement/Report 12-23 – April 2011
Joaquin Valley, aquifer-system compaction due to groundwater level decline and near-1 surface hydrocompaction are the primary causes of subsidence (Ireland 1986), and are 2 discussed further below. 3
Aquifer-System Compaction. Groundwater level decline has been one of the primary 4 causes of land subsidence in the San Joaquin Valley Groundwater Basin because of 5 compaction of aquifer sediments. In the mid-1920s, land subsidence began to occur as a 6 result of increased groundwater pumping for irrigation of crops in the San Joaquin Valley 7 Groundwater Basin (Ireland 1986). By the mid-1970s, the maximum land subsidence in 8 the San Joaquin Valley Groundwater Basin exceeded 28 feet (Poland et al. 1975). The 9 decline in groundwater levels in the valley caused at least 1 foot of land subsidence 10 across more than 5,200 square miles, or nearly half of the irrigated land in the San 11 Joaquin River and Tulare Lake hydrologic regions by 1977 (Ireland 1986). The most 12 seriously affected areas were located in the southern and western parts of the valley. 13
San Joaquin River Restoration Program
Draft Program Environmental 12-24 – April 2011 Impact Statement/Report
1 Source: Williamson et al. 1989 2
Figure 12-11. 3 Land Subsidence in the San Joaquin River and Tulare Lake Hydrologic Regions 4
Chapter 12.0 Hydrology – Groundwater
Program Environmental Draft Impact Statement/Report 12-25 – April 2011
In the late 1960s and early 1970s, surface water was imported via canals, and the 1 California Aqueduct began importing supplies to the subsiding areas, reducing 2 groundwater pumping and eliminating new land subsidence in the western and southern 3 portions of the San Joaquin Valley Groundwater Basin (Ireland 1986). However, drought 4 conditions during 1976 − 1977 resulted in high groundwater pumping rates, inducing 5 land subsidence in areas where it had been observed previously. Significant land 6 subsidence was detected again in the San Joaquin Valley Groundwater Basin due to 7 increased groundwater pumping during the 1987 − 1992 drought. Land subsidence was 8 also reported between 1984 and 1996 along the DMC. Two of the locations where 9 subsidence was reported were near the Mendota Pool, where 1.3 feet of land subsidence 10 were measured, and approximately 25 miles northeast of the Mendota Pool, where 2.0 11 feet of land subsidence were measured (Central California ID 1996). Land subsidence 12 measured by DWR between 1990 and 1995 of up to 2.0 feet was reported along the 13 California Aqueduct in Westlands WD (Reclamation 1997). Land subsidence in the San 14 Joaquin River and Tulare Lake hydrologic regions occurs primarily in western Fresno 15 County, but extends from Merced County to Kings County. Maximum land subsidence 16 levels in the Central Valley were recorded in this area. In parts of northwestern Fresno 17 County, land subsidence levels as great as 30 feet have been measured (Ireland et al. 18 1984). 19
Because of the slow drainage of fine-grained deposits, subsidence at a particular time is 20 more closely related to past groundwater level changes than to current change. In the San 21 Joaquin Valley Groundwater Basin, groundwater extraction increased until large amounts 22 of surface water were imported through various canals. Although water levels in the area 23 started to rise, the rate of subsidence began to decrease 3 years after the groundwater 24 levels began to recover (Reclamation 1997). 25
Near-Surface Hydrocompaction. Hydrocompaction occurs when moisture-deficient 26 deposits, which can be unconsolidated, porous semiarid, or arid, lose strength after 27 wetting. The wetting process results in a decrease in volume and an increase in density, 28 which occur when dry deposits become wet and spontaneously slump, crack, or collapse 29 (Prokopovich undated). A total area of 210 square miles in a few areas on the west and 30 south ends of the San Joaquin Valley have been affected by near-surface 31 hydrocompaction (Williamson et al. 1989). Subsidence in these areas has been reported 32 to be from 5 to 15 feet (Poland and Evenson 1966). 33
Groundwater Quality 34 Groundwater quality in the San Joaquin Valley Groundwater Basin varies considerably. 35 In general, groundwater quality is suitable for most urban and agricultural uses, with the 36 exception of localized problematic areas in the San Joaquin River Hydrologic Region 37 (DWR 2003). Primary constituents of concern include total dissolved solids (TDS), 38 boron, chloride, nitrates, arsenic, selenium, dibromochloropropane (DBCP), and radon, 39 which are discussed in this section. Future site-specific projects relating to Settlement 40 implementation may require a more detailed assessment of local groundwater quality 41 issues. 42
San Joaquin River Restoration Program
Draft Program Environmental 12-26 – April 2011 Impact Statement/Report
Highly detailed groundwater quality studies have been conducted sporadically on a 1 localized scale, often as a result of regulatory requirements, throughout the San Joaquin 2 Valley Groundwater Basin. USGS has released groundwater quality data collected as part 3 of the Groundwater Ambient Monitoring Assessment (GAMA) program for the Northern 4 San Joaquin Basin GAMA and the Central Eastside San Joaquin Basin GAMA study 5 areas (USGS 2005). The Northern San Joaquin Basin GAMA study area includes the 6 Tracy, Eastern San Joaquin, and Cosumnes subbasins, and the USGS-defined Uplands 7 area, which includes portions of the Cosumnes and Eastern San Joaquin subbasins 8 (Bennett et al. 2006). The Central Eastside San Joaquin Basin GAMA study area includes 9 the Modesto, Turlock, and Merced subbasins, which are located in Stanislaus and Merced 10 counties (Landon and Belitz 2008). In the future, greater quantitative and qualitative 11 regional groundwater quality understanding is anticipated for the remaining areas of both 12 the San Joaquin River Hydrologic Region and the Tulare Lake Hydrologic Region 13 through use of USGS GAMA data. 14
Total Dissolved Solids. TDS concentrations vary considerably throughout the San 15 Joaquin River Hydrologic Region but, in general, concentrations are highest along the 16 west side of the region. These higher concentrations are a result of recharged streamflow 17 originating from marine deposits in the west, and the concentration of salt due to 18 evaporation and poor drainage in the center of the hydrologic region (DWR 2003). On 19 the west side of the valley, TDS concentrations generally exceed 500 milligrams per liter 20 (mg/L), and are in excess of 2,000 mg/L along portions of the western margin of the 21 valley (Bertoldi et al. 1991). Figure 12-12 illustrates TDS concentrations in the entire 22 Central Valley Groundwater Basin. TDS concentrations above the secondary maximum 23 contaminant level (MCL) of 500 mg/L have been reported in the Tracy, Merced, 24 Modesto, and Turlock subbasins (Bennett et al. 2006; Landon and Belitz 2008). 25
Boron. Boron is an essential micronutrient found at low concentrations in irrigation 26 water (Bertoldi et al. 1991). However, boron is toxic to most crops at concentrations 27 exceeding 4.0 mg/L (Bertoldi et al. 1991). Boron concentrations above the California 28 Department of Public Health notification limit (NL) of 1,000 micrograms per liter (μg/L) 29 have been documented in the northwestern portion of the San Joaquin River Hydrologic 30 Region in the Tracy Subbasin, extending from the northernmost edge of the valley west 31 of the San Joaquin River to the Kings-Fresno county line (Bertoldi et al. 1991, DWR 32 2003, Landon and Belitz 2008). DWR reported that it has identified localized areas with 33 “high” concentrations of boron in the Delta-Mendota, Modesto, and Turlock subbasins 34 (2003). 35
Chapter 12.0 Hydrology – Groundwater
Program Environmental Draft Impact Statement/Report 12-27 – April 2011
1 Source: Bertoldi et al. 1991 2
Figure 12-12. 3 Total Dissolved Solids Concentrations in Central Valley Groundwater Basin 4
San Joaquin River Restoration Program
Draft Program Environmental 12-28 – April 2011 Impact Statement/Report
Chloride. Chloride concentrations can be toxic to crops typically at concentrations 1 higher than 700 mg/L. However, salinity usually is the primary toxin to plants before 2 chloride alone reaches toxic levels. In the northwestern and north central part of the San 3 Joaquin River Hydrologic Region, along the course of the San Joaquin River and adjacent 4 lowlands, chloride concentrations are typically highest. High chloride in shallow 5 groundwater is predominantly caused by upward flow of saline-concentrated 6 groundwater (Bertoldi et al. 1991). DWR reported that areas of elevated chloride 7 concentrations have been identified in localized areas of the Tracy, Modesto, Turlock, 8 Merced, Chowchilla, and Madera subbasins (DWR 2003). Chloride concentrations have 9 been reported above the secondary MCL of 250 mg/L in the Modesto and Tracy 10 subbasins (Landon and Belitz 2008, Bennett et al. 2006). 11
Nitrates. Nitrates are prevalent typically in shallow, younger groundwater throughout 12 the San Joaquin River Hydrologic Region as a result of disposal of human and animal 13 waste products and fertilizers. Higher nitrate concentration, ranging from 5 to 30 mg/L, 14 may adversely affect select crops. The recommended maximum concentration in drinking 15 water for nitrate (as nitrogen) is 10 mg/L. Elevated concentrations of nitrate have been 16 reported in localized areas in the Tracy, Delta-Mendota, Modesto, Turlock, Merced, 17 Chowchilla, and Madera subbasins (DWR 2003). Nitrate concentrations have been 18 reported above the MCL of 10 mg/L in the Merced, Modesto, and Turlock subbasins 19 (Landon and Belitz 2008). 20
Arsenic. Elevated arsenic concentrations in groundwater in eastern Contra Costa, 21 Stanislaus, Merced, and western San Joaquin counties limit municipal water supply use 22 (SWRCB 1991). Arsenic concentrations have been reported above the MCL of 10 μg/L in 23 the Merced, Turlock, Modesto, Eastern San Joaquin, and Tracy subbasins (Bennett et al. 24 2006, Landon and Belitz 2008). 25
Selenium. In the southwest portion of the San Joaquin River Hydrologic Region, 26 selenium can be found as a naturally occurring element in soils and groundwater, and is 27 considered nontoxic to humans and animals below the MCL of 0.05 mg/L. However, the 28 southwest portion of this hydrologic region has been the subject of extensive selenium 29 studies because of the high rate of waterfowl mortality and embryo malformations in 30 birds nesting in selenium-enriched drainage areas. A median concentration of 10 to 11 31 mg/L was highest in the central and southern parts of the hydrologic region (south of Los 32 Banos and south of Mendota) (Bertoldi et al. 1991). 33
Dibromochloropropane. The most notable agricultural groundwater contaminant in the 34 hydrologic region is DBCP. DBCP is a soil fumigant and known carcinogen that is now 35 banned, but was extensively used on grapes and cotton (DWR 2003). The presence of this 36 pesticide coincides with land use patterns and is prevalent in groundwater at levels above 37 0.0005 mg/L north of Merced and Stockton. DBCP is typically observed in shallow, 38 younger groundwater recharged after 1980 in areas occupied by orchards and vineyards, 39 where DBCP was commonly used (Bertoldi et al. 1991). DBCP has been reported above 40 the MCL of 0.2 μg/L in the Merced, Turlock, Cosumnes, and Eastern San Joaquin 41 subbasins (Bennett et al. 2006, Landon and Belitz 2008). DWR reported that elevated 42
Chapter 12.0 Hydrology – Groundwater
Program Environmental Draft Impact Statement/Report 12-29 – April 2011
concentrations of DBCP have also been found in localized areas in the Modesto and 1 Madera subbasins (DWR 2003). 2
Radon. Radon, a naturally occurring radioactive element, has received more attention in 3 recent years because of adverse health effects documented in human occupancy areas 4 such as basements or cellars. No current water quality standards exist for this element; 5 however, the proposed MCL for radon-222 is 300 picocuries per liter (pCi/L). Radon 6 concentrations have been reported above the proposed MCL in the Merced, Modesto, 7 Turlock, Eastern San Joaquin, and Tracy subbasins (Bennett et al. 2006, Landon and 8 Belitz 2008). 9
Agriculture Subsurface Drainage 10 Inadequate drainage and accumulating salts have been persistent problems for irrigated 11 agriculture along the west side and in parts of the east side of the San Joaquin River 12 Hydrologic Region for more than a century. The most extensive drainage problems exist 13 on the west side of the San Joaquin River and Tulare Lake hydrologic regions. The 14 drainage problem developed as a result of imported water from man-made infrastructure, 15 naturally occurring saline soils, and distinctive geology that prevents natural drainage. 16
Soils on the west side of the San Joaquin River Hydrologic Region are derived from 17 marine sediments that make up the Coast Range and are high in salts and trace elements. 18 Irrigation of these soils has mobilized salts and trace elements and facilitated their 19 movement into the shallow groundwater. Much of the irrigation has been with imported 20 water, which has resulted in inadequate drainage, rising groundwater, and increasing soil 21 salinity. Where agricultural drains have been installed to control rising water tables, 22 drainage water frequently contains high concentrations of salts and trace elements 23 (Reclamation et al. 1990a). Events affecting drainage conditions on the west side of the 24 San Joaquin Valley are described in Table 12-6. 25
San Joaquin River Restoration Program
Draft Program Environmental 12-30 – April 2011 Impact Statement/Report
Table 12-6. 1 Events Affecting Drainage Conditions on West Side of San Joaquin Valley 2
Year Event
1870s
Widespread planting of grain on the western side of the San Joaquin Valley. Crops are irrigated with water from the San Joaquin and Kings rivers. Poor natural drainage, rising groundwater, and increasing soil salinity results in the removal or abandonment of farm land in production.
1900 – 1950 Heavy pumping of groundwater results in overdrafts and widespread land subsidence.
1951 CVP water transported through the Delta-Mendota Canal to irrigate 600,000 acres of land in the northern San Joaquin Valley. This water primarily replaces and supplements San Joaquin River water diverted at Friant Dam to the southern San Joaquin Valley.
1960
SWP authorized. San Luis Unit of the CVP authorized, which mandates construction of an interceptor drain to collect irrigation drainage water and transport it to the Delta. Reclamation's feasibility report for the San Luis Unit describes the drain as an earthen ditch that would drain 96,000 acres.
1962 Reclamation changes plans for the drain to a concrete-lined canal to drain 300,000 acres. 1964 Reclamation adds a regulating reservoir to the drain plans to temporarily retain drainage.
1965
Concerns raised about the potential effects of the discharge of untreated agricultural drainage water in the Delta and San Francisco Bay. A rider is added to CVP appropriations act by Congress in 1965 that requires the final point of discharge of the interceptor drain for the San Luis Unit to conform to water quality standards set by California and EPA.
1968
CVP San Luis Unit and the SWP begin delivering water to approximately 1,000,000 acres of agricultural lands in southern San Joaquin Valley. Construction of San Luis Drain begins. Kesterson Reservoir becomes part of a new National Wildlife Refuge managed jointly by Reclamation and the U.S. Fish and Wildlife Service.
Mid-1970 Reclamation decides to use the drainage reservoir to store and evaporate drainage water until the drainage canal to the Delta is completed.
1975
The first phase of Kesterson Reservoir, 85 miles of the main drain, and 120 miles of collector drains completed. Budget and environmental concerns halt work on the reservoir and drain. Reclamation, DWR, and SWRCB form the SJVDP to find a solution to valley drainage problems. Group recommends completing the drain to a discharge point in the Delta near Chipps Island.
1981 Reclamation begins a special study to fulfill requirements for a discharge permit from SWRCB.
1983 Selenium poisoning identified as the probable cause of deformities and mortalities of migratory waterfowl at Kesterson Reservoir.
1984 The SJVDP is established as a joint Federal and State effort to investigate drainage and related problems and identify possible solutions.
1985 The Secretary of the Interior halts the discharge of subsurface drainage water to Kesterson. 1986 Feeder drains to the San Luis Drain and reservoir are plugged.
1988
Kesterson Reservoir is closed. Vegetation is plowed under and low-lying areas filled. Contamination-related problems similar to Kesterson appear in parts of the Tulare Lake Hydrologic Region. Wildlife deformities and mortalities observed at several agricultural drainage evaporation ponds.
1990 SJVDP submits final report. Source: Reclamation et al. 1990a.
Key: CVP = Central Valley Project Delta = Sacramento-San Joaquin Delta DWR = California Department of Water Resources EPA = U.S. Environmental Protection Agency Reclamation = U.S. Department of the Interior, Bureau of Reclamation SJVDP = San Joaquin Valley Drainage Program SWP = State Water Project SWRCB = State Water Resources Control Board
Chapter 12.0 Hydrology – Groundwater
Program Environmental Draft Impact Statement/Report 12-31 – April 2011
Subsurface drainage problems extend along the western side of the San Joaquin River 1 and Tulare Lake hydrologic regions from the Delta on the north to the Tehachapi 2 Mountains south of Bakersfield. In some portions of this hydrologic region, natural 3 drainage conditions are inadequate to remove the quantities of deep percolation that 4 accrue to the water table where the upper, semiconfined aquifer is shallow. Therefore, 5 groundwater levels often encroach on the root zone of agricultural crops, and subsurface 6 drainage must be supplemented by constructed facilities for irrigation to be sustained. 7 Present problem areas were defined in the San Joaquin Valley Drainage Program 8 (SJVDP) (DWR 2005a) as locations where the water table is within 5 feet of the ground 9 surface at any time during the year. Potential problem areas were defined in the SJVDP at 10 locations where the water table is between 5 and 20 feet below the ground surface (DWR 11 2005a). To better understand the problem areas, water level data were collected, 12 beginning in 1991, from a network of monitoring wells in designated study areas to 13 establish acreage areas of particular depth-to-water intervals (DWR 2005a). The acreage 14 area and depth of shallow groundwater in the present and potential drainage problem 15 areas for 2001 are shown in Figure 12-13. (The term “shallow groundwater” is referred to 16 here as the highest zone of saturation down to a depth of approximately 20 feet below 17 ground surface.) 18
Few wells pump from this shallow groundwater zone because of high salinity 19 concentrations. (The term “salinity” is referred to here as the salt content of solutions 20 containing dissolved mineral salts.) Salinity is commonly measured as either TDS in 21 ppm or EC in microSiemens per centimeter (µS/cm). Salinity levels in shallow 22 groundwater in the San Joaquin River Hydrologic Region range from approximately 23 1,500 to 48,000 µS/cm, shown as EC in Figure 12-14. 24
Toxic and potentially toxic trace elements in some soil and shallow groundwater on the 25 western side of the San Joaquin River and Tulare Lake hydrologic regions are also of 26 concern. These trace elements greatly complicate the disposal of subsurface drainage 27 waters. Elements of primary concern are selenium, boron, molybdenum, and arsenic. 28 Selenium is of greatest concern because of the wide distribution and known toxicity of 29 selenium to aquatic animals and waterfowl, and was the only trace element sampled for 30 in 2001 (DWR 2005a). The three areas in the western San Joaquin Valley with the 31 highest concentrations of selenium are (1) alluvial fans near Panoche and Cantua creeks 32 in the central western valley, (2) an area west of the town of Lost Hills, and (3) the Buena 33 Vista Lake bed area (DWR 2005a). 34
San Joaquin River Restoration Program
Draft Program Environmental 12-32 – April 2011 Impact Statement/Report
Sou
rce:
DW
R 2
005a
Fi
gure
12-
13.
Shal
low
Gro
undw
ater
in P
rese
nt a
nd P
oten
tial S
an J
oaqu
in V
alle
y D
rain
age
Prob
lem
Are
as in
200
1
Chapter 12.0 Hydrology – Groundwater
Program Environmental Draft Impact Statement/Report 12-33 – April 2011
Sou
rce:
DW
R, 2
005a
Fi
gure
12-
14.
Elec
tric
al C
ondu
ctiv
ity o
f Sha
llow
Gro
undw
ater
in S
an J
oaqu
in V
alle
y in
200
1
San Joaquin River Restoration Program
Draft Program Environmental 12-34 – April 2011 Impact Statement/Report
Seepage and Waterlogging 1 Seepage and waterlogging of crops along the lower reaches of the San Joaquin River has 2 historically been an issue. High periodic streamflows and local flooding combined with 3 shallow groundwater near the San Joaquin River, and in the vicinity of its confluence 4 with major tributaries, have resulted in seepage-induced waterlogging damage to 5 low-lying farmland (Reclamation 1997). During flood-flow events, lateral seepage and 6 structural stability issues with existing project and nonproject levees have been identified 7 (RMC 2003, 2007). 8
In the western portion of the Stanislaus River watershed, groundwater pumping has 9 historically been used to control high groundwater levels and seepage-induced 10 waterlogging conditions. The seepage-induced waterlogging places neighboring crops 11 and farmland at risk and prevents cultivation of the land until summer, placing annual 12 crop production at risk. Concern has been raised that San Joaquin River flows in excess 13 of 16,000 cfs at Vernalis can result in seepage-induced waterlogging damage of adjacent 14 low-lying farmland in the south Delta area (Reclamation 1997). 15
Conditions that generally govern whether seepage may occur are shown schematically in 16 Figures 12-15, 12-16, and 12-17. Figure 12-15 depicts a condition under which vertical 17 infiltration and lateral seepage could occur into surrounding lands. Figure 12-16, like 18 Figure 12-15, depicts physical characteristics for which vertical infiltration and lateral 19 seepage could occur if soil conditions were favorable, because the surface water elevation 20 in the river is greater than the surrounding ground surface elevation. The conditions 21 illustrated in Figure 12-16 would require site-specific review of the shallow soil 22 conditions beneath the river and along the levees to verify that impermeable features 23 existed that would prevent vertical infiltration and lateral seepage from occurring. Figure 24 12-17 depicts physical characteristics for which lateral seepage would not be expected to 25 occur. 26
27 Figure 12-15. 28
River Surface Elevation Above Adjacent Land Surface Elevation 29
Chapter 12.0 Hydrology – Groundwater
Program Environmental Draft Impact Statement/Report 12-35 – April 2011
1 Figure 12-16. 2
Physical Barrier to Subsurface Flow Prevents Seepage 3
4 Figure 12-17. 5
River Surface Elevation Below Adjacent Land Surface Elevation 6
McBain and Trush (2002) identified and classified different reaches of the San Joaquin 7 River as “gaining” or “losing” reaches: 8
• Reach 1 – Outside the irrigation season, a minimum flow of 105 cfs is needed in 9 Reach 1 at the Friant Dam gaging station to obtain measurable flow at the 10 Gravelly Ford gage, which suggests a minimum loss of 105 cfs potentially due to 11 types of flow losses, including seepage, pumping from the river, and vegetative 12 consumptive use. During the summer and fall irrigation seasons, total flow losses 13 were estimated to increase to approximately 130 to 250 cfs, potentially due to an 14 increase in pumping from the San Joaquin River for riparian diversions. 15
• Reach 2 – A minimum flow of 75 cfs is needed at the Gravelly Ford gage to have 16 a measurable flow at the Chowchilla Bypass Bifurcation Structure gage, which 17 suggests that the minimum seepage loss is 75 cfs, outside the irrigation season 18 when riparian diversions are not in use. According to historical accounts, after 19 flooding in 2006, San Joaquin River water seeped from under the levees into 20 adjacent land (Steele 2008). During that flood event, bank seepage into fields and 21 vineyards was observed along Reach 2 from Gravelly Ford to the Chowchilla 22 Bypass. Seepage problems were also reported along the Chowchilla Bypass 23 below the bifurcation structure on both sides of the channel in 2006. 24
San Joaquin River Restoration Program
Draft Program Environmental 12-36 – April 2011 Impact Statement/Report
• Reach 3 – Downstream from Mendota Dam, seepage has been reported to occur 1 in agricultural fields adjacent to the San Joaquin River near the town of Firebaugh 2 (Steele 2008). RMC has reported that Reach 3 conveys up to 800 cfs of water for 3 irrigation diversions at Sack Dam, and that higher flows (less than 4,500 cfs) can 4 cause lateral seepage impacts, attributed to shallow groundwater resulting in 5 waterlogging of the crop root-zones adjacent to Reach 3 (2003, 2005, 2007). In 6 April 2006, during flood conditions, USGS recorded a mean maximum daily 7 discharge of 4,590 cfs for 2 days; DWR reported that seepage occurred on lands 8 in and adjacent to the floodway during this time. 9
• Reach 4 – A portion of Reach 4B, from Mariposa Bypass downstream, was 10 identified as potentially being a gaining reach. Observations of seepage along 11 Reach 4A of the San Joaquin River have been reported between Sack Dam and 12 SR Highway 152 (SJRRP 2007). The Opportunities and Constraints Analysis 13 Report and Refuge Flow Delivery Study (Moss 2002) described river conditions 14 and seepage along Reach 4 using observations of landowners. In particular, 15 riparian landowners along Reach 4A between Sack Dam and SR Highway 152, 16 reported seepage problems on adjacent lands downstream from Sack Dam at 17 flows in excess of 600 cfs (Moss 2002). Landowners made specific comments 18 regarding irrigation canals and drainage facilities in Reach 4A. Shallow 19 groundwater has contributed to lateral seepage resulting in waterlogging of the 20 crop root-zones adjacent to Reaches 3, 4, and 5 (RMC 2003, 2005). 21
• Reach 5 – Under current operating conditions, Reach 5 is identified as a gaining 22 reach. Shallow groundwater has contributed to lateral seepage, resulting in 23 waterlogging of the crop root-zones adjacent to Reach 5 (RMC 2003, 2005). 24
12.1.2 Groundwater Resources of Tulare Lake Hydrologic Region 25 This section discusses regional and subbasin hydrogeology, groundwater storage and 26 production, groundwater levels, land subsidence, groundwater quality, agriculture 27 subsurface drainage, and seepage and water logging in the Tulare Lake Hydrologic 28 Region. 29
Hydrogeology 30 The following sections describe regional hydrogeology and subbasin hydrogeology in the 31 Tulare Lake Hydrologic Region. 32
Regional Hydrogeology. Arid conditions and early agricultural development (pre-33 1900s) in the Tulare Lake Hydrologic Region have caused groundwater level declines, 34 which have resulted in stream-aquifer dynamics. Under predevelopment conditions, 35 groundwater-surface water interactions were very dynamic and depended on hydrologic 36 conditions. Rapid growth in the agricultural sector in the Tulare Lake Hydrologic Region 37 has resulted in groundwater development with increased groundwater pumping and 38 subsequent groundwater level declines. In some areas of critical overdraft, such as in 39 Kings and Kern counties, complete disconnection between groundwater and overlying 40 surface water systems has occurred. 41
Chapter 12.0 Hydrology – Groundwater
Program Environmental Draft Impact Statement/Report 12-37 – April 2011
The semiconfined aquifer in the Tulare Lake Hydrologic Region contains the same 1 hydrogeologic units as the San Joaquin River Hydrologic Region (Coast Range alluvium, 2 Sierra Nevada sediments, and flood-basin deposits), but the region also contains Tulare 3 Lake sediments in the axis of the valley (see Figure 12-2). The Corcoran Clay occurs at 4 depths between 300 and 900 feet below ground surface in the Tulare Lake Hydrologic 5 Region. The confined aquifer is overlain by the Corcoran Clay, but consists of the same 6 hydrogeologic units as the unconfined to semiconfined aquifer. The Tulare Lake 7 Hydrologic Region has semiconfined aquifer conditions to the west above the Corcoran 8 Clay layer, and on the east side of the region where the clay is not present. Tulare Lake 9 sediments present in the axis of the San Joaquin Valley have similar characteristics to 10 flood-basin deposits present in the San Joaquin River Hydrologic Region (see 11 Figure 12-2). 12
The semiconfined aquifer in the Tulare Lake Hydrologic Region is recharged by seepage 13 from streams, canals, infiltration of applied water, and subsurface inflow. Precipitation is 14 a source of recharge to the semiconfined aquifer only in Wet years (Reclamation 1997). 15 Seepage from streams and canals is highly variable and depends on annual hydrologic 16 conditions. Some of the water recharged to the semiconfined aquifer seeps through the 17 confining clay layers, including the Corcoran Clay, which are discontinuous in some 18 areas. Lateral flow from the semiconfined aquifer also recharges the lower confined 19 aquifer. 20
Subbasin Hydrogeology. The unconfined to semiconfined and confined groundwater 21 aquifer in the Kings and Westside subbasins consists of Tertiary and Quaternary age 22 unconsolidated continental deposits. The Quaternary deposits consist of older alluvium, 23 lacustrine and marsh deposits, younger alluvium, and flood-basin deposits. The lacustrine 24 and marsh deposits are part of the Corcoran Clay Member of the Tulare Formation (DWR 25 2003). To the south, the Kaweah Subbasin aquifers are made up of unconsolidated 26 deposits of Pliocene, Pleistocene, and Holocene age. The deposits comprise arkosic 27 sediments derived from the Sierra Nevada on the eastern side of the subbasin and are 28 generally unconfined to semiconfined. The arkosic sediments consist of continental 29 deposits, older alluvium, and younger alluvium. The unconsolidated deposits in the 30 western portion of the subbasin near the Tulare Lake beds are confined below the 31 Corcoran clay and consist of flood deposits and lacustrine and marsh deposits that 32 interfinger with the east side deposits (DWR 2003). To the south of the Kaweah 33 Subbasin, the Pleasant Valley Subbasin consists of unconfined Holocene age alluvium, 34 the Plio-Pleistocene Tulare Formation, and possibly part of the uppermost San Joaquin 35 Formation. South of the Kaweah Subbasin, the unconfined to semiconfined and confined 36 aquifers of the Tule Subbasin comprises continental deposits of Tertiary to Quaternary 37 age. The continental deposits consist of flood-basin deposits, younger alluvium, older 38 alluvium, the Tulare Formation, and undifferentiated continental deposits (DWR 2003). 39 West of the Tule Subbasin, the unconfined to semiconfined aquifer of the Tulare Lake 40 Subbasin includes younger and older alluvium, flood-basin deposits, lacustrine and marsh 41 deposits, and continental deposits. The younger alluvium is a very permeable 42 interstratified unit consisting of well-sorted clay, silt, sand, and gravel that is largely 43 above the water table. The older alluvium is moderately permeable and consists of poorly 44 sorted clay, silt, sand, and gravel, and yields large quantities of water to wells (DWR 45
San Joaquin River Restoration Program
Draft Program Environmental 12-38 – April 2011 Impact Statement/Report
2003). In the southernmost portion of the Tulare Lake Hydrologic Region in the San 1 Joaquin Valley Groundwater Basin, the Kern County Subbasin consists primarily of 2 unconfined to semiconfined and confined continental deposits of Tertiary and Quaternary 3 age. The deposits, from oldest to youngest, include the Olcese and Santa Margarita 4 formations, the Tulare Formation, the Kern River Formation, older alluvium/stream 5 deposits, younger alluvium, and coeval flood-basin deposits (DWR 2003). 6
Groundwater Storage and Production 7 The following section describes historical and existing groundwater storage and 8 production conditions in the Tulare Lake Hydrologic Region. 9
Groundwater Storage. Usable storage capacity for the Tulare Lake Hydrologic Region 10 was estimated to be approximately 28 MAF in 1993 (DWR 1994). The perennial yield of 11 the Tulare Lake Hydrologic Region was estimated by DWR to be approximately 4.6 12 MAF, and was considered directly dependent on the amount of recharge received by the 13 groundwater basin (DWR 1994). 14
The cumulative change in groundwater storage from 1970 to 1992 for the San Joaquin 15 Valley Groundwater Basin, including the San Joaquin River and Tulare Lake hydrologic 16 regions, is discussed above and presented in Figure 12-4. Figure 12-5 illustrates changes 17 in groundwater storage from 1962 through 2003 for the Central Valley, including the San 18 Joaquin River and Tulare Lake hydrologic regions, as simulated using CVHM (USGS 19 2009). These groundwater storage fluctuations represent average regional fluctuations 20 that likely occurred in the San Joaquin Valley Groundwater Basin. 21
According to DWR Bulletin 160-09, the net change in groundwater storage for water 22 years 1998, 1999, 2000, 2001, 2002, 2003, 2004, and 2005 was 263, negative 1,938, 23 negative 1,625, negative 4,115, negative 3,927, negative 2,975, negative 4,002, and 24 negative 106 TAF, respectively (DWR 2009). According to the California Water Plan 25 Update (DWR 2005b), five subbasins (Kings, Tulare, Kern County, Kaweah, and Tule) 26 in the Tulare Lake Hydrologic Region are in critical overdraft conditions. 27
Groundwater Production. Agricultural development in the Tulare Lake Hydrologic 28 Region began in the 1800s, and by 1922, more than 1.2 million acres of land were used 29 for agriculture. Groundwater has been the primary source of irrigation water for the 30 region. Figure 12-18 illustrates changes in groundwater pumping and irrigated 31 agricultural acreage for the Tulare Lake Hydrologic Region from 1922 to 1980 (the 32 source for the data was discussed in the San Joaquin River Hydrologic Region, 33 “Groundwater Storage and Production” section). Groundwater pumping ranged from 2 34 MAF in the 1920s and 1930s to 8 MAF in the 1960s. Groundwater pumping increased 35 from the 1920s through 1949, when surface water deliveries began via the Friant-Kern 36 Canal to the east side of the region. Groundwater pumping continued to increase through 37 the early 1960s until local surface water facilities and imports of CVP water from the San 38 Luis Division, and SWP water from the California Aqueduct, caused a reduction in 39 regional groundwater pumping. In the mid-1970s, additional CVP supplies were imported 40 to the southern half of the Tulare Lake Hydrologic Region once the Cross Valley Canal 41 was constructed. This reduction in groundwater pumping worked to reduce overdraft 42
Chapter 12.0 Hydrology – Groundwater
Program Environmental Draft Impact Statement/Report 12-39 – April 2011
conditions in the region. However, an increase in groundwater pumping occurred in the 1 late 1980s and early 1990s in response to reduced surface water deliveries during the 2 drought period of 1987 to 1992. Table 12-7 describes the timeline of events that have 3 affected groundwater production in the Tulare Lake Hydrologic Region for the period 4 shown in Figure 12-18. Figure 12-7 illustrates estimated groundwater pumping for the 5 entire Central Valley, including the San Joaquin River and Tulare Lake hydrologic 6 regions, from 1962 to 2003. 7
San Joaquin River Restoration Program
Draft Program Environmental 12-40 – April 2011 Impact Statement/Report
01234
024681012
1920
1930
1940
1950
1960
1970
1980
1990
Irrigated Agricultural Acreage (millions of acres)
Groundwater Pumping (millions of acre-feet)
End-
of-W
ater
Yea
r
1935
-194
4:
WET
PER
IOD
1959
-196
1:
DR
Y PE
RIO
D19
76-1
977:
D
RO
UG
HT
PER
IOD
1928
-193
4:
DR
OU
GH
T PE
RIO
D
BASI
N IN
OVE
RD
RAF
TBA
SIN
IN O
VER
DR
AFT
DU
RIN
G S
OM
E YE
ARS
1987
-199
2:D
RO
UG
HT
PER
IOD
S
ourc
e: R
ecla
mat
ion
et a
l. 19
90b.
N
ote:
D
ata
avai
labl
e fro
m 1
922
to 1
980.
Dat
a de
velo
ped
as p
art o
f the
Cen
tral V
alle
y G
roun
d-S
urfa
ce W
ater
Mod
el (R
ecla
mat
ion
et a
l, 19
90b)
Le
gend
: G
roun
dwat
er P
umpi
ng
Irr
igat
ed a
gric
ultu
ral a
crea
ge
Figu
re 1
2-18
. H
isto
rical
Gro
undw
ater
Pum
ping
and
Irrig
ated
Agr
icul
tura
l Acr
eage
for T
ular
e La
ke H
ydro
logi
c R
egio
n
San Joaquin River Restoration Program
Draft Program Environmental 12-41 – April 2011 Impact Statement/Report
Table 12-7. 1 Timeline of Historical Events Affecting Groundwater Production 2
in Tulare Lake Hydrologic Region 3 Date Historical Event
1928 – 1934 Drought Period 1935 – 1944 Wet Period
1943 Friant Dam Online 1949 Friant-Kern Canal Online 1954 Isabella Dam Online 1956 Madera Canal Online
1959 – 1961 Dry Period 1962 Success Dam Online, Terminus Dam Online 1967 San Luis Dam/Canal Online 1967 California Aqueduct Online 1967 Oroville Dam Online 1975 Cross Valley Canal Online
1976 – 1977 Drought Period 1987 – 1992 Drought Period
Groundwater pumped in the Tulare Lake Hydrologic Region accounts for about 33 4 percent of the region’s total annual water supply and also accounts for 35 percent of all 5 groundwater use in the State (DWR 2005a). The region’s groundwater supply was 6 reported to make up approximately 10 percent of the State’s total agricultural and urban 7 use water supply (DWR 2005a). 8
In 1990, an estimated 5.2 MAF of groundwater was pumped from the Tulare Lake 9 Hydrologic Region (DWR 1994). This was approximately 630 TAF greater than the 10 estimated perennial yield (DWR 1994). 11
Typical groundwater production within the subbasins in the Tulare Lake Hydrologic 12 Region is presented in Table 12-8 (DWR 1998). As discussed in the San Joaquin River 13 Hydrologic Region section above, Burt (2005) estimated gross irrigation well pumping 14 for some of the Friant Division contractors between 1987 and 2003 (Burt 2005). The 15 estimated gross groundwater pumping for numerous WDs and IDs in the Tulare Lake 16 Hydrologic Region is shown in Table 12-9 (Burt 2005). Gross pumping estimates for 17 Friant Division M&I users, including the City of Fresno, City of Orange Cove, City of 18 Lindsay, and Fresno County Water Works District Number 18, were not available from 19 Burt (2005). The City of Fresno reports that using 250 wells, the Water Division of the 20 City of Fresno pumps approximately 146 million gallons or 448 acre-feet of water per 21 day, which is roughly equivalent to 164 TAF/year (City of Fresno 2009). 22
23
San Joaquin River Restoration Program
Draft Program Environmental 12-42 – April 2011 Impact Statement/Report
Table 12-8. 1 Typical Groundwater Production in 2
Tulare Lake Hydrologic Region 3 Subbasin Extraction
(TAF/year) Kings 1,790 Kern 1,400
Kaweah 760 Tulare Lake 670
Tule 660 Westside 210
Pleasant Valley 100 Source: DWR 1998, 2003 Key: TAF/year = thousand acre-feet per year
Table 12-9. 4 Gross Groundwater Pumping for Friant Division Contractors in 5
Tulare Lake Hydrologic Region 6
District Average Gross Groundwater Pumping
(TAF/year)
1987−1992 1987−1999 1987−2003 Arvin-Edison WSD 207 184 190 Delano-Earlimart ID 53 35 33 Exeter ID 27 22 22 Fresno ID 224 135 123 Garfield ID 0.3 0.3 0.3 International ID 1 0.6 0.6 Ivanhoe ID 21 17 17 Lewis Creek WD 1 0.9 1 Lindmore ID 44 36 36 Lindsay-Strathmore ID 13 12 13 Lower Tule River ID 203 131 137 Orange Cove ID 44 41 42 Porterville ID 31 26 26 Saucelito ID 25 18 17 Shafter-Wasco ID 74 62 60 Southern San Joaquin MUD 93 72 66 Stone Corral ID 9 9 9 Tea Pot Dome WD 3 2 2 Terra Bella ID 14 13 13 Tulare ID 181 102 98 Source: Burt 2005 Key: ID = Irrigation District MUD = Municipal Utilities District
TAF/year = thousand acre-feet per year WD = Water District WSD = Water Storage District
Chapter 12.0 Hydrology – Groundwater
Program Environmental Draft Impact Statement/Report 12-43 – April 2011
Groundwater Levels 1 Groundwater level declines in shallow wells in central Fresno County have been 2 substantial, beginning in the early 1940s and decreasing approximately 50 to 100 feet 3 through the 1980s (Williamson et al. 1989). Large groundwater level declines occurred in 4 the southwestern corner of the Westside Subbasin until the late 1960s. Beginning in 5 1967, groundwater levels declined more than 100 feet but made a near full recovery 6 because of decreases in pumping in response to surface water supplies imported through 7 the San Luis Canal (Williamson et al. 1989). 8
Groundwater levels in the lower confined aquifer in the west side of the Tulare Lake 9 Hydrologic Region declined as much as 400 feet from predevelopment to the 1960s 10 (Williamson et al. 1989). Groundwater levels measured in the Tulare Lake Subbasin 11 fluctuated and, in general, increased by more than 24 feet in some areas during the 10-12 year period of spring 1978 to spring 1988 (DWR 2003). The Tulare Lake bed area has 13 experienced the greatest groundwater level fluctuations, with some of the steepest 14 decreases in groundwater wells, and the steepest increases in groundwater wells (DWR 15 2003). 16
Figure 12-8 presents groundwater contours of the semiconfined aquifer in spring 1970, 17 modified from DWR’s spring 1970 map (DWR 2008). Groundwater levels in the 18 semiconfined aquifer of the Tulare Lake Hydrologic Region generally decreased during 19 the 10-year period of spring 1970 to spring 1980 (DWR 2008). The semiconfined 20 groundwater aquifer levels decreased as much as 50 feet in the same 10-year period in 21 portions of Fresno, Kings, Kern, and Tulare counties (DWR 2008). 22
The 1987 − 1992 drought resulted in increased groundwater pumping due to deficiencies 23 in surface water deliveries. Water levels declined by 20 to 30 feet throughout most of the 24 central and eastern parts of the San Joaquin Valley (Westlands WD 1995). 25
Groundwater conditions in the semiconfined aquifer for spring 1995 are shown in Figure 26 12-9. Following the 1987 − 1992 drought, groundwater levels in the San Joaquin Valley 27 continued to decline. In spring 1993, a groundwater level contour map of the San Joaquin 28 Valley showed depression areas resulting from groundwater withdrawals in the mid-29 valley area near the center of Fresno County, near the City of Fresno, along the county 30 border between Tulare and Kings counties, in southwestern Kings County, and in parts of 31 Kern County. Groundwater conditions in spring 1995 indicate that groundwater levels in 32 the unconfined to semiconfined aquifer were beginning to recover. 33
Groundwater conditions in the unconfined to semiconfined aquifers of the San Joaquin 34 Valley Groundwater Basin for spring 2007 are illustrated in Figure 12-10. The 35 groundwater elevation contours in Figure 12-10 were modified from the spring 2007 36 contour map of the semiconfined aquifers available on a DWR Web site (DWR 2009). 37 The groundwater elevation contours indicate that groundwater levels have nearly 38 recovered to predrought conditions in the basin. Groundwater elevations for spring 2007 39 conditions were also presented in a series of groundwater subbasin contour maps 40 available on the DWR Web site (DWR 2009). Table 12-10 summarizes the ranges in 41
42
San Joaquin River Restoration Program
Draft Program Environmental 12-44 – April 2011 Impact Statement/Report
groundwater elevations reported on the groundwater subbasin contour maps of the 1 unconfined to semiconfined aquifer in the Tulare Lake Hydrologic Region for spring 2 2006. 3
Table 12-10. 4 Spring 2006 Contour Map Groundwater Elevations in 5
Subbasins of Tulare Lake Hydrologic Region 6
Subbasin Range in Groundwater
Elevations (feet above msl)
Kaweah 100 500 Kern County 40 300 Kings 0 440 Pleasant Valley 250 2 400 Tulare Lake 50 240 Tule 60 500 Westside 40 1 300 Source: DWR 2009 Notes: 1 Last map available in 1996 2
Key: Last map available in 2004
msl = mean sea level
Groundwater elevations in the semiconfined aquifers of the Kings Subbasin ranged 7 between 0 feet and 440 feet above msl in spring 2006 and increased from west to east 8 towards the Sierra Nevada. Spring 2006 groundwater contours were not available for the 9 Westside Subbasin (DWR 2008). The range in groundwater elevations presented above 10 represents spring 1996 conditions in the Westside Subbasin (DWR 2008). Groundwater 11 elevations in the Pleasant Valley Subbasin were not contoured for spring 2006, but were 12 available for spring 2004, and ranged between 250 feet and 400 feet above msl. 13 Groundwater elevations in the semiconfined aquifers of the Kaweah Subbasin ranged 14 between 120 feet and 500 feet above msl in spring 2006. Groundwater elevations in this 15 subbasin also increased from west to east towards the Sierra Nevada. Groundwater 16 elevations in the unconfined to semiconfined aquifer of the Tulare Lake Subbasin were 17 only available in the northern part of the subbasin for spring 2006. Groundwater 18 elevations ranged between 50 feet and 240 feet above msl in this portion of the subbasin. 19 Groundwater elevations in the unconfined to semiconfined aquifer of the Tule Subbasin 20 increased from west to east and ranged between 60 feet and 500 feet above msl in spring 21 2006. Groundwater elevations in the unconfined to semiconfined aquifer in the Kern 22 Subbasin ranged between 40 feet and 300 feet above msl in spring 2006. 23
Land Subsidence 24 Figure 12-11 shows land subsidence contours from 1926 through 1970 for the San 25 Joaquin River and Tulare Lake Hydrologic Regions. The Arvin-Maricopa area is 700 26 square miles, and is located 20 miles south of Bakersfield, mostly in Kern County. Two 27 confining beds, the A-clay and the C-clay, underlie the area; the C-clay is the more 28 extensive of the two beds. Maximum land subsidence in the Arvin-Maricopa area 29 exceeds 9 feet. Land subsidence in parts of the Arvin-Maricopa area has also been 30 influenced by oil and gas withdrawal and near-surface hydrocompaction. The Tulare-31
Chapter 12.0 Hydrology – Groundwater
Program Environmental Draft Impact Statement/Report 12-45 – April 2011
Wasco area between Fresno and Bakersfield in the Tulare Lake Hydrologic Region 1 experienced land subsidence that exceeded 12 feet between 1926 and 1970 (Williamson 2 et al. 1989). (See Section 12.1.1, “Groundwater Resources of San Joaquin River 3 Hydrologic Region” above for additional discussion on land subsidence.) 4
Groundwater Quality 5 Similar to the San Joaquin River Hydrologic Region, groundwater quality in the Tulare 6 Lake Hydrologic Region varies considerably throughout the area, but in general, is 7 suitable for most urban and agricultural uses (DWR 2003). Primary constituents of 8 concern on a regional level include TDS, boron, nitrates, arsenic, selenium, DBCP, and 9 radon. Future site-specific projects relating to Settlement implementation may require a 10 more detailed assessment of local groundwater quality issues. USGS GAMA program 11 data are currently available for the southeast San Joaquin Valley and the Kern County 12 Subbasin study units in the Tulare Lake Hydrologic Region (Burton and Belitz 2008, 13 Shelton et al. 2008). The Southeast San Joaquin Valley study area, as defined by the 14 GAMA study, includes portions of Fresno, Tulare, and King counties, which in turn 15 include the Kings, Kaweah, Tulare Lake, and Tule subbasins (Burton and Belitz 2008). 16
Total Dissolved Solids and Electrical Conductivity. Concentrations of TDS vary 17 considerably in the Tulare Lake Hydrologic Region and depend on the groundwater zone. 18 In general, TDS concentrations exceeding the secondary MCL of 500 mg/L are primarily 19 found along the west side and trough or central portions of this hydrologic region. Along 20 the west side, these higher concentrations are a result of recharged streamflow originating 21 from marine deposits. In the trough, or center portions, the concentrations are a result of 22 the buildup of salt because of evaporation and poor drainage (DWR 2003). For this 23 reason, groundwater use as an agricultural water supply is often limited because of these 24 higher concentrations above the Corcoran Clay in the western portion of Fresno and 25 Kings counties (SWRCB 1991). TDS concentrations have been reported above the MCL 26 of 500 mg/L in the Kaweah, Kings, and Kern County subbasins (Burton and Belitz 2008, 27 Shelton et al. 2008). Elevated concentrations of TDS have been reported in the Westside, 28 Pleasant Valley, and Kern County subbasins (DWR 2003). 29
TDS for the entire Central Valley is discussed in the San Joaquin River Hydrologic 30 Region groundwater quality section, and is shown in Figure 12-12 (this figure does not 31 show vertical variations in TDS). 32
Boron. High concentrations of boron have been reported in the southern portion of the 33 Tulare Lake Hydrologic Region and in the northernmost edge of the greater San Joaquin 34 Valley west of the San Joaquin River to the Kings-Fresno county line (Bertoldi et al. 35 1991). Elevated concentrations of boron have been reported in the Kings and Westside 36 subbasins (DWR 2003). Boron concentrations above the California Department of Public 37 Health NL of 1,000 μg/L have been reported in Tulare Lake Subbasin (Burton and Belitz 38 2008). 39
Nitrates. Nitrates are prevalent typically in shallow younger groundwater throughout 40 the Tulare Lake Hydrologic Region as a result of disposal of human and animal waste 41 products and the applications of fertilizers. Higher nitrate concentrations, ranging from 42
San Joaquin River Restoration Program
Draft Program Environmental 12-46 – April 2011 Impact Statement/Report
5 to 30 mg/L, may adversely affect select crops. The recommended maximum 1 concentration in drinking water for nitrate (as nitrogen) is 10 mg/L. 2
Because the occurrence of nitrate is anthropogenic, most areas of higher concentrations 3 are extremely localized and usually are attributed to localized position sources such as 4 septic tanks, dairies, or feed lots (Bertoldi et al. 1991). Areas of higher nitrate 5 concentrations have been observed near the town of Shafer, and concentrations exceeding 6 the MCL of 10 mg/L have been documented in areas south of Bakersfield and the greater 7 Fresno metropolitan area, indicating surface contamination (DWR 2003). DWR reports 8 that elevated concentrations of nitrate have been found in the Kings, Kaweah, Tule, and 9 Kern County subbasins (DWR 2003). Recently, nitrate concentrations were reported 10 above the MCL of 10 mg/L in groundwater in the Kings and Kern County subbasins 11 (Burton and Belitz 2008; Shelton et al. 2008). 12
Arsenic. Arsenic concentrations have been reported above the MCL of 10 μg/L in 13 groundwater in the southwest corner of the Tulare Lake Hydrologic Region, particularly 14 in areas of the Kern Subbasin near Bakersfield (SWRCB 1991). Furthermore, arsenic 15 levels have been reported above the MCL in the Kings, Tulare Lake, and Tule subbasins 16 (Burton and Belitz 2008).These high level areas of arsenic often occur locally and appear 17 to be associated with lake bed deposits. 18
Selenium. In the western portion of the Tulare Lake Hydrologic Region, selenium can 19 be found as a naturally occurring element where soils are formed from marine sediments 20 of the Coast Ranges (DWR 2007). Selenium concentrations reported from a location on 21 the Kern Lake bed are above the MCL of 50 μg/L (DWR 2007). 22
Dibromochloropropane. The most notable agricultural groundwater contaminant in the 23 Region is DBCP. As mentioned, DBCP is a soil fumigant and known carcinogen that is 24 now banned, but was extensively used on grapes and cotton (DWR 2003). The presence 25 of this pesticide coincides with land use patterns and is prevalent in groundwater at levels 26 above 0.0005 mg/L near Bakersfield and Fresno. DBCP is typically observed in shallow, 27 younger groundwater recharged after 1980 in areas occupied by orchards and vineyards, 28 where DBCP was commonly used (Bertoldi et al. 1991). DBCP has been reported above 29 the MCL of 0.2 μg/L in the Kings, Tule, and Kern County subbasins (Burton and Belitz 30 2008, Shelton et al. 2008). 31
Radon. Radon, a naturally occurring radioactive element, has been reported above the 32 MCL of 300 pCi/L, but below the alternative MCL of 4,000 pCi/L, in the Kings, Kaweah, 33 Tule, Tulare Lake, and Kern County subbasins (Burton and Belitz 2008, Shelton et al. 34 2008). 35
Agricultural Subsurface Drainage 36 As described for the San Joaquin River Hydrologic Region, salinity and trace elements in 37 some soil and shallow groundwater on the western side of the Tulare Lake Hydrologic 38 Region are also of concern (see Figures 12-13 and 12-14). The Tulare Lake Hydrologic 39 Region contains a portion of the San Joaquin Valley Groundwater Basin, which is a 40 closed system and is internally drained. Subsurface drainage problems associated with the 41
Chapter 12.0 Hydrology – Groundwater
Program Environmental Draft Impact Statement/Report 12-47 – April 2011
west side of the San Joaquin Valley Groundwater Basin extend from north to south in the 1 Tulare Lake Hydrologic Region. Recent reports indicate that long-term groundwater 2 storage in these areas is increasing, further aggravating the drainage problem (DWR 3 1994). 4
Seepage and Waterlogging 5 The northern boundary of the Tulare Lake Hydrologic Region with the San Joaquin River 6 Hydrologic Region is partially bounded by Reaches 1 and 2 of the San Joaquin River. 7 Seepage problems identified in Reaches 1 and 2 influence local groundwater conditions 8 in the Kings Subbasin in the Tulare Lake Hydrologic Region (see Figures 12-15 through 9 12-17). (See the “Groundwater Resources of San Joaquin River Hydrologic Region” 10 section above for additional discussion on seepage and waterlogging along the San 11 Joaquin River.) 12
12.2 Regulatory Setting 13
This section presents applicable Federal, State, and local laws and regulations associated 14 with groundwater resources in the study area. 15
12.2.1 Federal 16 This section presents applicable Federal regulations associated with groundwater 17 resources in the study area. 18
Clean Water Act Sections 401 and 404 19 See Chapter 5.0, “Biological Resources – Fisheries,” for a discussion of sections 401 and 20 404 of the Clean Water Act. 21
Rivers and Harbors Act of 1899, as Amended (Sections 14 and 10) 22 See Chapter 5.0, “Biological Resources – Fisheries,” for a discussion of Section 10 of the 23 Rivers and Harbors Act. Under Section 14 of the Rivers and Harbors Act of 1899 (33 24 USC 408), referred to as “Section 408,” the Secretary of the Army, on the 25 recommendation of the Chief of Engineers, may grant permission for alteration of the 26 Federal levee system by a non-Federal entity if the alteration would not be injurious to 27 the public. These actions could include degradations, raisings, realignments or other 28 alteration or modifications to the Federal levee system that would cause significant 29 changes to an authorized flood control project’s scope. Potential actions under program 30 alternatives would potentially be subject to requirements under Section 408. 31
12.2.2 State 32 This section describes State regulations and policies associated with groundwater 33 resources in the study area. 34
Assembly Bill 3030 – Groundwater Management Act 35 The Groundwater Management Act (AB 3030) is found in Sections 10750 – 10756 of the 36 California Water Code and provides a systematic procedure for an existing local agency 37 to develop a groundwater management plan. AB 3030 gives the local agency the 38
San Joaquin River Restoration Program
Draft Program Environmental 12-48 – April 2011 Impact Statement/Report
authority to develop a groundwater management plan in groundwater basins defined in 1 DWR Bulletin 118 and to raise revenue to pay for facilities to manage the basin 2 (extraction, recharge, conveyance, quality (DWR, 1975)). AB 3030 consists of 12 3 technical components, but others may be identified in the groundwater management plan. 4 An AB 3030 plan can be developed after a public hearing, and adoption of a resolution of 5 intention to adopt a groundwater management plan. According to DWR (2003), 6 groundwater management plans have been adopted for several Friant Division 7 contractors, including Arvin-Edison Water Storage District (WSD), Chowchilla WD, 8 Fresno ID, Gravelly Ford WD, Lower Tule River ID, Orange Cove ID, Porterville ID, 9 Saucelito ID, Stone Corral ID, Shafter-Wasco ID, Terra Bella ID, and Tulare ID. 10 Groundwater management plans have also been developed for a number of counties, 11 cities, and other private districts in the San Joaquin Valley Groundwater Basin (see Table 12 12-11). Only AB 3030 groundwater management plans acknowledged on DWR’s Web 13 site have been listed in Table 12-11. 14
Chapter 12.0 Hydrology – Groundwater
Program Environmental Draft Impact Statement/Report 12-49 – April 2011
Table 12-11. 1 Existing AB 3030 Plans in San Joaquin Valley Groundwater Basin 2
Subbasin County or Agency Cosumnes Sacramento Metropolitan Water Authority
Delta-Mendota
Panoche WD San Luis and Delta-Mendota Water Authority North is composed of the following agencies/companies:
Banta-Carbona ID City of Tracy Del Puerto WD Patterson WD Plain View WD San Joaquin County FC&WCD West Side ID West Stanislaus ID
Eastern San Joaquin
North San Joaquin WCD Oakdale ID San Joaquin County FC&WCD South San Joaquin ID Stanislaus County Stockton East WD Woodbridge ID
Kaweah
Kaweah Delta WCD Kings County WD Porterville ID Stone Coral ID Tulare ID
Alta ID Consolidated ID Fresno County Fresno ID James ID Kings River Conservation District Kings River WD Liberty Canal Company Liberty WD Liberty Mill Race Company Mid Valley WD Orange Cove ID Raisin City WD Riverdale ID
Madera Gravelly Ford WD
Modesto
City of Modesto City of Oakdale City of Riverbank Del Este Water Company Modesto ID Oakdale ID Stanislaus County
San Joaquin River Restoration Program
Draft Program Environmental 12-50 – April 2011 Impact Statement/Report
Table 12-11. 1 Existing AB 3030 Plans in San Joaquin Valley Groundwater Basin (contd.) 2
Subbasin County or Agency
Tracy
San Luis and Delta-Mendota Water Authority North is composed of the following agencies/companies:
Banta-Carbona ID City of Tracy Del Puerto WD Patterson WD Plain View WD San Joaquin County FC&WCD West Side ID West Stanislaus ID
Tule Lower Tule ID Porterville ID Saucelito ID Terra Bella ID
Turlock Eastside WD Westside Westlands WD Source: DWR 2003 Key: AB = Assembly Bill FC&WCD = Flood Control and Water Conservation District ID = Irrigation District WCD = Water Conservation District WD = Water District WSD = Water Storage District
Senate Bill 1938 – Amendments to Local Groundwater Management Code 3 SB 1938 was developed to amend the existing law related to groundwater management 4 by local agencies, and was signed into law in September 2002. The law requires that any 5 public agency seeking State funds from DWR to construct groundwater projects or 6 groundwater quality projects prepare and implement a groundwater management plan 7 with certain specified components. Previously, the law did not require specific plan 8 components. SB 1938 does not apply to the SJRRP because State funds are not being 9 sought from DWR to construct groundwater projects or groundwater quality projects. 10
Other Existing Management Policies 11 Existing law regarding groundwater is controlled by jurisdictional decisions. The 12 California Water Code provides limited authority over groundwater use by allowing the 13 formation of special districts (or water agencies) through general or special legislation. 14 DWR identifies nine groundwater management agencies formed by such special 15 legislation (DWR 1994), none of which are located in the Central Valley area. 16
Another means of groundwater management exists for surface water agencies that can 17 show that surface water delivered to a given area recharges a local aquifer. Several 18 agencies have used this statutory authority granted by the legislature to levy charges for 19 groundwater extraction. The only agency in the San Joaquin Valley that has exercised 20 this authority is the Rosedale-Rio Bravo WSD in the Tulare Lake Hydrologic Region. 21

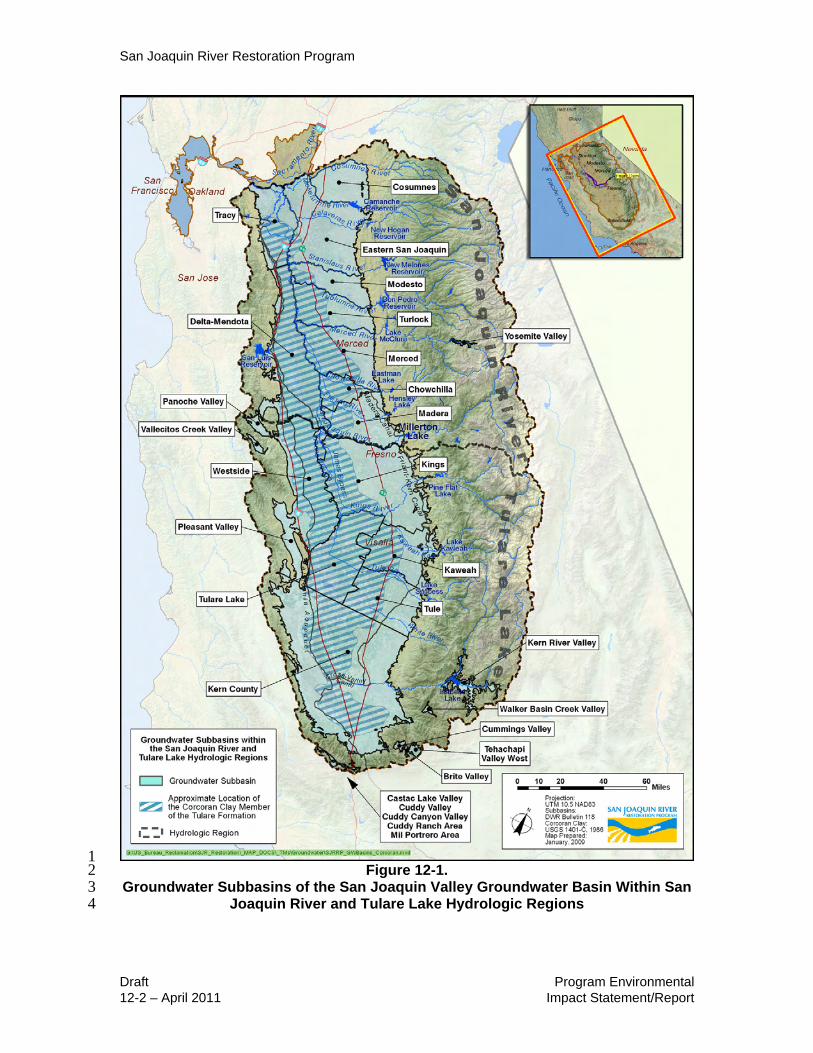
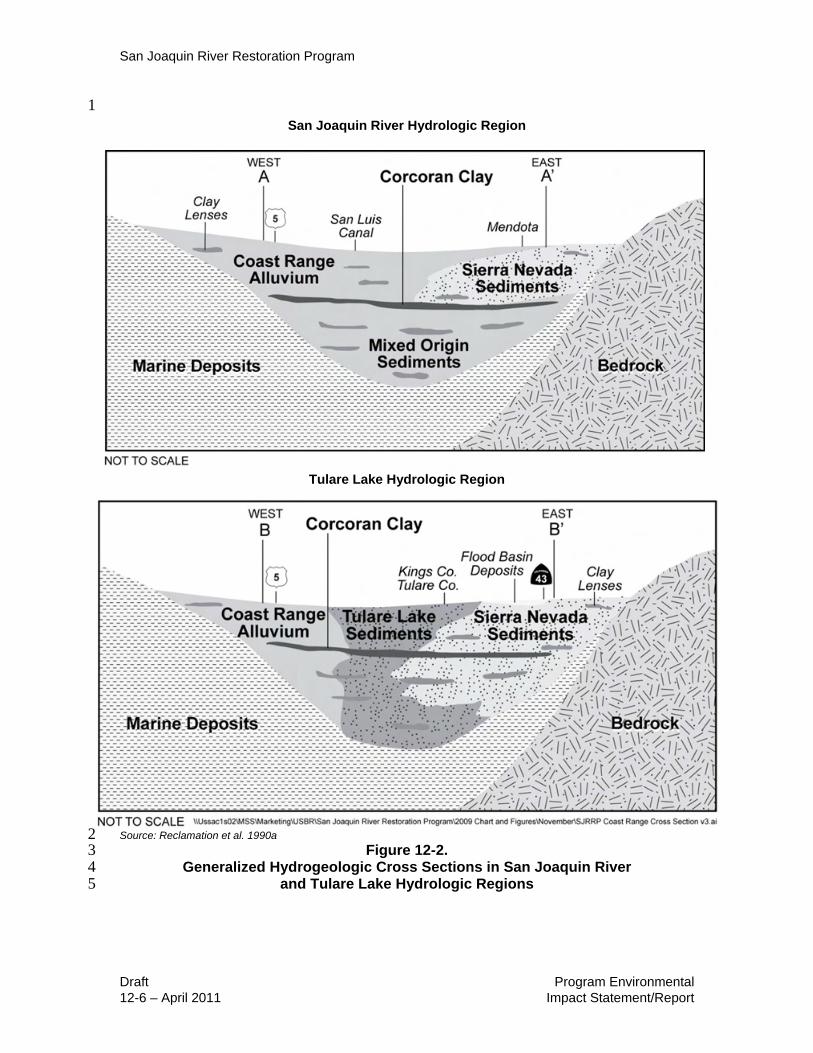
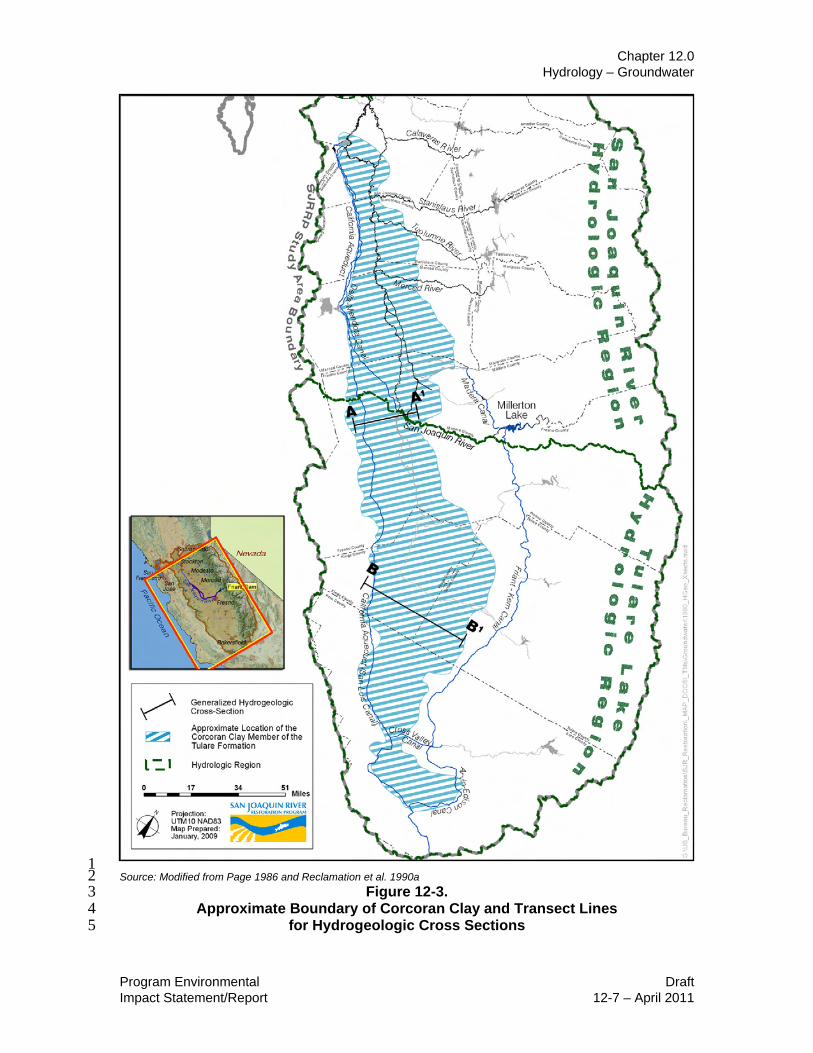

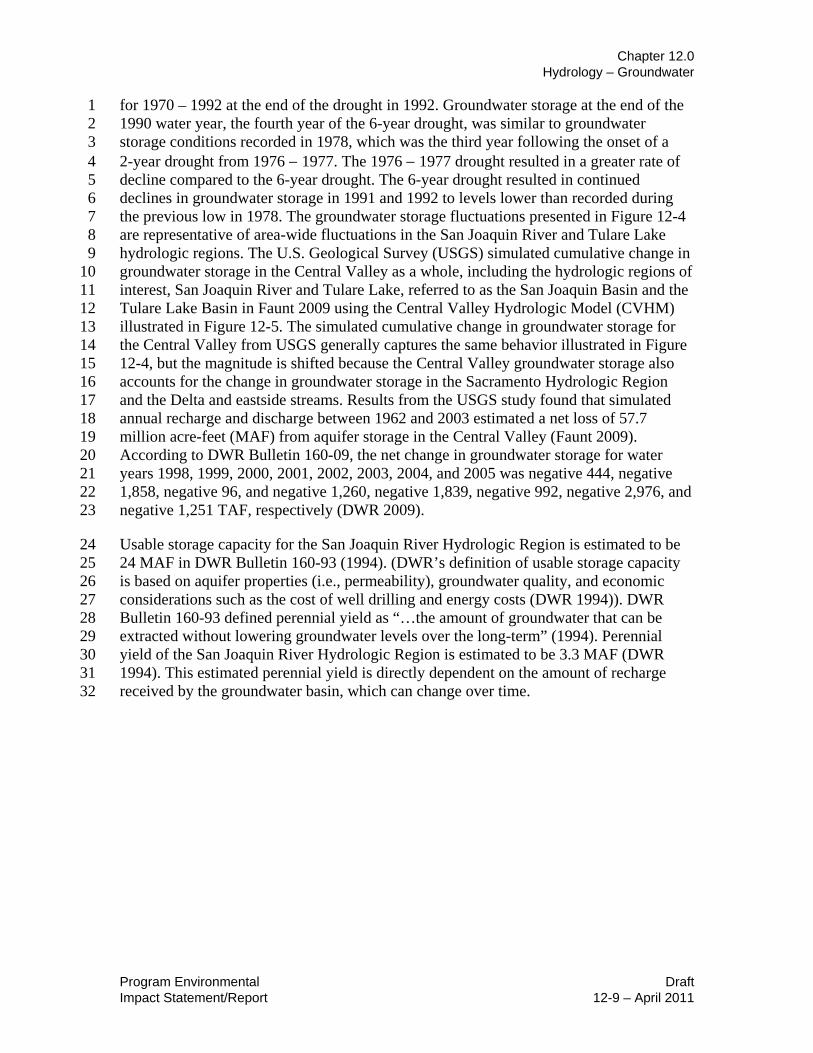


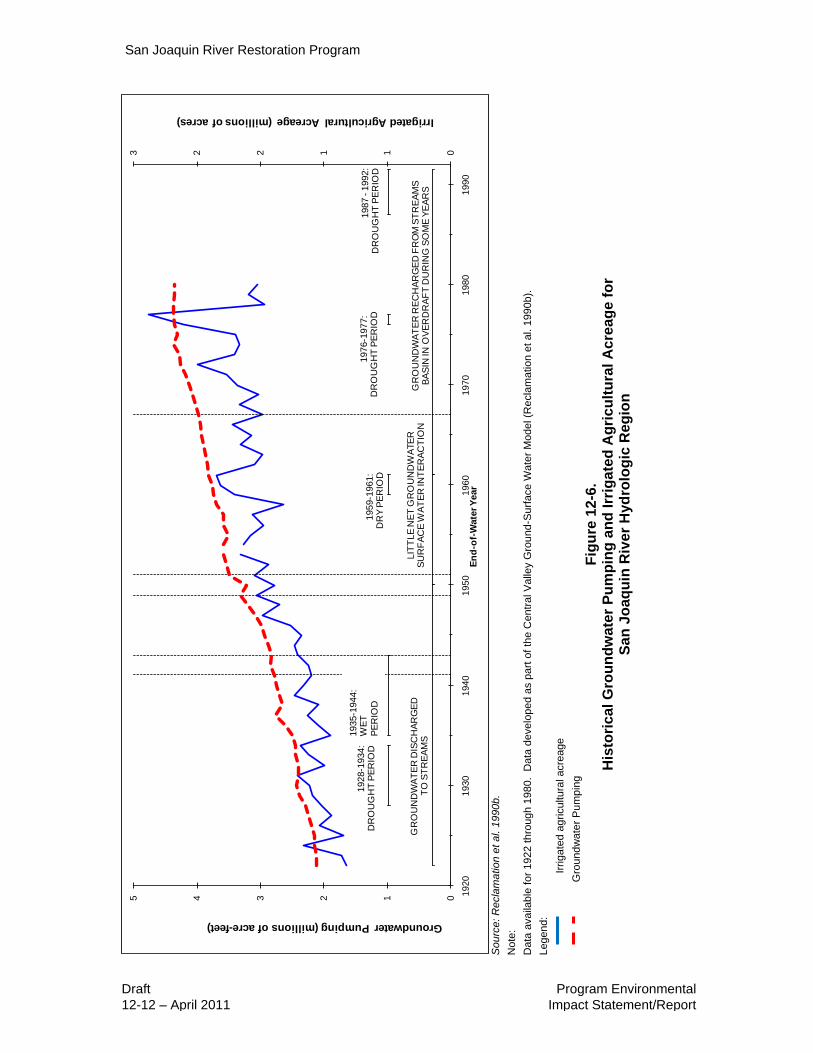
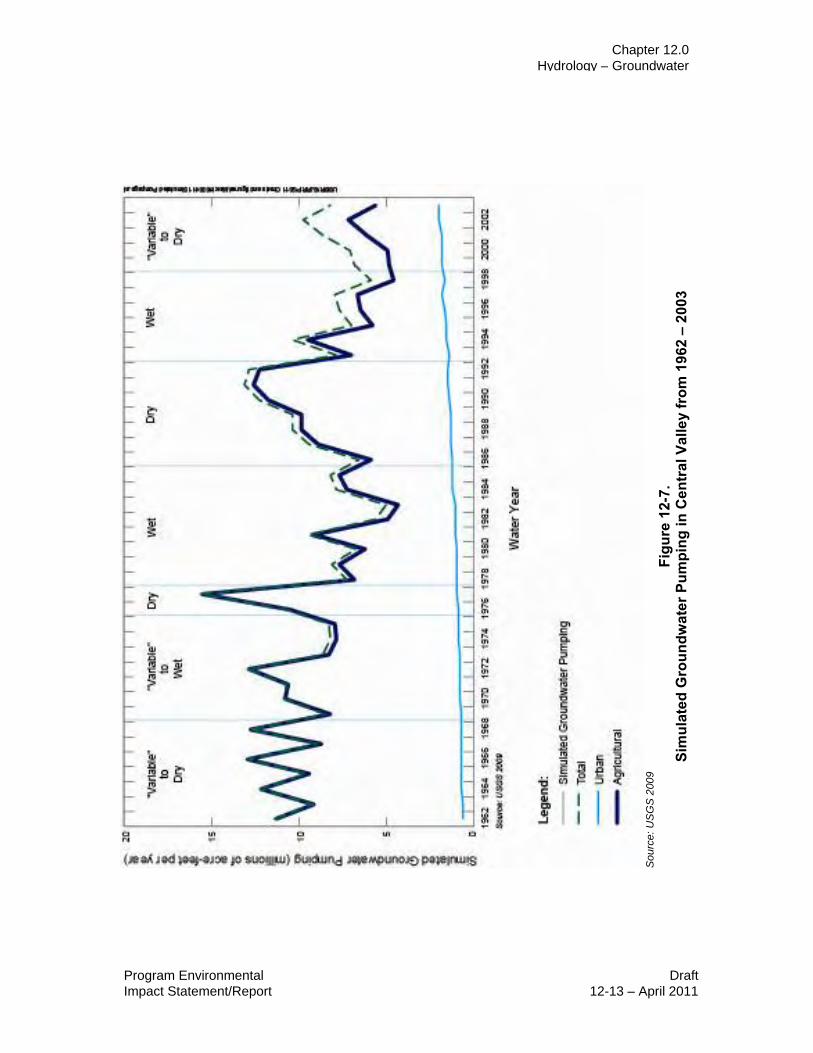
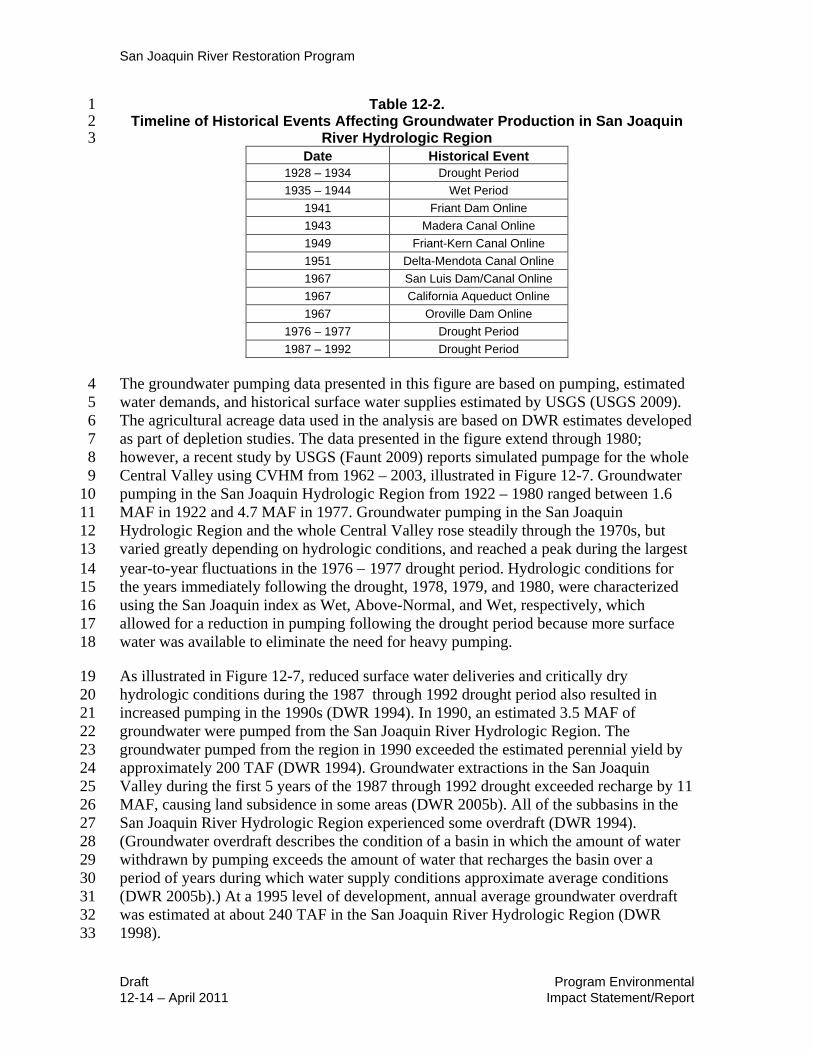
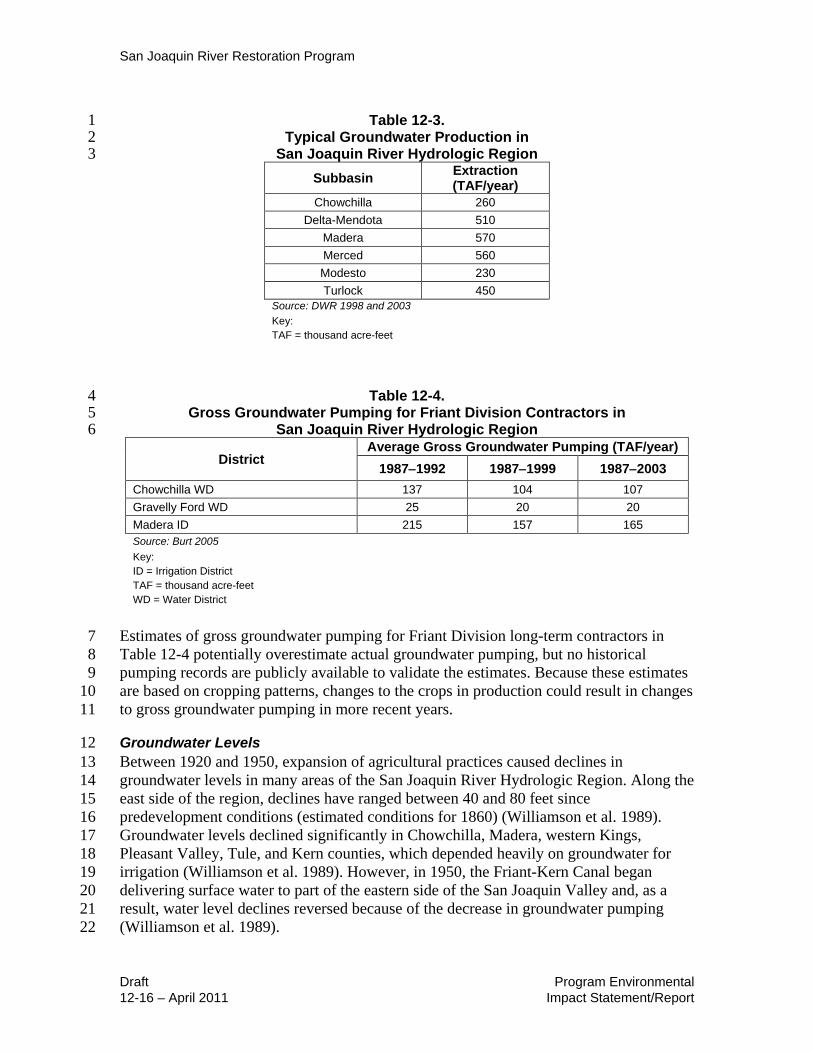

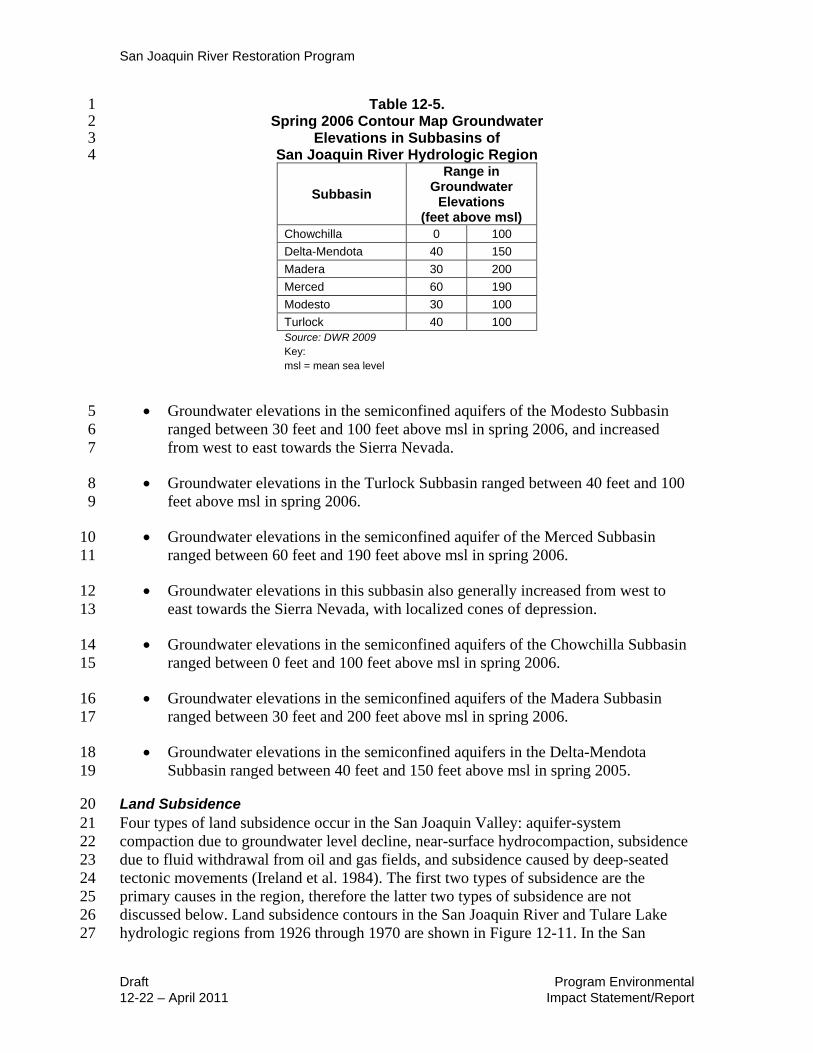


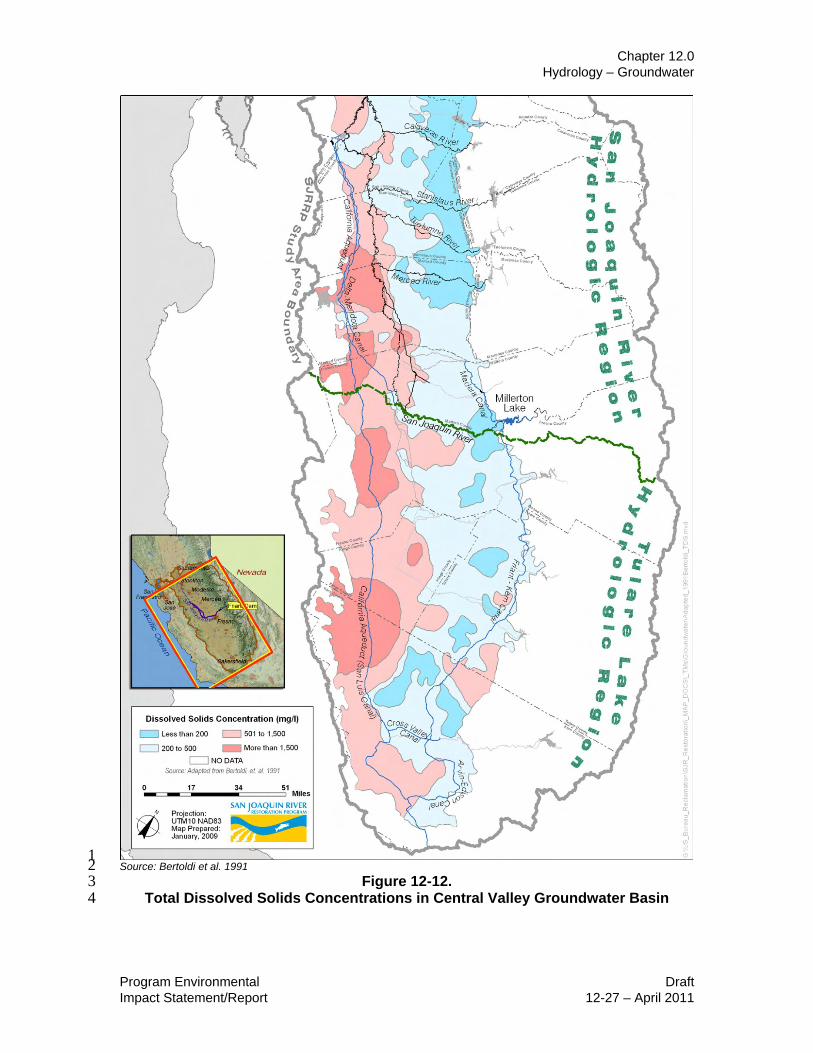

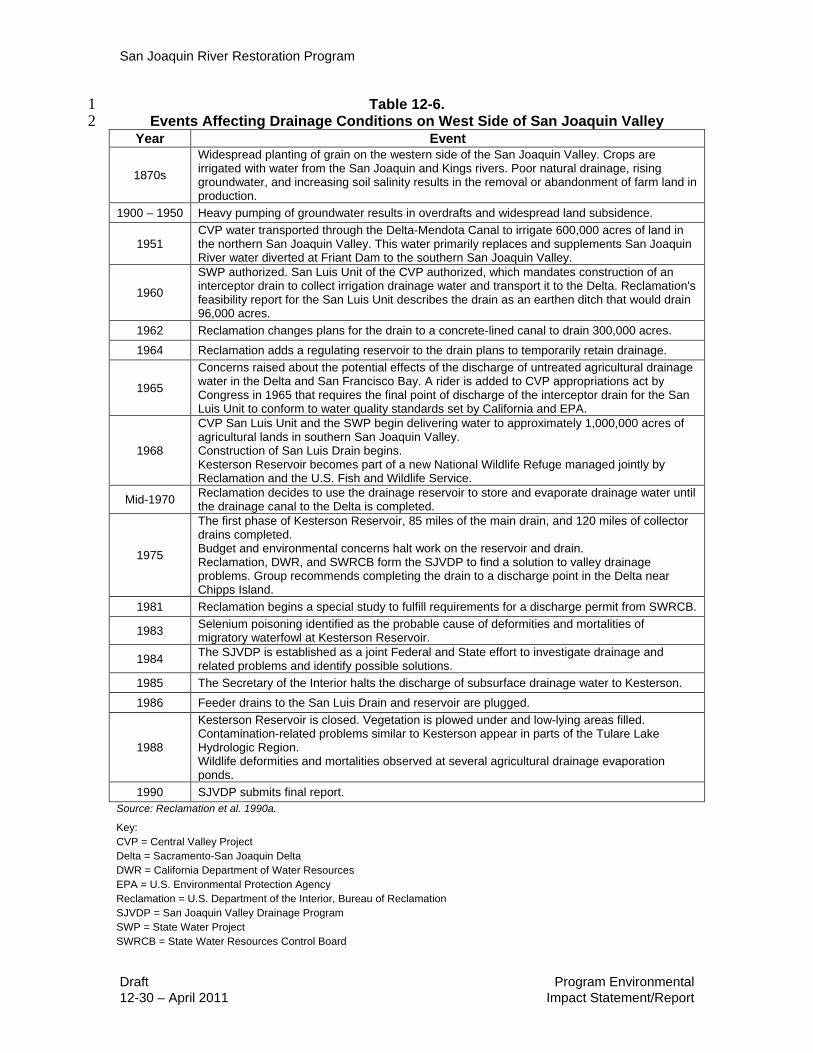
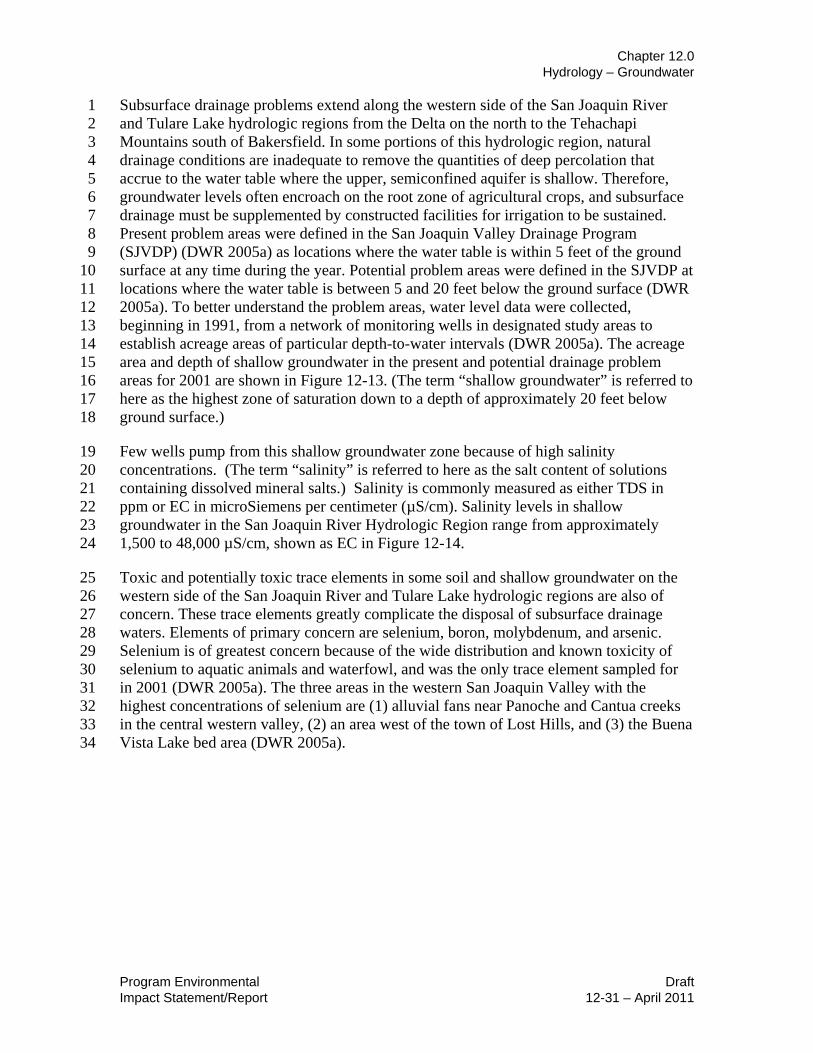
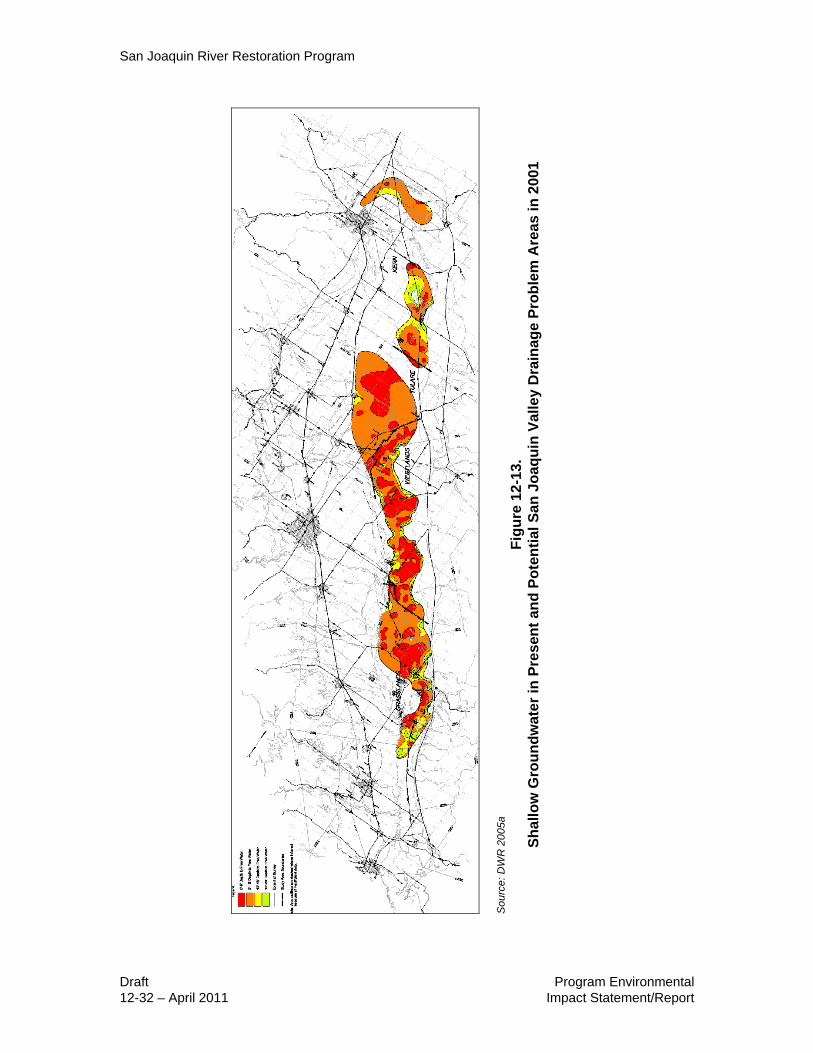
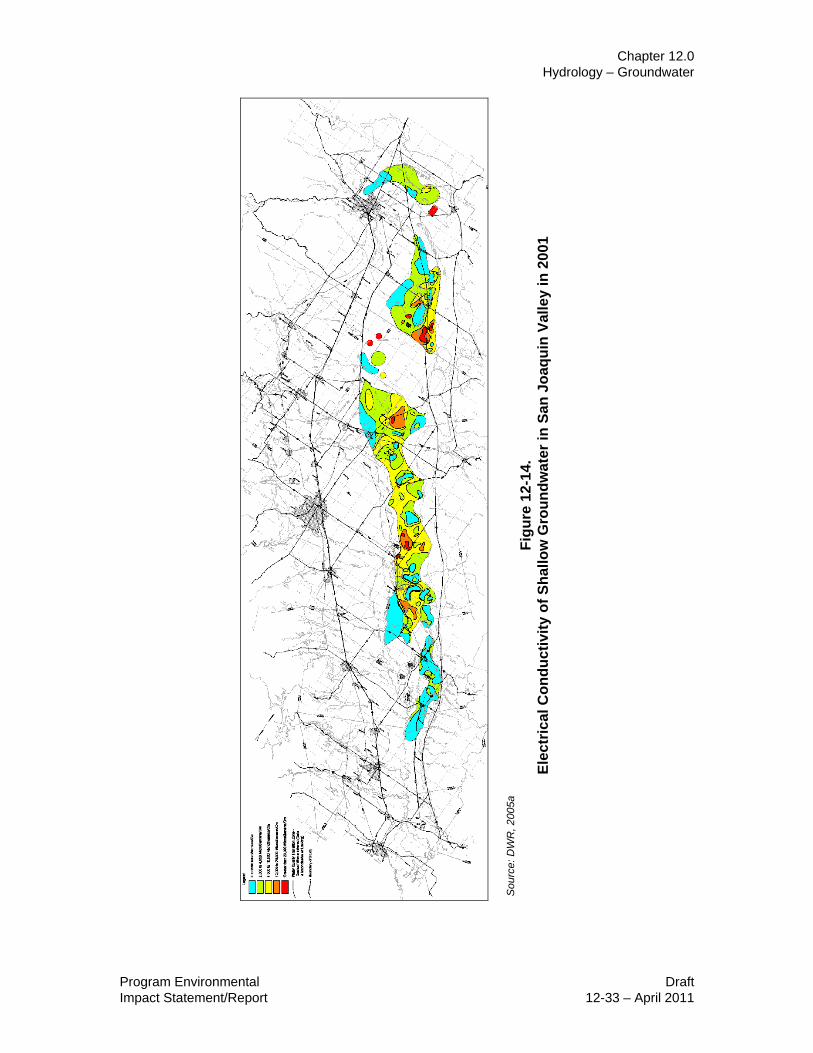
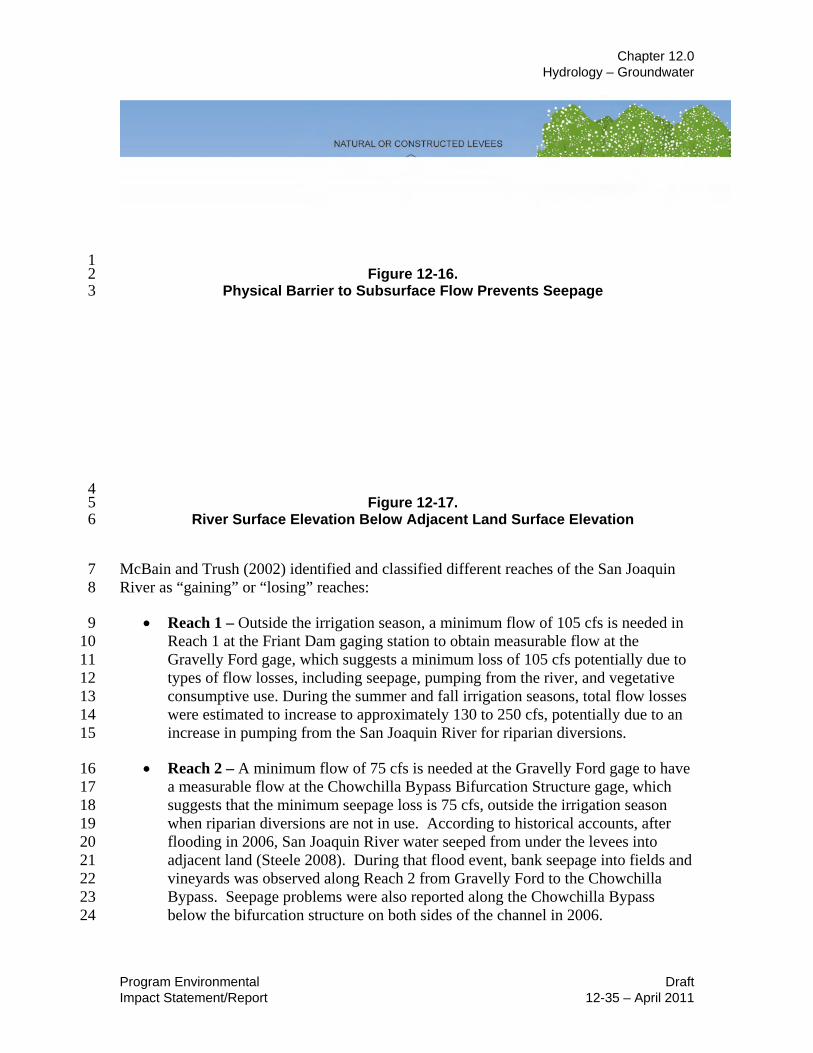
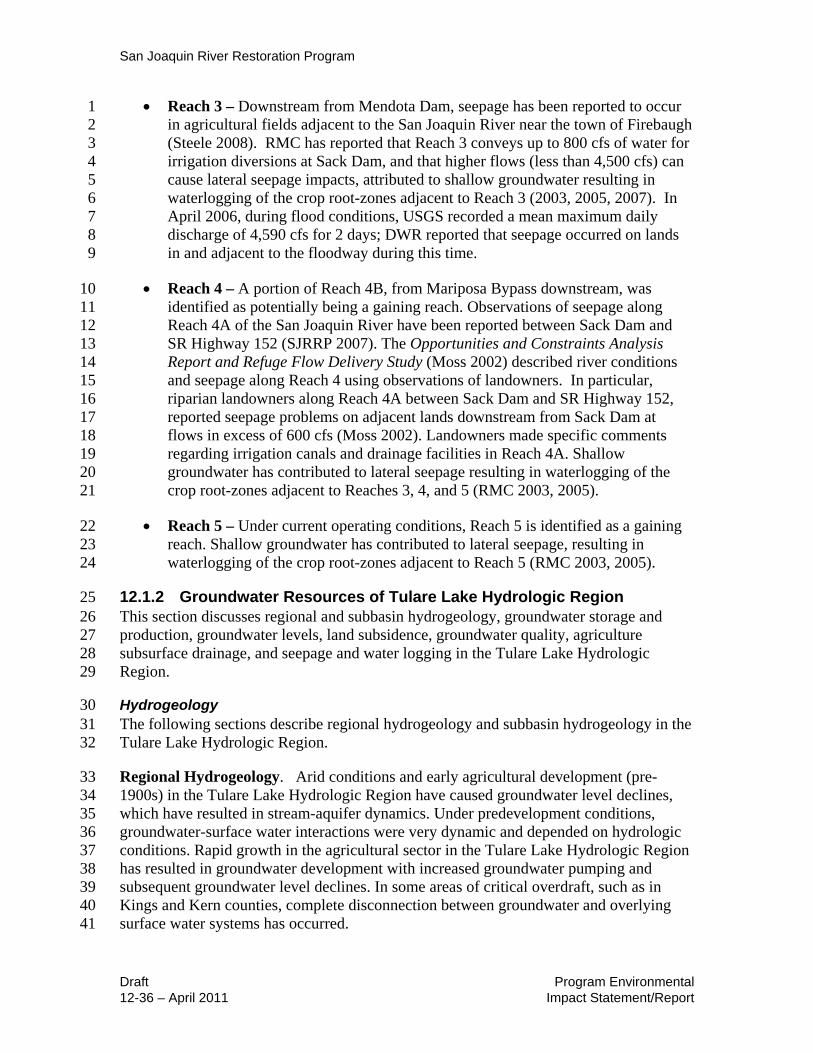


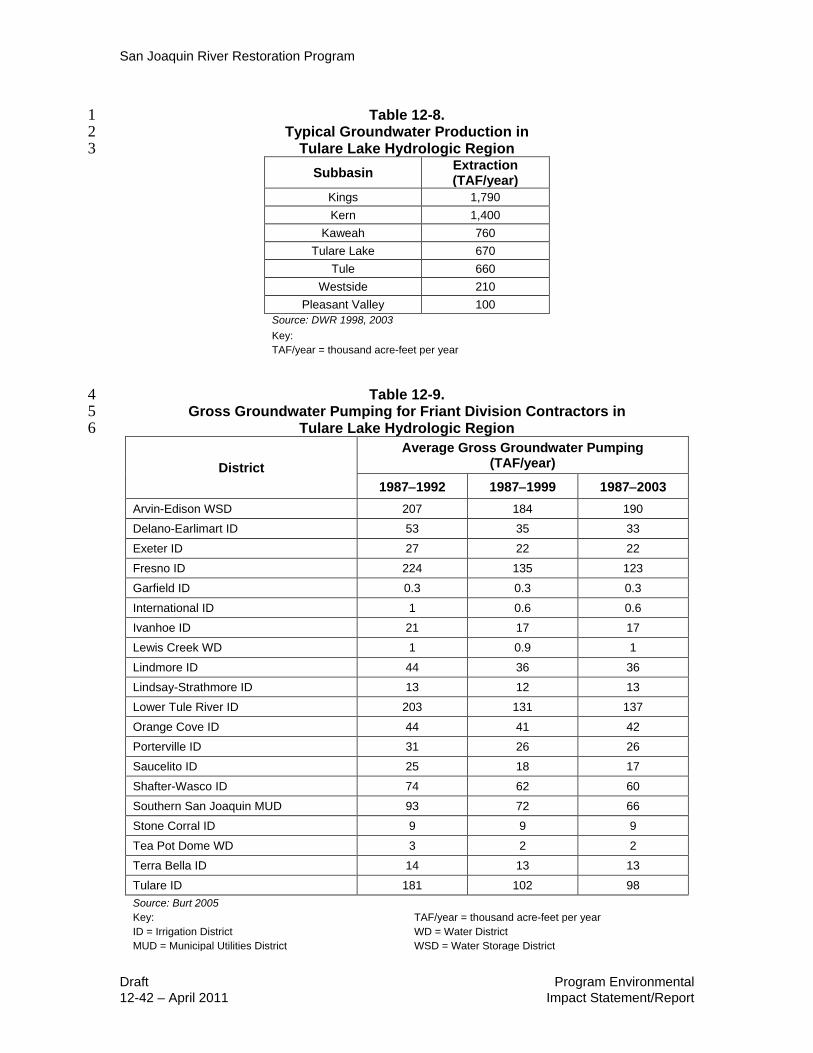


![[hydrology] groundwater hydrology - david k. todd (2005).pdf](https://static.documents.pub/doc/80x56/577c77961a28abe0548cb0b1/hydrology-groundwater-hydrology-david-k-todd-2005pdf.jpg)


![[Hydrology] groundwater hydrology david k. todd (2005)](https://static.documents.pub/doc/80x56/55a8e6001a28ab6c2f8b4687/hydrology-groundwater-hydrology-david-k-todd-2005-55b0d9a792c06.jpg)

