1 Chapter 6 Markets and Efficiency Ch6: positive economics; how markets function in the case of natural resources Ch7: normative economics; public policy SECTION III General Natural Resource Issues
Transcript
1
Chapter 6
Markets and Efficiency
Ch6: positive economics; how markets function in the case of natural resourcesCh7: normative economics; public policy
• The resource that is open to unrestricted use by anyone who might wish to utilize it: ocean fishery, hunting, public parks…
• “The Tragedy of the Commons” (Garrett Hardin, Science, Vol. 162, 1968, pp. 1243-1248): Open-access externality that leads to overuse of the resource is the diminution in the quality of the pasture as more and more animals are out on it
• Page 95, Table 6-2, public beach: the fifth visitor reduces the value of the beach to the four already there, from $20 to $18 for each one
10
Open-Access Resource
• Public beach example: efficient visitation level is 4 visitors; benefits – costs = $80 – $48 = $32
• $32 is a return attributable to the resource itself (the beach); this is the resource rent produced by the beach
• If visitation level had risen to 8 people, then benefits – costs = $96 – $96 = $0; open access had led to the dissipation or disappearance of all natural resource rent
11
Open Access and the Dissipation of Resource Rent
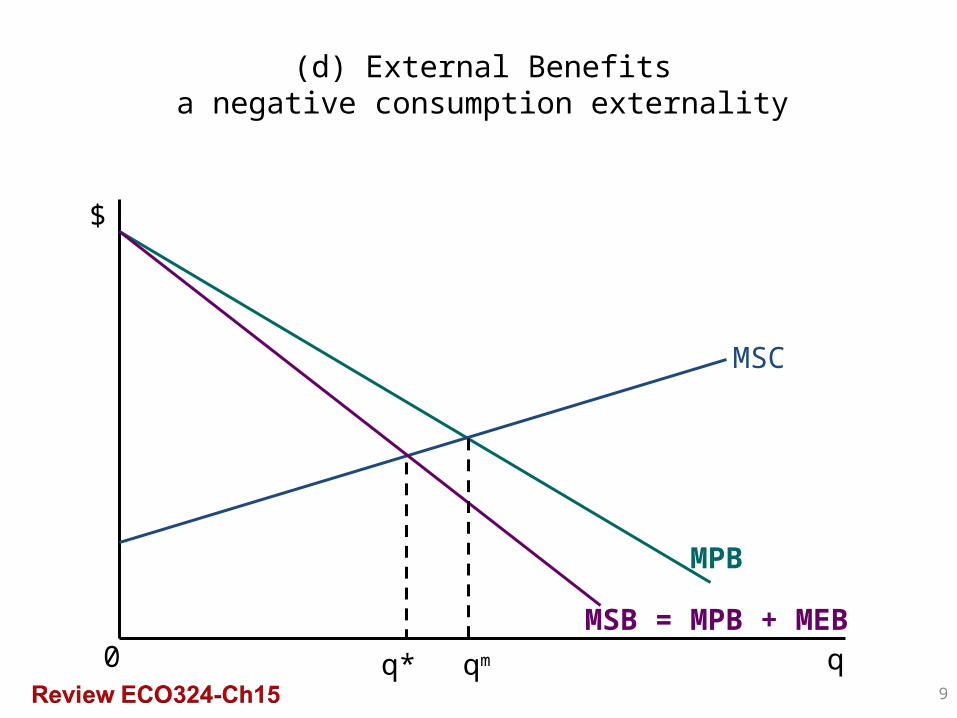
5. Environmental Damage:A Negative Externality
• Environmental economists are interested in externalities that damage the atmosphere, water supply, natural resources, and overall quality of life
12
Chapter 3 Modeling Market Failure
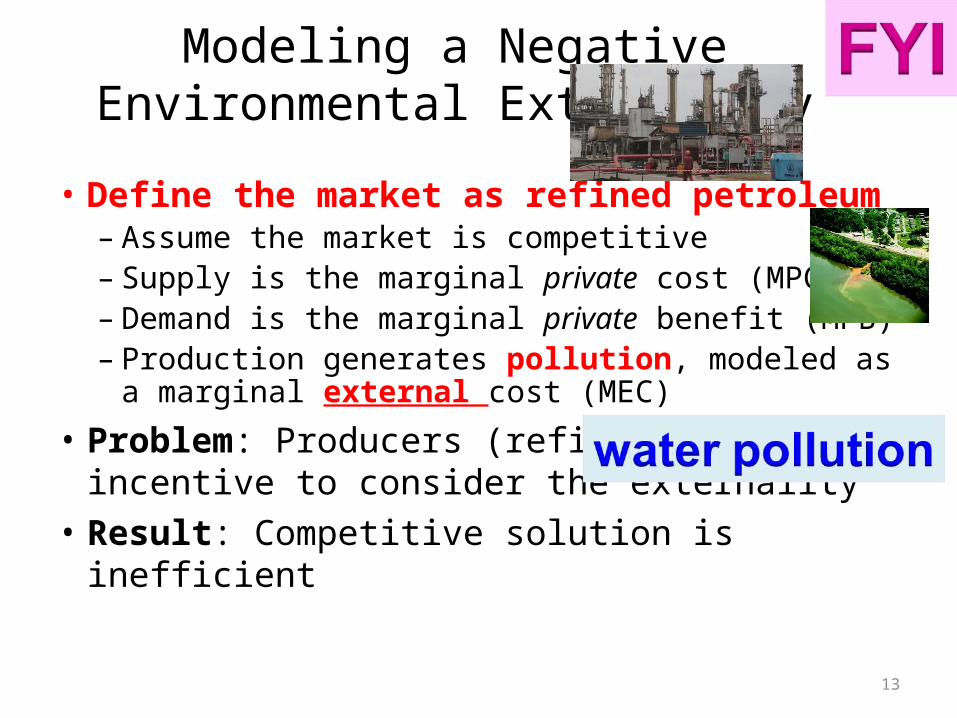
Modeling a Negative Environmental Externality
• Define the market as refined petroleum – Assume the market is competitive – Supply is the marginal private cost (MPC)– Demand is the marginal private benefit (MPB)– Production generates pollution, modeled as a
marginal external cost (MEC)
• Problem: Producers (refineries) have no incentive to consider the externality
• Result: Competitive solution is inefficient13
Finding a Competitive SolutionRefined Petroleum Market
• S: P = 10.0 + 0.075Q• D: P = 42.0 - 0.125Q, where
Q is in thousands of barrels per day• Since S is MPC and D is MPB, rewrite as MPC = 10.0 + 0.075Q MPB = 42.0 - 0.125Q
(P means private)• Find the competitive solution and analyze
14
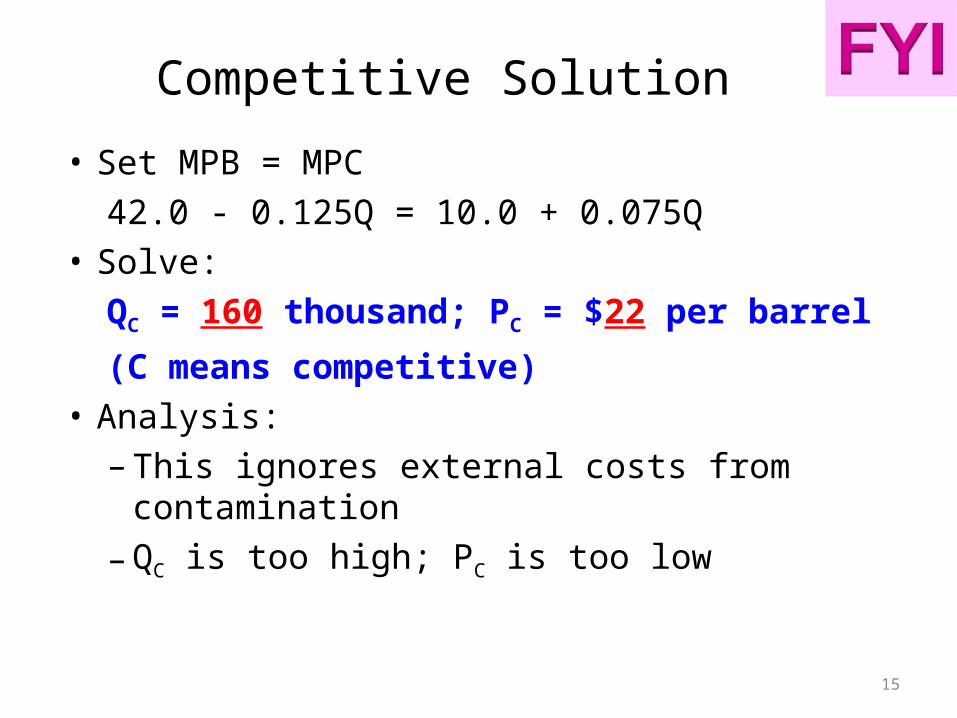
Competitive Solution
• Set MPB = MPC42.0 - 0.125Q = 10.0 + 0.075Q
• Solve:QC = 160 thousand; PC = $22 per barrel
(C means competitive)• Analysis:
– This ignores external costs from contamination– QC is too high; PC is too low
15
Finding a Socially Efficient SolutionRefined Petroleum Market
• Let Marginal External Cost (MEC) = 0.05Q• Marginal Social Cost (MSC) = MPC + MEC
– Assuming no external benefits, MEB= 0, so MSB = MPB
• Set MSC = MSB--10.0 + 0.125Q = 42.0 - 0.125Q--Solving: QE = 128 thousand; PE = $26/barrel
16
MSC, MPC, MPB Graph
17
P ($ per barrel)
Q (thousands)
D = MPB = MSB
42
S =MPC
MSC = MPC + MEC
10
160
PC = 22
128
PE = 26
0QE QC
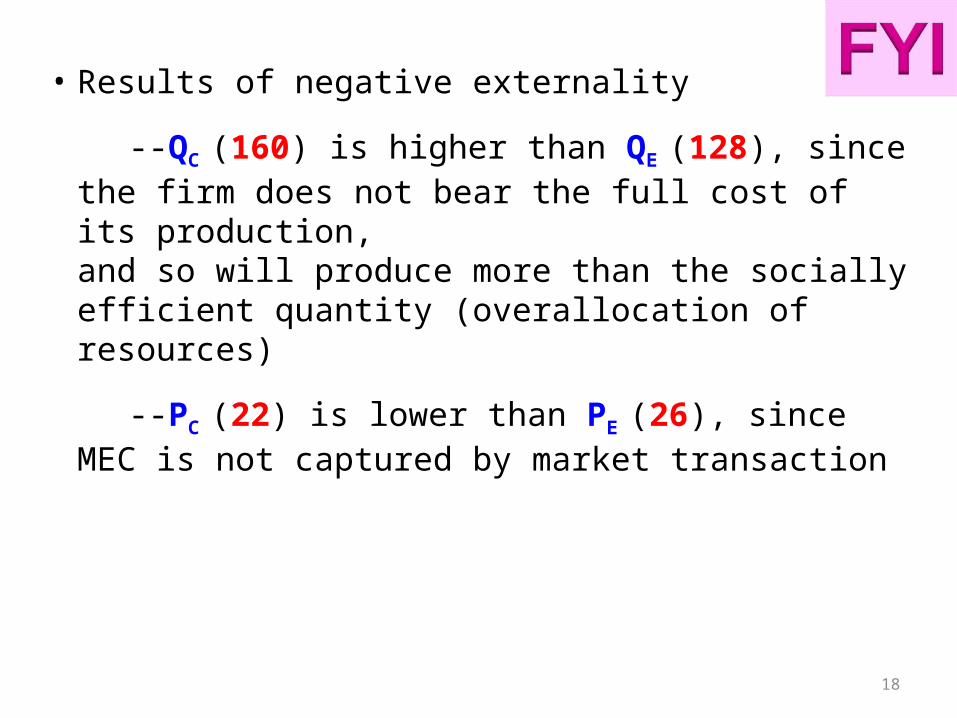
• Results of negative externality
--QC (160) is higher than QE (128), since the firm does not bear the full cost of its production, and so will produce more than the socially efficient quantity (overallocation of resources)
--PC (22) is lower than PE (26), since MEC is not captured by market transaction