1 China and India: Economic Performance, Competition and Cooperation An Update T. N. Srinivasan * 1. Introduction China and India had similar development strategies prior to their breaking out of their deliberate insulation from the world economy and the ushering in of market-oriented economic reforms and liberalization. China began reforming its closed, centrally planned, non-market economy in 1978. India always had a large private sector and functioning markets which were subject to rigid state controls until the hesitant and piecemeal reforms of the 1980s. These became systemic and far broader after India experienced a severe macroeconomic crisis in 1991. The political environments under which reforms were initiated and implemented in the two countries and their consequences were very different. India continues to be an open, participatory, multiparty democracy, while China has an authoritarian, one party regime, though it is liberalizing. After recounting the differing rationales as well as the similarities and differences in the content of their reform agenda, I reviewed in Srinivasan (2002) the achievements of reforms and remaining challenges, particularly regarding reforms of state- owned enterprises (SOEs). I concluded with an analysis of the competition between China and *Samuel C. Park, Jr. Professor of Economics, Yale University, New Haven, Connecticut, USA. This paper draws on “China and India: Economic Performance, Competition and Cooperation,” which was originally presented at a seminar on WTO Accession, Policy Reform and Poverty sponsored by the World Trade Organization in Beijing, China in June 2002 and on Srinivasan (2004). I thank Jan Dutta, Frank Hsiao, Richard Hooley, Will Martin and Jessica Wallack for their valuable comments.
Transcript
1
China and India: Economic Performance, Competition and Cooperation
An Update
T. N. Srinivasan*
1. Introduction
China and India had similar development strategies prior to their breaking out of their
deliberate insulation from the world economy and the ushering in of market-oriented economic
reforms and liberalization. China began reforming its closed, centrally planned, non-market
economy in 1978. India always had a large private sector and functioning markets which were
subject to rigid state controls until the hesitant and piecemeal reforms of the 1980s. These
became systemic and far broader after India experienced a severe macroeconomic crisis in 1991.
The political environments under which reforms were initiated and implemented in the two
countries and their consequences were very different. India continues to be an open,
participatory, multiparty democracy, while China has an authoritarian, one party regime, though
it is liberalizing. After recounting the differing rationales as well as the similarities and
differences in the content of their reform agenda, I reviewed in Srinivasan (2002) the
achievements of reforms and remaining challenges, particularly regarding reforms of state-
owned enterprises (SOEs). I concluded with an analysis of the competition between China and
*Samuel C. Park, Jr. Professor of Economics, Yale University, New Haven, Connecticut, USA. This paper draws on “China and India: Economic Performance, Competition and Cooperation,” which was originally presented at a seminar on WTO Accession, Policy Reform and Poverty sponsored by the World Trade Organization in Beijing, China in June 2002 and on Srinivasan (2004). I thank Jan Dutta, Frank Hsiao, Richard Hooley, Will Martin and Jessica Wallack for their valuable comments.
2
India in world markets and the potential for their cooperation in the Doha Round of multilateral
trade negotiations under the auspices of the World Trade Organization (WTO).
This paper updates Srinivasan (2002). Section 2 is devoted to macroeconomic prospects
and problems. Section 3 is concerned with external sector issues, in particular, the spectacular
performance of China relative to India in their competition in world markets as well as the
emerging perception in India of the opportunities in the large and rapidly growing Chinese
markets. It also notes the protectionist backlash that China’s growing dominance in world trade
and India’s success in Information Technology have induced in the US and Europe. Section 4
concludes with a discussion of the cooperation of China and India in the failed fifth ministerial
meeting of the WTO in Cancún, Mexico, in September 2003 and its importance for the
resumption and successful conclusion of the Doha Round.
2. Macroeconomic Prospects and Problems
2.1 Sustainability of Growth
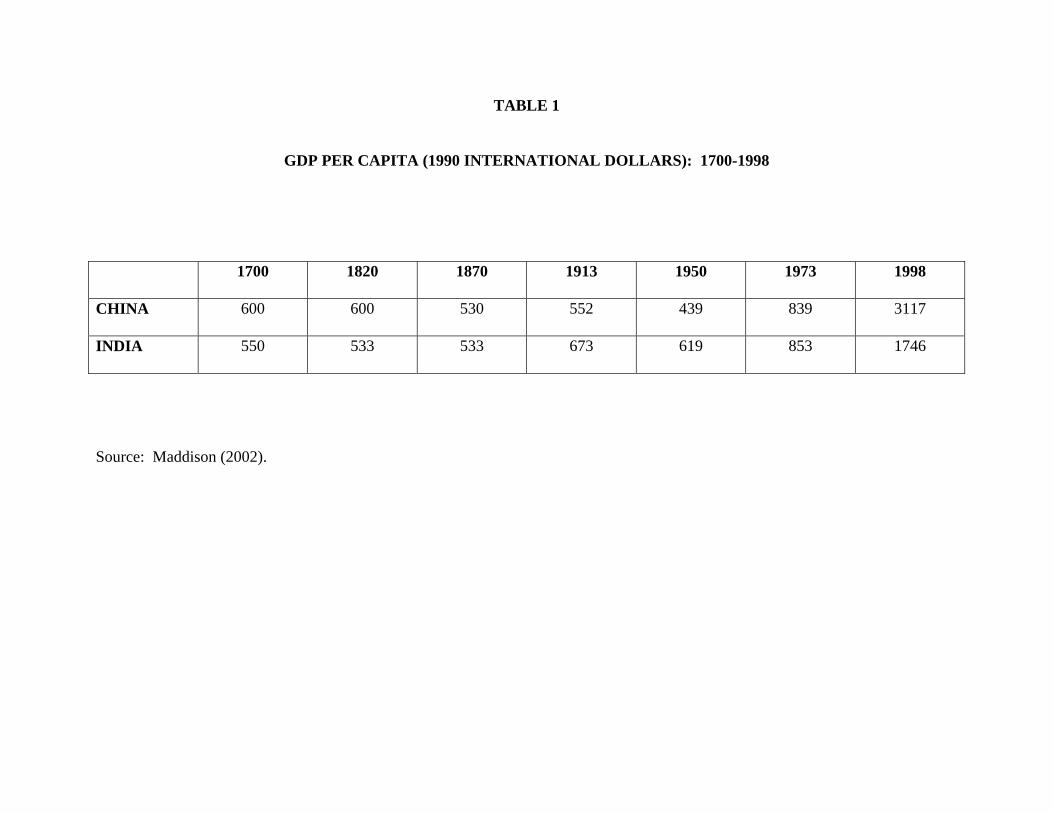
Maddison’s (2002) estimates of China’s and India’s per capita real incomes show that,
starting from roughly equal levels in 1870, India forged ahead of China until the outbreak of the
First World War. Though both experienced declines in their per capita incomes thereafter
(China more so than India) by 1950, India’s per capita income was about 40% higher than
China’s, and it took roughly the next three decades for China to catch up. Since 1980, China has
forged much farther ahead (Table 1).
China and India were the star performers in aggregate GDP growth in the 1980s and 1990s.
China’s average growth of 10% per year during 1980-2001 had slowed to a range of 7-8% per
year during 1998-2002. It is projected to grow at 8% in 2003 (World Bank 2003a, Table 4.1;
World Bank 2003b). In light of the facts that China was hit by the SARS epidemic in 2003, and
3
economic growth in China’s major markets in Europe and North American had slowed since
2000, its performance is remarkably good. Growth continues to be fueled by a rising ratio of
fixed investment to GDP, which is expected to reach 42.2% in 2003. World Bank (2003b) notes
that this rate of investment exceeded the levels reached in the early 1990s when the economy
was believed to be overheating. Furthermore, much of the investment is apparently supported
directly or indirectly by poorly monitored sub-national entities. Clearly, a rapid growth of such
investment would erode its efficiency and could threaten future macroeconomic stability.1
In India, the average annual rate of growth of GDP was close to 6% during 1980-2001. It
reached a peak of 7.8% in 1996-97 from the low of 1.3% in the crisis year of 1991-92. Since
then, it has fluctuated between a low of 4.0% in 2002-03, a year in which the economy was
affected by a serious drought to a high of 6.5% in 1998-99. With bountiful monsoon rains in
2003, growth is expected to be in the range of 7.5% to 8% in 2003-04, as per the Finance
Minister’s budget speech to the Parliament in February 2004. Investment as a proportion of
GDP has ranged between 23.1% to 27.7% of GDP since 1991-92 (RBI 2003a, Table 211).
Macroeconomic data in general, and savings and investment rates in particular, are subject to
potential biases and significant measurement errors in both countries. One has to avoid reading
too much from such data. Also, China is still not a market economy and prices in China may not
have the same role and meaning as they do in a market economy. One cannot, therefore, lightly
dismiss the argument of those who claim that measured Chinese growth may be overstated
1 Going by official Chinese data, the rate of inflation is low and the current account is in surplus. This means that at least there is no evidence of excess demand, a symptom of overheating. Macroeconomic data on savings and investment seem to be inconsistent with balance of payment data in China. If we assume a domestic savings rate of 30% and a current account surplus of 3%, rate of investment would be 27%, not much higher than India’s (Economist, November 13, 2003).
4
perhaps by as much as 2-3% per year2. They also claim that in contrast, the Indian statistical
system, though not as biased as the Chinese, nonetheless does not cover all output, and this bias
may be growing over time. This in turn would imply that Indian GDP, and possibly its growth,
may well be understated in official data. If these claims are conceded, the difference between the
“true” Chinese and Indian growth rates could be insignificant. However, taking official data of
both countries at face value, there is a difference of about 4.1% between Chinese and Indian
growth rates during 1990-2001. Since Chinese fixed investment rates exceeded India’s by about
15% on average, one could argue that this difference in investment alone is enough to explain the
difference in aggregate growth between the two countries. Such an argument would be
somewhat simplistic since investment in physical capital is not the only source of growth and in
part it could be substituting for other sources which could be contributing more to India’s
growth. Indeed, growth in total factor productivity according to some estimates was higher in
India, in at least part of the 1980-2001 period.
In both countries, the issue of sustainability into the future (of say, the next two decades or
so) of current growth rates is important. Clearly, if the high rates of savings and investment are
not sustainable, and the efficiency of investment is doubtful, then Chinese growth rates will
decline. Indeed, with greater quality and a larger number of various consumer goods (including
durables, such as passenger cars) becoming increasingly available in the market, Chinese
households may consume more and save less out of their rising incomes than they are doing
now. Also, the process of phasing out of SOEs and ushering in of truly private enterprises that
2 Rawski (2001) speculates that cumulative GDP growth during 1997-2001 was no more than one-third of official estimates and possibly much smaller. His speculation is not widely shared. For example, Lau (2003) has questioned the methodology underlying Rawski’s speculation. On the other hand, growth may be understated if national growth estimates are based on output and growth data supplied by provincial governments. The reason is that they may have an incentive to understate output and growth to the extent the central government’s share of taxes provinces collect depend on their reported output.
5
respond to market signals may not be smooth and could affect growth adversely. On the other
hand, China’s accession to the WTO and its further integration with the world economy could be
expected to improve the efficiency of resource use through greater competition, inflow and
adoption of better technology, and improvements in financial intermediation from the operation
of foreign banks and other intermediaries could more than offset the effects of any decline in
investment. On balance, I do not foresee any significant decline in Chinese growth in the near to
medium-term future.
In India, the official Tenth Five-Year Plan (2002-07) projects an 8% average rate of growth
for the period of 2002-07. Given the slower average growth of 5.5% per year in the recent past
(1997-98 – 2002-03), legitimate queries have been raised about the feasibility of attaining and
sustaining an average annual rate of growth of 8% or more in the next couple of decades. Of
course, failure to do so would doom the prospects of any substantial reduction in mass poverty.
However, there are reasons to be optimistic. India has farther to go in integrating its economy
with the world economy and in attracting foreign direct investment (FDI) than China (more on
this in Section 3), and both could have growth augmenting effects. India’s domestic reform
process, after having slowed down since the late nineties, is gathering momentum. Clearly, with
an augmentation of the forces of competition (domestic and international) and acceleration of the
pace, broadening and deepening of reforms, the target of 8% growth could be attained and
exceeded. Whether these necessary steps would come about is an issue: for example, the overall
fiscal deficit of all levels of government taken together, and not including the losses of SOEs,
was 10.4% of GDP in 2002-03 and is projected to be 9.8% in 2003-04. These exceed the 9.3%
reached in 1990-91 on the eve of the macroeconomic crisis (World Bank, 2003c, Table 2.2).
6
Unless the fiscal deficit is brought down significantly, the prospects of reaching and sustaining
8% growth are dim.
Progress in some vital aspects of reforms, such as privatization, liberalization of restrictive
labour and bankruptcy laws, reform of electricity generation, transmission and distribution has
been chequered—with steps forward as well as setbacks. Hopefully, after the next general
elections, expected to be held in April 2004, a government will come to power with credible
commitment to reforms (i.e., with a willingness to enact reforms) and a parliamentary majority to
pass needed legislation (i.e., with the ability to enact reforms), without watering it down too
much for achieving a political accommodation with conflicting interests.
2.2 Fiscal Situation
China appears to be in a much better fiscal position as compared to India, with a very modest
fiscal deficit of 3.3% of GDP and a debt/GDP ratio of only 26.3% in 2002 (World Bank 2003b)3.
In contrast, the central government’s fiscal deficit in India in 2002-03 was 5.9% of GDP with the
deficits of states adding another 4.6% of GDP. The overall debt/GDP ratio was 75.3% (RBI
2003a, Tables 223 and 224). However, World Bank (2003b) points out that a costly reform
agenda lies ahead for China that includes pension/social security reforms and dealing with
accumulated non-performing loans (NPLs) of the four largest publicly owned banks. Although
NPL to assets ratio had declined to 26% by the end of 2002, this is believed to be the outcome of
large increases in new loans rather than a contraction of old NPLs through better collections.
The sterilization of the enormous inflows of foreign capital through the issue of ad hoc bills by
the central bank at interest rates exceeding the rates earned on foreign assets of the bank in effect
3 Bahl and Martinez-Vazquez (2003) argue that China’s governance is much less decentralized than indicated by the large share of sub-national governments, which have little by way of formal revenue raising powers. In their view, the present system is probably not sustainable. It is hard to predict the effect of greater decentralization on China’s future fiscal health.
7
adds to the fiscal deficit, if it is properly treated in budget accounting. Although the current level
of budget deficit could be sustained indefinitely by restricting expenditures to 22% - 23% of
GDP, the costs of future reforms might require a combination of policies on the tax and
expenditure sides.
The potential budgetary impact of addressing the NPL of state-owned banks in India is more
serious than in the case of China because of the better fiscal health of China, as noted earlier.
This is so even though the ratio of gross NPL to total gross assets of commercial banks was only
at 4.8% at the end of 2001-02 (RBI 2003b, Chart VI.I) compared to the reported figure of 26%
for China. The reason is that first of all, the Indian norms for recognition of NPLs is more liberal
compared to international norms and the practice of “ever-greening,” i.e., of rolling over loans so
that they are not deemed non-performing, though denied by the regulatory authorities as
happening, is said by other knowledgeable sources to be significant. Battacharya and Patel
(2002) note that the Indian banking system suffers from a large and increasing role of the
government in the financial sector, high regulatory forbearance and the absence of efficient
bankruptcy procedures. With the dominance of large public sector banks in the financial sector,
the “too big to be allowed to fail” syndrome is very much evident: one of the government-
owned banks has been recapitalized three times in the last decade! With the rupee not
convertible for capital account transactions, and with controls on capital outflows continuing,
and foreign exchange reserves exceeding $105 billion in February 2004, there is no imminent
threat of a speculative attack on the rupee. This in turn means that the pressure to clean up the
NPLs of the banking system from a fear of exchange rate crisis is not there. However, the fact
that NPLs of public sector banks represent contingent liabilities of the government is in part
reflected in the rating of India’s sovereign debt by international credit rating agencies. Clearly,
8
sooner or later the NPL problem has to be faced if the Indian rupee is to be made convertible on
capital account.
2.3 Trends in Poverty
Finally, the fact that poverty has declined significantly in both countries since the 1980s after
both experienced substantial acceleration in their growth of per capita GDP has been widely
noted. However, in India, because of changes in design of the household expenditure survey in
the 1990s, a problem of potential non-comparability of poverty estimates over surveys has
emerged. This has led to research on alternative ways to check on the seriousness of non-
comparability and to adjust for it to provide comparable estimates. In addition, there were issues
relating to the price indices used to update poverty lines. Needless to say, some strong
assumptions have to be made in all such exercises, and researchers naturally differed in their
assumptions and methodologies and reached varying conclusions about the decline in poverty. It
is fair to say that all of them agree that the poverty ratio did not increase in the 1990s, and differ
only on whether it declined, and if so, whether the decline was faster in the 1990s than in the
1980s, when growth started to accelerate and poverty began to decline. Official estimates (GOI
2003, Table 10.6) show that the proportion of poor in the population (using national poverty
lines) declined from 45.7% in 1983 to 27.1% in 1999-2000 in rural areas, and from 40.8% to
23.6% during the same period in urban areas. For the country as a whole, poverty declined from
44.5% to 26.1%. Sundaram and Tendulkar (2003) estimate the decline to have been from 49%
to 29% in rural areas, from 38% to 23% in urban areas, and from 46% to 27% in the country as a
whole. Deaton’s (2003a) calculations show that rural (urban) poverty declined from 37.3% in
1993-94 to 30.2% in 1999-2000 and from 32.2% to 24.7% in urban areas. Sen and Himanshu
(2003) dispute some of the assumptions underlying the estimates of Sundaram and Tendulkar
9
(2003) and Deaton (2003a). Their exercise, based on survey data for 1987-88, 1993-94 and
1999-2000, lead them to conclude that, although the proportion of poor did probably decline, the
reduction was no higher during 1994-2000 than it was during 1987-94, and the absolute number
of poor did not decline.
Historically, the Indian statistical system led the world in measurement of poverty. Large-
scale sample surveys were pioneered by Processor P. C. Mahalanobis at the Indian Statistical
Institute in the 1940s, and it was but natural that after independence in 1947 steps were taken to
undertake large-scale household expenditure surveys, initially to supplement national accounts
statistics and later to measure trends in levels of living. India also has a distinguished tradition of
attempts to cross-check estimates from various sources of data and of vigorous debate about, as
well as experiments with, alternative methodologies (Srinivasan and Bardhan 1974; Deaton and
Kozel 2003). In China, household surveys and poverty estimates based on them, as well as a
debate on the statistical system, are fairly recent (Park and Wang, 2001). This has to be kept in
mind in interpreting the data. Hu, Hu and Chang (2003, Appendix Table 1) report that,
according to official data, the proportion of poor in the rural population of China fell steadily
from 33.1% in 1978 to as low as 3.7% in 1999. World Bank (2003d, Table 1.4) estimates (using
$a day consumption poverty line) suggest that the poverty proportion fell from 32.9% in 1990 to
16.1% in 2000.
2.4 Widening Regional Disparities
In both China and India, there was significant widening of regional disparities in growth and
poverty reduction. As is evident from Table 2, rural China and western regions lag far behind
urban China and coastal regions. The top panel of Table 3 provides data on growth of net state
domestic product in five fastest and slowest growing states among sixteen large states in India
10
during the 1980s and 1990s (the crisis year of 1991-92 has been omitted). The bottom panel of
Table 3 provides data on rural and urban poverty ratios for three years—1987-88, 1993-94, and
1999-2000—in five highest and lowest poverty states. It is seen that the fastest growing state,
Delhi, grew at nearly 2.5 times or more than the slowest growing state of Kerala in the 1980s and
more than five times the then slowest growing state of Assam in the 1990s. Also, the highest
poverty state had a poverty ratio which was anywhere between 4.5 times to nearly 10 times the
poverty ratio in the lowest poverty state, depending on the year and region (rural or urban).
Turning to rural poverty, Bihar, Orissa and West Bengal are high poverty states in all three years.
Punjab and Haryana are low rural poverty states in all three years. Four states are common
among low rural poverty states in any two years. Orissa and Madhya Pradesh are high urban
poverty states in all years. Three states are common among high poverty states in any two years.
The same five states happen to be low urban poverty states in all three years.
The relation between growth and poverty is rather muted. Delhi, which is largely urban, has
low poverty in all years and high growth in both periods. Orissa has low growth in both periods
with high rural and urban poverty in all years. Punjab and Haryana have low urban and rural
poverty in all years, but Haryana had high growth in the 1980s and Punjab low growth in the
1990s. Put another way, while there is considerable stability over the three years in which states
happened to have high or low poverty ratios, there is considerable change in growth ranking of
states between the 1980s and 1990s. Unless rapid growth is sustained over a reasonably long
period of time, its impact on reducing entrenched poverty cannot be expected to be significant.
This is consistent with the lack of close association between poverty and growth states in Table
3, given that there was a considerable change in growth ranking over time.
11
In the Chinese case, the deliberate policy choice of the government to concentrate reforms
and external opening to coastal cities and special economic zones contributed to their growing
faster and moving ahead of the other regions, particularly in the West. In India, there was no
such deliberate policy choice. However, as is to be expected and natural, those individuals,
groups and states that were initially better placed in terms of their infrastructure and human
capital grew faster than others not so well placed. To a considerable extent, this is also true of
China. The real issue is not so much the widening disparity but whether there are forces and
policies in place that would enable the lagging regions to catch up and converge to the leading
ones over time. On this, the evidence is mixed, if one goes by the empirical findings of several
cross-regional growth regressions as reported in Srinivasan (2004). Clearly, if there are no
prospects of relatively rapid convergence, the stability of India’s federal democracy and the
control of the Communist Party in China could be put in doubt.
3. External Sector
3.1 Trade in Goods and Services
China continues to outpace India in global integration. In 2002, it was the world’s fifth
largest exporter of merchandise, with a share of 5% of world exports (WTO 2003a, Table 1.5).
China is tenth in commercial service exports, with a share of 2.5% (ibid, Table 1.7). Its growth
in the share of merchandise exports is phenomenal, more than quadrupling during 1983-2002
(ibid, Table II.5). India is a distant 30th in world merchandise trade, with a share of 0.8% in
2002, which represents a growth of only 60% during 1983-2002. A more disaggregated picture
in terms of the changes in the shares of India and China of several labour-intensive exports in the
world as well as in the major markets of North America (Canada and the US) and the European
Union reveals China’s success relative to India’s even more starkly. This is shown in Table 4
12
(reproduced from Srinivasan 2004). In almost every commodity and market, China’s share has
grown rapidly since 1978, whereas India’s share has grown much less, if at all.
Gopalan’s (2001) estimates of labor productivity in manufacturing suggest that except in
petroleum products and nonelectrical machinery, the productivity of a Chinese worker is higher
than that of an Indian worker by anywhere from 30 percent to 180 percent, depending on the
product. Of course, these estimates must be treated with caution, given a number of factors
including the heterogeneity of labor and of products within broad manufacturing sectors;
possible biases in the exchange rates used to convert each country’s output (or the value added in
domestic prices) to US dollars; and the fact that the comparison is confined to the productivity of
a single factor, namely, labor. Gopalan also provides cost comparisons for Chinese and Indian
manufactured goods, some of which both countries sell in third markets and some of which
China exports to India. These comparisons indicate that China has lower costs in many products
than India, though once again, one has to keep in mind that the exchange rates used might be
distorted. It is no surprise that China has gained, and India has lost, market shares in third
markets. Unless India catches up and becomes internationally competitive, this trend is likely to
continue in the future.
Bottelier (2003) points out that in exports of commercial services, India lags less behind
China, being the 19th largest exporter, with a share of 1.5%. Although growth of China’s service
and merchandise exports far outpace average growth of world exports, its merchandise exports
grew much faster than service exports, so that the share of service exports in total exports has
fallen to one of the lowest such ratios for any major country. He notes that, in contrast, India’s
service exports are growing at about double the rate of its merchandise exports, and if current
trends continue, the share of service exports in total exports will exceed 50% in a decade.
13
There is one service sector, viz. Information Technology (IT), in which India has notably
outstripped China. Last year (2002), India’s IT exports were almost $10 billion, compared with
$1.5 billion from China. Interestingly and tellingly, according to a report by consultants, 40% of
China’s IT exports involved Indian IT companies based in China (Luce and Kynge 2003). The
same authors quote the Chief Financial Office of Infosys, the Indian IT giant that has won
contracts with China’s financial sector, as saying that India is five to seven years ahead of China
in the software sector, primarily because of the lack of facility with the English language among
Chinese and the absence of experienced project managers in China. However, he expects that
China will catch up with India very quickly.
India is also ahead of China in pharmaceuticals. Luce and Kynge (2003) point out that the
United Nations buys more than half of its vaccines from a private Indian company. Much of
China’s vaccine production does not meet international standards. Recently, two Indian
pharmaceutical companies, along with a South African company, have entered into a contract
with the Clinton Foundation to supply generic anti-retroviral drugs to treat AIDS at a much
lower cost than Western companies. The fact that in both software and pharmaceuticals it is
India’s highly educated who are the driving force raises the possibility that: “If India can turn
into a fast-growth economy, it will be the first developing nation that used its brainpower, not
natural resources or the raw muscle of factory labor, as the catalyst” (Kripalani and Engardio,
2003, p. 70). Clearly, successful use of brain power by India, with service exports as the engine
of growth, would be in sharp contrast to China, whose growth acceleration was driven by
manufactured exports that exploited its cheap labour.
3.2 Fear of Chinese Competitiveness
14
I noted in Srinivasan (2002) that the competition from lower priced imports of manufactures
from China elicited a defensive response from Indian industrialists to seek protection, and the
government granted it through the levy of antidumping duties on China’s imports. Recently,
Indian entrepreneurs have joined their counterparts in the industrialized countries in viewing the
huge and growing Chinese markets as commercial opportunity. Luce and Kynge (2003) quote
K. K. Modi, the head of an Indian manufacturing company that exports specialty chemicals to
China’s leather industry as saying that, “nobody fears the Chinese market any more—everybody
just wants a piece of it.” Mr. Modi is not alone—many Indian executives, including those in
India’s IT sector, are seeking to boost their presence in China. Some of the exporters to China
are exploiting the relatively lower cost of IT professionals and engineers in India. This cost
advantage in India has been recognized, not only by IT companies in the US and Europe, but
also by Chinese manufacturers. Luce and Kynge cite the case of Huawei, a Chinese telecom
equipment maker, which is planning to invest $100m to develop software in India. The
perception of China as offering rapidly growing opportunities for Indian exporters is reflected in
rapid growth of bilateral trade, which doubled in the last two years and is expected to reach $7.5
billion at the end of 2003. In the three years 1999-2000 to 2002-03, India’s exports to China
increased at an average of 50.2% per year, and imports from China at 26.6% per year (RBI
2003c, Box VI.6).
The infamous Multifibre Arrangement (MFA), under which quotas on various items of
textiles and apparel are bilaterally negotiated between exporting (mostly developing countries)
and importing (mostly industrialized countries) had governed textiles and apparel trade since
1974. In the Uruguay Round of multilateral trade negotiations, an agreement was reached to
eliminate the quotas of MFA in a phased manner, starting from January 1, 1995, and concluding
15
by January 1, 2005. With several products already free of quotas, China has been able to capture
an increasing share of world trade in such products. As seen in Table 4, during 1998-2000,
China’s share in world exports of garments was 20.45% and of fabrics 9.36%. India’s shares
were a modest 5.27% and 2.42%, respectively. Fritsch (2003) refers to an estimate from a World
Bank study that, after the complete phase out of MFA quotas in 2005, China’s exports will grow
even more and capture nearly half of the world’s clothing exports by 2010. He correctly points
out that without the assured markets of bilateral quotas, many developing countries have to
compete with more efficient producers, such as China. In Bangladesh, which is the focus of
Fritsch’s article, there is apprehension that such competition could devastate a garment industry
that currently anchors the economy, sustains millions of families and employs mostly women. It
is an open question whether the Indian textile and apparel industry is, or could become,
competitive enough to thrive and grow a quota-free market. Among other things, restrictions
limiting production of garments to small-scale producers have only recently been removed. If
more efficient producers who can bring costs down by exploiting scale economies enter the
market, India would become competitive. It is too soon to tell whether such entry is taking place
to any significant extent.
3.3 Protectionist Backlash Against China and India
Periods of recessions, such as 2001-03, are breeding grounds for protectionist pressures. The
phenomenal growth of China’s exports, particularly during a recession, and the threat it poses to
less competitive industries, particularly in industrialized countries, is generating a protectionist
backlash directed against it. Taking advantage of the special safeguards provision in China’s
agreement with it as part of its accession to the WTO, the US decided to begin a three-month
16
negotiation on temporary quotas to limit imports of bras, bathrobes and some other apparel4.
Earlier, the US had increased, temporarily, tariffs on steel imports from the rest of the world,
including China, on the grounds that a surge in imports was materially injuring its domestic steel
industry. This US action was contested in the WTO’s dispute settlement system whose
Appellate Body ruled that the US action was in violation of US rules, thus opening the door for
retaliatory action by its trading partners. China had threatened such action. Fortunately, the US
has lifted the offending tariff and retaliation is no longer relevant. In any case, China has little to
gain, and much to lose, in a trade war with its most important trading partner, the US. This being
the case, the threat was not credible and perhaps served only as an expression of China’s concern
over the damage that rising protectionism in the US and elsewhere would inflict on it.
India is also facing a backlash from its success in the IT sector. It is no surprise that with
unemployment rates stubbornly resisting to come down despite recent signs of recovery in the
US, many in the US view outsourcing of IT jobs as exacerbating, if not causing, a jobless
recovery. Service sector activities, even those involving high technical skills, are being
outsourced by the US and European companies to India (and China). According to the Financial
Times (March 1, 2003), “India has been on the front line of outsourcing for a decade, and
roughly half of the world’s largest 500 companies and many government agencies now contract
out IT and business process work to India.” A less prosaic and more dramatic illustration of the
nature of outsourcing to India was provided by the well-known columnist and writer, Thomas
Friedman:
If you lose your luggage on British Airways, the techies who track it down are here in India. If your Dell computer has a problem, the techie who walks you through it is in
4 In fact, China’s accession protocol allows for invoking by its trading partners of transitional product specific safeguards without any procedural protection at all, and for the continued use of “non-market economy” status for anti-dumping investigations. The criteria for demonstrating material injury are very weak. I owe Will Martin for this observation and for bringing Messerlin (2003) to my attention.
17
Bangalore, India’s Silicon Valley. Ernst & Young may be doing your company’s tax returns here with Indian accountants. Indian software giants in Bangalore, like Wipro, Infosys and MindTree, now manage back-room operations—accounting, inventory management, billing, accounts receivable, payrolls, credit card approvals—for global firms like Nortel Networks, Reebok, Sony, American Express, HSBC and GE Capital. … GE’s biggest research center outside the US is in Bangalore, with 1,700 Indian engineers and scientists. The brain chip for every Nokia cellphone is designed in Bangalore. Renting a car from Avis online? It’s managed here.
A somewhat hysterical, though not entirely untypical reaction, is of Clive Thompson (2001):
“Eventually the United States won’t make any hard goods, won’t do the cerebral stuff and won’t
fulfill the orders. Then, what’s left? Brand building? Business development? Shopping?
Would you like fries with that, sir?” According to Rai (2004), “Nearly two dozen states have
voted on legislation to ban government work being contracted to non-Americans. More recently,
the United States Senate approved a bill aimed at restricting outsourcing of contracts from two
federal departments. The House has not acted on similar legislation.” However, in the recently
passed Omnibus Appropriations Bill, which has already been signed by the President, there is a
provision, in the section relating to the Departments or Treasury and Transport, that bans
outsourcing. Whether it applies only to these two departments or to the federal government as a
whole is unclear. In any case, these are ominous developments.
3.4 China and India as Drivers of Regional Growth
There is little doubt that China’s rapidly growing exports to countries outside of Asia-Pacific
in Asia has generated equally rapid growth in imports by China from other Asian and Pacific
countries, not just from its neighbors in East Asia but also from Australia, India and Indonesia.
According to Perlez (2003), Japan’s current “recovery is being driven by a surge in exports to
China. Australia’s healthy economy is being kept that way by Chinese investments in liquid
natural gas products. China is now South Korea’s largest trading partner . . . In Indonesia,
18
Malaysia and the Philippines (and to a lesser extent in Thailand) . . . China’s main interest is to
scoop up what it can for its modernization. Indonesians call this new relationship with Beijing as
‘feeding the dragon.’” Although India is by far the largest (and rapidly growing) market in
South Asia, it is yet to have a major impact on the trade of its neighbours in South Asia in spite
of the creation of the South Asian Preferential Trade Area (SAPTA) in 1997. To a significant
extent, this reflects the hostile relations between India and the next largest market in South Asia,
viz. Pakistan. Pakistan is yet to grant a most favoured nation status to India. Unless the relations
between the two normalize, the prospects of SAPTA are not bright. However, India-Sri Lanka
bilateral trade and investment have grown rapidly since the conclusion of a free trade agreement
between the two became operational in March 2000. Recent signs of a warming of Indo-
Pakistani relations, if they lead to their normalization, could make India the engine of growth for
South Asia, as China already is in the Asia-Pacific region.
3.4 Foreign Direct Investment
China receives a much larger flow of net foreign direct investment (projected at $57 billion
in 2003) than India’s (under $4 billion in 2001-02). In Srinivasan (2002), I discussed some of
the reasons for this difference. In short, as Luce and Kynge (2003) succinctly point out,
“whether it is China’s cheaper, more reliable power supply or the more rapid turn around at its
ports, China remains an incalculably better environment for most manufacturing than India,
which is slowly waking up to this.” This environment and the bureaucratic obstacles at all levels
of government in India in large part explain the huge flow of FDI to China relative to India. The
Indian government has recognized FDI as key for achieving the Tenth Plan target of 8% annual
growth and appointed a steering committee on FDI in 2001. It reported in 2002 with several
recommendations for making India more attractive as a destination for FDI.
19
3.5 Exchange Rates and Foreign Reserves
Although China’s trade surplus with the United States has been growing, its overall trade
surplus is modest since it is running a growing trade deficit with Asia-Pacific countries that
offsets in large part its trade surplus with the US. The economic logic that only a country’s
overall trade and current account balances have economic significance and not its bilateral
balances with any one or a subset of trading partners, has never been understood by politicians
anywhere, and in particular, in the US. As Japanese trade surpluses created an anti-Japan
backlash in the eighties, it is now China’s turn to be at the receiving end of US pressure.
China has accumulated a substantial (projected at $383 billion by the end of 2003)
foreign exchange reserves, exceeding its annual imports. India has done the same—its reserves,
around $92 billion at the end of 2003, exceed by a substantial margin the likely imports of $60
billion. The issues of the appropriate level of reserves, and whether both countries have
accumulated far too much relative to what would be needed to smooth volatility in export
earnings and import expenditures and to contain any potential financial crisis like the one
experienced by East Asia in 19975. Since neither the renminbi nor the rupee is convertible on
capital account and capital controls are in place in both countries, prima facie the probability of
an exchange rate crisis of the type experienced by countries with open capital account and fully
convertible currencies is very low. This is not to say, of course, that a balance of payments crisis
(BOP) that makes the prevailing exchange rate unsustainable cannot arise—after all, despite
capital controls and an inconvertible (on capital account) rupee, India experienced a severe BOP
crisis in 1991, which resulted in the devaluation of the rupee and other policy changes. Still,
5 There are some who claim that the unification renminbi-dollar exchange rate in 1994, prior to the Asian crisis, was in fact a devaluation of the renminbi. At that time, the exchange rates of other East Asian countries were fixed relative to the dollar and hence appreciated relative to the renminbi, and this appreciation contributed to the East Asia crisis. I am not entirely persuaded by this claim.
20
given that partial insurance from other sources of external funds (e.g., from the IMF) is in
principle available, should self-insurance through reserves be pushed as far as the current level of
reserves in China and India seem to have done?
Any attempt to determine the appropriate level of reserves has to be based on an analysis
of the appropriate exchange rate regime for either country, and the related issue of whether the
benefits from integration with the global financial markets outweigh the costs. Without doing
such an analysis myself, let me cite Kenneth Rogoff of Harvard, the former Economic Councillor
and Director, Research Department of the IMF, on the issue:
My interpretation of the evidence not just from Asia but from the whole world, from Europe’s experience, from floating rates, from the Bretton Woods system, is that policy makers vastly overrate the risks of having volatile exchange rates and vastly underrate the indirect costs that can come from all the policies that they have to try to suppress them. Certainly I wouldn’t say that India has gone too far at the moment in accumulating reserves, it has a very strong position but I think all the countries in Asia are reaching a point when they have to start asking the question how much is enough, that basically a lot of the reserves that the Asian economies are accumulating—even outside of Japan—we are talking about close to a trillion dollars, are basically low interest rate loans from the emerging markets to United States and Europe, and this is very costly. There are opportunity costs to the domestic economy. How much is enough and at what point should one risk letting the exchange rate appreciate. Knowing the multilateral aspects of it, I realize that there are some outside the IMF who call for greater flexibility in Asian currencies in order to strengthen demand from the rest of the world. I think that is an issue worth considering but it is not the one I want to focus on. From the Asian economies’ own perspective, and this is true for India, it is true for China, it is true for virtually all the countries in the region, moving to a regime of greater flexibility would be something that is advisable, would not bring the cost many policy makers fear, and in fact would allow the economies to reduce the level of recession and that would have many positive growth effects (Rogoff 2003).
Rogoff’s conclusion does not imply that US pressure on China to revalue the renminbi
was justified or that India should also let its rupee appreciate, but only that greater flexibility in
exchange rates would be appropriate in both countries. The Indian exchange rate regime is one
of managed float (although Rogoff prefers to characterize it as a crawling peg), and it does allow
21
some flexibility. It is possible to argue that the Indian central bank (i.e., Reserve Bank of India)
has inappropriately intervened to prevent the rupee from appreciating, and this has cost the
Indian economy in terms of foregone growth. But this is an argument that the flexibility inherent
in the managed float regime has not been utilized appropriately. It is not the same as arguing
that India should immediately make the rupee fully convertible and adopt a regime of clean float.
The latter argument is not persuasive for the simple reason that domestic financial sector reforms
are incomplete, and it is risky to open the capital account under the circumstances. In any case,
there is no country in the world, developed or developing, that allows a clean float of its
currency. On the other hand, there are long term benefits from a convertible currency and by
credibly committing to a fully convertible rupee for at a not too distant and specified future date,
the pressure to complete the financial sector reforms by that date would become significant.
What about China? Again, the problems in the financial sector, particularly the overhang
of NPLs are serious, and an immediate revaluation might worsen the problem. Besides, it has
not been established by anyone, least of all by the US Treasury, that the current renminbi-dollar
exchange rate is too far from a long-run equilibrium rate. If it is not, and China moves to a
floating regime, that US Treasury might find, to its surprise, that the exchange rate does not
move from its current level! Unfortunately, China is likely to succumb to the pressure to revalue
if newspaper reports (Financial Times, February 10, 2004) are to be believed.
It is not unlikely that if India’s reserves continue to climb, and outsourcing gathers
further momentum, there would be charges of “currency manipulation” against Indian
authorities, as the Chinese are currently being charged with. China and India should cooperate in
resisting such accusations and pressures and decide on their exchange rate policies in their own
interests. Finally, as Rogoff rightly points out, by continuing to accumulate reserves in terms of
22
US dollar assets, China, India and other Asian countries are financing US current account
deficits. As Alan Beattie (2003) points out: “In theory, Asians’ role in financing the US current
account deficit could give them enormous economic or even political leverage, since a sudden
shortfall in capital inflows would spark a slide in the dollar and possibly a sharp rise in interest
rates.” But he rightly concludes that: “A wholesale flight from the dollar, if it drove up interest
rates and forced the US into a rapid tightening of consumers’ belts, would also hurt one of the
principle buyers of Asia’s exports.” Chinese and Indian policy makers are sophisticated enough
to realize this and can be expected to slow the accumulation of reserves, if appropriate, and allow
greater exchange rate flexibility in due course.
4. China, India and the Doha Round of Multilateral Trade Negotiations Post-Cancún
The opponents of outsourcing, who are increasingly vocal, are the more recent entrants to the
anti-globalization movement. The latter, which organized violent street demonstrations on the
occasion of the Third Ministerial meeting of the WTO in Seattle in December 1999, has since
repeated it, though not so violently, at every annual meeting of the World Bank and IMF, and
most recently, at the Fifth Ministerial of the WTO at Cancún, Mexico, during September 10-14,
2003. At the governmental level, the demand by the US and the EU that a “social clause” be
instituted in the WTO to permit the use of trade sanctions to enforce labour standards is also a
protectionist response to competition from low wage, developing countries such as China and
India. Such a clause is already part of every regional trade agreement to which the US is a party,
since the North American Free Trade Agreement. In fact, the then-President Clinton’s embrace
of the demand on the eve of the Seattle Ministerial of the WTO in 1999 significantly contributed
23
to its collapse. It is clear that China and India have a common and vital interest in diffusing
protectionist threats.
The Cancún Ministerial Meeting of the WTO was expected to review the status of
multilateral negotiations (MTNs) launched at the fourth meeting in Doha, Qatar in November
2001. In particular, it was to set the negotiations back on track after the setbacks of having
missed several crucial deadlines set at Doha, and deciding on modalities6 by explicit consensus
of members for negotiations in certain areas, such as, for example, the so-called “Singapore
issues” of investment, competition policy, government procurement and trade facilitation. The
meeting ended with no agreement on any of these.
Leading developing countries (DCs), namely, Brazil, India, China, and South Africa, formed
a group of twenty (G-20) plus members (Appendix I) to articulate and negotiate for the
developing countries (DCs) at the meeting. In the ministerial at Punta del Este in 1986, which
launched the Uruguay Round, there was also a group of ten DCs led by Brazil and India. But
this group in effect disintegrated at the meeting. At Cancún, G-20 stuck to its positions until the
end. There is no doubt the fact that the world’s fifth largest exporter and sixth largest importer,
namely China, was a member of G-20 has a lot to do with why G-20 was taken far more
seriously at Cancún than the G-10 was in Punta del Este in 1986. China and India have a vital
interest in ensuring that the failures of Cancún get reversed and the Doha Round of negotiations
resumed, their continued cooperation is very important.
Robert Zoellick, the head of the US delegation at Cancún, petulantly reacted to the failure
of the multilateral process at the Cancún ministerial railed against the developing countries and
asserted that the US will pursue with renewed vigor bilateral and regional preferential trade
6 The “modalities” are targets (including numerical targets) for achieving the objectives of negotiations, as well as issues related to rules (www.wto.org/english/tratop_e/negoti_mod1stdraft_3.htm).
24
agreements. Since the US was pursuing this option already with maximum vigor, it is not
obvious that Zoellick’s threat to go regional and bilateral has become more credible with the
collapse of the Cancún meeting. Nonetheless, the fact that a proliferation of preferential trade
liberalization is much less beneficial than multilateral trade liberalization suggests that if the US
indeed succeeds in concluding regional agreements, those outside of such agreements, such as
China and India, stand to lose significantly.
Regardless of Zoellick’s threat to go bilateral and regional, preferential trade agreements
(PTAs) are proliferating. India is a member of SAPTA and has free trade agreements with Nepal
and Sri Lanka and is vying to become a member of ASEAN. Until recently, China was virtually
alone among members of the WTO in not being a part to any PTA. Unfortunately, it is now
heavily engaged in negotiating a PTA with Thailand and promoting an Asian Free Trade Area. I
argued forcefully in Srinivasan (2002) that PTAs are inferior to multilateral trade liberalization.
In fact, the Most Favoured Nation principle was formulated in the 19th century in response to the
chaos created by overlapping bilateral and plurilateral PTAs with different levels of preferences.
There is no reason to unlearn the lessons learned long ago and reembrace PTAs.
Unfortunately, some Asian leaders, such as President Roh Moo-Hyun of South Korea and
Singapore’s Prime Minister Goh Chok Tong, held up the European Union as a possible model
for Asian Economic Integration (Mallet 2003). This is fundamentally misguided. It confuses
economic integration with political integration in order to acquire a credible voice in decision
making on global issues, i.e., to move to a multipolar world in which unified positions would be
articulated by credible groups of countries (say EU, Russia and possibly the Commonwealth of
Independent States, one or more groups from Africa, Asia and Latin America) and act as a check
on the currently dominant US in a unified world. Economic integration in the sense of
25
preferential trade and investment arrangements, short of a common market and monetary union,
is neither necessary nor sufficient to bring about political integration.
It is worth recalling that the origins of the EU were fundamentally political, namely, a
desire to prevent yet another European war between France and Germany that inevitably
escalates into a world war. Trade preferences were only incidental to the creation of the
European Coal and Steel Community, which eventually evolved into the EU. There is as yet no
evidence of a desire to have closer political integration in Asia. Concluding a PTA does not
necessarily change this, as is evident from the conclusion of SAPTA—it has not improved Indo-
Pakistani relations. Fortunately, India and Pakistan have just begun to implement confidence
building measures, and much more than SAPTA, the grant of MFN status to India by Pakistan
will help in improving confidence. Chinese-Indian relations are also getting better. Certainly,
the rapid growth of bilateral trade and mutual interest in seeing it grow further helped. But the
essential point is that neither past growth, nor the expected future growth, is based on trade
preferences granted by either to the other.
The role of PTAs promoting intra-regional trade is exaggerated. Mallet (2003) quotes
from a study by Francis Ng and Alexander Yeats of the World Bank: ‘“Since the mid-1980s,
east Asian intra-trade [excluding Japan] has been growing at a rate roughly double that of world
trade and at a rate far higher than the intra-trade of Nafta or the European Union.’” What is
more, East Asian integration was not driven by governments as the European one was. In fact,
Mallet (2003) points out: “The one area that has tried to push ahead with a formal free trade
zone—the 10-member Association of South East Asian Nations (ASEAN)—has little internal
trade compared with the rest of East Asia.” Instead of making any futile attempt to forge
economic ties on a preferential basis, Asian nations would best concentrate their efforts in
26
ensuring that the multilateral process of trade liberalization that ran into a road block in Cancún
is resumed. Clearly, joint action by China and India in this regard would be very important.
The multilateralism of the WTO is incompatible with the preferential trading
arrangement of any sort. Many such agreements, though called “free trade” agreements, have
little to do with free trade. Their rules of origin (ROOS) for availing of preferential treatment are
invariably complex and provide great opportunities to trade lawyers to create non-transparent
and opaque protectionist measures by manipulating them. For example, the free trade agreement
(FTA) between the US and Singapore apparently includes 203 pages of text on ROOS! China
and India should propose a repeal of Article XXIV of GATT/WTO on Customs Unions and
FTAs and replace it with one which ensures that trade preferences of any regional or other
agreements are extended to all members of the WTO on a MFN basis within a specified (say,
five years) period after the conclusion of such agreements. The rationale for this is that the
primary driving force behind most regional agreements, as argued earlier, is political. The
political benefits of such agreements ought to be adequate to prevent defection even if the
incentives of trade preference are limited to minimize the damage they inflict on non-members,
to a specified period.
In the resumed negotiations, both countries should continue to insist that first, issues that
are not trade related, such as labour standards, should not be in the mandate of the WTO.
Second, both should resist giving direct representation to non-governmental entities in the WTO.
The reason is that since national and international policies relating to trade would be the means
for implementing any decisions in the WTO, it has to remain an inter-governmental organization.
Clearly, the so-called “civil society,” national and multi-national, naturally should be heard—but
the fora for the hearing have to be primarily the national political arena. Through influencing the
27
positions of national governments through a participatory process they will indirectly influencing
the decisions at the WTO. Giving them a direct representation formally in some form, such as
observer status, would be counterproductive. The deeper problem of the possible undemocratic
and non-participatory character of some national polities such as China’s, and hence their denial
of hearing to their civil societies does indeed arise—but a sustainable solution to absence of
democracy does not lie in giving representation to civil society in an inter-governmental
organization. The notion of democracy in its decision-making process has no meaning, but
transparency certainly has.
Third, the dispute settlement system of the WTO is ultra-legalistic in contrast to the
political system of GATT. There are pros and cons for either system. However, an effective
access to a legalistic system depends on being able to hire expensive legal expertise, which poor
members may not be able to do without assistance. Also, the quality of the jurisprudence of the
system would be compromised if it is overloaded with too many disputes, as seems likely. One
unfortunate consequence has been the clamour to bring into the ambit of WTO, based on the
successful inclusion of TRIPS, other issues such as labour standards, environment, etc., not
because of their trade relatedness, but only because of the availability of WTO’s dispute
settlement system to enforce disciplines through trade sanctions. China and India should explore
and propose better alternatives to the present system.
It is well known that the only economic rationale for dumping, namely predation, is no
longer plausible, if it ever was. Still, ADMs have been the preferred instruments of protection
for various reasons (Srinivasan 2002). The US and EU have long been frequent users of ADMs,
and developing countries such as India have now begun to use them extensively. India is now a
major user, in particular against imports from China. For example, during 2001-02 (July-June),
28
in all 309 ADM investigations were initiated, of which as many as 76 were by India, followed by
the US (58), Argentina (26), and the EU (23). China initiated none in this period but was the
affected exporter in 46 of the investigations. At the end of 30 June 2002, there were in all 1,189
ADM measures in force, of which 150 were accounted for by India and only 17 by China. The
US alone accounted for the largest number, 264, followed by EU’s 219 (WTO 2003b, Tables
III.5 and III.6). ADMs are the most distortionary and discriminatory among protectionist
instruments. Messerlin (2003) provides a comprehensive and thorough discussion of ADMs
from the perspective of China’s options in the WTO. Since other less distortionary means, such
as safeguards measures, are allowed by WTO rules, ADMs are neither necessary nor desirable.
China and India should propose repealing the articles of WTO dealing with ADMs.
To conclude: China and India have a lot to gain, both from trading with each other and
cooperating in the WTO. Each can learn from the other’s policies, their successes and failures.
This paper discussed a subset of economic issues common to both countries without touching on
others, such as privatization of SOEs, reforms of the labour market (e.g., dealing with the
“hokou” system in China and labour laws in India), financial sector reforms and, above all,
political reforms. Although it may sound chauvinistic and naive, there is no doubt that China can
learn a lot from the functioning of a vibrant, but somewhat chaotic, multiparty participatory
democracy in India. After all, as the Chinese become richer and economically free, they are
likely to demand personal and political freedoms. Hopefully, the Communist Party of China will
anticipate and accommodate such demands, as it seems to have started doing already.
29
References
Ahluwalia, Montek S. 2002. “State-Level Performance under Economic Reforms in India,”
Chapter 3 in Anne O. Krueger, ed., Economic Policy Reforms and the Indian Economy.
Chicago: University of Chicago Press: 91-122.
Bahl, Roy and Jorge Martinez-Vazquez. 2003. “Fiscal Federalism and Economic Reform in
China,” Fiscal Federalism in a Global Environment, T. N. Srinivasan and Jessica
Wallack, eds., forthcoming.
Battacharya, Saugata and Urjit R. Patel. 2002. “Financial Intermediation in India: A Case of
Aggravated Moral Hazard?” Paper presented at the Third Annual Conference on the
Reform of Indian Policies at Stanford University on June 3-4, 2002, revised July 2002.
Beatty, Alan. 2003. “Storing Up Trouble: Asia’s Policy of Accumulating Reserves Becomes a
Source of Friction with an Indebted US,” Financial Times, September 24, 2003: 11.
Bottelier, Pieter. 2003. “China as an Exporter of Services. What Lies Ahead?” mimeo.
Deaton, Angus. 2003a. “Adjusted Indian Poverty Estimates for 1999-2000,” Economic and
Political Weekly, January 25, 2003: 322-6.
---. 2003b. “Prices and Poverty in India, 1987-2000,” Economic and Political Weekly,
January 25, 2003: 362-8.
Deaton, Angus and Valerie Kozel. 2003. “Introduction and Overview.” Princeton: Research
Program on Development Studies, Princeton University (mimeo).
Friedman, Thomas. 2002. “India, Pakistan and G.E.,” New York Times, August 11, 2002.
Jewelry 0.88 1.23 1.59 1.91 2.60 3.39 4.28 Others 0.33 0.27 0.22 0.29 0.86 0.87 0.71 Sources: United Nations, Comtrade Data Base (New York: United Nations Statistical Office, 2001). “Garments” refers to the three-digit SITC categories 843, 844, 848; “Fabrics” to 652, 653, 654, 657; “Leather” to 611 and 612; Jewelry to 897; and “Others” to categories 764, 778, 842, 847, 851, 893, 894. I thank Francis Ng of the World Bank for providing the data.
Appendix I
MEMBERSHIP OF THE G-20
Pre-Cancún
Argentina Guatemala Bolivia India Brazil Mexico Chile Pakistan China Paraguay Colombia Peru Costa Rica Philippines Cuba South Africa Ecuador Thailand El Salvador Venezuela
Egypt* Kenya*
* not formally members, but supportive of G-20 text