Page 1
14th Int Symp on Applications of Laser Techniques to Fluid Mechanics Lisbon, Portugal, 07-10 July, 2008
- 1 -
PIV Application for Investigation of the Rotor Blade Tip Interaction with a
Casing Treatment in a Transonic Compressor Stage
Melanie Voges1, Chris Willert
1, Rainer Schnell
1, Martin W. Müller
2,
Carsten Zscherp3
1: German Aerospace Center (DLR), Institute of Propulsion Technology, 51170 Cologne, Germany,
[email protected]
2: Technische Universität Darmstadt, Petersenstr. 30, 64287 Darmstadt, Germany
3: MTU Aero Engines, Dachauer Str. 665, 80995 München, Germany
Abstract This contribution describes the experimental investigation of the blade tip interaction with a
casing treatment implemented to a transonic compressor stage using particle image velocimetry (PIV). The
results obtained allowed for direct comparison with numerical simulations of the same compressor stage
including the CT geometry, carried out using the DLR TRACE code following a new approach to efficiently
perform time-accurate casing-treatment simulations.
The single-stage transonic axial compressor was equipped with a casing treatment (CT), consisting of 3.5
axial slots per rotor pitch in order to investigate the predicted extension of the stall margin characteristics.
Contrary to most other studies, the CT was designed especially accounting for an optimized optical access in
the immediate vicinity of the CT, rather than giving maximum benefit in terms of stall margin extension. The
nearly rectangular geometry of the CT cavities allowed one dividing bridge between two slots to be made of
quartz glass with curvatures matching the casing. Thus the flow phenomena could be observed with
essentially no disturbance caused by the optical access. Two periscope light sheet probes were specifically
designed for this application to allow for precise alignment of the laser light sheet at three different radial
positions in the rotor tip region (at 87.5%, 95% and 99% blade height). For the outermost radial position the
light sheet probe was placed behind the rotor and aligned to pass the light sheet through the blade tip
clearance. It was demonstrated that the PIV technique is capable of providing velocity information of high
quality even in the tip clearance region of the rotor blades. Phase-constant measurements were carried out
with a resolution of 8 phase angles per blade pitch in relation to the CT slots visible in the camera’s field of
view. The chosen type of smoke-based seeding with very small particles (about 0.5 µm in diameter)
supported data evaluation with high spatial resolution, resulting in a final grid size of 0.5 x 0.5 mm.
The PIV data base established in this project forms the basis for further detailed evaluations of the flow
phenomena present in the transonic compressor stage with CT and allows validation of accompanying CFD
calculations using the DLR TRACE code. Based on the combined results of PIV measurements and CFD
calculations of the same compressor and CT geometry a better understanding of the complex flow
characteristics can be achieved.
1 Introduction
Regarding turbomachinery, the fields of application for conventional and laser-based
measurement techniques are both diverse and challenging. For these the prime emphasis is on
improving the understanding of the complex flow phenomena present inside turbines, compressors
or entire stages and combustion chambers for jet engines as well as stationary gas turbines. Flow
field information, ideally obtained simultaneously at many points, is particularly valuable for the
improved understanding of performance influencing parameters in compressor or turbine stages.
While this sort of data is difficult to obtain with point-based diagnostic techniques, it recently has
become possible with planar laser-based measurement techniques, such as DGV and PIV, as they
are able to provide flow field information of a whole plane section and in the future may even fully
resolve the flow field in small volumes (i.e. tomographic PIV).
Page 2
14th Int Symp on Applications of Laser Techniques to Fluid Mechanics Lisbon, Portugal, 07-10 July, 2008
- 2 -
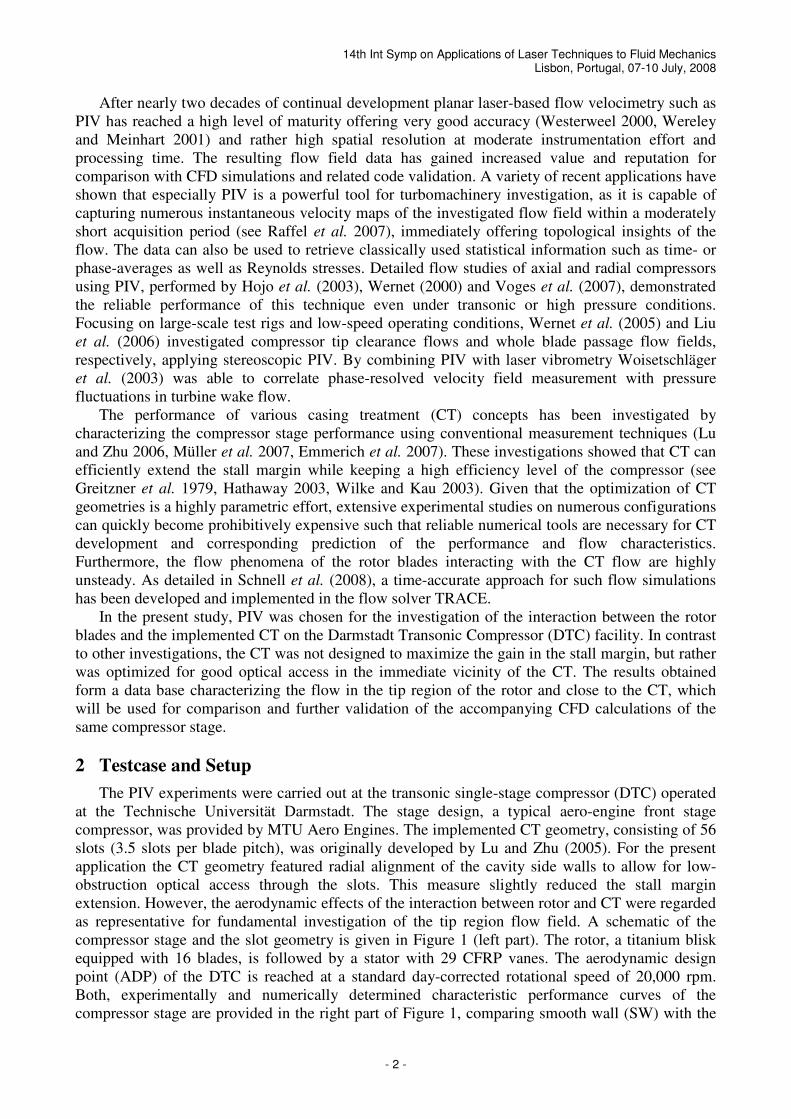
After nearly two decades of continual development planar laser-based flow velocimetry such as
PIV has reached a high level of maturity offering very good accuracy (Westerweel 2000, Wereley
and Meinhart 2001) and rather high spatial resolution at moderate instrumentation effort and
processing time. The resulting flow field data has gained increased value and reputation for
comparison with CFD simulations and related code validation. A variety of recent applications have
shown that especially PIV is a powerful tool for turbomachinery investigation, as it is capable of
capturing numerous instantaneous velocity maps of the investigated flow field within a moderately
short acquisition period (see Raffel et al. 2007), immediately offering topological insights of the
flow. The data can also be used to retrieve classically used statistical information such as time- or
phase-averages as well as Reynolds stresses. Detailed flow studies of axial and radial compressors
using PIV, performed by Hojo et al. (2003), Wernet (2000) and Voges et al. (2007), demonstrated
the reliable performance of this technique even under transonic or high pressure conditions.
Focusing on large-scale test rigs and low-speed operating conditions, Wernet et al. (2005) and Liu
et al. (2006) investigated compressor tip clearance flows and whole blade passage flow fields,
respectively, applying stereoscopic PIV. By combining PIV with laser vibrometry Woisetschläger
et al. (2003) was able to correlate phase-resolved velocity field measurement with pressure
fluctuations in turbine wake flow.
The performance of various casing treatment (CT) concepts has been investigated by
characterizing the compressor stage performance using conventional measurement techniques (Lu
and Zhu 2006, Müller et al. 2007, Emmerich et al. 2007). These investigations showed that CT can
efficiently extend the stall margin while keeping a high efficiency level of the compressor (see
Greitzner et al. 1979, Hathaway 2003, Wilke and Kau 2003). Given that the optimization of CT
geometries is a highly parametric effort, extensive experimental studies on numerous configurations
can quickly become prohibitively expensive such that reliable numerical tools are necessary for CT
development and corresponding prediction of the performance and flow characteristics.
Furthermore, the flow phenomena of the rotor blades interacting with the CT flow are highly
unsteady. As detailed in Schnell et al. (2008), a time-accurate approach for such flow simulations
has been developed and implemented in the flow solver TRACE.
In the present study, PIV was chosen for the investigation of the interaction between the rotor
blades and the implemented CT on the Darmstadt Transonic Compressor (DTC) facility. In contrast
to other investigations, the CT was not designed to maximize the gain in the stall margin, but rather
was optimized for good optical access in the immediate vicinity of the CT. The results obtained
form a data base characterizing the flow in the tip region of the rotor and close to the CT, which
will be used for comparison and further validation of the accompanying CFD calculations of the
same compressor stage.
2 Testcase and Setup
The PIV experiments were carried out at the transonic single-stage compressor (DTC) operated
at the Technische Universität Darmstadt. The stage design, a typical aero-engine front stage
compressor, was provided by MTU Aero Engines. The implemented CT geometry, consisting of 56
slots (3.5 slots per blade pitch), was originally developed by Lu and Zhu (2005). For the present
application the CT geometry featured radial alignment of the cavity side walls to allow for low-
obstruction optical access through the slots. This measure slightly reduced the stall margin
extension. However, the aerodynamic effects of the interaction between rotor and CT were regarded
as representative for fundamental investigation of the tip region flow field. A schematic of the
compressor stage and the slot geometry is given in Figure 1 (left part). The rotor, a titanium blisk
equipped with 16 blades, is followed by a stator with 29 CFRP vanes. The aerodynamic design
point (ADP) of the DTC is reached at a standard day-corrected rotational speed of 20,000 rpm.
Both, experimentally and numerically determined characteristic performance curves of the
compressor stage are provided in the right part of Figure 1, comparing smooth wall (SW) with the
Page 3
14th Int Symp on Applications of Laser Techniques to Fluid Mechanics Lisbon, Portugal, 07-10 July, 2008
- 3 -
described CT for ADP conditions and reduced speed at 65% rpm. More details regarding the
compressor performance can be found in Müller et al. (2007).
Four operating points were chosen for PIV investigation, one near stall and one at peak
efficiency, both for 100% rpm and 65% rpm. For all operating conditions PIV measurements were
taken at three different light sheet positions in the tip region of the blades. The light sheet planes
were aligned as tangential planes at three different radii, denoted with 1 in Figure 2. The lowest
light sheet location was chosen at 87.5% blade height, based on preliminary CFD calculations,
where the aerodynamic effects of the CT on the rotor passage flow start to decay. The second light
sheet plane was placed at 95% blade height and the third one in the tip gap of the rotor at
approximately 99% blade height. It should be mentioned that the light sheet planes tangentially
sliced the circular coordinate system of the compressor at given z-positions, such that the blade
radius is matched at the reference position y = 0 mm only (see left part of Figure 2).
xxxx
xxxx
xx
xxxxxxx
relative massflow [-]
tota
lpre
ssure
rati
o[-
]
0.8 0.85 0.9 0.95 1 1.05 1.10.8
0.85
0.9
0.95
1
1.05
1.1
1.15
1.2
RPM 100%
Measurements PIV CT
Measurements PIV SW
x
xxx
xxxxxx
x
x
x
x
xx
x
relative massflow [-]
rela
tiv
eis
.ef
fici
ency
[-]
0.8 0.85 0.9 0.95 1 1.05 1.10.8
0.85
0.9
0.95
1
1.05
1.1
x
Simulation SWExperiments SWExperiments CT
xxxx
xx
xxxxxxx
relative massflow [-]
tota
lpre
ssu
rera
tio
[-]
0.45 0.5 0.55 0.6 0.65 0.7 0.750.7
0.75
0.8
0.85
0.9
RPM 65%
xxxxx
xx
x
xx
x
x
x
relative massflow [-]
rela
tiv
eis
.ef
fici
ency
[-]
0.45 0.5 0.55 0.6 0.65 0.7 0.750.8
0.85
0.9
0.95
1
1.05
1.1
Figure 1: left: DTC stage with casing treatment; right: Performance maps of the DTC. Markers point out operating
conditions with PIV measurements for both treated casing (CT) and smooth walls (SW), related to PE-ADP
3 Modification of the Compressor Facility
To provide suitable access for the laser beam and light sheet optics, a periscope-type light sheet
probe was designed at DLR (Cologne) specifically for this application. Facility-related geometrical
restrictions had to be accounted for during construction: the outer diameter of the probe was limited
to 20 mm allowing the use of the standard casing plug as probe support. The light sheet was already
formed inside the probe using a set of collimating lenses for laser beam diameter adjustment
combined with two different cylindrical lenses with orthogonal focus planes, resulting in a light
sheet divergence angle of 10° and a thickness of 1 mm. The end cap of the periscope probe (see 2 in
Figure 2) contained a mirror that deflected the light sheet by 90° into the blade passage. The two
desired measurement planes were adjusted by traversing the probe with the help of a spacer ring.
For positioning the light sheet in the tip clearance of the rotor, a second periscope light sheet
probe was required. Here another standard casing plug downstream of the stator could be used as
probe support. In this case it was necessary that the end cap with the laser beam-guiding mirror
entered the flow field. Therefore the outer probe diameter was kept to minimum of 12 mm in order
to reduce any possible upstream disturbance of the wall-near flow. The resulting probe contained
very small optical components with diameters below 6 mm that required a precise alignment of the
laser beam path through the probe, to avoid streaking and associated laser flare from the inner
surface of the beam guiding tube. Similar to the upstream probe, a collimating lens pair and two
cylindrical lenses formed the light sheet with a thickness of 1 mm and a divergence angle of about
7°. The light sheet allowed for flow investigation in the region of one single slot (aligned with the
Page 4
14th Int Symp on Applications of Laser Techniques to Fluid Mechanics Lisbon, Portugal, 07-10 July, 2008
- 4 -
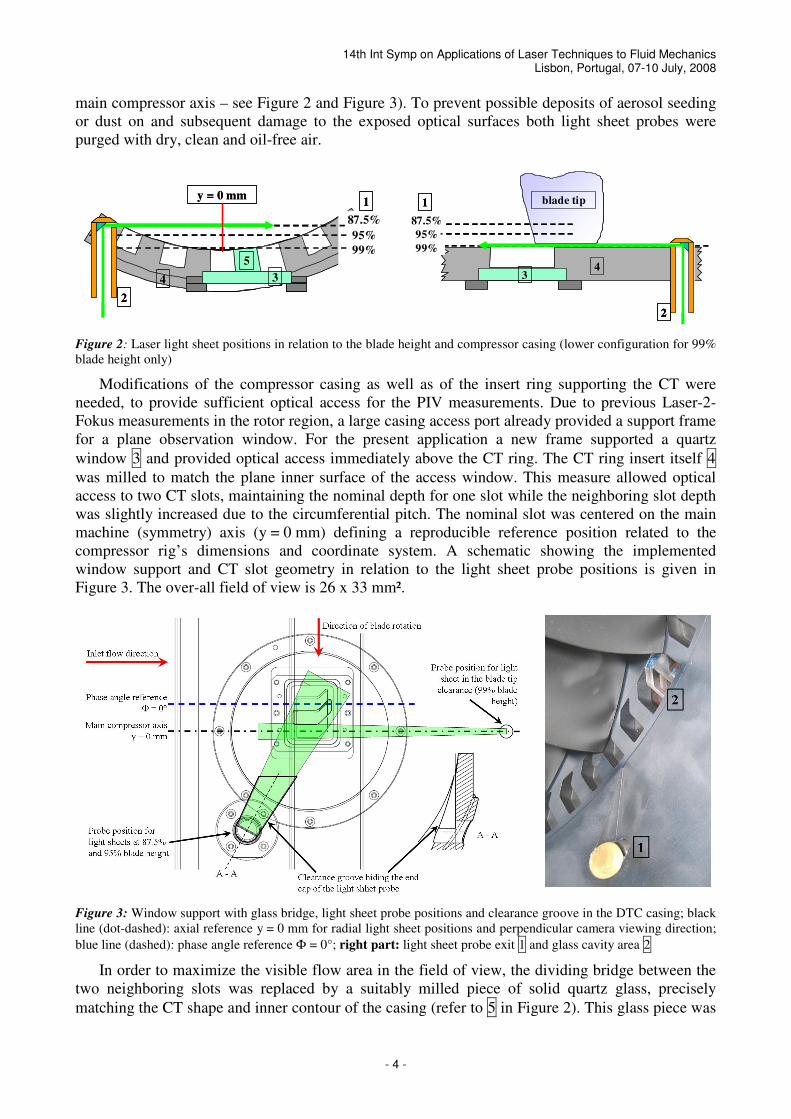
main compressor axis – see Figure 2 and Figure 3). To prevent possible deposits of aerosol seeding
or dust on and subsequent damage to the exposed optical surfaces both light sheet probes were
purged with dry, clean and oil-free air.
y = 0 mm
87.5%
95%
99%
2
1
4 3
5
y = 0 mm
87.5%
95%
99%
2
1
4 3
5
blade tip
43
87.5%
95%
99%
2
1 blade tip
43
87.5%
95%
99%
2
1
87.5%
95%
99%
2
1
Figure 2: Laser light sheet positions in relation to the blade height and compressor casing (lower configuration for 99%
blade height only)
Modifications of the compressor casing as well as of the insert ring supporting the CT were
needed, to provide sufficient optical access for the PIV measurements. Due to previous Laser-2-
Fokus measurements in the rotor region, a large casing access port already provided a support frame
for a plane observation window. For the present application a new frame supported a quartz
window 3 and provided optical access immediately above the CT ring. The CT ring insert itself 4
was milled to match the plane inner surface of the access window. This measure allowed optical
access to two CT slots, maintaining the nominal depth for one slot while the neighboring slot depth
was slightly increased due to the circumferential pitch. The nominal slot was centered on the main
machine (symmetry) axis (y = 0 mm) defining a reproducible reference position related to the
compressor rig’s dimensions and coordinate system. A schematic showing the implemented
window support and CT slot geometry in relation to the light sheet probe positions is given in
Figure 3. The over-all field of view is 26 x 33 mm².
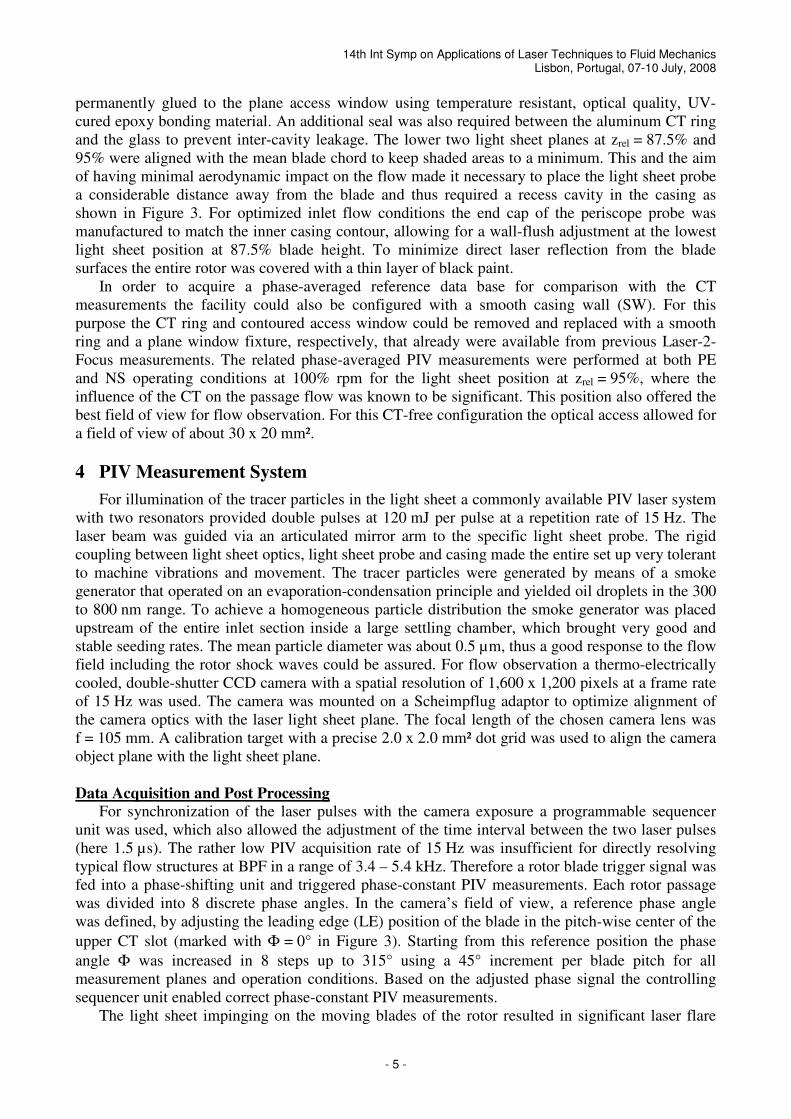
Figure 3: Window support with glass bridge, light sheet probe positions and clearance groove in the DTC casing; black
line (dot-dashed): axial reference y = 0 mm for radial light sheet positions and perpendicular camera viewing direction;
blue line (dashed): phase angle reference Φ = 0°; right part: light sheet probe exit 1 and glass cavity area 2
In order to maximize the visible flow area in the field of view, the dividing bridge between the
two neighboring slots was replaced by a suitably milled piece of solid quartz glass, precisely
matching the CT shape and inner contour of the casing (refer to 5 in Figure 2). This glass piece was
Page 5
14th Int Symp on Applications of Laser Techniques to Fluid Mechanics Lisbon, Portugal, 07-10 July, 2008
- 5 -
permanently glued to the plane access window using temperature resistant, optical quality, UV-
cured epoxy bonding material. An additional seal was also required between the aluminum CT ring
and the glass to prevent inter-cavity leakage. The lower two light sheet planes at zrel = 87.5% and
95% were aligned with the mean blade chord to keep shaded areas to a minimum. This and the aim
of having minimal aerodynamic impact on the flow made it necessary to place the light sheet probe
a considerable distance away from the blade and thus required a recess cavity in the casing as
shown in Figure 3. For optimized inlet flow conditions the end cap of the periscope probe was
manufactured to match the inner casing contour, allowing for a wall-flush adjustment at the lowest
light sheet position at 87.5% blade height. To minimize direct laser reflection from the blade
surfaces the entire rotor was covered with a thin layer of black paint.
In order to acquire a phase-averaged reference data base for comparison with the CT
measurements the facility could also be configured with a smooth casing wall (SW). For this
purpose the CT ring and contoured access window could be removed and replaced with a smooth
ring and a plane window fixture, respectively, that already were available from previous Laser-2-
Focus measurements. The related phase-averaged PIV measurements were performed at both PE
and NS operating conditions at 100% rpm for the light sheet position at zrel = 95%, where the
influence of the CT on the passage flow was known to be significant. This position also offered the
best field of view for flow observation. For this CT-free configuration the optical access allowed for
a field of view of about 30 x 20 mm².
4 PIV Measurement System
For illumination of the tracer particles in the light sheet a commonly available PIV laser system
with two resonators provided double pulses at 120 mJ per pulse at a repetition rate of 15 Hz. The
laser beam was guided via an articulated mirror arm to the specific light sheet probe. The rigid
coupling between light sheet optics, light sheet probe and casing made the entire set up very tolerant
to machine vibrations and movement. The tracer particles were generated by means of a smoke
generator that operated on an evaporation-condensation principle and yielded oil droplets in the 300
to 800 nm range. To achieve a homogeneous particle distribution the smoke generator was placed
upstream of the entire inlet section inside a large settling chamber, which brought very good and
stable seeding rates. The mean particle diameter was about 0.5 µm, thus a good response to the flow
field including the rotor shock waves could be assured. For flow observation a thermo-electrically
cooled, double-shutter CCD camera with a spatial resolution of 1,600 x 1,200 pixels at a frame rate
of 15 Hz was used. The camera was mounted on a Scheimpflug adaptor to optimize alignment of
the camera optics with the laser light sheet plane. The focal length of the chosen camera lens was
f = 105 mm. A calibration target with a precise 2.0 x 2.0 mm² dot grid was used to align the camera
object plane with the light sheet plane.
Data Acquisition and Post Processing
For synchronization of the laser pulses with the camera exposure a programmable sequencer
unit was used, which also allowed the adjustment of the time interval between the two laser pulses
(here 1.5 µs). The rather low PIV acquisition rate of 15 Hz was insufficient for directly resolving
typical flow structures at BPF in a range of 3.4 – 5.4 kHz. Therefore a rotor blade trigger signal was
fed into a phase-shifting unit and triggered phase-constant PIV measurements. Each rotor passage
was divided into 8 discrete phase angles. In the camera’s field of view, a reference phase angle
was defined, by adjusting the leading edge (LE) position of the blade in the pitch-wise center of the
upper CT slot (marked with Φ = 0° in Figure 3). Starting from this reference position the phase
angle Φ was increased in 8 steps up to 315° using a 45° increment per blade pitch for all
measurement planes and operation conditions. Based on the adjusted phase signal the controlling
sequencer unit enabled correct phase-constant PIV measurements.
The light sheet impinging on the moving blades of the rotor resulted in significant laser flare
Page 6
14th Int Symp on Applications of Laser Techniques to Fluid Mechanics Lisbon, Portugal, 07-10 July, 2008
- 6 -
and subsequently caused considerable overexposure of the CCD sensor in large portions of the
imaged area (so-called image blooming). This could be drastically reduced by shading the flare area
with a piece of sheet metal, roughly matching the shape of the blade, immediately in front of the
observation window. With changing phase trigger angles this mask was automatically moved up
and down according to the given phase angle for the actual PIV recording.
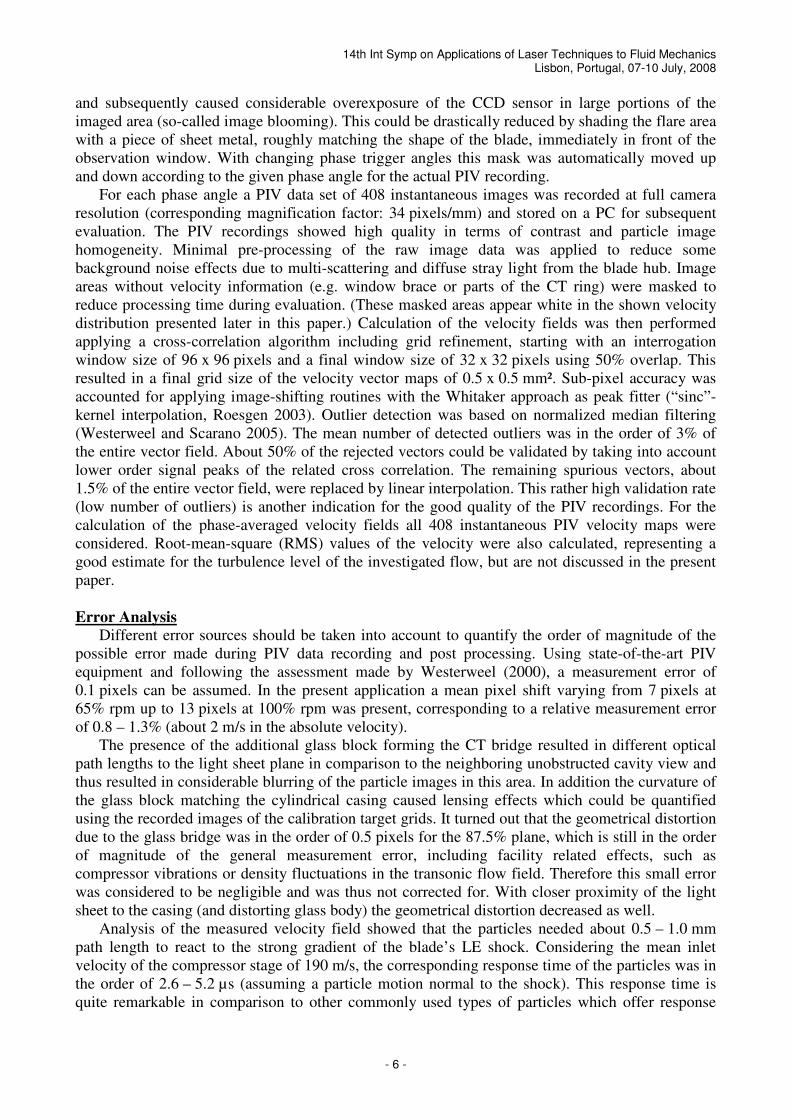
For each phase angle a PIV data set of 408 instantaneous images was recorded at full camera
resolution (corresponding magnification factor: 34 pixels/mm) and stored on a PC for subsequent
evaluation. The PIV recordings showed high quality in terms of contrast and particle image
homogeneity. Minimal pre-processing of the raw image data was applied to reduce some
background noise effects due to multi-scattering and diffuse stray light from the blade hub. Image
areas without velocity information (e.g. window brace or parts of the CT ring) were masked to
reduce processing time during evaluation. (These masked areas appear white in the shown velocity
distribution presented later in this paper.) Calculation of the velocity fields was then performed
applying a cross-correlation algorithm including grid refinement, starting with an interrogation
window size of 96 x 96 pixels and a final window size of 32 x 32 pixels using 50% overlap. This
resulted in a final grid size of the velocity vector maps of 0.5 x 0.5 mm². Sub-pixel accuracy was
accounted for applying image-shifting routines with the Whitaker approach as peak fitter (“sinc”-
kernel interpolation, Roesgen 2003). Outlier detection was based on normalized median filtering
(Westerweel and Scarano 2005). The mean number of detected outliers was in the order of 3% of
the entire vector field. About 50% of the rejected vectors could be validated by taking into account
lower order signal peaks of the related cross correlation. The remaining spurious vectors, about
1.5% of the entire vector field, were replaced by linear interpolation. This rather high validation rate
(low number of outliers) is another indication for the good quality of the PIV recordings. For the
calculation of the phase-averaged velocity fields all 408 instantaneous PIV velocity maps were
considered. Root-mean-square (RMS) values of the velocity were also calculated, representing a
good estimate for the turbulence level of the investigated flow, but are not discussed in the present
paper.
Error Analysis
Different error sources should be taken into account to quantify the order of magnitude of the
possible error made during PIV data recording and post processing. Using state-of-the-art PIV
equipment and following the assessment made by Westerweel (2000), a measurement error of
0.1 pixels can be assumed. In the present application a mean pixel shift varying from 7 pixels at
65% rpm up to 13 pixels at 100% rpm was present, corresponding to a relative measurement error
of 0.8 – 1.3% (about 2 m/s in the absolute velocity).
The presence of the additional glass block forming the CT bridge resulted in different optical
path lengths to the light sheet plane in comparison to the neighboring unobstructed cavity view and
thus resulted in considerable blurring of the particle images in this area. In addition the curvature of
the glass block matching the cylindrical casing caused lensing effects which could be quantified
using the recorded images of the calibration target grids. It turned out that the geometrical distortion
due to the glass bridge was in the order of 0.5 pixels for the 87.5% plane, which is still in the order
of magnitude of the general measurement error, including facility related effects, such as
compressor vibrations or density fluctuations in the transonic flow field. Therefore this small error
was considered to be negligible and was thus not corrected for. With closer proximity of the light
sheet to the casing (and distorting glass body) the geometrical distortion decreased as well.
Analysis of the measured velocity field showed that the particles needed about 0.5 – 1.0 mm
path length to react to the strong gradient of the blade’s LE shock. Considering the mean inlet
velocity of the compressor stage of 190 m/s, the corresponding response time of the particles was in
the order of 2.6 – 5.2 µs (assuming a particle motion normal to the shock). This response time is
quite remarkable in comparison to other commonly used types of particles which offer response
Page 7
14th Int Symp on Applications of Laser Techniques to Fluid Mechanics Lisbon, Portugal, 07-10 July, 2008
- 7 -
times in the order of 10 µs and thus act as low pass filters on the investigated flow with a cut off
frequency of 100 kHz (Schröder and Willert 2007). Given a measured mean velocity range of 150 –
250 m/s and a final grid spacing of 0.5 x 0.5 mm (based on the interrogation areas) along with the
smaller seeding particles allow flow structures with turn-over frequencies between 400 – 800 kHz
still to be resolved. Thus flow structures scaling with the BPF interacting with the CT, being in the
order of 300 kHz at 100% RPM, could be faithfully captured.
Finally it should be noted that the present PIV measurements only captured the projection of the
velocity vector onto the light sheet plane under observation. As the simulations performed at MTU
predicted a very high out-of-plane velocity component (perpendicular to the light sheet planes) in
the order of magnitude of the mean inlet absolute velocity, this can be the possible cause for the
deviations in absolute flow angle and velocity compared to the CFD results based on full 3D
calculations (as discussed in detail in Schnell et al. 2008).
5 PIV RESULTS
The following PIV results are presented starting with the measurements performed with SW at
100% rpm for the light sheet plane at zrel = 95%. Due to the unobstructed blade passage flow, the
velocity results can be regarded quasi-steady. This allowed for a pitch-wise reconstruction of the
passage flow field from the phase-averaged velocity maps, as illustrated in Figure 4. For NS
conditions the phase-averaged velocity maps seem to have some discontinuities in the pitch-wise
reconstructed flow field, which is due to the unsteady behavior of the rotor passage flow at NS.
PE SW NS
PE SW NS
Figure 4: Pitch-wise reconstruction of measured PIV velocity fields for the DTC with smooth casing (SW) at 95%
blade height and 100% rpm for both, PE-ADP and NS conditions; left side: axial velocity component u (colored
contour), right side: circumferential velocity component v (colored contour). All vectors give absolute velocity
directions.
As the different phase angle measurements have been performed sequentially, some structures
may not perfectly fit. In order to keep the original character of the flow no smoothing or
interpolation was applied to the pitch-wise reconstructed vector maps. The colored contour
represents the magnitude of the measured axial or circumferential velocity component. All vectors
Page 8
14th Int Symp on Applications of Laser Techniques to Fluid Mechanics Lisbon, Portugal, 07-10 July, 2008
- 8 -
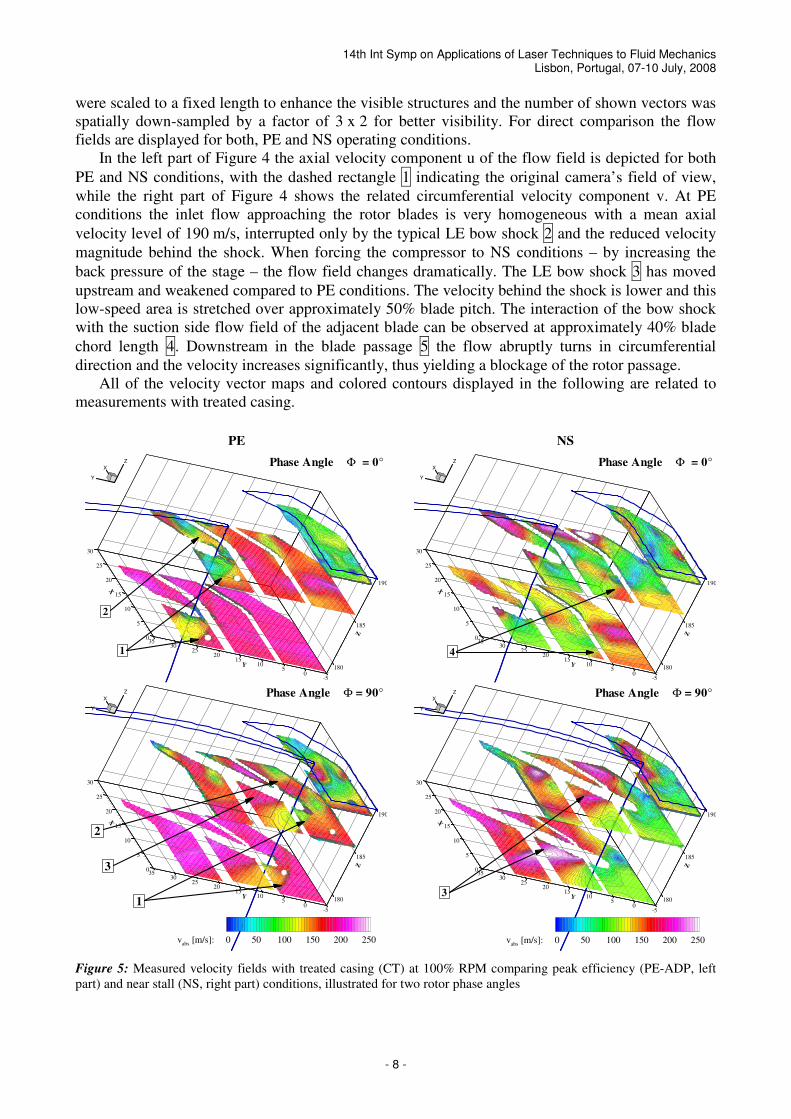
were scaled to a fixed length to enhance the visible structures and the number of shown vectors was
spatially down-sampled by a factor of 3 x 2 for better visibility. For direct comparison the flow
fields are displayed for both, PE and NS operating conditions.
In the left part of Figure 4 the axial velocity component u of the flow field is depicted for both
PE and NS conditions, with the dashed rectangle 1 indicating the original camera’s field of view,
while the right part of Figure 4 shows the related circumferential velocity component v. At PE
conditions the inlet flow approaching the rotor blades is very homogeneous with a mean axial
velocity level of 190 m/s, interrupted only by the typical LE bow shock 2 and the reduced velocity
magnitude behind the shock. When forcing the compressor to NS conditions – by increasing the
back pressure of the stage – the flow field changes dramatically. The LE bow shock 3 has moved
upstream and weakened compared to PE conditions. The velocity behind the shock is lower and this
low-speed area is stretched over approximately 50% blade pitch. The interaction of the bow shock
with the suction side flow field of the adjacent blade can be observed at approximately 40% blade
chord length 4. Downstream in the blade passage 5 the flow abruptly turns in circumferential
direction and the velocity increases significantly, thus yielding a blockage of the rotor passage.
All of the velocity vector maps and colored contours displayed in the following are related to
measurements with treated casing.
PE NS
180
185
190
Z
0
5
10
15
20
25
30
X-5
05
1015
2025
3035
Y
X
Y
Z Phase Angle = 0°Φ
2
1
180
185
190
Z
0
5
10
15
20
25
30
X
-50
510
1520
2530
35
Y
X
Y
Z Phase Angle = 0°Φ
4
180
185
190
Z
0
5
10
15
20
25
30
X
-50
510
1520
2530
35
Y
X
Y
Z
vabs
[m/s]: 0 50 100 150 200 250
Phase Angle = 90°Φ
3
1
2
180
185
190
Z
0
5
10
15
20
25
30
X
-50
510
1520
2530
35
Y
X
Y
Z
vabs
[m/s]: 0 50 100 150 200 250
Phase Angle = 90°Φ
3
Figure 5: Measured velocity fields with treated casing (CT) at 100% RPM comparing peak efficiency (PE-ADP, left
part) and near stall (NS, right part) conditions, illustrated for two rotor phase angles
Page 9
14th Int Symp on Applications of Laser Techniques to Fluid Mechanics Lisbon, Portugal, 07-10 July, 2008
- 9 -
They are scaled to the same absolute levels allowing for direct comparison of the different flow
phenomena for all discussed operating conditions and light sheet positions. A rendering of the blade
profile as well as the CT slot geometry is included as blue lines. In Figure 5 the results for all three
light sheet planes have been combined for two different phase angle relations (Φ = 0° and 90°),
comparing PE and NS operating conditions. The z-axis is stretched by a factor of two in comparison
to the x- and y-axis in order to improve the perspective view on the combined planes. Generally it
can be stated that the phase-averaged PIV results form a consistent velocity data set, as the fluid
structures can be tracked between the three light sheet planes, although the measurements were
performed sequentially for each single plane.
While the measurements with CT at zrel = 87.5% and PE-ADP appear to be nearly unaffected by
the CT, all other operating conditions and light sheet planes show evidence of the rotor flow
interacting with the CT. Compared to the PIV results with SW (Figure 4) the homogeneous inlet
flow at PE conditions can only be observed for 87.5% passage height, whereas the LE bow shock 1
can be clearly observed in all three measurement planes (left part of Figure 5). On the pressure side
of the blade a strong passage shock 2 develops at approximately 10% axial chord length, most
pronounced for zrel = 95%. A third shock structure specifically induced by the CT becomes visible
for the phase angle relation Φ = 90°: the shock occurs right behind the expansion region of the
blade suction side 3. Here the CT induced shock is easier to detect analyzing the two velocity
components u and v separately, as given in Schnell et al. (2008).
For NS conditions (right part of Figure 5) the LE bow shock 4 has moved far upstream and
weakened. At the reference phase angle Φ = 0° the CT influence is also pronounced for the lowest
observation plane at zrel = 87.5%, visible in the wavelike (S-shaped) character of the bow shock.
The pressure side passage shock has also moved upstream now merging with the bow shock. The
low-velocity area behind the new shock configuration is extended over a large area and the inlet
flow approaching the rotor is interrupted by smaller structures of higher as well as lower velocity,
scaling in size with the dimension of the CT slot width (more discussion on these structures will be
provided related to Figure 6 and Figure 7). As the effect of the CT slots to the compressor flow at
NS conditions is more distinct, the suction side shock 3 can be clearly identified in Figure 5 for
Φ = 90°.
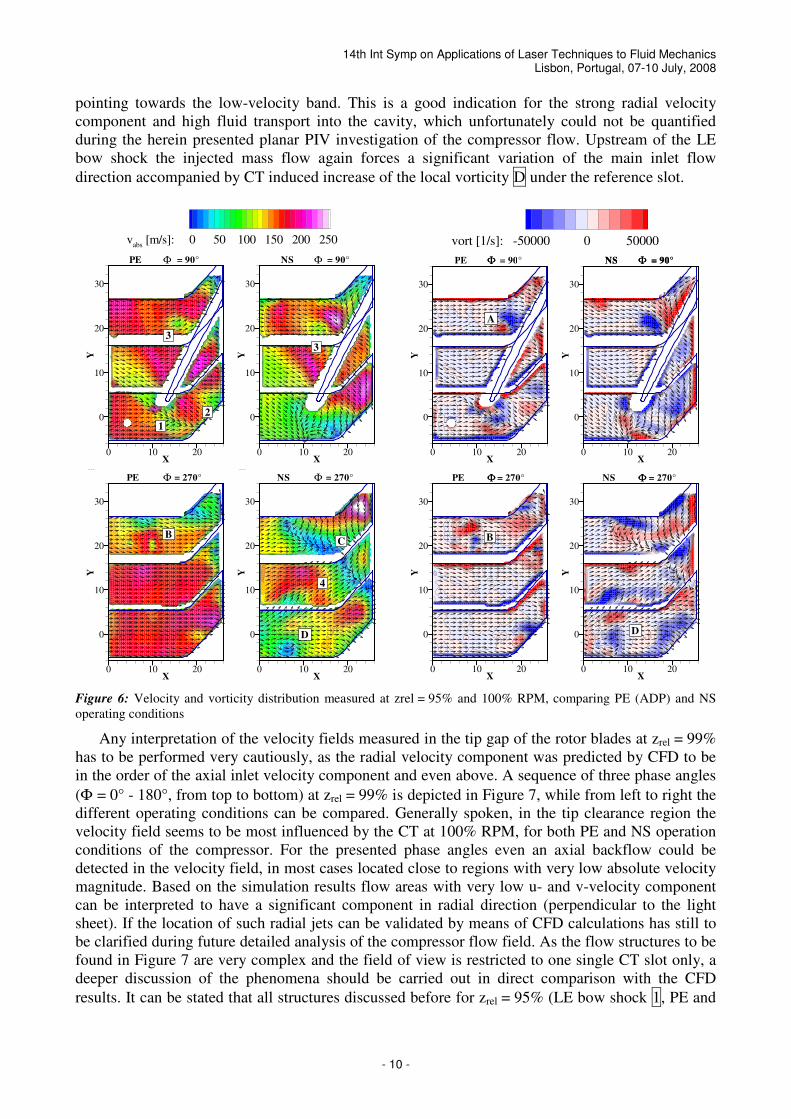
At a reduced speed of 65% rpm the effect of the CT to the rotor passage flow can also be
observed, but this will not be discussed in this paper. The effects of the CT on the blade tip flow
field are even more diverse at 100% rpm, as illustrated in Figure 6 for the same light sheet plane
(zrel = 95%) and phase angles. At PE conditions and Φ = 90° the LE bow shock 1 appears weaker
(compared to SW) and shows a slight S-shape, which is due to the high fluid transport through the
CT from pressure to suction side of the blade. In the rear part of the reference slot the pressure side
passage shock 2 is also visible. The CT induced suction side shock behind the expansion region of
the blade (half hidden due to the masked area of the glass bridge) is denoted with 3. This shock is
even more pronounced at NS conditions, but shifted upstream compared to PE. In the upper slot the
mass flow inside the cavity is lower as the driving forces have reduced significantly on the blade
suction side under the rear part of the slot. Here the interaction between blade tip flow and CT is
visible as vortical structures A. Under NS conditions the LE bow shock has moved far upstream 4
in front of the blade (Φ = 270°) and is now merging with the also moved passage shock from the
blades pressure side, resulting in the strong S-curvature of the shock front. At PE conditions the
influence of the recirculating cavity fluid is only detectable as vortex structures B in the upper slot.
The remaining inlet flow appears more or less unaffected by the recirculation in the cavity, showing
a homogeneous character similar to SW conditions. Focusing on the phase angle Φ = 270° at NS
conditions, the mass flow transport through the cavities is strongest. This is indicated by the narrow
band of very low velocity magnitude in the upper slot C and in the rear part of the glass bridge. In
that flow region the vectors are aligned under an angle of up to 90° against inlet flow direction,
Page 10
14th Int Symp on Applications of Laser Techniques to Fluid Mechanics Lisbon, Portugal, 07-10 July, 2008
- 10 -
pointing towards the low-velocity band. This is a good indication for the strong radial velocity
component and high fluid transport into the cavity, which unfortunately could not be quantified
during the herein presented planar PIV investigation of the compressor flow. Upstream of the LE
bow shock the injected mass flow again forces a significant variation of the main inlet flow
direction accompanied by CT induced increase of the local vorticity D under the reference slot.
vabs
[m/s]: 0 50 100 150 200 250
Φ
vort [1/s]: -50000 0 50000
Phase Angle = 90°Φ
3
X
Y
0 10 20
0
10
20
30
ΦNS = 90°
2
1
3
X
Y
0 10 20
0
10
20
30
PE = 90°Φ
A
X
Y
0 10 20
0
10
20
30
PE = 90°ΦΦ
X
Y
0 10 20
0
10
20
30
NS = 90°ΦΦNS = 90°
B
X
Y
0 10 20
0
10
20
30
abs
PE = 270°Φ
4
C
D
X
Y
0 10 20
0
10
20
30
abs
ΦNS = 270°
D
X
Y
0 10 20
0
10
20
30
ΦΦNS = 270°
B
X
Y
0 10 20
0
10
20
30
PE = 270°ΦΦ
Figure 6: Velocity and vorticity distribution measured at zrel = 95% and 100% RPM, comparing PE (ADP) and NS
operating conditions
Any interpretation of the velocity fields measured in the tip gap of the rotor blades at zrel = 99%
has to be performed very cautiously, as the radial velocity component was predicted by CFD to be
in the order of the axial inlet velocity component and even above. A sequence of three phase angles
(Φ = 0° - 180°, from top to bottom) at zrel = 99% is depicted in Figure 7, while from left to right the
different operating conditions can be compared. Generally spoken, in the tip clearance region the
velocity field seems to be most influenced by the CT at 100% RPM, for both PE and NS operation
conditions of the compressor. For the presented phase angles even an axial backflow could be
detected in the velocity field, in most cases located close to regions with very low absolute velocity
magnitude. Based on the simulation results flow areas with very low u- and v-velocity component
can be interpreted to have a significant component in radial direction (perpendicular to the light
sheet). If the location of such radial jets can be validated by means of CFD calculations has still to
be clarified during future detailed analysis of the compressor flow field. As the flow structures to be
found in Figure 7 are very complex and the field of view is restricted to one single CT slot only, a
deeper discussion of the phenomena should be carried out in direct comparison with the CFD
results. It can be stated that all structures discussed before for zrel = 95% (LE bow shock 1, PE and
Page 11
14th Int Symp on Applications of Laser Techniques to Fluid Mechanics Lisbon, Portugal, 07-10 July, 2008
- 11 -
NS suction side shock 2 and cavity recirculation flow 3) could be qualitatively validated in the
measured tip clearance flow field. More flow details are discussed in comparison to the calculations
performed using the TRACE code in Schnell et al. (2008).
vabs
[m/s]: 0 50 100 150 200 250
Φ
3
X
Y
0 5 10 15 20 25
-5
0
5
NS = 0°Φ
3
X
Y
0 5 10 15 20 25
-5
0
5
PE = 0°Φ
X
Y
0 5 10 15 20 25
-5
0
5
ΦNS = 90°
1
X
Y
0 5 10 15 20 25
-5
0
5
ΦPE = 90°
2
X
Y
0 5 10 15 20 25
-5
0
5
ΦNS = 180°
2
X
Y
0 5 10 15 20 25
-5
0
5
ΦPE = 180°
Figure 7: Phase angle sequence describing rotor movement by half a pitch, measured at zrel = 99% for 100% RPM,
comparing PE (left) and NS (right) operating conditions
6 Concluding Remarks
In the presented study it was demonstrated that PIV is capable of capturing the flow phenomena
in the rotor tip clearance as well as in the blade passages of a transonic compressor stage. Phase-
constant measurements were carried out with a resolution of 8 phase angles per blade pitch in
relation to the CT slots visible in the camera’s field of view. The results obtained show the
influence of the CT design on the rotor passage flow, interacting phenomena as well as shock
configurations of the flow field, for both peak efficiency and near stall operating conditions. A
reference PIV measurement with smooth casing walls (SW) was also performed for a single light
sheet plane (95% blade height), to emphasize the effect of the CT on the investigated flow field. All
results are of very high quality concerning spatial resolution and data validation rates. In part this is
also due to the novel choice of smoke-based tracer particles dispersed in the flow – an approach not
previously reported. A general characterization of the investigated flow field was given based on
the phase-averaged velocity vector maps.
In summary a comprehensive PIV data base was successfully established that characterizes the
flow field in three light sheet planes. Based on this velocity information validation of the
accompanying CFD calculation using the TRACE code was performed. The flow field results
obtained by PIV and CFD are expected to further improve the understanding of the complex flow
phenomena occurring in the transonic compressor stage with casing treatment. In the near future
follow-up stereoscopic PIV measurements are planned to capture the out-of-plane velocity
component in the immediate vicinity of the cavity in order to shed light on some of the momentum
Page 12
14th Int Symp on Applications of Laser Techniques to Fluid Mechanics Lisbon, Portugal, 07-10 July, 2008
- 12 -
transfer effects between the cavity and the passage / rotor flow.
7 Acknowledgments
The project was funded by the German ministry of economics in the context of the AG-Turbo
framework COOREFF-T (reference number 0327713 E).
The authors would like to thank all project partners and colleagues for the very good
cooperation and support during the PIV measurement campaign and for the permission to publish
the results presented herein. The fruitful discussions with Dr. Richard Schodl during preparation of
the PIV measurements are also gratefully acknowledged.
8 References
Emmrich, R., Hoehnen, H., Niehus, R. (2007): Time Resolved Investigations of an Axial Compressor with Casing
Treamant. GT2007-27581 and GT2007-27582, Proceedings of ASME Turbo Expo, Montreal, May 14-17
Greitzer, E.M., Nikkanen, J.P., Haddad, D.E., Mazzaway, R.S., Joslyn, H.D.: A Fundamental Criterion for the
Application of Rotor Casing Treatment. ASME Journal of Fluids Engineering 101: 237-243
Hathaway, M.D. (2002): Self-Recirculating Casing-Treatment Concept for Enhanced Compressor Performance.
GT2003-30368, Proceedings of ASME Turbo Expo, Amsterdam, June 7-13
Hojo, M., Hayami, H., Aramaki, S. (2003): 3D Configuration of Shock Wave in Transonic Centrifugal Impeller Using
2D-PIV. Proceedings of the International Gas Turbine Congress, Tokyo, Nov. 2-7
Liu, B., Yu, X., Liu, H., Jiang, H., Yuan, H., Xu, Y. (2006): Application of SPIV in Turbomachinery. Exp. Fluids 40:
621-642
Lu, X., Zhu, J. (2005): The Effects of Bend Skewed Groove Casing Treastment on Performance and Flow Field Near
the Endwall of an Axial Compressor. AIAA 2005-809, Toronto, June 6-9
Lu, X., Zhu, J. (2006): Experimental and Numerical Investigation of a Subsonic Compressor with Bend Skewed Slots
Casing Treatment. GT2006-90026, Proceedings of ASME Turbo Expo, Barcelona, May 8-11
Müller, M.W., Schiffer, H.P., Hah, C. (2007): Effect of Circumferential Grooves in the Aerodynamic Performance of an
Axial Single-Stage Transonic Compressor. GT2007-27365, Proceedings of ASME Turbo Expo, Montreal, May 14-
17
Raffel, M., Willert, C., Wereley, S., Kompenhans, J. (2007): Particle Image Velocimetry, a practical guide (Second
Edition). Springer Berlin Heidelberg, ISBN 978-3-540-72307-3
Roesgen, T. (2003): Optimal Subpixel Interpolation in Particle Image Velocimetry. Exp. Fluids 35: 252-256
Schnell, R., Voges, M., Mönig, R., Müller, M.W., Zscherp, C. (2008): Investigation of Blade Tip Interaction with
Casing Treatment in a Transonic Compressor – Part 2: Numerical Results. GT2008-50212, to appear in:
Proceedings of ASME Turbo Expo, Berlin, June 9-13
Schröder, A., Willert, C.E. (2007): Particle Image Velocimetry. Topics Appl. Physics 112: 311-331 (Woisetschläger, J.,
Göttlich, E.), Springer Berlin Heidelberg, ISBN 978-3-540-73527-4
Voges, M., Beversdorff, M., Willert, C., Krain, H. (2007): Application of Particle Image Velocimetry to a Transonic
Centrifugal Compressor. Exp. Fluids 43: 371-384
Wereley, S.T., Meinhart, C.D. (2001): Second-Order Accurate Particle Image Velocimetry. Exp. Fluids 31: 258-268
Wernet, M.P. (2000): Application of DPIV to Study Both Steady State and Transient Turbomachinery Flows. Optics &
Laser Technology 32: 497-525
Wernet M.P., van Zante, D., Strazisar, T.J., John, W.T., Prahst, P.S. (2005): Characterization of Tip Clearance Flow in
an Axial Compressor Using 3-D Digital PIV. Exp. Fluids 39: 743-754
Westerweel, J. (2000): Theoretical Analysis of the Measurement Precision in Particle Image Velocimetry. Exp. Fluids
29: Suppl. S3-S12
Westerweel, J., Scarano, F. (2005): Universal Outlier Detection for PIV Data. Exp. Fluids 39: 1096-1100
Wilke, I., Kau, H.-P. (2003): A Numerical Investigation of the Flow Mechanisms in a HPC Front Stage with Axial
Slots. GT2003-38481, Proceedings of ASME Turbo Expo, Atlanta, June 16-19
Woisetschläger, J., Mayrhofer, N., Hampel, B., Lang, H., Sanz, W. (2003): Laser-Optical Investigation of Turbine
Wake Flow. Exp. Fluids 34: 371-378