61
1 Colombia Capacity Auction Peter Cramton (with many ideas from Steven Stoft) 9 June 2006
| Date post: | 01-Jan-2016 |
| Category: |
Documents |
| Upload: | karin-randall |
| View: | 217 times |
| Download: | 1 times |
1
Colombia Capacity Auction
Peter Cramton(with many ideas from Steven Stoft)
9 June 2006
2
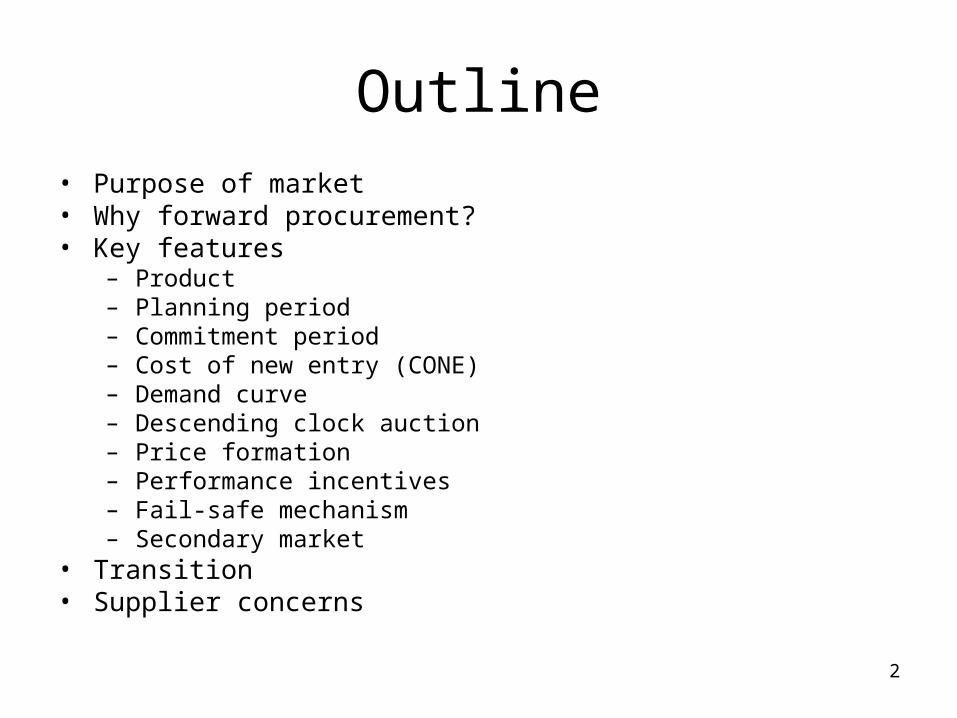
Outline• Purpose of market• Why forward procurement?• Key features
– Product– Planning period– Commitment period– Cost of new entry (CONE)– Demand curve– Descending clock auction– Price formation– Performance incentives– Fail-safe mechanism– Secondary market
• Transition• Supplier concerns

3
Purpose of Market

4
Purpose of market
• Induce just enough investment to maintain adequate resources
• Induce efficient mix of resources
• Reduce market risk
• Avoid market power in capacity market
• Reduce market power in energy market
• Pay no more than necessary

5
Why forward procurement?
6
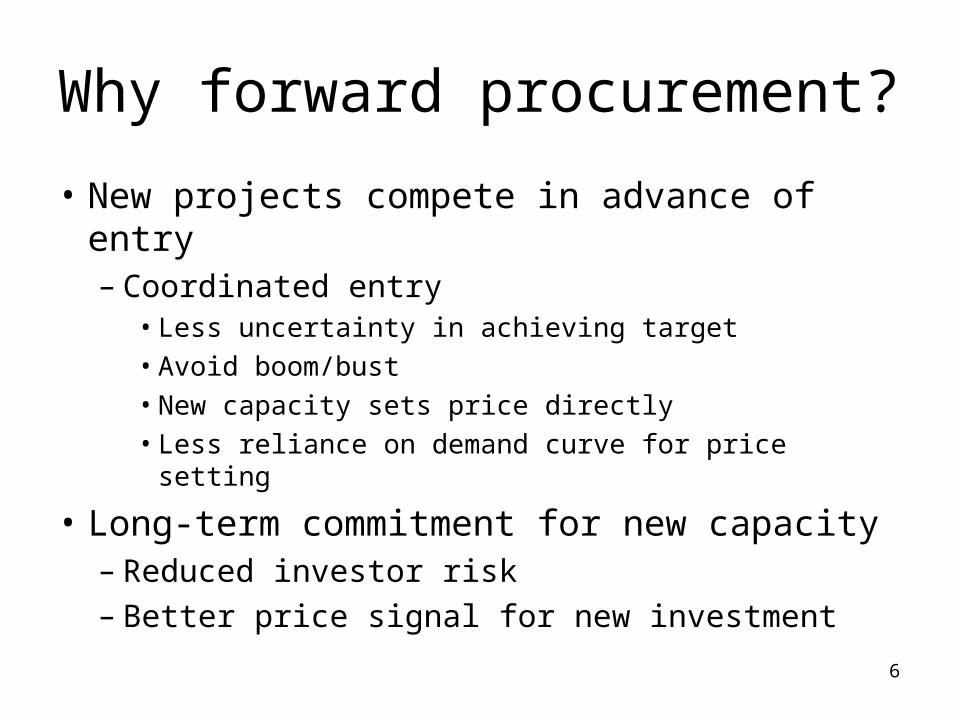
Why forward procurement?
• New projects compete in advance of entry– Coordinated entry
• Less uncertainty in achieving target• Avoid boom/bust• New capacity sets price directly• Less reliance on demand curve for price setting
• Long-term commitment for new capacity– Reduced investor risk– Better price signal for new investment

7
Key features
8
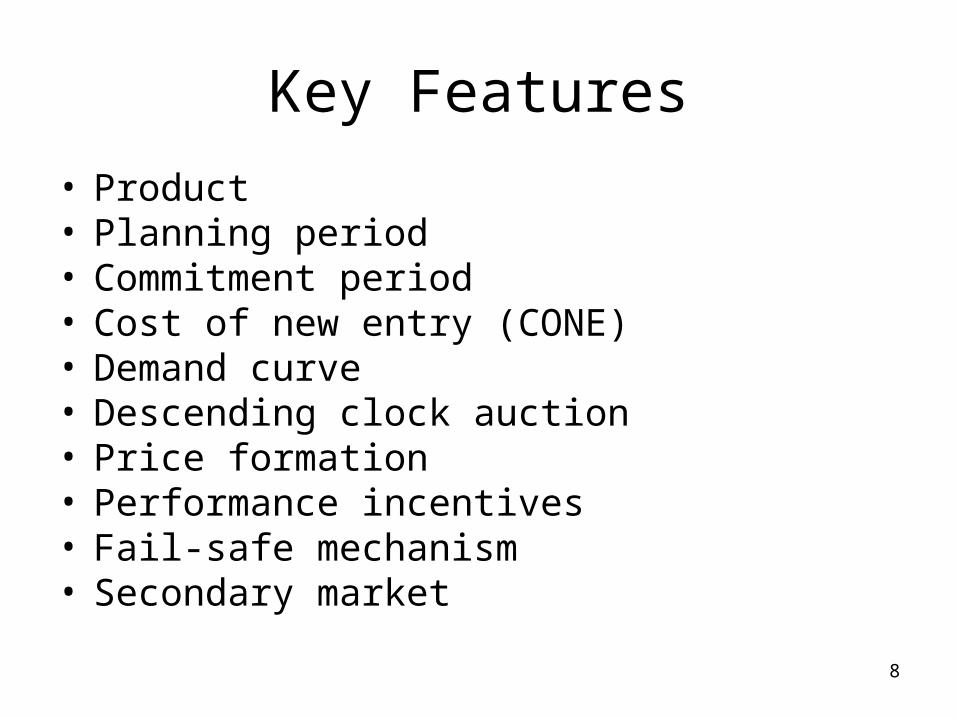
Key Features
• Product• Planning period• Commitment period• Cost of new entry (CONE)• Demand curve• Descending clock auction• Price formation• Performance incentives• Fail-safe mechanism• Secondary market

9
Product

10
Product
• Firm energy ― availability of energy during scarcity events– Dry year (seasonal scarcity)– Outages (spot scarcity)
• Scarcity event defined by high energy price– Energy price is a transparent trigger– Energy price is a reliable trigger
11
Product
• Capacity-backed energy option• Capacity defined by delivery capability in worst-case
benchmark ― a very dry year– Nameplate capacity (maximum output rate)– Firm energy capacity (average energy output rate in worst-case
benchmark)• Thermal example: 92% of nameplate due to outages• Hydro example: 35% of nameplate due to limited water
• Strike price = Gas index high heat rate– Gas index = New York Harbor residual fuel oil– High heat rate = 15 MBTU/MWh (about US$130 as of May 2006)
• This is less than the heat rate of all existing thermal units• New thermal peakers have heat rates of 9-10
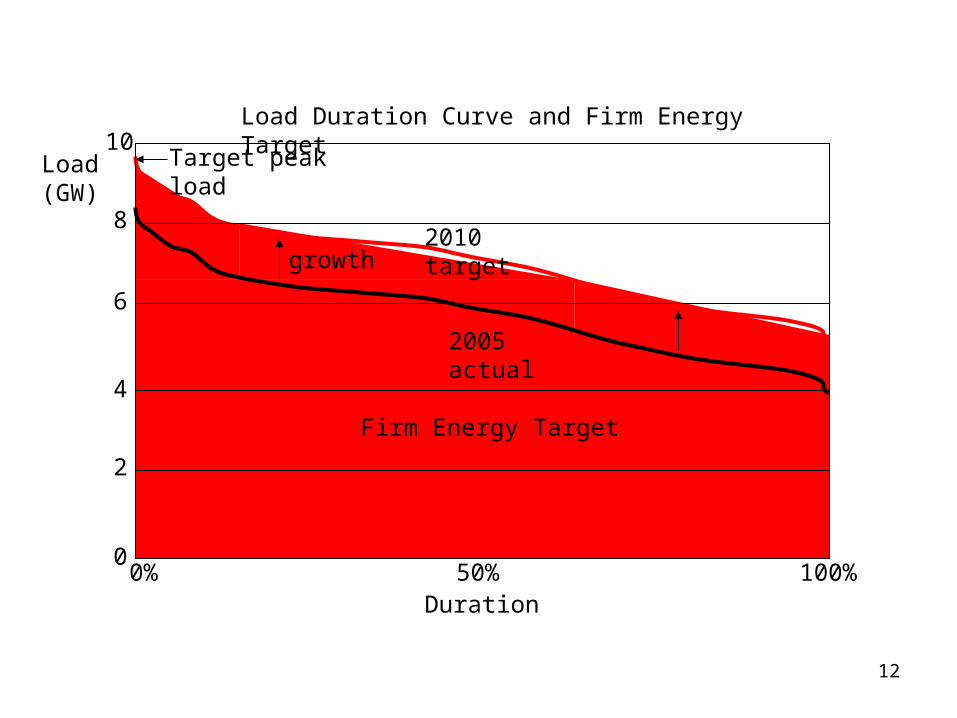
12
2010 target
2005 actual
0% 50% 100%
2
4
6
8
10
0
Duration
Load(GW)
Firm Energy Target
Load Duration Curve and Firm Energy Target
growth
Target peak load
13
Single product; single price
• In a hydro-dominated system, there is a single reliability constraint:firm energy to cover dry year
• Single constraint implies single product and single price
• Each new resource is rated for its incremental contribution to the firm energy constraint
14
Product is:• Firm energy + mandatory hedge
• Firm energy =– Expected annual drought-year energy contribution to
system (if unit disappeared, how much less energy would the system have—same for hydro and fossil)
• Mandatory hedge = – Hedge of your share of hourly load
• If supplying 10% of firm energy target, then have a 10% obligation to serve load in every hour of scarcity event
• Can spread obligation across hours or units without penalty• Rewarded if shift output to higher priced hours
15
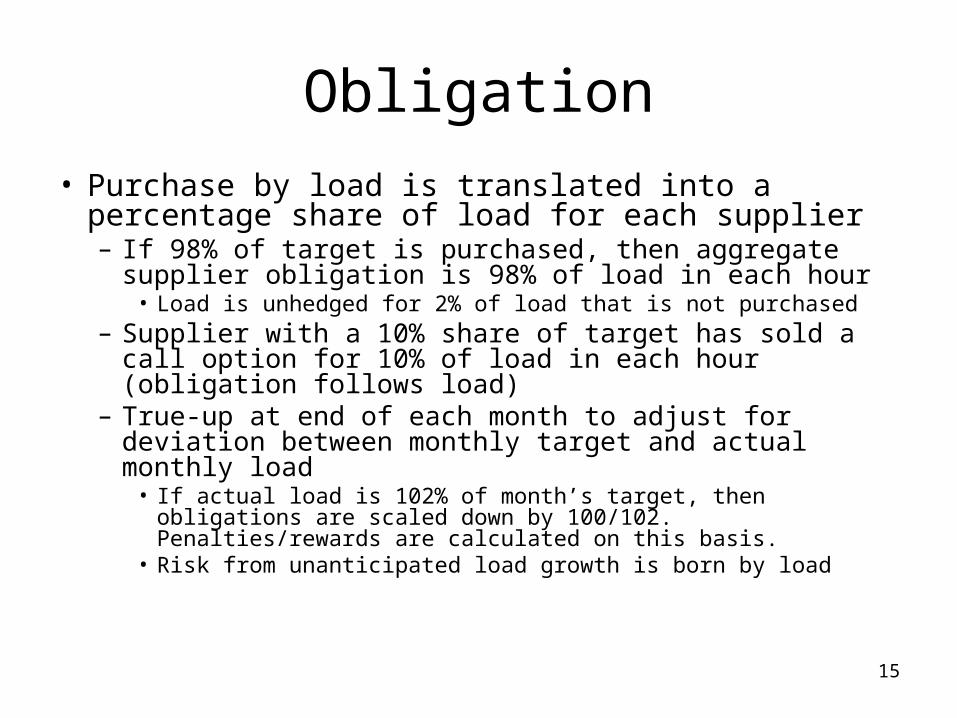
Obligation
• Purchase by load is translated into a percentage share of load for each supplier– If 98% of target is purchased, then aggregate supplier
obligation is 98% of load in each hour• Load is unhedged for 2% of load that is not purchased
– Supplier with a 10% share of target has sold a call option for 10% of load in each hour(obligation follows load)
– True-up at end of each month to adjust for deviation between monthly target and actual monthly load
• If actual load is 102% of month’s target, then obligations are scaled down by 100/102. Penalties/rewards are calculated on this basis.
• Risk from unanticipated load growth is born by load
16
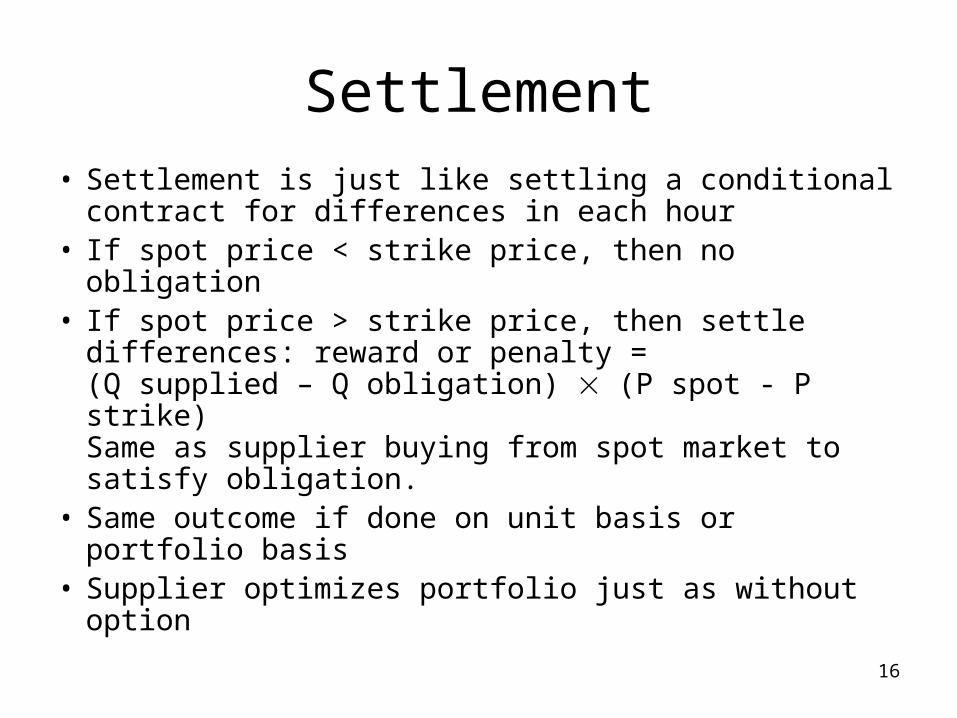
Settlement
• Settlement is just like settling a conditional contract for differences in each hour
• If spot price < strike price, then no obligation• If spot price > strike price, then settle
differences: reward or penalty =(Q supplied – Q obligation) (P spot - P strike)Same as supplier buying from spot market to satisfy obligation.
• Same outcome if done on unit basis or portfolio basis
• Supplier optimizes portfolio just as without option

17
Planning period

18
Planning period
• Time between auction date and start of commitment
• 3 to 4 years ― long enough for new entry to occur
• Makes capacity market contestable and allows new entry to set the price– Existing capacity would set the wrong price
because of sunk costs and market power

19
Planning period
• First auction (2010): 3 year
• Second auction (2011): 3.5 year
• All later auctions (2012…): 4 year

20
Commitment period
21
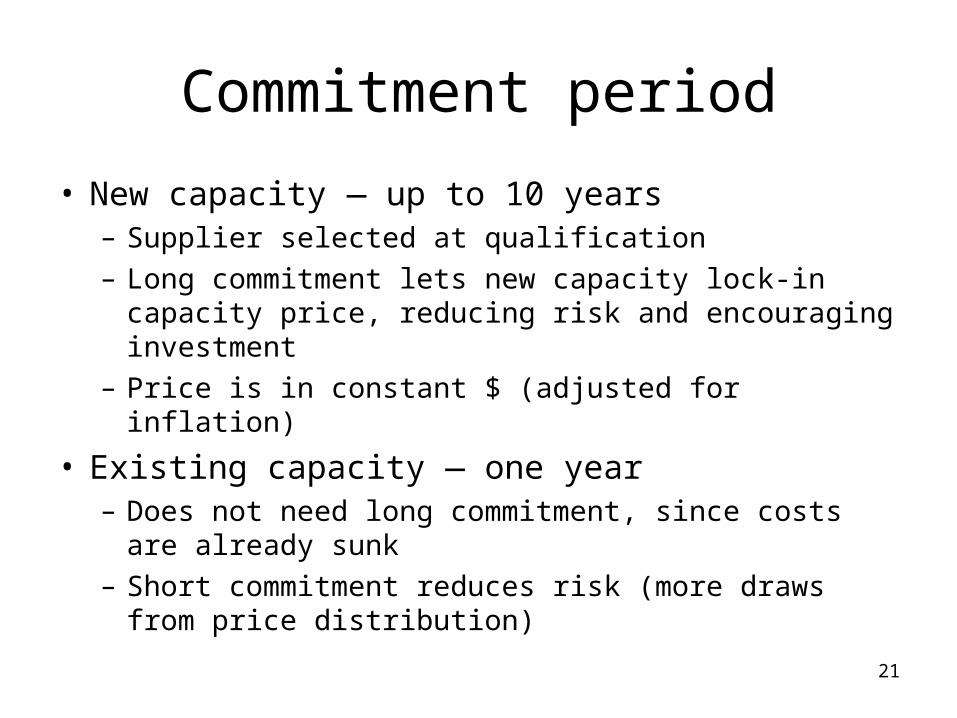
Commitment period
• New capacity ― up to 10 years– Supplier selected at qualification– Long commitment lets new capacity lock-in capacity
price, reducing risk and encouraging investment– Price is in constant $ (adjusted for inflation)
• Existing capacity ― one year– Does not need long commitment, since costs are
already sunk– Short commitment reduces risk (more draws from
price distribution)

22
Demand curve
23
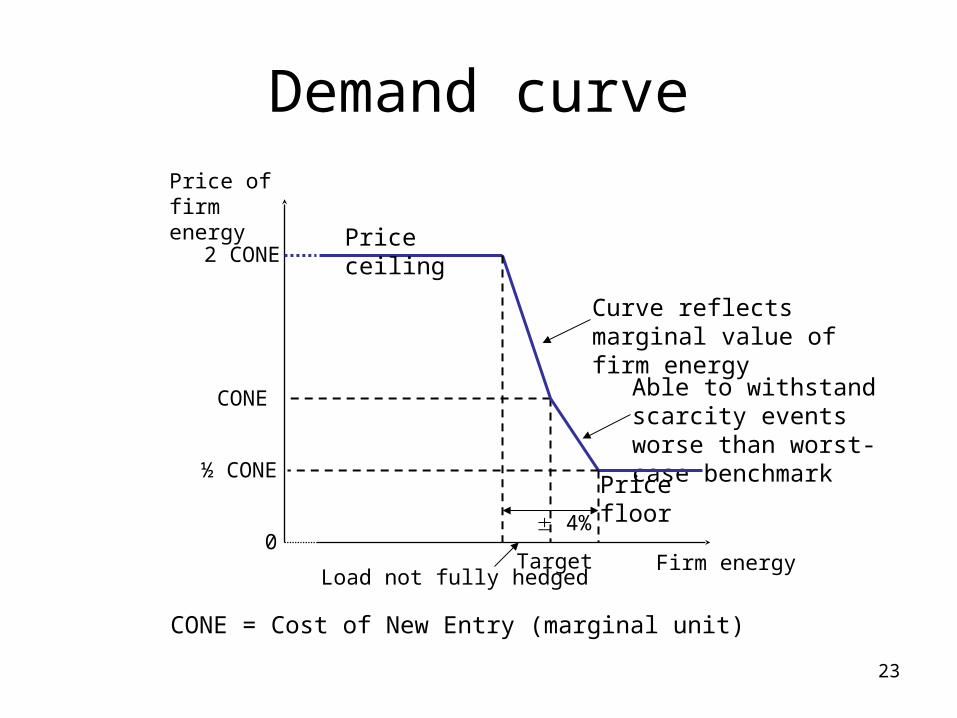
Demand curvePrice offirm energy
Firm energyTarget
CONE
2 CONE
CONE = Cost of New Entry (marginal unit)
0
Curve reflects marginal value of firm energy
Able to withstand scarcity events worse than worst-case benchmark
½ CONE
Price ceiling
Price floor
4%
Load not fully hedged
24
Descendingclock auction
25
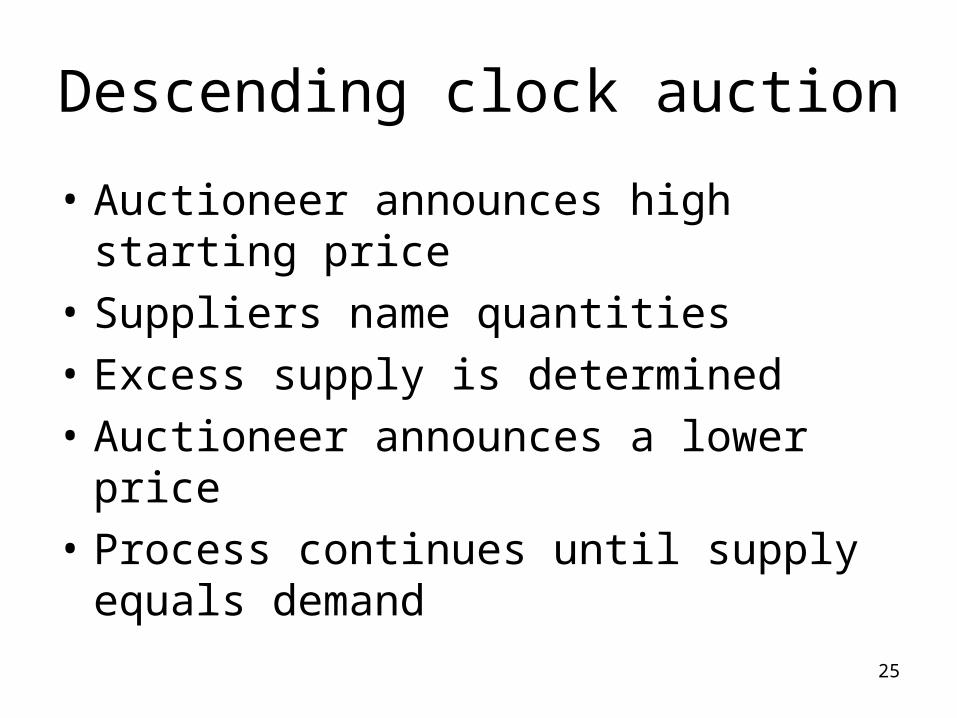
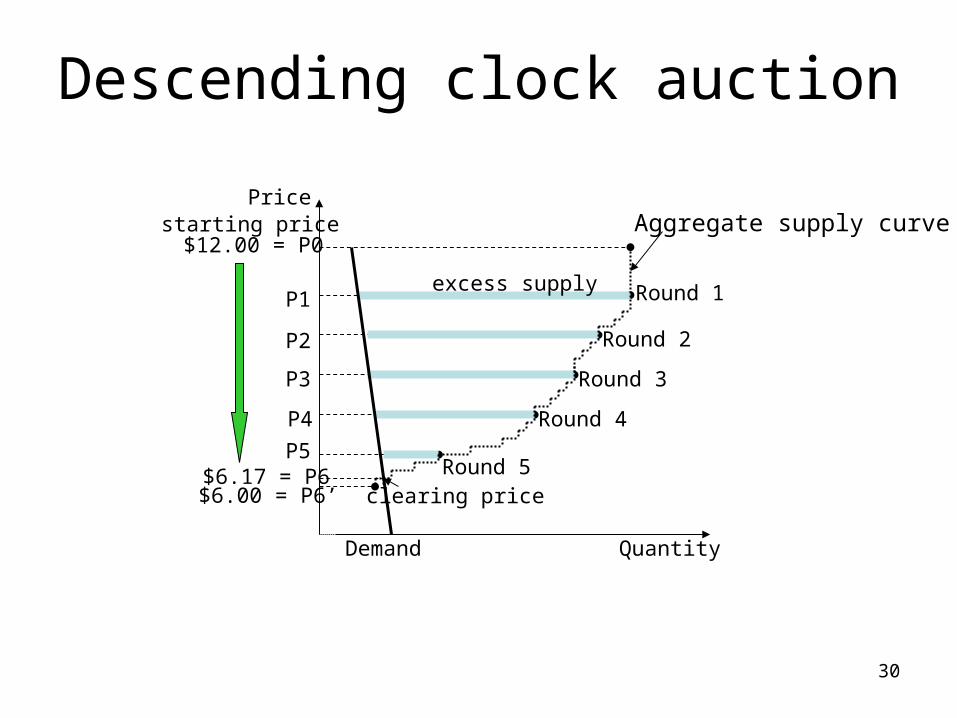
Descending clock auction
• Auctioneer announces high starting price
• Suppliers name quantities
• Excess supply is determined
• Auctioneer announces a lower price
• Process continues until supply equals demand
26
Starting price
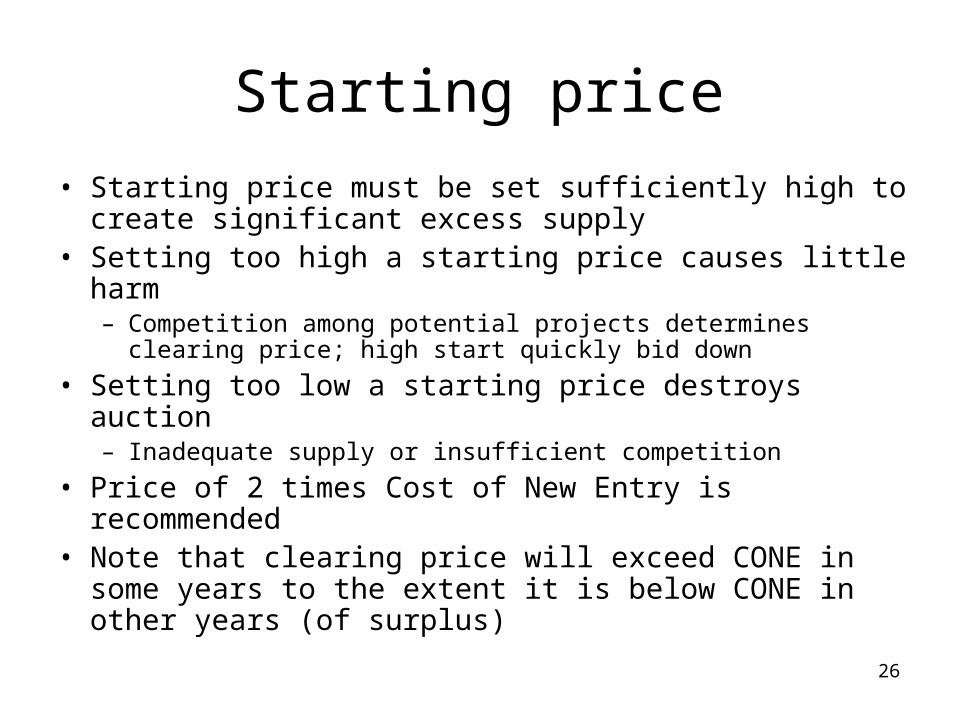
• Starting price must be set sufficiently high to create significant excess supply
• Setting too high a starting price causes little harm– Competition among potential projects determines clearing price;
high start quickly bid down
• Setting too low a starting price destroys auction– Inadequate supply or insufficient competition
• Price of 2 times Cost of New Entry is recommended• Note that clearing price will exceed CONE in some years
to the extent it is below CONE in other years (of surplus)

27
CONE updates
• If auction in year t is successful,CONE in year t+1 = .7 CONE in year t
+ .3 clearing price in year t
• If auction in year t fails,
CONE in year t+1 = CONE in year t
28
Mechanics
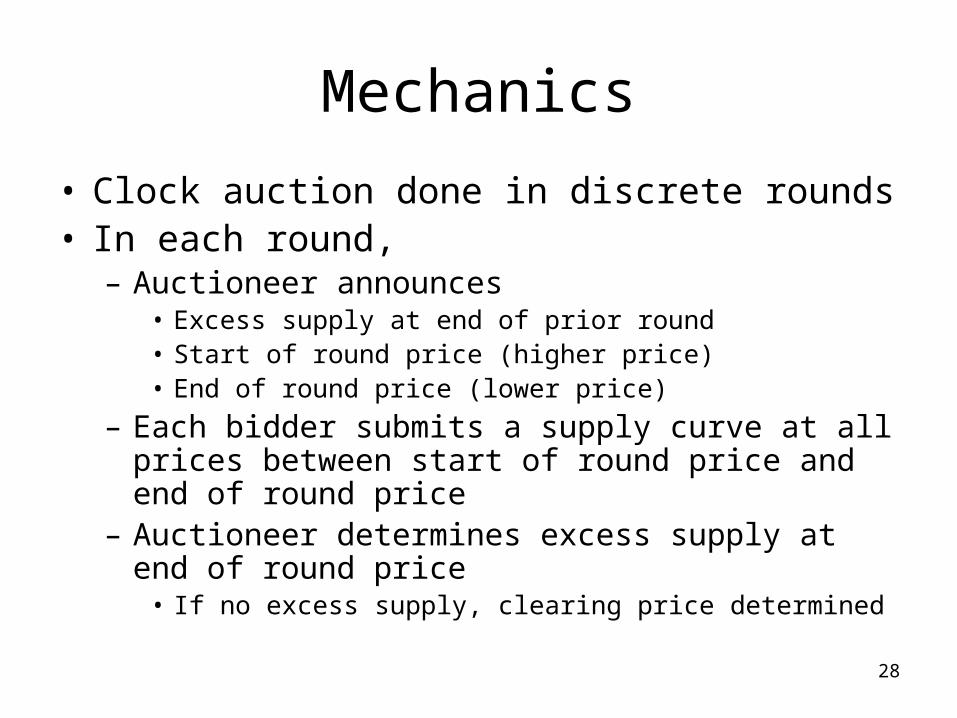
• Clock auction done in discrete rounds• In each round,
– Auctioneer announces• Excess supply at end of prior round• Start of round price (higher price)• End of round price (lower price)
– Each bidder submits a supply curve at all prices between start of round price and end of round price
– Auctioneer determines excess supply at end of round price
• If no excess supply, clearing price determined
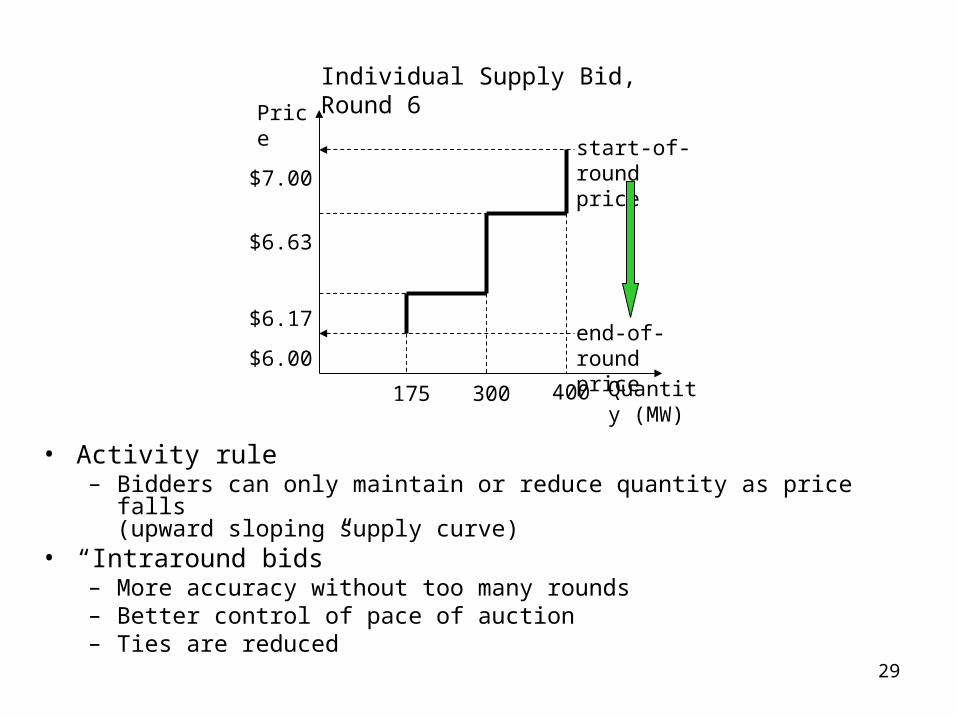
29
Price
$7.00
$6.63
$6.17
$6.00
Quantity (MW)
175 300 400
start-of-roundprice
end-of-roundprice
Individual Supply Bid, Round 6
• Activity rule– Bidders can only maintain or reduce quantity as price falls
(upward sloping supply curve)• “Intraround bids”
– More accuracy without too many rounds– Better control of pace of auction– Ties are reduced
30
Price
$12.00 = P0
P1
P2
P3
QuantityDemand
Round 5
Round 4
starting price
clearing price
Aggregate supply curve
P4
P5 $6.17 = P6
Round 3
Round 2
Round 1 excess supply
$6.00 = P6’
Descending clock auction

31
Information policy
• Demand curve and starting price announced before auction
• After every round, auctioneer reports– Excess supply at end of round price– End of round price for next round
(determined from extent of excess supply)
32
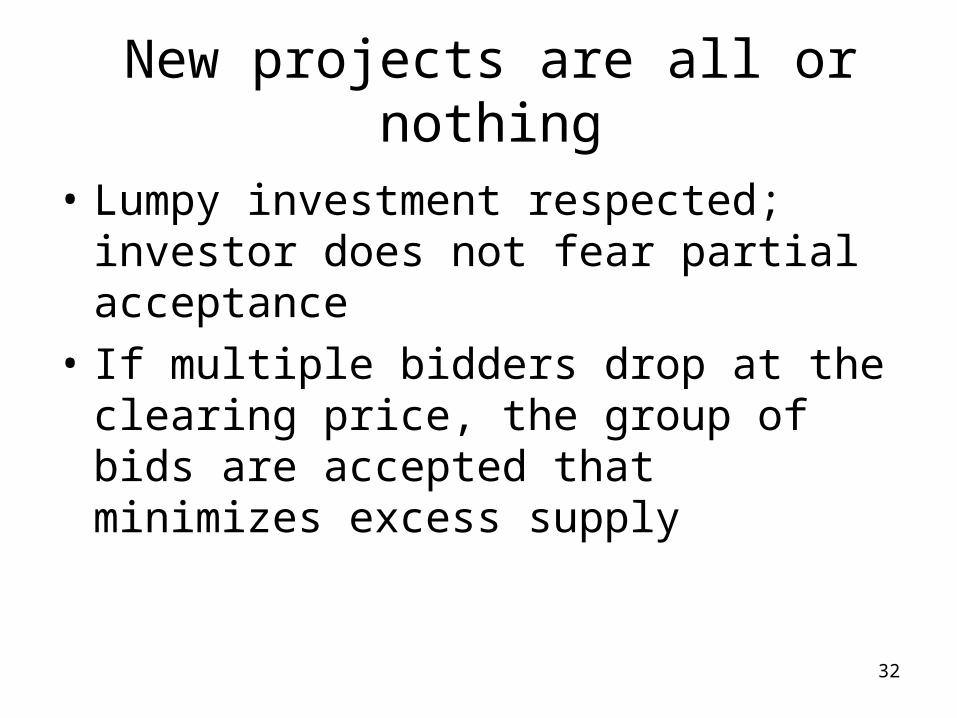
New projects are all or nothing
• Lumpy investment respected; investor does not fear partial acceptance
• If multiple bidders drop at the clearing price, the group of bids are accepted that minimizes excess supply

33
Price formation
34
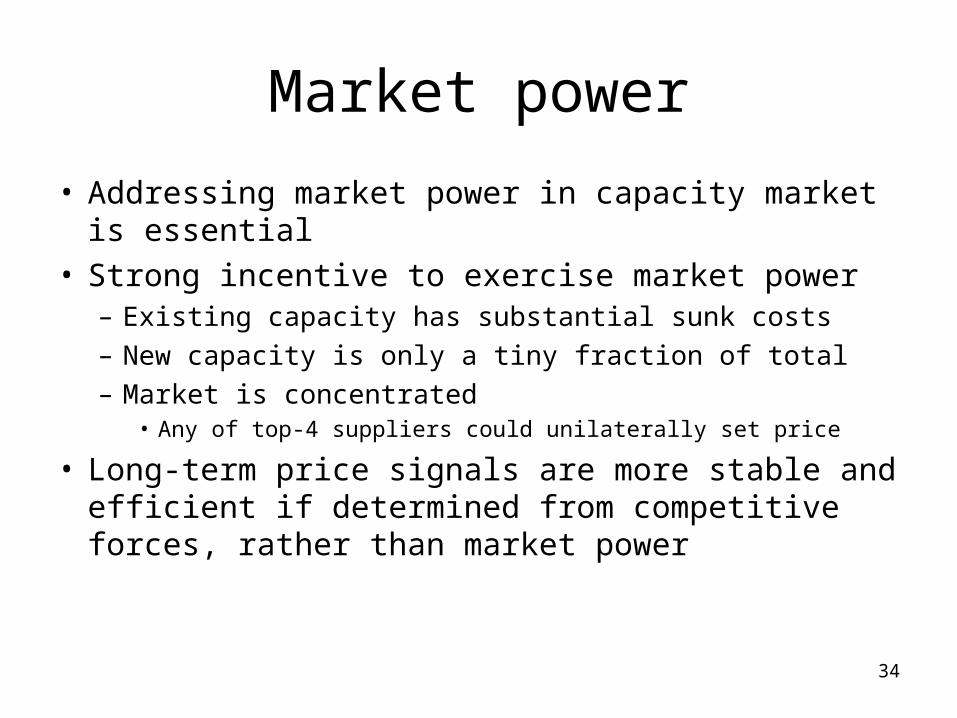
Market power
• Addressing market power in capacity market is essential
• Strong incentive to exercise market power– Existing capacity has substantial sunk costs– New capacity is only a tiny fraction of total– Market is concentrated
• Any of top-4 suppliers could unilaterally set price
• Long-term price signals are more stable and efficient if determined from competitive forces, rather than market power
35
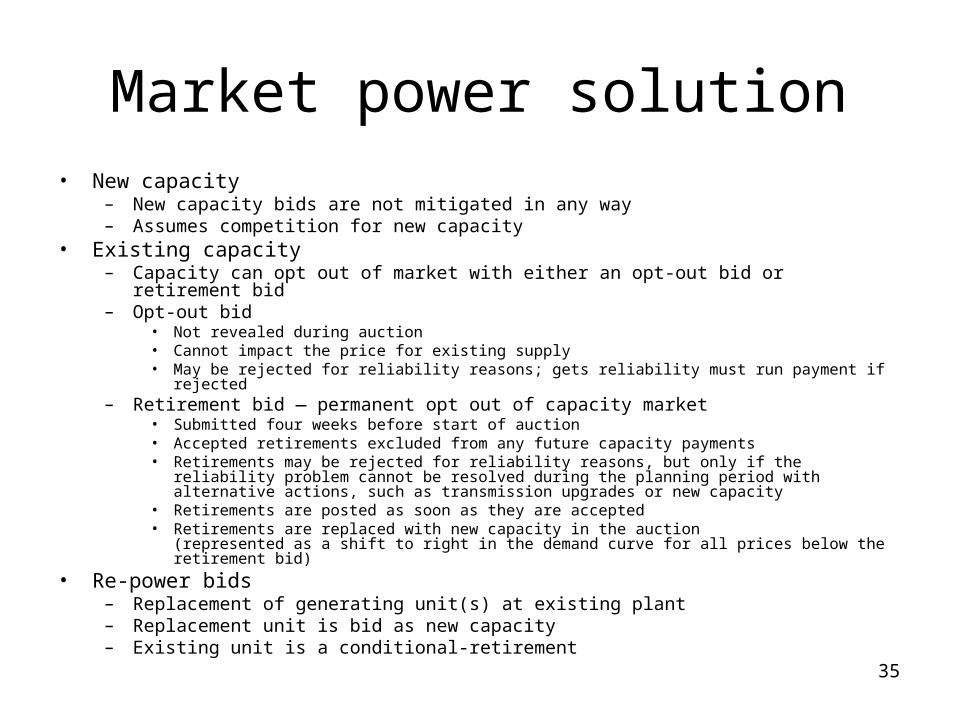
Market power solution• New capacity
– New capacity bids are not mitigated in any way– Assumes competition for new capacity
• Existing capacity– Capacity can opt out of market with either an opt-out bid or retirement bid– Opt-out bid
• Not revealed during auction• Cannot impact the price for existing supply• May be rejected for reliability reasons; gets reliability must run payment if rejected
– Retirement bid ― permanent opt out of capacity market• Submitted four weeks before start of auction• Accepted retirements excluded from any future capacity payments• Retirements may be rejected for reliability reasons, but only if the reliability problem cannot be
resolved during the planning period with alternative actions, such as transmission upgrades or new capacity
• Retirements are posted as soon as they are accepted• Retirements are replaced with new capacity in the auction
(represented as a shift to right in the demand curve for all prices below the retirement bid)
• Re-power bids– Replacement of generating unit(s) at existing plant– Replacement unit is bid as new capacity– Existing unit is a conditional-retirement

36
Market power solution
• New capacity almost always sets the price
• Demand curve sets the price in surplus years in which new entry is not needed
• Retirements occasionally set the price
• Other than retirements, existing capacity never impacts the price

37
Replacing accepted opt-outs
• Opt-outs are replaced by new capacity– March up the supply curve revealed in the
clock auction• But not more than a 30% increase in price• Any additional replacements occur in
reconfiguration
– All new capacity receives this higher price
• Existing capacity receives the original clearing price

38
Performanceincentives
39
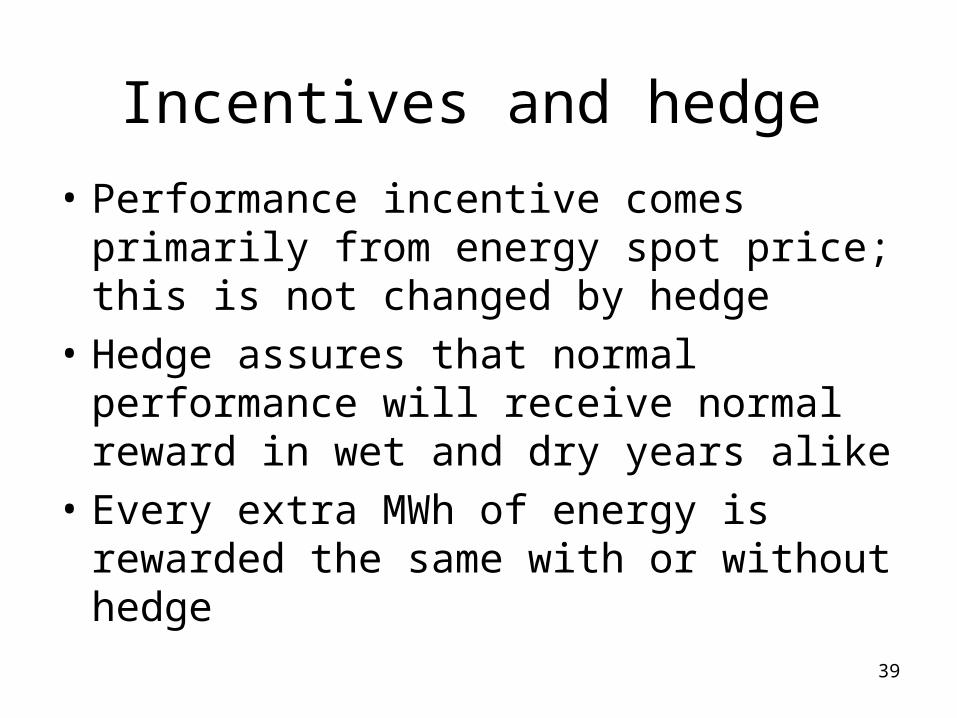
Incentives and hedge
• Performance incentive comes primarily from energy spot price; this is not changed by hedge
• Hedge assures that normal performance will receive normal reward in wet and dry years alike
• Every extra MWh of energy is rewarded the same with or without hedge

40
Energy price motivates performance
• Hedged resources still face the energy spot price at all times– Those that perform better receive more– Those that perform worse receive less
• An additional incentive to perform is impact on firm energy qualified for sale in auctions in future years
• Under performing units are downgraded• Over performing units are upgraded

41
Fail-safe mechanism

42
Protections if auction fails: Inadequate supply
• If, at the starting price, there is insufficient supply of firm energy– New capacity is paid starting price– Existing capacity is paid 1.1 CONE
• Note: Rule does not discourage new projects

43
Protections if auction fails:Insufficient competition
• Existing capacity, less retirements, is less than demand at the starting price, and
• At the starting price, the capacity bid exceeds demand but less than 4% excess, or a supplier’s new capacity is pivotal– Auction is conducted– New capacity is paid the clearing price– Existing capacity is paid the smaller of the clearing
price and 1.1 CONE
• Note: Rule does not discourage new projects

44
Secondary market
45
Reconfiguration auction
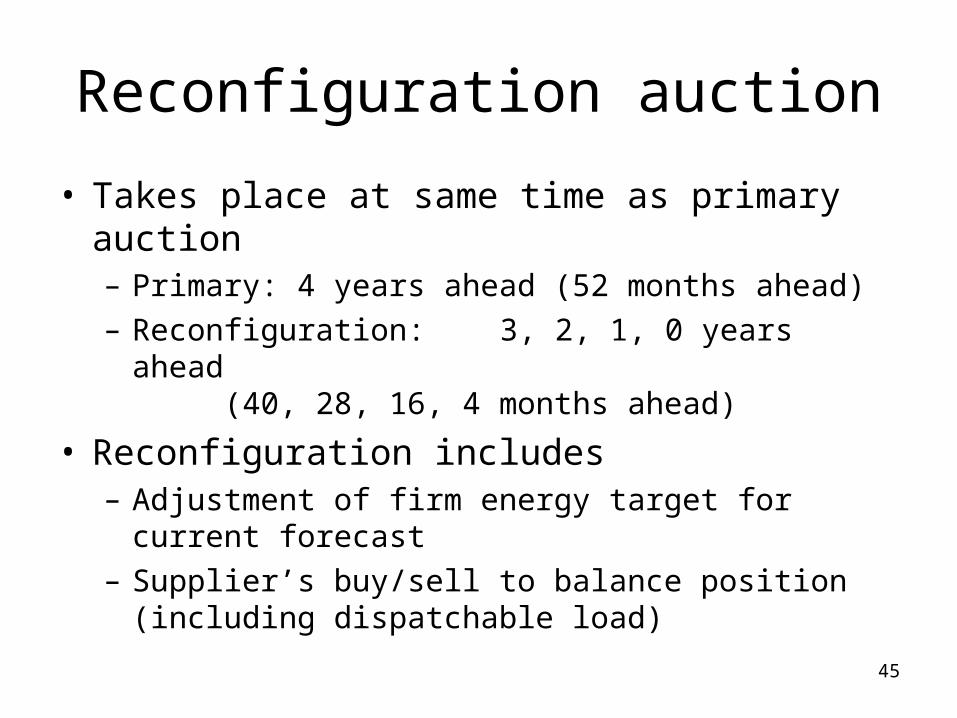
• Takes place at same time as primary auction– Primary: 4 years ahead (52 months ahead)– Reconfiguration: 3, 2, 1, 0 years ahead
(40, 28, 16, 4 months ahead)
• Reconfiguration includes– Adjustment of firm energy target for current forecast– Supplier’s buy/sell to balance position
(including dispatchable load)

46
Reconfiguration auction
• Standard sealed-bid clearing-price auction
• Same demand curve as in primary auction, netting out capacity already purchased
• No bid mitigation

47
Monthly spot exchange
• Monthly simultaneous clearing– Standard sealed-bid clearing-price auction– Suppliers buy/sell to balance positions– Demand curve same as in primary auction

48
Transition
49
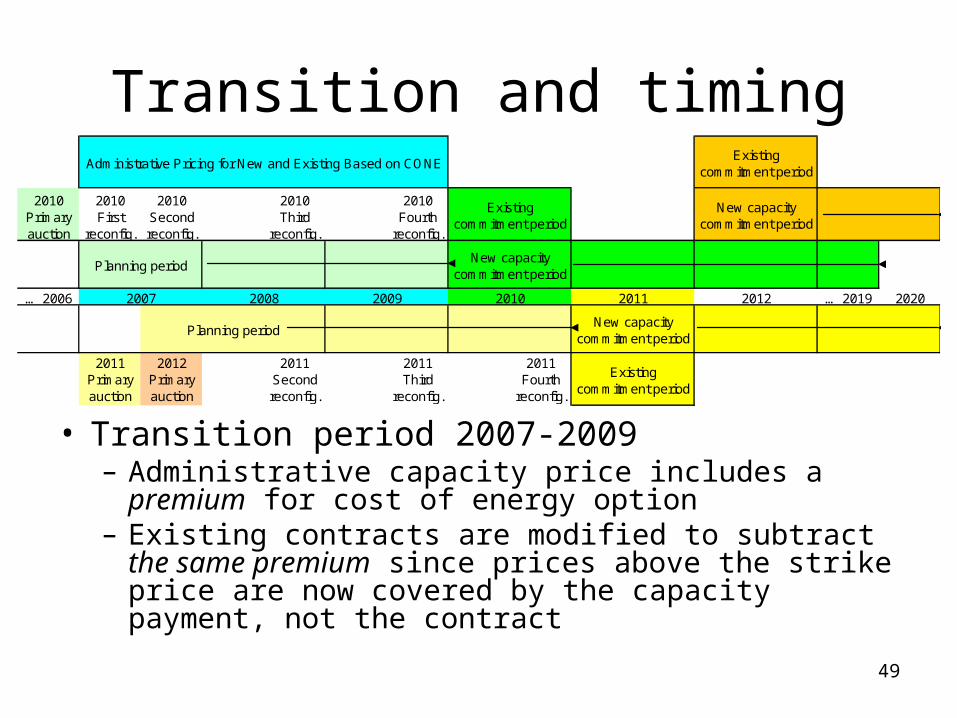
Transition and timing
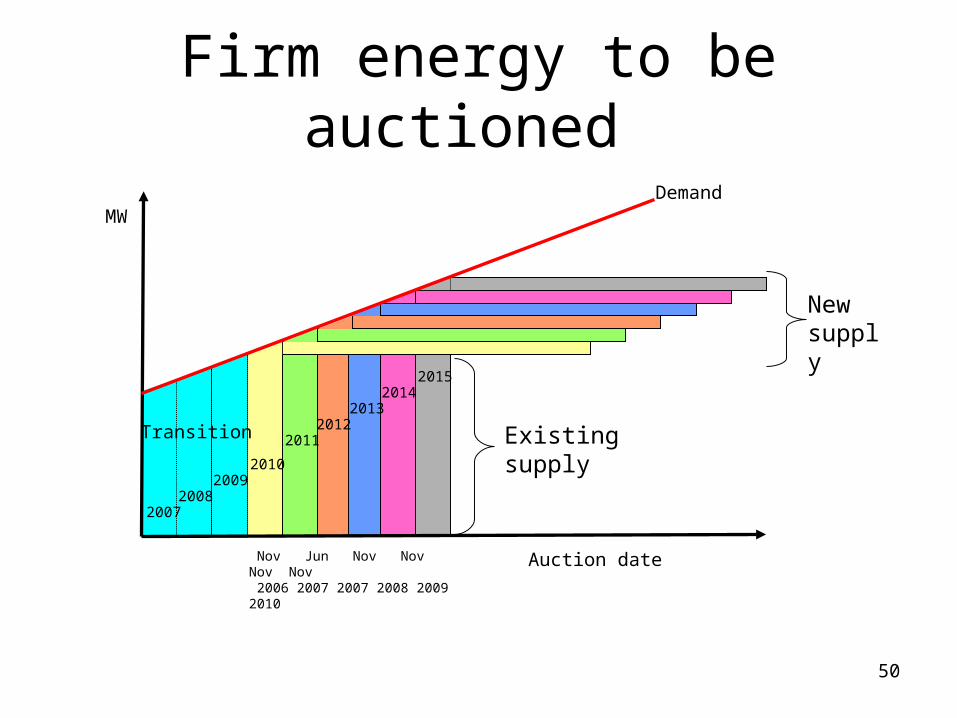
• Transition period 2007-2009– Administrative capacity price includes a premium for
cost of energy option– Existing contracts are modified to subtract the same
premium since prices above the strike price are now covered by the capacity payment, not the contract
2010 Primary auction
2010 First
reconfig.
2010 Second reconfig.
2010 Third
reconfig.
2010 Fourth
reconfig.
… 2006 … 2019 2020
2011 Primary auction
2012 Primary auction
2011 Second reconfig.
2011 Third
reconfig.
2011 Fourth
reconfig.
Existing commitment period
New capacity commitment period
Existing commitment period
Planning period
New capacity commitment period
Planning periodNew capacity
commitment period
Administrative Pricing for New and Existing Based on CONE
2007 2008 2009 2010 2011 2012
Existing commitment period
50
MWDemand
Transition
Auction date
Firm energy to be auctioned
20072008
20092010
20112012
20132014
2015
Existing supply
New supply
Nov Jun Nov Nov Nov Nov 2006 2007 2007 2008 2009 2010

51
Supplier concerns
52
Supplier concerns
• Please note that these concerns were as expressed to CREG on Monday, 5 June 2006, in response to the original CREG proposal. These concerns may not apply to proposal presented here, which is significantly different from the original proposal.

53
1. Approach not used elsewhere
• Similar approach was adopted in New England (32 GW peak load) in March 2006– Approach currently being implemented– Approach endorsed by FERC
• All elements of proposal are commonly used in markets around the world– Options are used everywhere– Clock auctions used for many years in US, UK,
France, Germany, Belgium, Hungary, Denmark, …

54
2. Call option increases risk
Price Coverage
Forward Energy Contract
US$130
US$250
US$0 US$0
US$250
Forward Energy Contract
Energy Option
55
3. Consumers will pay more
• Minimizing risk while addressing market power and performance incentives means that consumers will pay less
56
4. Price not a reliable measure of scarcity
• High prices come from two sources– Scarcity– Market power
• Option fully addresses market power in spot market; thus, high prices can only come from scarcity
• If spot prices are still unreliable, then market must have another flaw. Fix it!
57
5. Approach is complex
• Effective capacity markets are necessarily complex because the economic challenges are great, especially market power
• Proposal uses clear and simple market-based methods

58
Supplier alternative

59
Does not adequately address performance incentives
• Fails to induce right mix of resources
• Fails to induce efficient operation of resources
• Requires greater command-and-control regulation
60
Does not address market power
• Yields unstable an uneconomic capacity prices– Greater financial and political risk
• Higher contract costs due to potential for market power in energy spot market
• Higher energy spot prices and less efficient energy spot market

61
Questions


