15
Copyright © 2011, Elsevier Inc. All rights Reserved. 1 Computational Fluid Dynamics of Particle Transport and Deposition Chapter 2 Goodarz Ahmadi
| Date post: | 17-Dec-2015 |
| Category: |
Documents |
| Upload: | percival-price |
| View: | 215 times |
| Download: | 1 times |

Copyright © 2011, Elsevier Inc. All rights Reserved. 1
Computational Fluid Dynamicsof Particle Transport and
Deposition
Chapter 2
Goodarz Ahmadi

Copyright © 2011, Elsevier Inc. All rights Reserved. 2
FIGURE 2.1 Comparison of computer simulations of He and Ahmadi [19] for deposition of spherical particles in duct flows with experimental data collected by Papavergos and Hedley [49] and earlier simulation as well as model predictions of Fan and Ahmadi [10,11] and Wood [47,48].

Copyright © 2011, Elsevier Inc. All rights Reserved. 3
FIGURE 2.2 Comparison of computer simulations of He and Ahmadi [19] and Soltani and Ahmadi [50] for deposition of charged particles in duct flows with the empirical model predictions of Fan and Ahmadi [10,11] and Wood [47,48].

Copyright © 2011, Elsevier Inc. All rights Reserved. 4
FIGURE 2.3 A sample mesh that was used in the computation and a sample velocity vector field near carina.

Copyright © 2011, Elsevier Inc. All rights Reserved. 5
FIGURE 2.4 Mean velocity contours across the upper airways.

Copyright © 2011, Elsevier Inc. All rights Reserved. 6
FIGURE 2.5 Deposition pattern for different size particles.

Copyright © 2011, Elsevier Inc. All rights Reserved. 7
FIGURE 2.6 Comparison of the capture efficiencies versus Stokes numbers.

Copyright © 2011, Elsevier Inc. All rights Reserved. 8
FIGURE 2.7 Cross-sections of the nose of a human male obtained from MRI and used in developing the computational model. The contours are velocity magnitudes.

Copyright © 2011, Elsevier Inc. All rights Reserved. 9
FIGURE 2.8 The computational model of the nasal airway with various nose regions.
Copyright © 2011, Elsevier Inc. All rights Reserved. 10
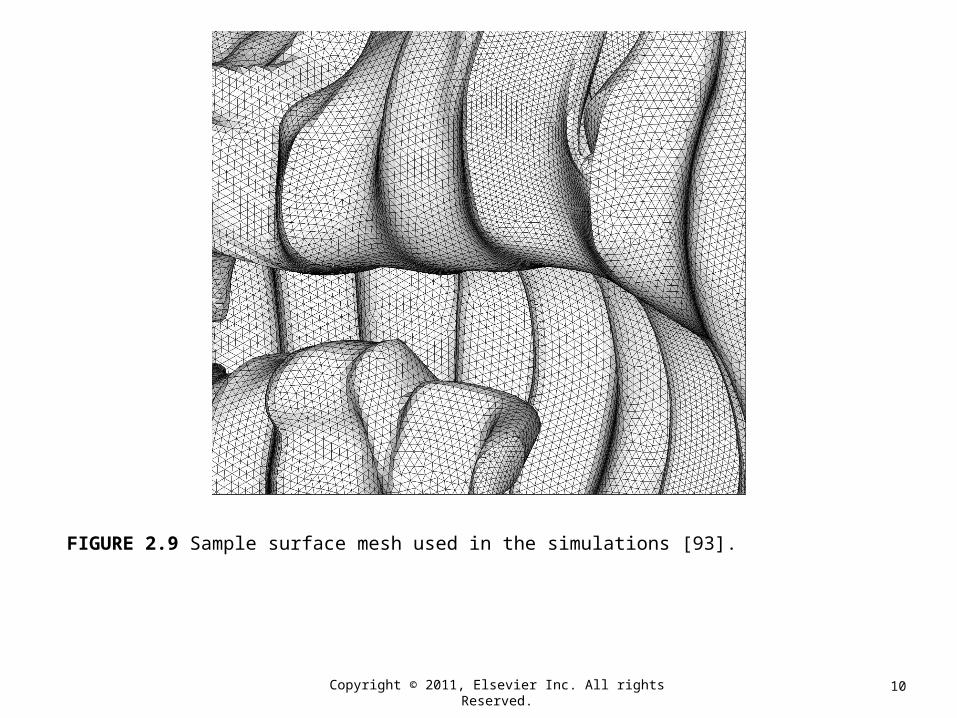
FIGURE 2.9 Sample surface mesh used in the simulations [93].

Copyright © 2011, Elsevier Inc. All rights Reserved. 11
FIGURE 2.10 Sample velocity vector field in different section of the nasal airways.

Copyright © 2011, Elsevier Inc. All rights Reserved. 12
FIGURE 2.11 Comparison of the simulation results for the nose capture efficiency with the experimental data for particles of different sizes.

Copyright © 2011, Elsevier Inc. All rights Reserved. 13
FIGURE 2.12 Variations of nose capture efficiency with inverse Peclet number for particles smaller than 100 nm.

Copyright © 2011, Elsevier Inc. All rights Reserved. 14
FIGURE 2.13 Simulation results for the nose capture efficiency for particle of different sizes at different breathing rate.

Copyright © 2011, Elsevier Inc. All rights Reserved. 15
FIGURE 2.14 Variations of nose capture efficiency with Stokes number for particles in the size range of 200 nm–10 μm.


