Page 1
1
Data mining of the UN Comtrade database in cooperation with Customs
Ronald JansenChief of the Trade Statistics BranchUnited Nations Statistics Division / DESAE-mail: [email protected] [email protected]
Page 2
2
Matching Imports and Exports Data
Page 3
3
Reason for bilateral trade asymmetrieso Country of Origin /Country of
Destination Adding Country of consignment
o Valuation CIF /FOB Imports and Exports FOB
o Trade System General Trade System for all
Page 4
4
Country of Origin / Destination
China (A)
Hong Kong (B)
Netherlands (C)
Germany (D)D records Imports of A (country of origin)
C records Imports of A
B records Imports of A Re-exports to C
Re-exports to D
A records exports to B
Page 5
5
Country of Consignment
China (A)
Hong Kong (B)
Netherlands (C)
Germany (D)D records Imports of C
C records Imports of B
B records Imports of A Re-exports to C
Re-exports to D
A records exports to B
Page 6
6
Imports CIF / FOB
Three Methods to obtain Imports FOB:1. Recording of Cost, Insurance
and Freight per transaction2. Recording of Cost, Insurance
and Freight per Shipment (and partition)
3. Sample Freight and Insurance by HS, Partner country and Mode of Transport and use to adjust CIF to FOB
Page 7
7
Trade System A 2006 global survey showed
that 50% of countries use General Trade system and 50% Special Trade system
Difference in coverage (free zones, customs warehousing, processing zones) will lead to discrepancies in recording
All countries encouraged to record all elements of General Trade system (even in addition to Special)
Page 8
8
Harmonization Process (M=X)
1. Reconciliation exercises – finding common ground
2. Reconciling large trade (Chatham House)
3. Use of imports (origin) as breakdown for partner exports
4. Estimation methods (USITC)5. Customs interest in solving
discrepancies
Page 9
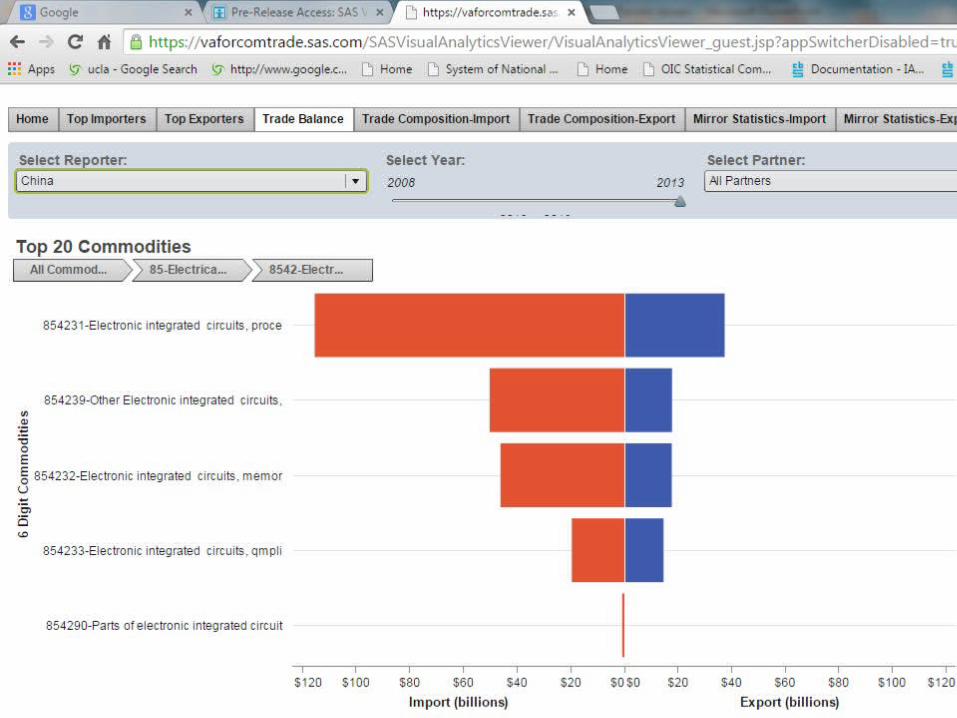
9
SAS Visual Analytics for
UN Comtrade
Page 21
21
UN Comtradein the Sandbox
Page 22
22
Comtrade in the Sandbox
UNECE Big Data Project – Results by November 2015
Available data – 2000-2014 annual HS and Tariff line data
IT specialists – ISTAT, Statistics Netherlands, UNSD, OECD
Proposals – Regional Value Chain analysis, Trade asymmetries, Unit-value indices calculations, Trade flow estimations (missing data and forecasting)
Page 23
23
Regional Value Chain analysis Replicating – Network Analysis of World Trade
(De Benedictis et al., 2013)a) Global and local centrality measuresb) Sectoral Trade Networks
• Commodities? (Bananas; Olive Oil [Casieri et al.])• Industries? (DeBacker & Miroudot; Sturgeon &
Memedovic)c) Restricting to Intermediate Goods traded) Focusing on Geo-graphical groups
Building on “Mapping Global Value Chains”a) Intra- versus Extra-group trade in intermediate goods
Building on OECD work on “Regional economic integration” - Yamano et al; DeBacker and Miroudot; a) International I-O approach
Page 24
24
Trade Networks Commodities
o Bananas, Cement, Movies, Oil, Footwear, Engines (De Benedictis)
o Olive Oil (Casieri) Industries
o Agriculture and Food, Chemical products, Motor vehicles, electronics, business services, financial services (DeBacker & Miroudot)
o Electronics, Passenger vehicles, Apparel (Sturgeon & Memedovic)
o CGGC Duke: Electronics, Aerospace, Medical Devices, Horticulture, Wheat, Fruit and vegetables,
Page 25
Project added-value Industry Mapping
o GVC Mappingo ISIC sectors (TiVA)o Other?
BEC and intermediate goodso BEC Revision 5 – Split of Economic
Categories and End-use; Goods and Services; differentiating within Intermediate goods – generic and specific intermediates
Estimating missing trade flows Analyzing bilateral trade asymmetries
Page 26
26
Thank you
Ronald JansenChief of the Trade Statistics BranchUnited Nations Statistics Division / DESAE-mail: [email protected] [email protected]