1. Data Preprocessing library(lumi); library(limma); library(gplots); library(WGCNA) #---------------Read raw data-------------------------------------------------------------------------- filename <-"GSE28521_non-normalized_data 16-36-41.txt" data.lumi<-lumiR(filename) sampleKey=read.csv("sampleKeyComplete.csv") #---------------QCPlots of non-normalized data---------------------------------------------------- matchSN=match(sampleNames(data.lumi), sampleKey$GEO_SampleName) cortex=which((sampleKey$Brain.area[matchSN]=="F")|( sampleKey$Brain.area[matchSN]=="T")) vermis=which(sampleKey$Brain.area[matchSN]=="C") colChip=labels2colors(as.numeric(substr(sampleKey$Chip[matchSN],start=9,stop=10))); colArea=as.character(sampleKey$Brain.area[matchSN]) colPhenotype= as.character(sampleKey$A.C[matchSN]) colArea[which(colArea[]=="F")]="red"; colArea[which(colArea[]=="T")]="black"; colArea[which(colArea[]=="C")]="green" colPhenotype[which(colPhenotype []=="A")]="red"; colPhenotype [which(colPhenotype []=="C")]="blue"; #Use the last 4 characters of sample names as sample labels for plots sampleNames(data.lumi)=substr(sampleNames(data.lumi), start=9, stop=12) pdf("QCplots_beforeNormalization1.pdf", height=20, width=15) plot(data.lumi, what="density") plot(data.lumi, what="cv") dev.off() pdf("QCplots_beforeNormalization2.pdf", height=10, width=15) plot(data.lumi, what="boxplot", col=colChip) plot(data.lumi, what="sampleRelation", method="cluster") plot(data.lumi, what="sampleRelation", method="mds", col=colArea, sub="red-frontal cortex, black-temporal cortex, green-cerebellum",) plot(data.lumi, what="sampleRelation", method="mds", col=colPhenotype, sub="red-autism, blue-control",) dev.off() #---------------------------log2 transform and Normalize-------------------------------------------------------- # log2 transform and create separate datasets for: all samples, cortex, cerebellum dataAll.lumi<-lumiT(data.lumi, method="log2"); dataCTX.lumi<-dataAll.lumi[,cortex]; dataVER.lumi<-dataAll.lumi[,vermis]
#Normalize dataAll_N.lumi<-lumiN(dataAll.lumi, method="quantile"); dataCTX_N.lumi<- lumiN(dataCTX.lumi, method="quantile"); dataVER_N.lumi<- lumiN(dataVER.lumi, method="quantile"); # extract expression data dataNormAll=exprs(dataAll_N.lumi) dataNormCTX=exprs(dataCTX_N.lumi) dataNormVER=exprs(dataVER_N.lumi) #-------------------------------------QCPlots after normalization------------------------------------------- pdf("QCplots_AfterNorm All samples.pdf", height=10, width=15) plot(dataAll_N.lumi, what="boxplot", col=colChip) plot(dataAll_N.lumi, what="sampleRelation", method="mds", col=colArea, sub="red-frontal cortex, black-temporal cortex, green-cerebellum",) plot(dataAll_N.lumi, what="sampleRelation", method="mds", col=colPhenotype, sub="red-autism, blue-control",) IACa<-cor(dataNormAll, use="p") heatmap.2(IACa, col=cm.colors(300), key=TRUE, cexRow=1.2,cexCol=1.2, hline=0, vline=0, tracecol=0, ColSideColors=colPhenotype, RowSideColors=colArea, dendrogram="row", main="Inter-array correlation, All samples", xlab=" Side bar: red-frontal cortex, black-temporal cortex, green-cerebellum, Top bar: red-autism, blue-control") dev.off() pdf("QCplots_AfterNorm Cortex samples.pdf", height=10, width=15) plot(dataCTX_N.lumi, what="boxplot", col=colChip[cortex]) plot(dataCTX_N.lumi, what="sampleRelation", method="mds", col=colArea[cortex], sub="red-frontal cortex, black-temporal cortex",) plot(dataCTX_N.lumi, what="sampleRelation", method="mds", col=colPhenotype[cortex], sub="red-autism, blue-control",) IACc<-cor(dataNormCTX, use="p") heatmap.2(IACc, col=cm.colors(300), key=TRUE, cexRow=1.2,cexCol=1.2, hline=0, vline=0, tracecol=0, ColSideColors=colPhenotype[cortex], RowSideColors=colArea[cortex], dendrogram="row", main="Inter-array correlation, Cortex samples ", xlab=" Side bar: red-frontal cortex, black-temporal cortex, Top bar: red-autism, blue-control") dev.off() pdf("QCplots_AfterNorm Cerebellum samples.pdf", height=10, width=15) plot(dataVER_N.lumi, what="boxplot", col=colChip[vermis]) plot(dataVER_N.lumi, what="sampleRelation", method="mds", col=colPhenotype[vermis],
sub="red-autism, blue-control",) IACv<-cor(dataNormVER, use="p") heatmap.2(IACv, col=cm.colors(300), key=TRUE, cexRow=1.2,cexCol=1.2, hline=0, vline=0, tracecol=0, ColSideColors=colPhenotype[vermis], dendrogram="row", main="Inter-array correlation, Cerebellum samples", xlab=" Top bar: red-autism, blue-control") dev.off() #----------------------Select expressed probes--------------------------------------------------------------- pcountA=detectionCall(dataAll.lumi, Th=0.01) dataNormAllExp=dataNormAll[pcountA>39,] dim(dataNormAllExp) pcountC=detectionCall(dataCTX.lumi, Th=0.01) dataNormCTXExp=dataNormCTX[pcountC>29,] dim(dataNormCTXExp) pcountV=detectionCall(dataVER.lumi, Th=0.01) dataNormVERExp=dataNormVER[pcountV>10,] dim(dataNormVERExp) #----------------Save Normalized Data----------------------------------------------------------------------------- reverseCtx=match(colnames(dataNormCTXExp), substr(sampleKey$GEO_SampleName, start=9,stop=12)) colnames(dataNormCTXExp)=sampleKey$GEO_SampleName[reverseCtx] write.csv(dataNormCTXExp, "dataNormCTXExp.csv") reverseVer=match(colnames(dataNormVERExp), substr(sampleKey$GEO_SampleName, start=9,stop=12)) colnames(dataNormVERExp)=sampleKey$GEO_SampleName[reverseVer] write.csv(dataNormVERExp, "dataNormVERExp.csv")
68
1012
1416
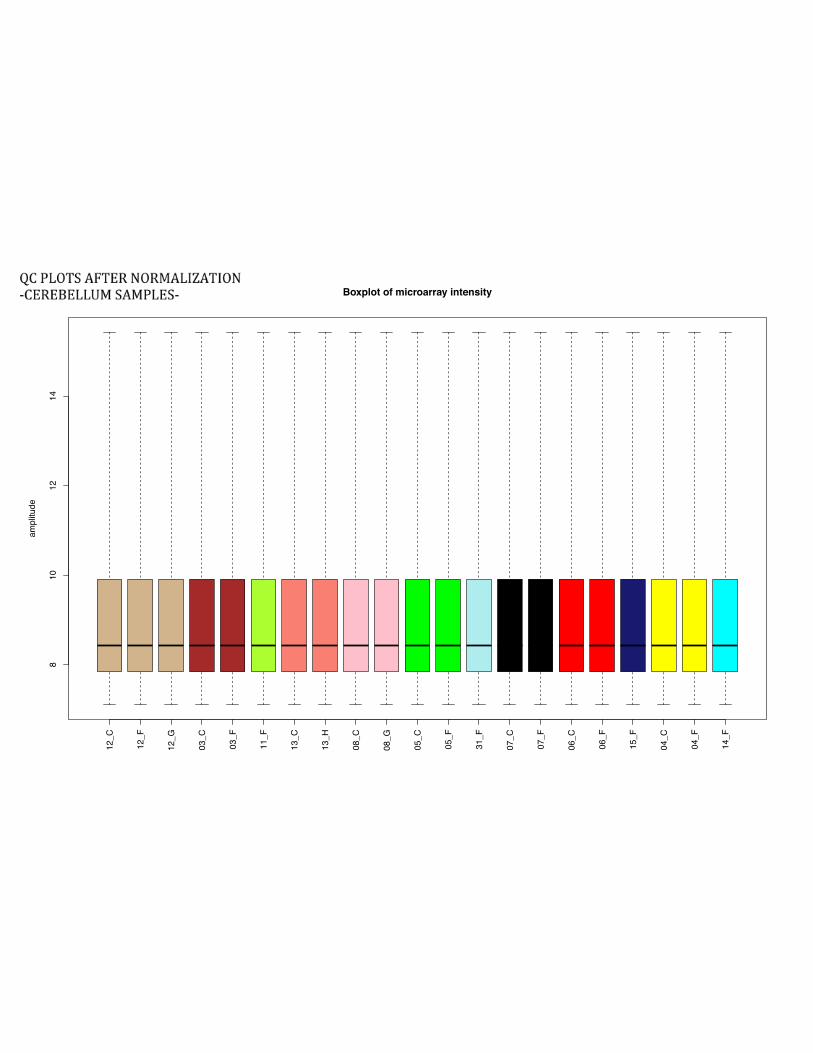
Boxplot of microarray intensity
ampl
itude
12_A
12_B
12_C
12_D
12_F
12_G
12_H
03_A
03_B
03_C
03_D
03_E
03_F
11_A
11_B
11_F
11_G
11_H
02_D
13_A
13_C
13_D
13_E
13_G
13_H
08_A
08_B
08_C
08_G
08_H
10_D
10_G
10_H
05_A
05_B
05_C
05_D
05_E
05_F
05_H
31_A
31_B
31_D
31_E
31_F
31_H
07_A
07_B
07_C
07_D
07_E
07_F
07_G
06_A
06_C
06_D
06_E
06_F
06_G
15_A
15_B
15_D
15_E
15_F
15_G
15_H
04_A
04_B
04_C
04_D
04_E
04_F
04_H
14_A
14_B
14_D
14_E
14_F
14_G
12_G
06_C
03_F
06_F
14_F
12_C
15_F
08_C
07_C
13_H
11_F
07_F
05_F
04_F
03_C
31_F 05
_C04
_C12
_F13
_C08
_G12
_H12
_D05
_A05
_B 08_A
07_A
07_B
04_A
04_B
08_H
10_H
03_B
12_A
12_B
02_D
07_E
13_D
13_E
07_D
03_A
05_D
10_D
04_D
04_E
05_H
04_H
11_H
03_D
31_D
15_D
07_G
06_G 15_E
05_E
14_D
06_D
06_E 03
_E31
_E13
_A08
_B11
_G10
_G15
_G14
_A14
_B15
_A15
_B11
_A15
_H06
_A31
_A31
_B14
_G31
_H14
_E11
_B13
_G
1020
3040
5060
70
Sample relations based on 11879 genes with sd/mean > 0.1
hclust (*, "average")Sample
Hei
ght
−20 0 20 40 60
−40
−20
020
40
Sample relations based on 11879 genes with sd/mean > 0.1
red−frontal cortex, black−temporal cortex, green−cerebellumPrincipal Component 1 (42%)
Prin
cipa
l Com
pone
nt 2
(22.
7%)
12_A
12_B
12_C
12_D
12_F
12_G
12_H
03_A
03_B
03_C
03_D03_E
03_F
11_A
11_B
11_F
11_G
11_H
02_D
13_A13_C
13_D13_E
13_G
13_H
08_A
08_B
08_C
08_G
08_H
10_D
10_G
10_H
05_A
05_B
05_C
05_D
05_E
05_F
05_H
31_A
31_B
31_D31_E
31_F
31_H
07_A07_B
07_C
07_D07_E
07_F
07_G
06_A
06_C
06_D
06_E
06_F
06_G
15_A15_B
15_D15_E
15_F
15_G
15_H
04_A04_B
04_C
04_D04_E
04_F
04_H
14_A
14_B
14_D
14_E
14_F
14_G
−20 0 20 40 60
−40
−20
020
40
Sample relations based on 11879 genes with sd/mean > 0.1
red−autism, blue−controlPrincipal Component 1 (42%)
Prin
cipa
l Com
pone
nt 2
(22.
7%)
12_A
12_B
12_C
12_D
12_F
12_G
12_H
03_A
03_B
03_C
03_D03_E
03_F
11_A
11_B
11_F
11_G
11_H
02_D
13_A13_C
13_D13_E
13_G
13_H
08_A
08_B
08_C
08_G
08_H
10_D
10_G
10_H
05_A
05_B
05_C
05_D
05_E
05_F
05_H
31_A
31_B
31_D31_E
31_F
31_H
07_A07_B
07_C
07_D07_E
07_F
07_G
06_A
06_C
06_D
06_E
06_F
06_G
15_A15_B
15_D15_E
15_F
15_G
15_H
04_A04_B
04_C
04_D04_E
04_F
04_H
14_A
14_B
14_D
14_E
14_F
14_G
6 8 10 12 14 16
0.0
0.2
0.4
0.6
0.8
Density plot of intensity
intensity
dens
ity
12_A12_B12_C12_D12_F12_G12_H03_A03_B03_C03_D03_E03_F11_A11_B11_F11_G11_H02_D13_A13_C13_D13_E13_G13_H08_A08_B08_C08_G08_H10_D10_G10_H05_A05_B05_C05_D05_E05_F05_H31_A31_B31_D31_E31_F31_H07_A07_B07_C07_D07_E07_F07_G06_A06_C06_D06_E06_F06_G15_A15_B15_D15_E15_F15_G15_H04_A04_B04_C04_D04_E04_F04_H14_A14_B14_D14_E14_F14_G
−7 −6 −5 −4 −3 −2
0.0
0.2
0.4
0.6
0.8
1.0
1.2
1.4
Density plot of coefficient of variance
coefficient of variance (log2)
Den
sity
12_A12_B12_C12_D12_F12_G12_H03_A03_B03_C03_D03_E03_F11_A11_B11_F11_G11_H02_D13_A13_C13_D13_E13_G13_H08_A08_B08_C08_G08_H10_D10_G10_H05_A05_B05_C05_D05_E05_F05_H31_A31_B31_D31_E31_F31_H07_A07_B07_C07_D07_E07_F07_G06_A06_C06_D06_E06_F06_G15_A15_B15_D15_E15_F15_G15_H04_A04_B04_C04_D04_E04_F04_H14_A14_B14_D14_E14_F14_G
810
1214
Boxplot of microarray intensity
ampl
itude
12_A
12_B
12_C
12_D
12_F
12_G
12_H
03_A
03_B
03_C
03_D
03_E
03_F
11_A
11_B
11_F
11_G
11_H
02_D
13_A
13_C
13_D
13_E
13_G
13_H
08_A
08_B
08_C
08_G
08_H
10_D
10_G
10_H
05_A
05_B
05_C
05_D
05_E
05_F
05_H
31_A
31_B
31_D
31_E
31_F
31_H
07_A
07_B
07_C
07_D
07_E
07_F
07_G
06_A
06_C
06_D
06_E
06_F
06_G
15_A
15_B
15_D
15_E
15_F
15_G
15_H
04_A
04_B
04_C
04_D
04_E
04_F
04_H
14_A
14_B
14_D
14_E
14_F
14_G
−20 −10 0 10 20 30 40
−20
−10
010
2030
40
Sample relations based on 18822 genes with sd/mean > 0.1
red−frontal cortex, black−temporal cortex, green−cerebellumPrincipal Component 1 (42.8%)
Prin
cipa
l Com
pone
nt 2
(18.
8%)
12_A
12_B
12_C
12_D
12_F
12_G
12_H
03_A
03_B
03_C
03_D03_E
03_F
11_A
11_B
11_F
11_G11_H
02_D
13_A
13_C
13_D13_E
13_G
13_H08_A
08_B
08_C
08_G
08_H
10_D
10_G
10_H
05_A
05_B05_C
05_D05_E05_F
05_H
31_A
31_B
31_D31_E
31_F
31_H
07_A07_B
07_C
07_D07_E
07_F
07_G
06_A
06_C06_D
06_E
06_F
06_G
15_A15_B
15_D15_E
15_F
15_G
15_H
04_A04_B
04_C04_D
04_E 04_F
04_H
14_A
14_B
14_D
14_E
14_F
14_G
−20 −10 0 10 20 30 40
−20
−10
010
2030
40
Sample relations based on 18822 genes with sd/mean > 0.1
red−autism, blue−controlPrincipal Component 1 (42.8%)
Prin
cipa
l Com
pone
nt 2
(18.
8%)
12_A
12_B
12_C
12_D
12_F
12_G
12_H
03_A
03_B
03_C
03_D03_E
03_F
11_A
11_B
11_F
11_G11_H
02_D
13_A
13_C
13_D13_E
13_G
13_H08_A
08_B
08_C
08_G
08_H
10_D
10_G
10_H
05_A
05_B05_C
05_D05_E05_F
05_H
31_A
31_B
31_D31_E
31_F
31_H
07_A07_B
07_C
07_D07_E
07_F
07_G
06_A
06_C06_D
06_E
06_F
06_G
15_A15_B
15_D15_E
15_F
15_G
15_H
04_A04_B
04_C04_D
04_E 04_F
04_H
14_A
14_B
14_D
14_E
14_F
14_G
12_F
13_C
08_G
05_C
05_F
04_F
11_F
04_C
03_C
31_F
12_C
03_F
12_G
06_F
06_C
15_F
14_F
07_C
08_C
13_H
07_F
14_G
31_B
13_G
31_A
13_A
06_A
11_B
14_E
31_H
12_H
04_B
04_A
08_A
07_B
07_A
12_B
08_H
10_H
12_A
07_D
03_B
13_E
13_D
15_H
07_G
06_E
15_G
08_B
10_G
11_G
14_B
14_A
11_A
15_A
15_B
12_D
11_H
06_G
03_E
06_D
15_E
14_D
31_D
15_D
03_D
05_A
05_B
04_H
05_H
02_D
07_E
04_D
04_E
05_D
31_E
05_E
03_A
10_D
Side bar: red−frontal cortex, black−temporal cortex, green−cerebellum, Top bar: red−autism, blue−control
12_F13_C08_G05_C05_F04_F11_F04_C03_C31_F12_C03_F12_G06_F06_C15_F14_F07_C08_C13_H07_F14_G31_B13_G31_A13_A06_A11_B14_E31_H12_H04_B04_A08_A07_B07_A12_B08_H10_H12_A07_D03_B13_E13_D15_H07_G06_E15_G08_B10_G11_G14_B14_A11_A15_A15_B12_D11_H06_G03_E06_D15_E14_D31_D15_D03_D05_A05_B04_H05_H02_D07_E04_D04_E05_D31_E05_E03_A10_D
Inter−array correlation, All samples
0.88 0.9 0.92 0.94 0.96 0.98 1Value
020
4060
80
Color Keyand Histogram
Cou
nt
810
1214
Boxplot of microarray intensity
ampl
itude
12_A
12_B
12_D
12_H
03_A
03_B
03_D
03_E
11_A
11_B
11_G
11_H
02_D
13_A
13_D
13_E
13_G
08_A
08_B
08_H
10_D
10_G
10_H
05_A
05_B
05_D
05_E
05_H
31_A
31_B
31_D
31_E
31_H
07_A
07_B
07_D
07_E
07_G
06_A
06_D
06_E
06_G
15_A
15_B
15_D
15_E
15_G
15_H
04_A
04_B
04_D
04_E
04_H
14_A
14_B
14_D
14_E
14_G
−20 −10 0 10 20 30 40
−10
010
20
Sample relations based on 18149 genes with sd/mean > 0.1
red−frontal cortex, black−temporal cortexPrincipal Component 1 (35.5%)
Prin
cipa
l Com
pone
nt 2
(8.9
%)
12_A12_B
12_D
12_H
03_A03_B
03_D
03_E
11_A
11_B
11_G
11_H
02_D
13_A
13_D
13_E
13_G
08_A
08_B
08_H
10_D
10_G
10_H
05_A
05_B
05_D
05_E
05_H
31_A
31_B31_D
31_E
31_H
07_A07_B07_D
07_E
07_G
06_A
06_D
06_E
06_G
15_A15_B
15_D
15_E
15_G
15_H
04_A04_B
04_D 04_E
04_H
14_A
14_B
14_D
14_E
14_G
−20 −10 0 10 20 30 40
−10
010
20
Sample relations based on 18149 genes with sd/mean > 0.1
red−autism, blue−controlPrincipal Component 1 (35.5%)
Prin
cipa
l Com
pone
nt 2
(8.9
%)
12_A12_B
12_D
12_H
03_A03_B
03_D
03_E
11_A
11_B
11_G
11_H
02_D
13_A
13_D
13_E
13_G
08_A
08_B
08_H
10_D
10_G
10_H
05_A
05_B
05_D
05_E
05_H
31_A
31_B31_D
31_E
31_H
07_A07_B07_D
07_E
07_G
06_A
06_D
06_E
06_G
15_A15_B
15_D
15_E
15_G
15_H
04_A04_B
04_D 04_E
04_H
14_A
14_B
14_D
14_E
14_G
14_G
31_B
13_G
13_A
06_A
11_B
31_A
14_E
31_H
12_H
04_B
04_A
12_B
08_H
10_H
03_B
12_A
13_E
13_D
08_A
07_B
07_A
02_D
07_D
07_E
04_D
04_E
03_A
10_D
15_G
08_B
10_G
15_H
14_B
14_A
11_A
15_B
15_A
12_D
11_G
11_H
07_G
06_G
06_E
03_D
03_E
06_D
15_E
14_D
05_E
31_E
05_D
04_H
05_H
31_D
15_D
05_A
05_B
Side bar: red−frontal cortex, black−temporal cortex, Top bar: red−autism, blue−control
14_G31_B13_G13_A06_A11_B31_A14_E31_H12_H04_B04_A12_B08_H10_H03_B12_A13_E13_D08_A07_B07_A02_D07_D07_E04_D04_E03_A10_D15_G08_B10_G15_H14_B14_A11_A15_B15_A12_D11_G11_H07_G06_G06_E03_D03_E06_D15_E14_D05_E31_E05_D04_H05_H31_D15_D05_A05_B
Inter−array correlation, Cortex samples
0.92 0.94 0.96 0.98 1Value
010
2030
4050
60
Color Keyand Histogram
Cou
nt
810
1214
Boxplot of microarray intensity
ampl
itude
12_C
12_F
12_G
03_C
03_F
11_F
13_C
13_H
08_C
08_G
05_C
05_F
31_F
07_C
07_F
06_C
06_F
15_F
04_C
04_F
14_F
−40 −30 −20 −10 0 10
−15
−10
−50
510
1520
Sample relations based on 17337 genes with sd/mean > 0.1
red−autism, blue−controlPrincipal Component 1 (40.7%)
Prin
cipa
l Com
pone
nt 2
(10.
5%)
12_C
12_F
12_G
03_C
03_F
11_F13_C
13_H
08_C
08_G
05_C
05_F 31_F
07_C
07_F06_C
06_F15_F
04_C
04_F
14_F
13_C
12_F
08_G
06_C
12_G
06_F
03_F
08_C
07_C
12_C
04_C
03_C
07_F
31_F
15_F
14_F
05_F
05_C
13_H
04_F
11_F
Top bar: red−autism, blue−control
13_C
12_F
08_G
06_C
12_G
06_F
03_F
08_C
07_C
12_C
04_C
03_C
07_F
31_F
15_F
14_F
05_F
05_C
13_H
04_F
11_F
Inter−array correlation, Cerebellum samples
0.94 0.96 0.98 1Value
05
1015
20
Color Keyand Histogram
Cou
nt