1 Databases Meet Astronomy a db view of astronomy data Jim Gray and Don Slutz Microsoft Research Collaborating with: Alex Szalay, Peter Kunszt, Ani Thakar @ JHU Robert Brunner, Roy Williams @ Caltech
Transcript
1
Databases Meet Astronomya db view of astronomy data
Jim Gray and Don Slutz
Microsoft Research
Collaborating with:
Alex Szalay, Peter Kunszt, Ani Thakar @ JHU
Robert Brunner, Roy Williams @ Caltech
George Djorgovski, Julian Bunn @ Caltech
2
Outline
• Astronomy data
• The Virtual Observatory Concept
• The Sloan Digital Sky Survey
3
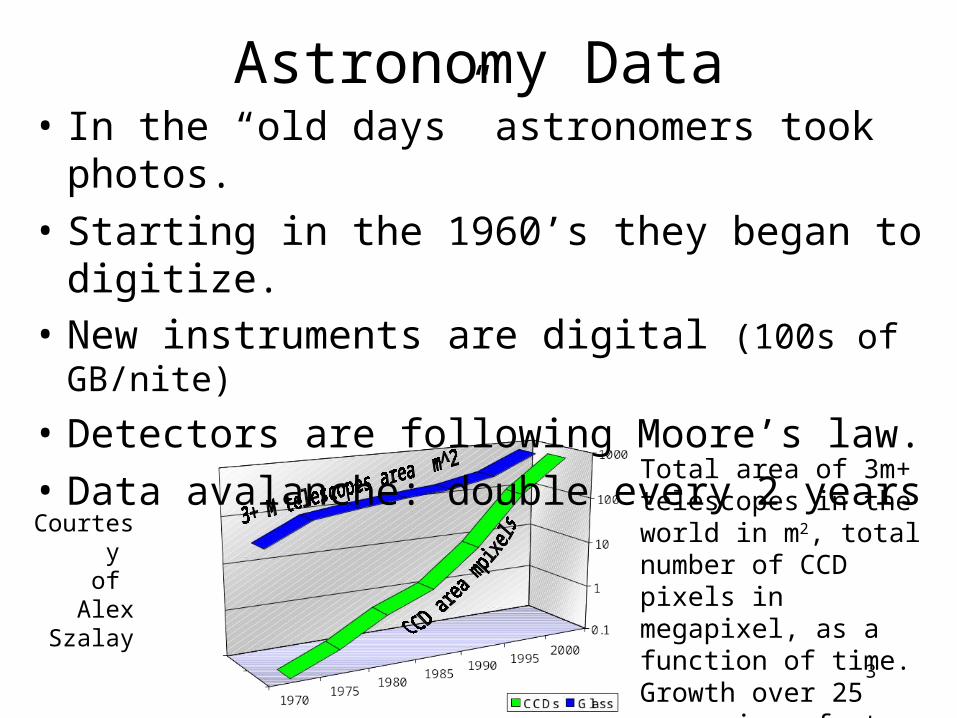
Astronomy Data• In the “old days” astronomers took photos.
• Starting in the 1960’s they began to digitize.• New instruments are digital (100s of GB/nite)
• Detectors are following Moore’s law.
• Data avalanche: double every 2 years
Total area of 3m+ telescopes in the world in m2, total number of CCD pixels in megapixel, as a function of time. Growth over 25 years is a factor of 30 in glass, 3000 in pixels.
Courtesy of
Alex Szalay
4
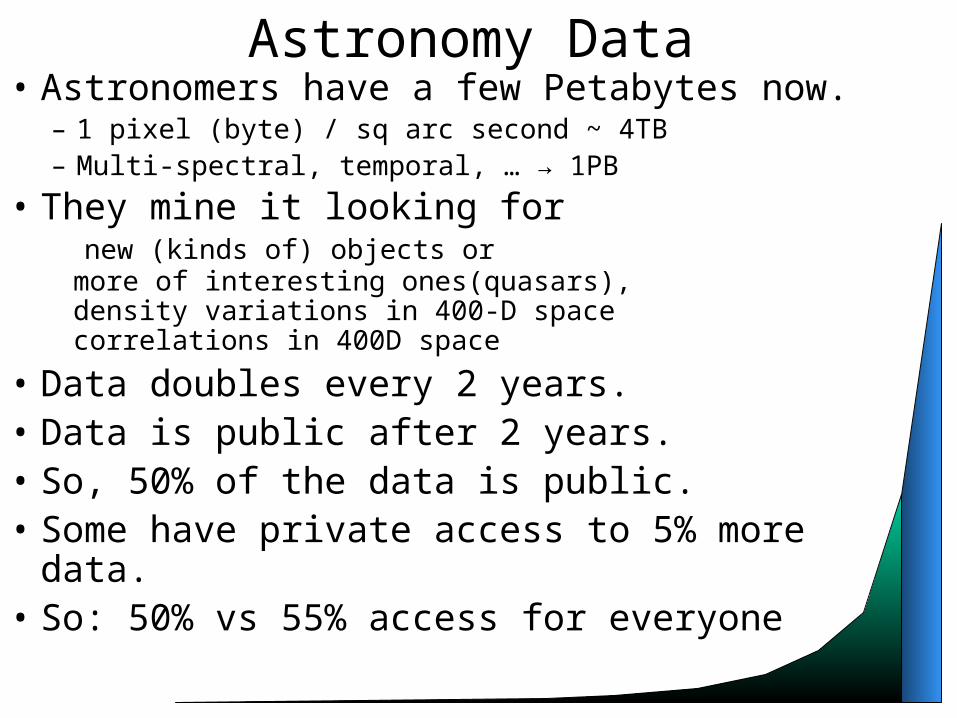
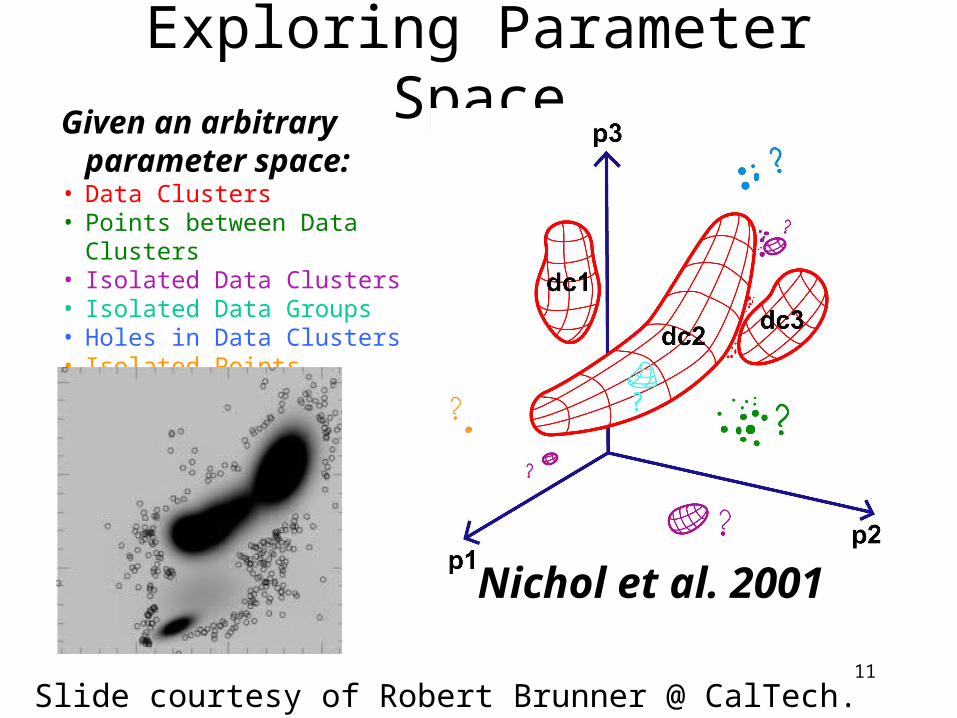
Astronomy Data• Astronomers have a few Petabytes now.
• They mine it looking for new (kinds of) objects or more of interesting ones(quasars), density variations in 400-D space correlations in 400D space
• Data doubles every 2 years.• Data is public after 2 years.• So, 50% of the data is public.• Some have private access to 5% more data.• So: 50% vs 55% access for everyone
5
Astronomy Data• But…..• How do I get at that 50% of the data?• Astronomers have culture of publishing.
– FITS files and many tools.http://fits.gsfc.nasa.gov/fits_home.html
– Encouraged by NASA.• But, data “details” are hard to document.
Astronomers want to do it but it is VERY hard.(What programs where used? what were the processing steps? How were errors treated?…)
• The optimistic hope: XML is the answer.• The reality: xml is syntax and tools:
FITS on XML will be good but….. Explaining the data will still be very difficult.
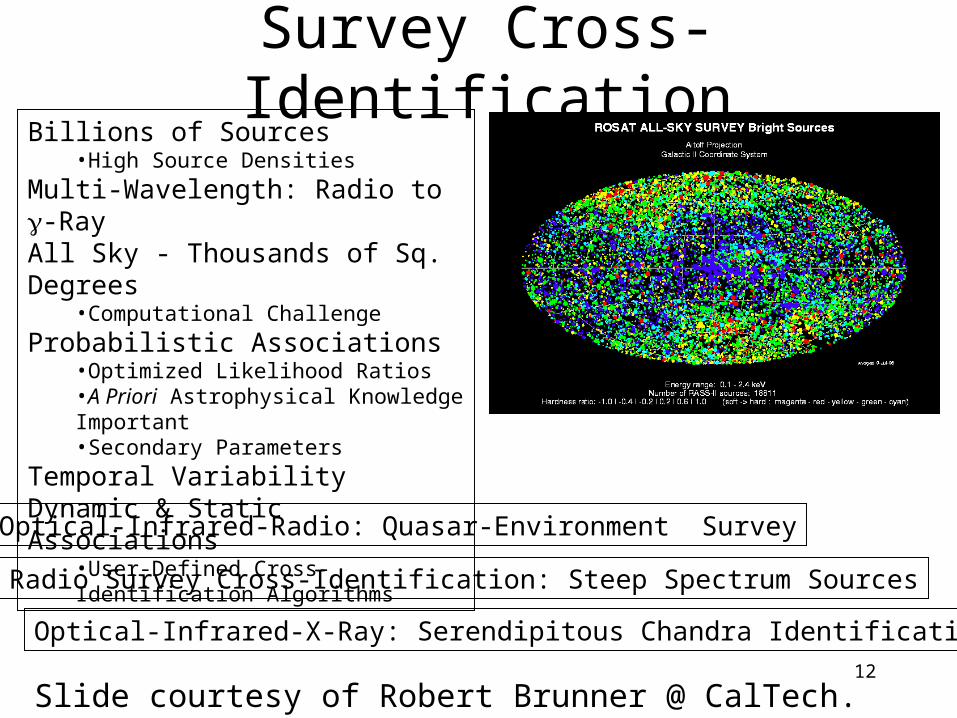
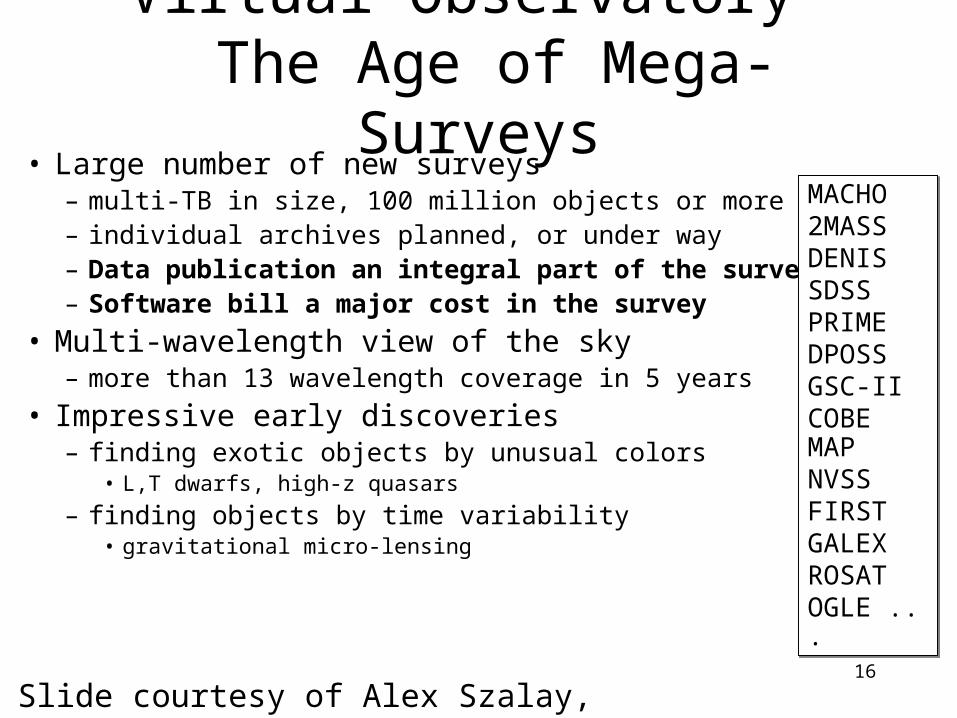
• Large number of new surveys– multi-TB in size, 100 million objects or more– individual archives planned, or under way– Data publication an integral part of the survey– Software bill a major cost in the survey
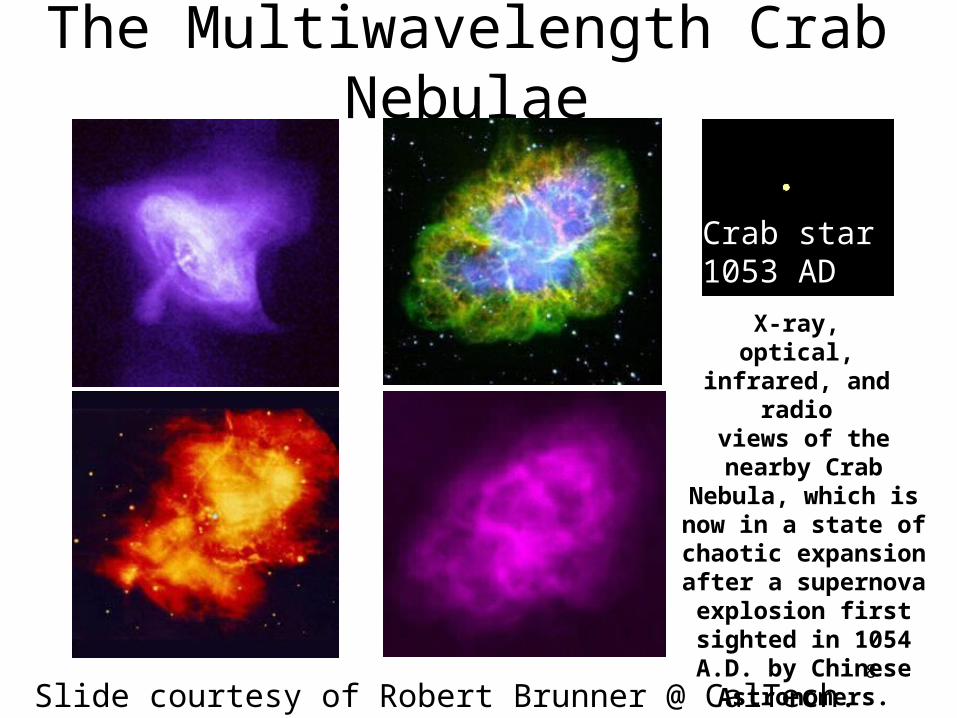
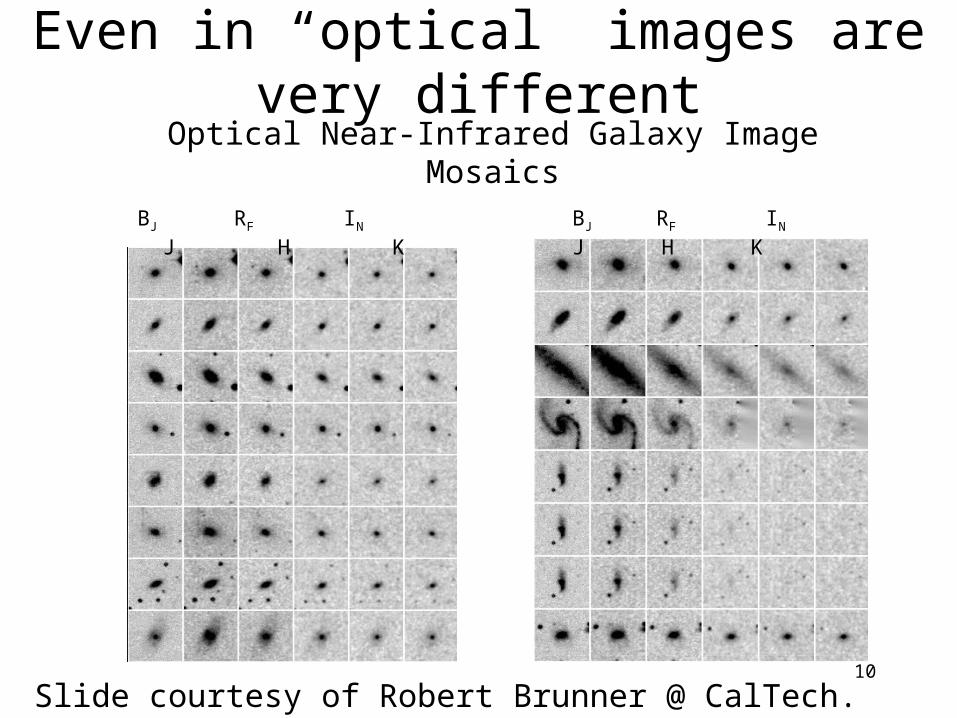
• Multi-wavelength view of the sky– more than 13 wavelength coverage in 5 years
• Impressive early discoveries– finding exotic objects by unusual colors
• L,T dwarfs, high-z quasars
– finding objects by time variability• gravitational micro-lensing
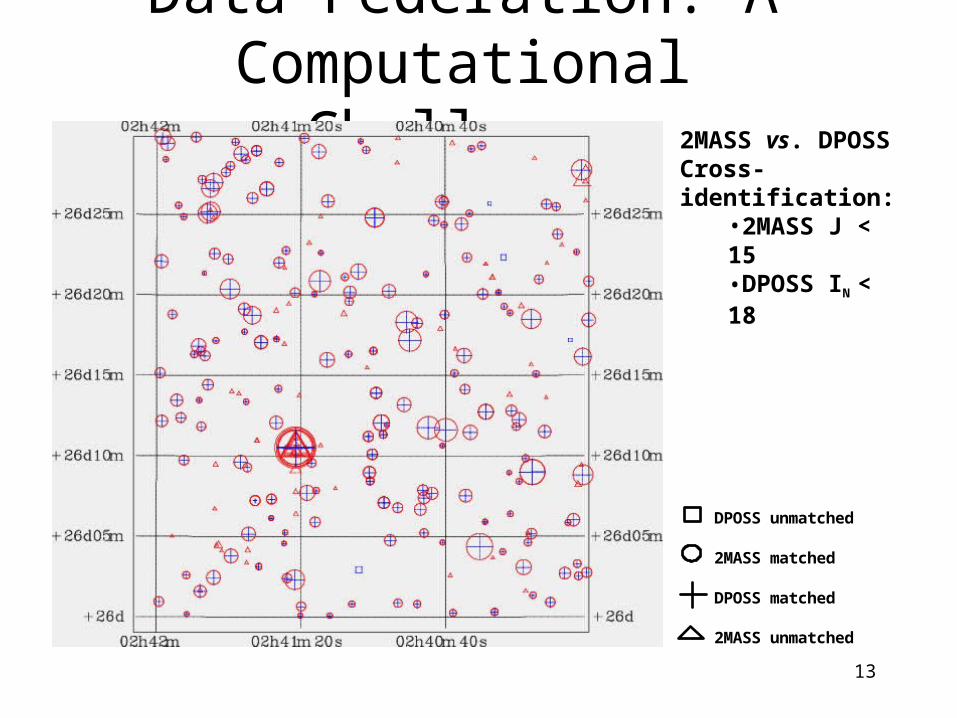
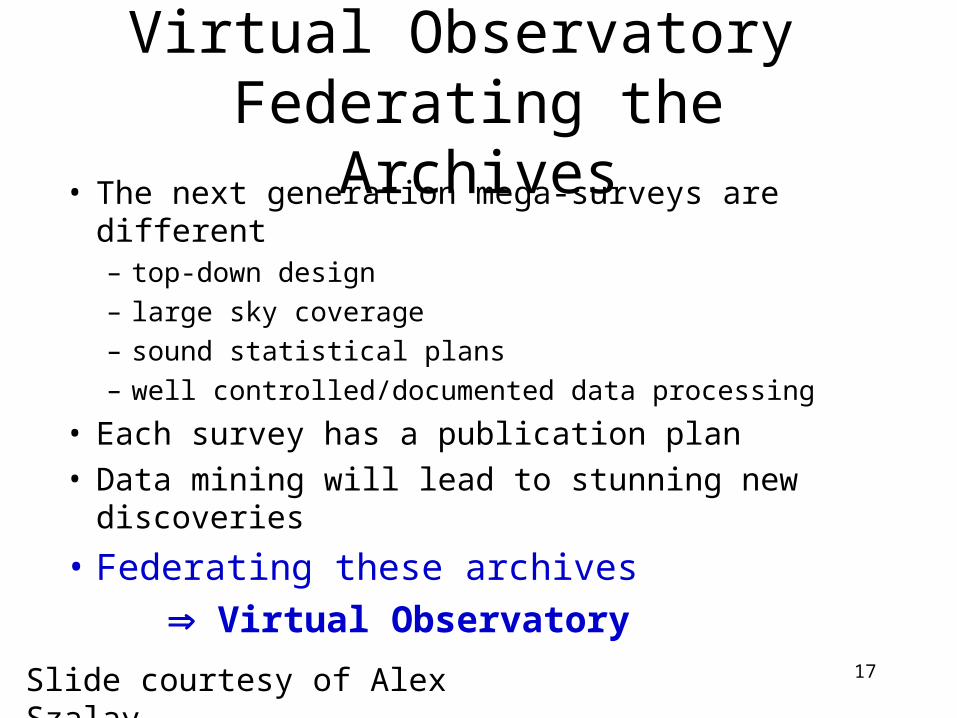
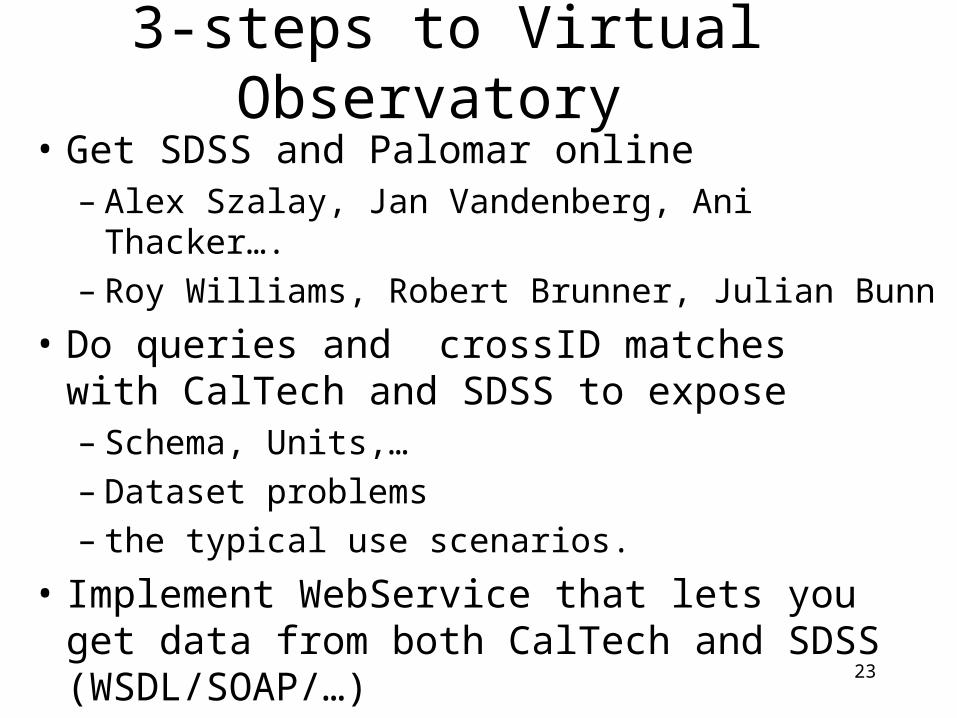
• Get SDSS and Palomar online– Alex Szalay, Jan Vandenberg, Ani Thacker….– Roy Williams, Robert Brunner, Julian Bunn
• Do queries and crossID matches with CalTech and SDSS to expose – Schema, Units,…– Dataset problems– the typical use scenarios.
• Implement WebService that lets you get data from both CalTech and SDSS (WSDL/SOAP/…)
24
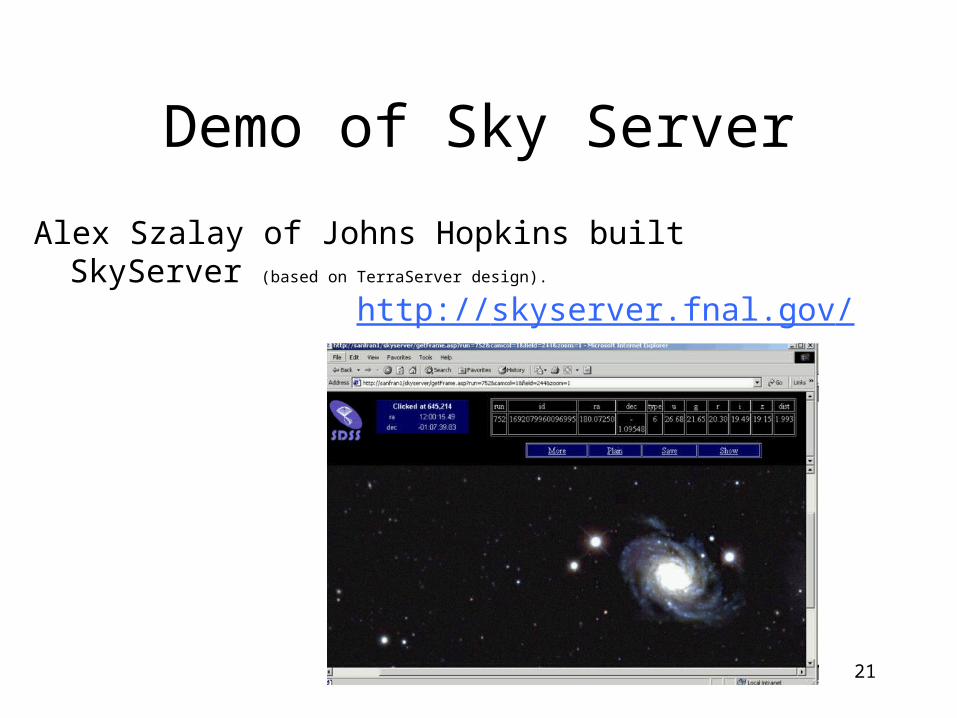
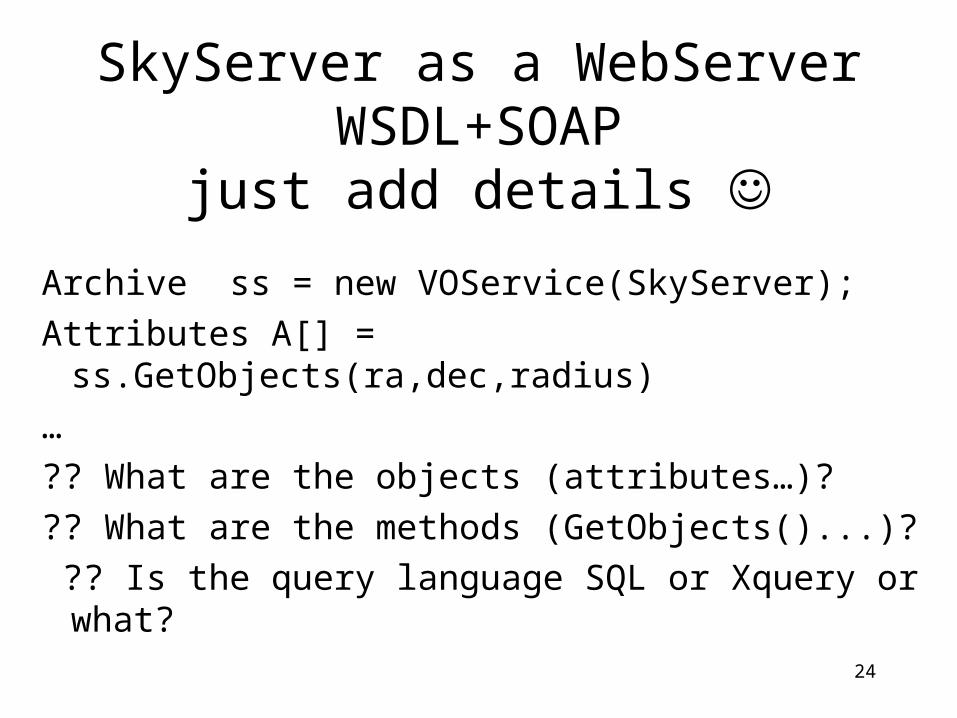
SkyServer as a WebServerWSDL+SOAP
just add details
Archive ss = new VOService(SkyServer);
Attributes A[] = ss.GetObjects(ra,dec,radius)
…
?? What are the objects (attributes…)?
?? What are the methods (GetObjects()...)?
?? Is the query language SQL or Xquery or what?
25
Outline
• Astronomy data
• The Virtual Observatory Concept
• The Sloan Digital Sky Survey
26
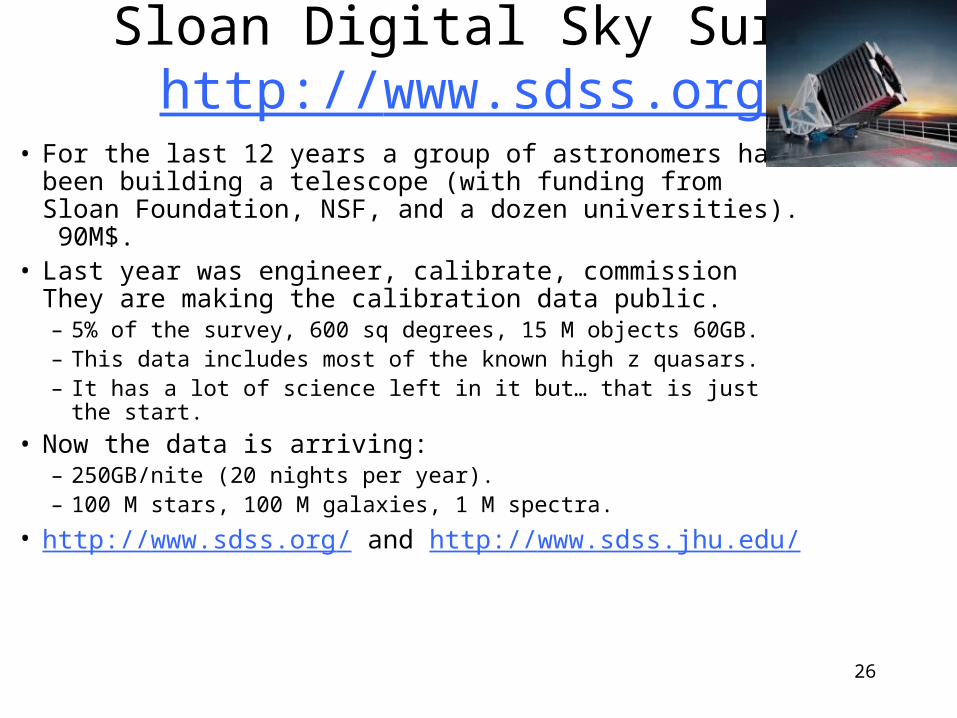
Sloan Digital Sky Survey http://www.sdss.org/
• For the last 12 years a group of astronomers has been building a telescope (with funding from Sloan Foundation, NSF, and a dozen universities). 90M$.
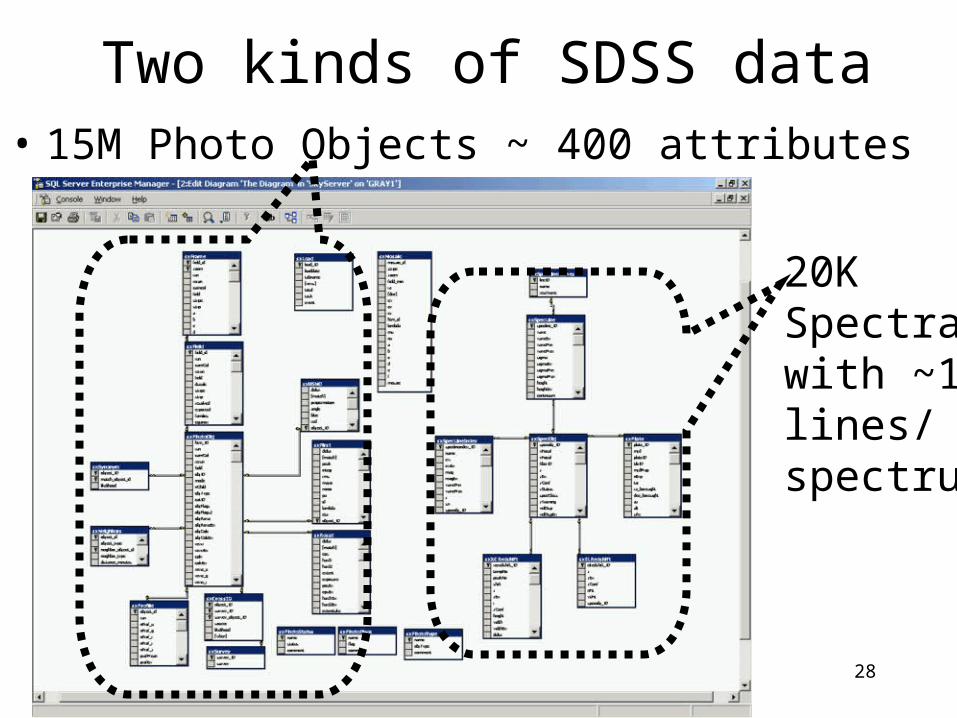
• Last year was engineer, calibrate, commission They are making the calibration data public.– 5% of the survey, 600 sq degrees, 15 M objects 60GB.– This data includes most of the known high z quasars.– It has a lot of science left in it but… that is just the start.
• Now the data is arriving: – 250GB/nite (20 nights per year).– 100 M stars, 100 M galaxies, 1 M spectra.
• http://www.sdss.org/ and http://www.sdss.jhu.edu/
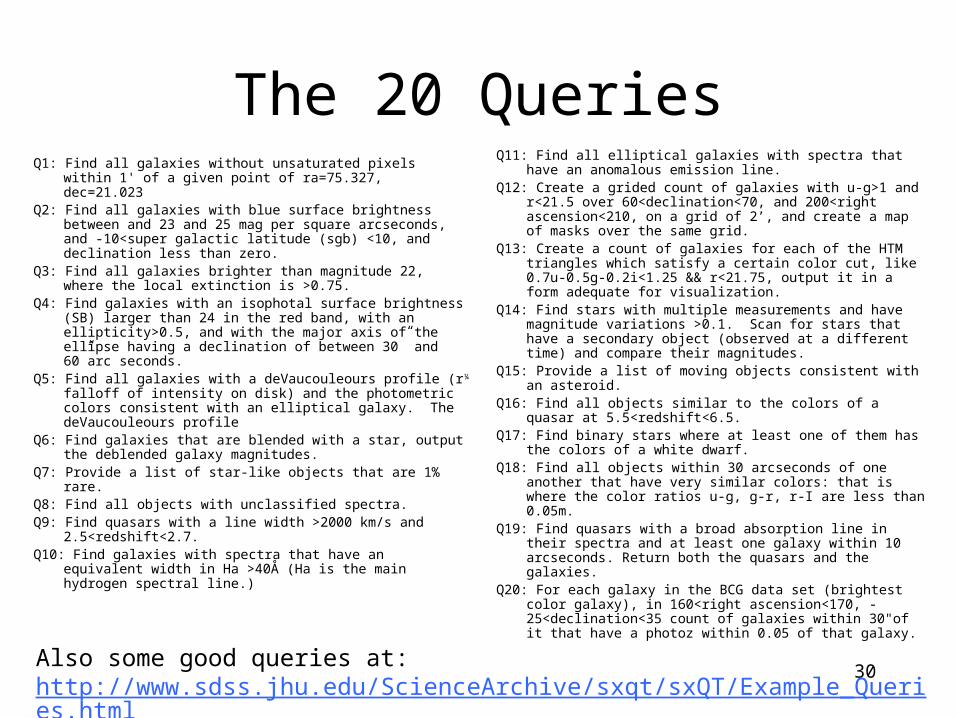
The 20 QueriesQ11: Find all elliptical galaxies with spectra that have an
anomalous emission line. Q12: Create a grided count of galaxies with u-g>1 and r<21.5 over
60<declination<70, and 200<right ascension<210, on a grid of 2’, and create a map of masks over the same grid.
Q13: Create a count of galaxies for each of the HTM triangles which satisfy a certain color cut, like 0.7u-0.5g-0.2i<1.25 && r<21.75, output it in a form adequate for visualization.
Q14: Find stars with multiple measurements and have magnitude variations >0.1. Scan for stars that have a secondary object (observed at a different time) and compare their magnitudes.
Q15: Provide a list of moving objects consistent with an asteroid.Q16: Find all objects similar to the colors of a quasar at
5.5<redshift<6.5.Q17: Find binary stars where at least one of them has the colors of a
white dwarf.Q18: Find all objects within 30 arcseconds of one another that have
very similar colors: that is where the color ratios u-g, g-r, r-I are less than 0.05m.
Q19: Find quasars with a broad absorption line in their spectra and at least one galaxy within 10 arcseconds. Return both the quasars and the galaxies.
Q20: For each galaxy in the BCG data set (brightest color galaxy), in 160<right ascension<170, -25<declination<35 count of galaxies within 30"of it that have a photoz within 0.05 of that galaxy.
Q1: Find all galaxies without unsaturated pixels within 1' of a given point of ra=75.327, dec=21.023
Q2: Find all galaxies with blue surface brightness between and 23 and 25 mag per square arcseconds, and -10<super galactic latitude (sgb) <10, and declination less than zero.
Q3: Find all galaxies brighter than magnitude 22, where the local extinction is >0.75.
Q4: Find galaxies with an isophotal surface brightness (SB) larger than 24 in the red band, with an ellipticity>0.5, and with the major axis of the ellipse having a declination of between 30” and 60”arc seconds.
Q5: Find all galaxies with a deVaucouleours profile (r¼ falloff of intensity on disk) and the photometric colors consistent with an elliptical galaxy. The deVaucouleours profile
Q6: Find galaxies that are blended with a star, output the deblended galaxy magnitudes.
Q7: Provide a list of star-like objects that are 1% rare.Q8: Find all objects with unclassified spectra. Q9: Find quasars with a line width >2000 km/s and
2.5<redshift<2.7. Q10: Find galaxies with spectra that have an equivalent width in Ha
>40Å (Ha is the main hydrogen spectral line.)
Also some good queries at: http://www.sdss.jhu.edu/ScienceArchive/sxqt/sxQT/Example_Queries.html
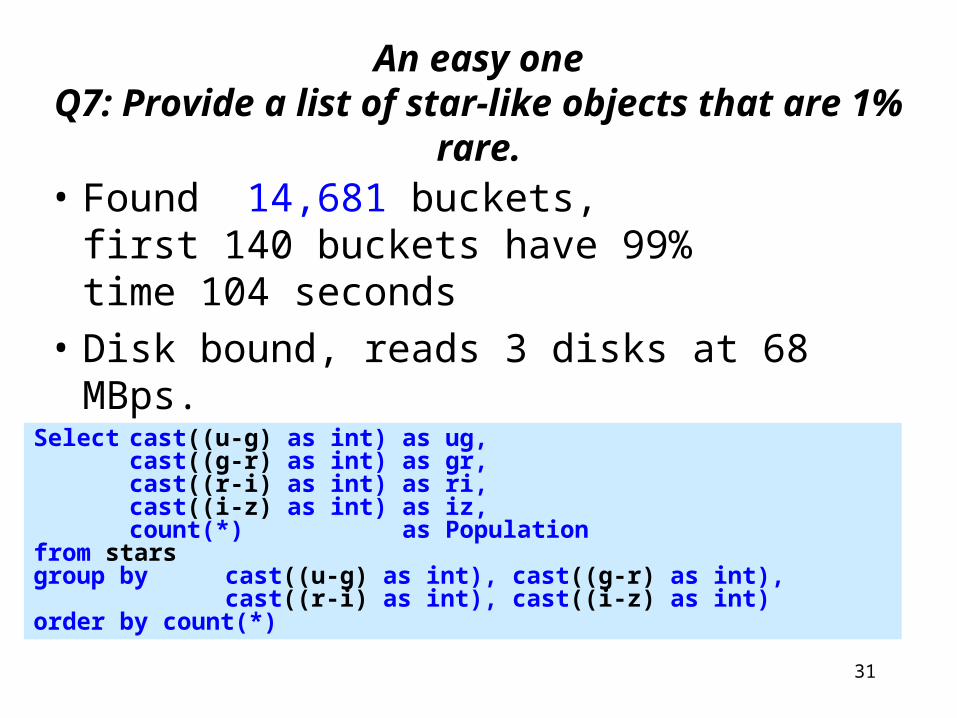
An easy oneQ7: Provide a list of star-like objects that are 1% rare.
• Found 14,681 buckets, first 140 buckets have 99% time 104 seconds
• Disk bound, reads 3 disks at 68 MBps.
Select cast((u-g) as int) as ug, cast((g-r) as int) as gr, cast((r-i) as int) as ri, cast((i-z) as int) as iz,count(*) as Population
from starsgroup by cast((u-g) as int), cast((g-r) as int), cast((r-i) as int), cast((i-z) as int) order by count(*)
32
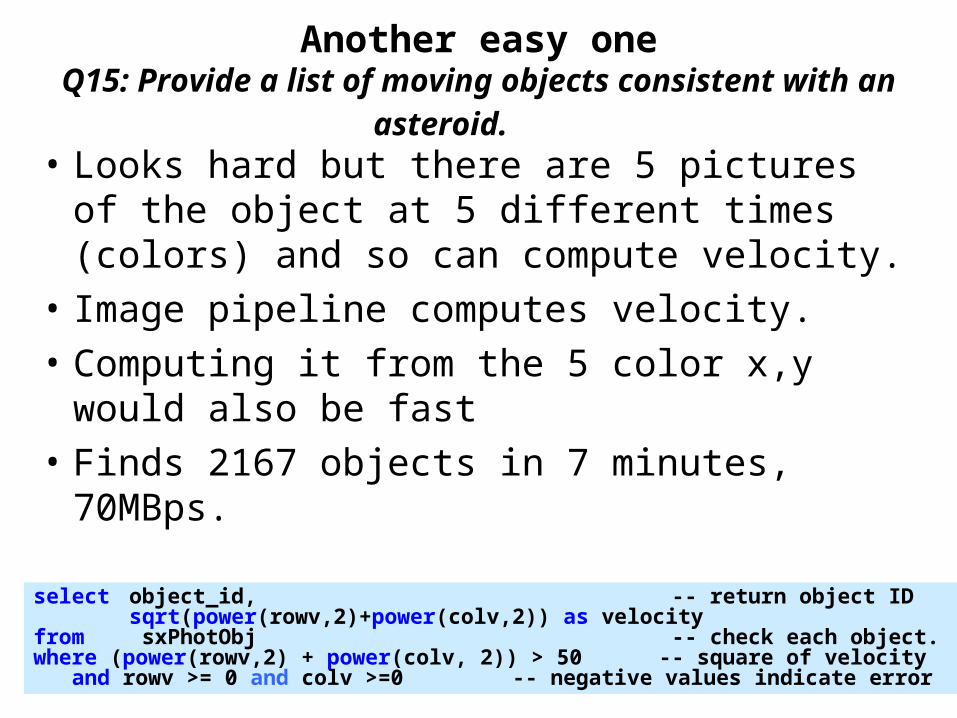
Another easy oneQ15: Provide a list of moving objects consistent with an asteroid.
• Looks hard but there are 5 pictures of the object at 5 different times (colors) and so can compute velocity.
• Image pipeline computes velocity.
• Computing it from the 5 color x,y would also be fast
• Finds 2167 objects in 7 minutes, 70MBps.
select object_id, -- return object ID sqrt(power(rowv,2)+power(colv,2)) as velocity from sxPhotObj -- check each object.where (power(rowv,2) + power(colv, 2)) > 50 -- square of velocity and rowv >= 0 and colv >=0 -- negative values indicate error
33
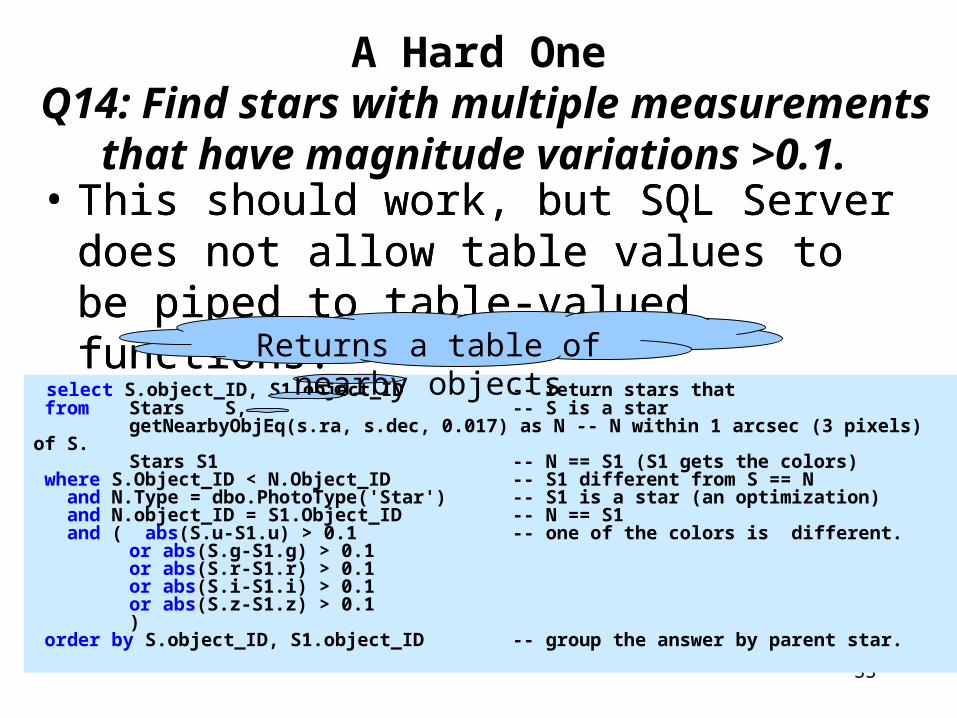
A Hard One Q14: Find stars with multiple measurements
that have magnitude variations >0.1. • This should work, but SQL Server does not
allow table values to be piped to table-valued functions.
• This should work, but SQL Server does not allow table values to be piped to table-valued functions.
select S.object_ID, S1.object_ID -- return stars that from Stars S, -- S is a star
getNearbyObjEq(s.ra, s.dec, 0.017) as N -- N within 1 arcsec (3 pixels) of S.
Stars S1 -- N == S1 (S1 gets the colors) where S.Object_ID < N.Object_ID -- S1 different from S == N and N.Type = dbo.PhotoType('Star') -- S1 is a star (an optimization) and N.object_ID = S1.Object_ID -- N == S1 and ( abs(S.u-S1.u) > 0.1 -- one of the colors is different. or abs(S.g-S1.g) > 0.1
or abs(S.r-S1.r) > 0.1or abs(S.i-S1.i) > 0.1or abs(S.z-S1.z) > 0.1
) order by S.object_ID, S1.object_ID -- group the answer by parent star.
Returns a table of nearby objects
34
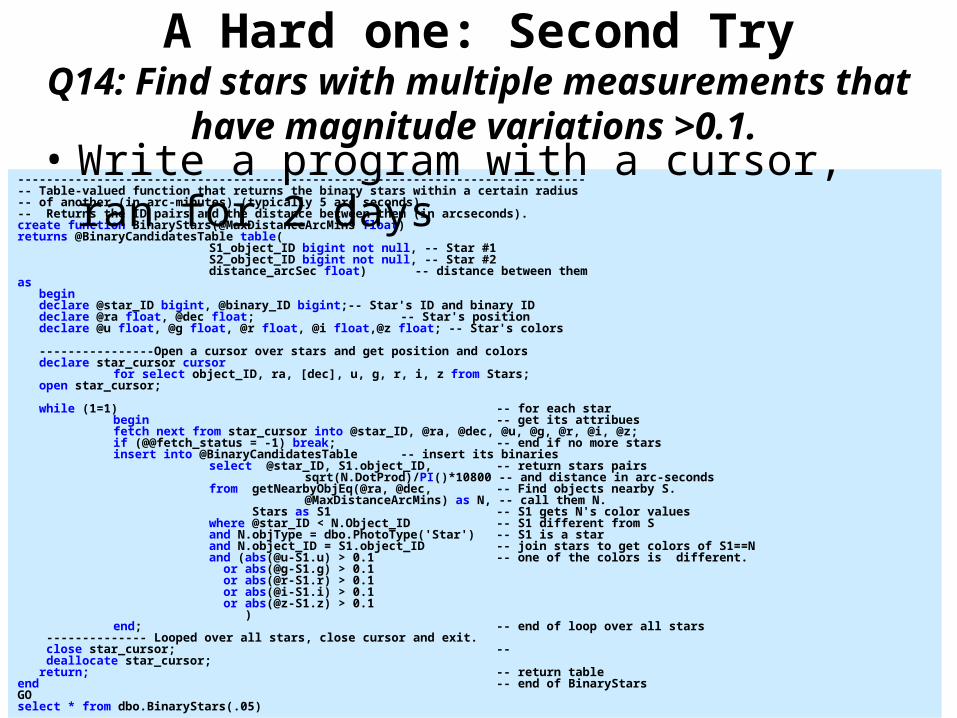
A Hard one: Second TryQ14: Find stars with multiple measurements that have
magnitude variations >0.1. --------------------------------------------------------------------------------- Table-valued function that returns the binary stars within a certain radius -- of another (in arc-minutes) (typically 5 arc seconds).-- Returns the ID pairs and the distance between them (in arcseconds).create function BinaryStars(@MaxDistanceArcMins float)returns @BinaryCandidatesTable table(
S1_object_ID bigint not null, -- Star #1S2_object_ID bigint not null, -- Star #2distance_arcSec float) -- distance between them
as begin declare @star_ID bigint, @binary_ID bigint;-- Star's ID and binary ID declare @ra float, @dec float; -- Star's position declare @u float, @g float, @r float, @i float,@z float; -- Star's colors ----------------Open a cursor over stars and get position and colors declare star_cursor cursor for select object_ID, ra, [dec], u, g, r, i, z from Stars; open star_cursor; while (1=1) -- for each star
begin -- get its attribuesfetch next from star_cursor into @star_ID, @ra, @dec, @u, @g, @r, @i, @z;if (@@fetch_status = -1) break; -- end if no more starsinsert into @BinaryCandidatesTable -- insert its binaries
select @star_ID, S1.object_ID, -- return stars pairs sqrt(N.DotProd)/PI()*10800 -- and distance in arc-seconds
from getNearbyObjEq(@ra, @dec, -- Find objects nearby S.@MaxDistanceArcMins) as N, -- call them N.
Stars as S1 -- S1 gets N's color valueswhere @star_ID < N.Object_ID -- S1 different from S
and N.objType = dbo.PhotoType('Star') -- S1 is a starand N.object_ID = S1.object_ID -- join stars to get colors of S1==N
and (abs(@u-S1.u) > 0.1 -- one of the colors is different. or abs(@g-S1.g) > 0.1
or abs(@r-S1.r) > 0.1 or abs(@i-S1.i) > 0.1 or abs(@z-S1.z) > 0.1
) end; -- end of loop over all stars
-------------- Looped over all stars, close cursor and exit. close star_cursor; -- deallocate star_cursor; return; -- return tableend -- end of BinaryStarsGOselect * from dbo.BinaryStars(.05)
• Write a program with a cursor, ran for 2 days
35
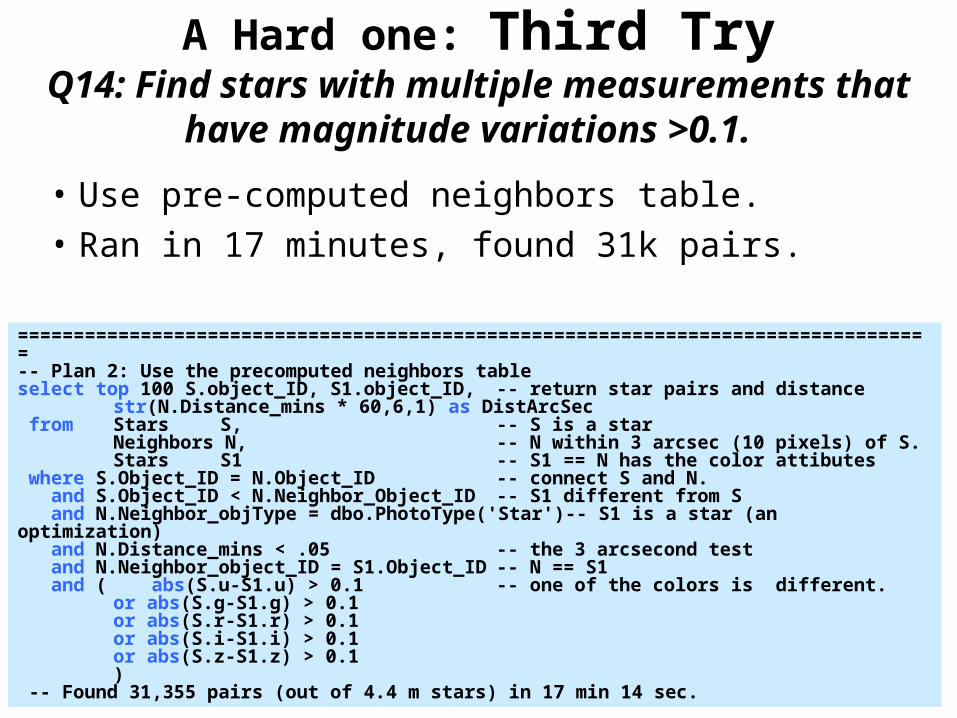
A Hard one: Third TryQ14: Find stars with multiple measurements that have
magnitude variations >0.1.
• Use pre-computed neighbors table.
• Ran in 17 minutes, found 31k pairs.
==================================================================================-- Plan 2: Use the precomputed neighbors table select top 100 S.object_ID, S1.object_ID, -- return star pairs and distance
str(N.Distance_mins * 60,6,1) as DistArcSec from Stars S, -- S is a star
Neighbors N, -- N within 3 arcsec (10 pixels) of S.Stars S1 -- S1 == N has the color attibutes
where S.Object_ID = N.Object_ID -- connect S and N. and S.Object_ID < N.Neighbor_Object_ID -- S1 different from S and N.Neighbor_objType = dbo.PhotoType('Star')-- S1 is a star (an optimization) and N.Distance_mins < .05 -- the 3 arcsecond test and N.Neighbor_object_ID = S1.Object_ID -- N == S1 and ( abs(S.u-S1.u) > 0.1 -- one of the colors is different. or abs(S.g-S1.g) > 0.1
or abs(S.r-S1.r) > 0.1or abs(S.i-S1.i) > 0.1or abs(S.z-S1.z) > 0.1
) -- Found 31,355 pairs (out of 4.4 m stars) in 17 min 14 sec.
36
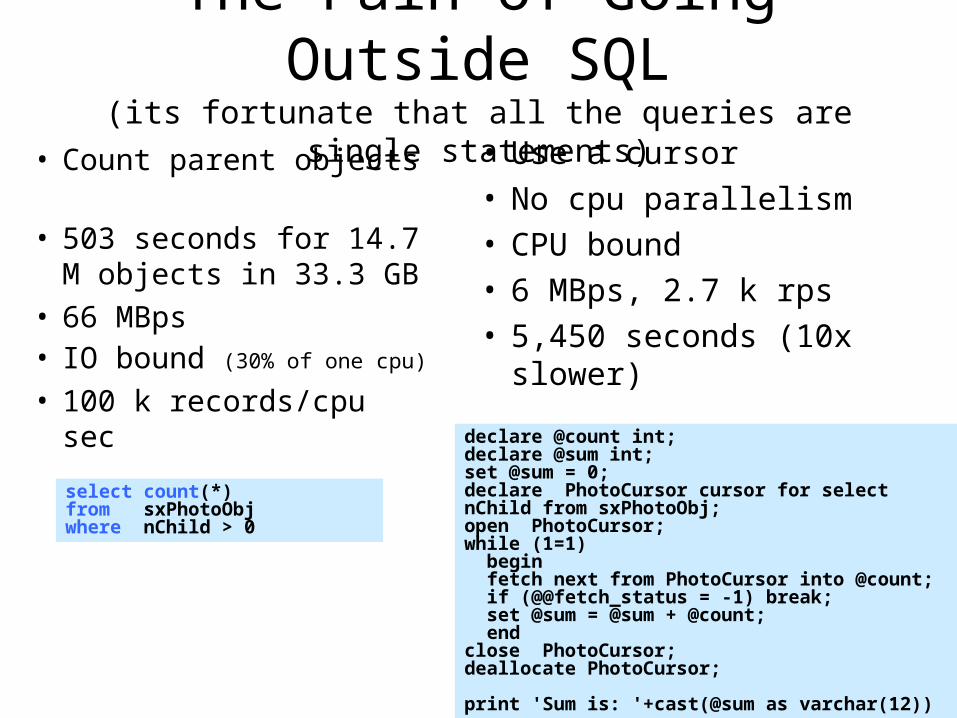
The Pain of Going Outside SQL(its fortunate that all the queries are single statements)
• Count parent objects • 503 seconds for 14.7 M
objects in 33.3 GB• 66 MBps• IO bound (30% of one cpu)
• 100 k records/cpu sec
• Use a cursor• No cpu parallelism• CPU bound • 6 MBps, 2.7 k rps• 5,450 seconds (10x slower)
select count(*) from sxPhotoObj where nChild > 0
declare @count int;declare @sum int;set @sum = 0;declare PhotoCursor cursor for select nChild from sxPhotoObj; open PhotoCursor;while (1=1) begin fetch next from PhotoCursor into @count; if (@@fetch_status = -1) break; set @sum = @sum + @count; endclose PhotoCursor;deallocate PhotoCursor;
print 'Sum is: '+cast(@sum as varchar(12))
37
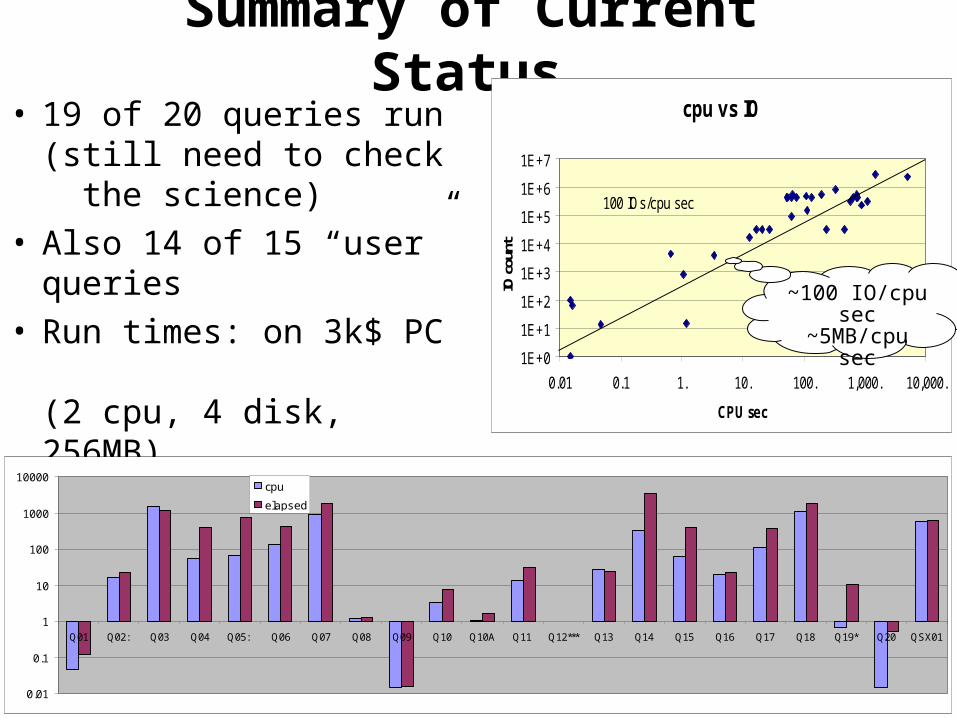
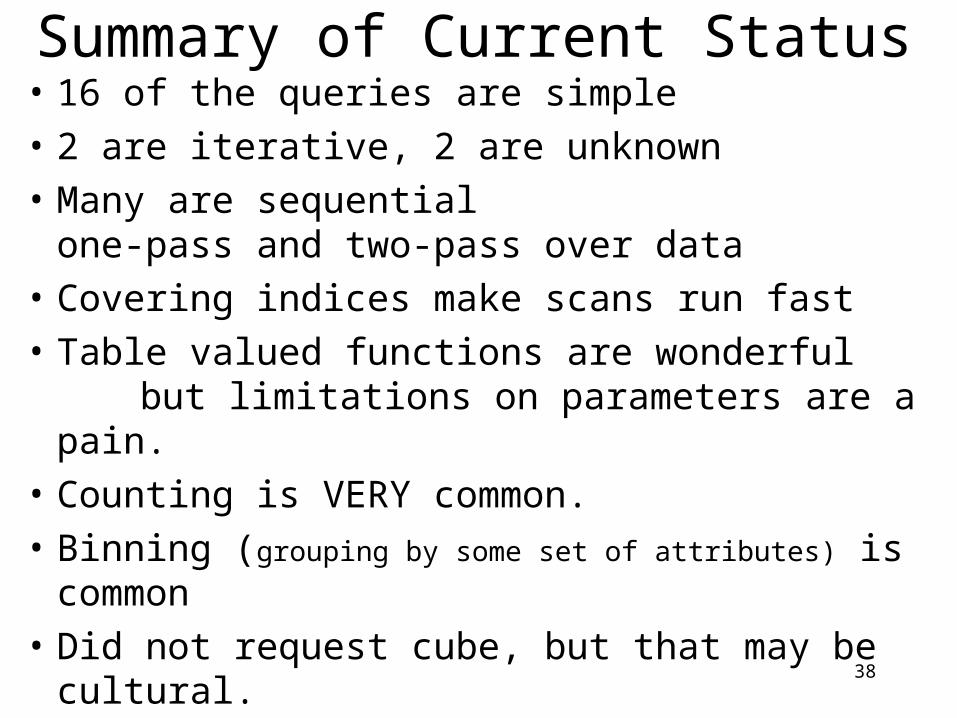
Summary of Current Status
• 19 of 20 queries run(still need to check the science)
• Many are sequential one-pass and two-pass over data
• Covering indices make scans run fast
• Table valued functions are wonderful but limitations on parameters are a pain.
• Counting is VERY common.
• Binning (grouping by some set of attributes) is common
• Did not request cube, but that may be cultural.
39
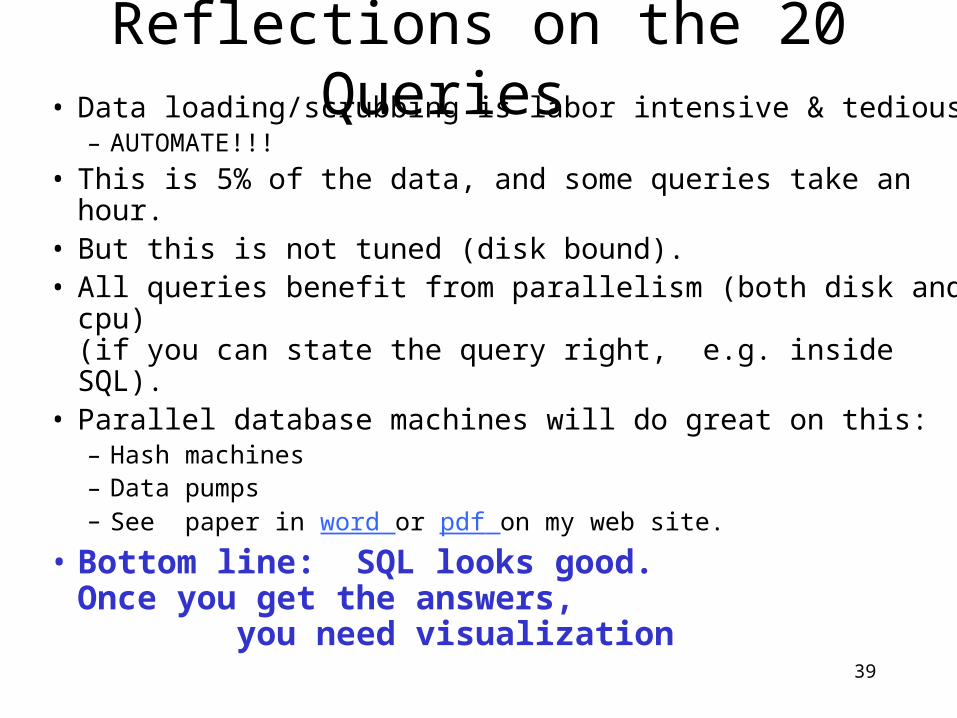
Reflections on the 20 Queries • Data loading/scrubbing is labor intensive & tedious
– AUTOMATE!!!
• This is 5% of the data, and some queries take an hour.• But this is not tuned (disk bound).• All queries benefit from parallelism (both disk and cpu)
(if you can state the query right, e.g. inside SQL).• Parallel database machines will do great on this:
– Hash machines – Data pumps– See paper in word or pdf on my web site.
• Bottom line: SQL looks good.Once you get the answers, you need visualization