14
1 Defect Remediation Defect Remediation Project Project West Campus Point West Campus Point March 13, 2007 March 13, 2007 Part 4 of 4 Part 4 of 4
| Date post: | 02-Jan-2016 |
| Category: |
Documents |
| Upload: | gordon-cross |
| View: | 213 times |
| Download: | 0 times |
11
Defect Remediation ProjectDefect Remediation ProjectWest Campus PointWest Campus Point
March 13, 2007March 13, 2007
Part 4 of 4Part 4 of 4

22
Additional IssuesAdditional IssuesAdditional IssuesAdditional Issues
• Soil grading (flooding)
• Communication between WCP and University
• Cost recovery mechanism
• Valuation of units

33
Guiding PrinciplesGuiding PrinciplesGuiding PrinciplesGuiding Principles
• WCP Board needs to be an equal partner with University in shaping and approving all aspects of the solution
• No one wants to go through this #$#%&! again!

44
Action ItemsAction ItemsAction ItemsAction Items
• Regular operational meetings
• Access to senior administrators
• Timetable
• Periodic high-level progress reviews

55
• Everett Kirkelie created the first budget in 1986
• Yearly Budgeting > Homeowners’ Assessments
WCP FinancesWCP FinancesWCP FinancesWCP Finances
2007 Assessmentsbased on reviews conducted every 2-3 years
of 30-year infrastructure needs
Operating… 2/3
$323 per month1)Landscaping2) Insurance3)Management
Reserves… 2/3
$168 per month1)Roofing2) Paint3)Street

66
2007: $491/month$177,000/(30 Years)
1987: $135/month$48,600/(30 years)
1987 Scaled by Faculty Salary Scale (CPEC)
Total Monthly Payment Per Unit
Sources: WCPHOA Annual Reports, BLS, CPEC
Original budget created
by Everett Kirkelie

77
2007: $491/month$177,000/(30 Years)
1987: $135/month$48,600/(30 years)
1987 Scaled byConsumer Price Index
1987 Scaled by Faculty Salary Scale (CPEC)
Sources: WCPHOA Annual Reports, BLS, CPEC
Total Monthly Assessment Per Unit
88
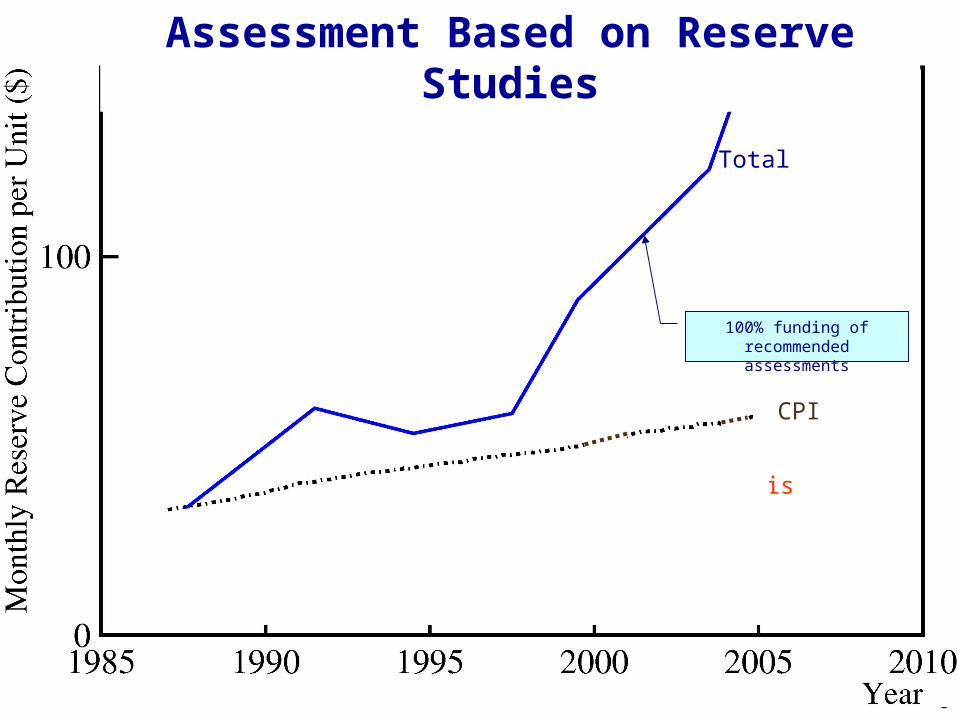
Total
CPI Roof/Deck/Trellis
Sources: WCPHOA Reserve Studies, BLS
CPI
Assessment Based on Reserve Studies
100% funding of recommended assessments
99
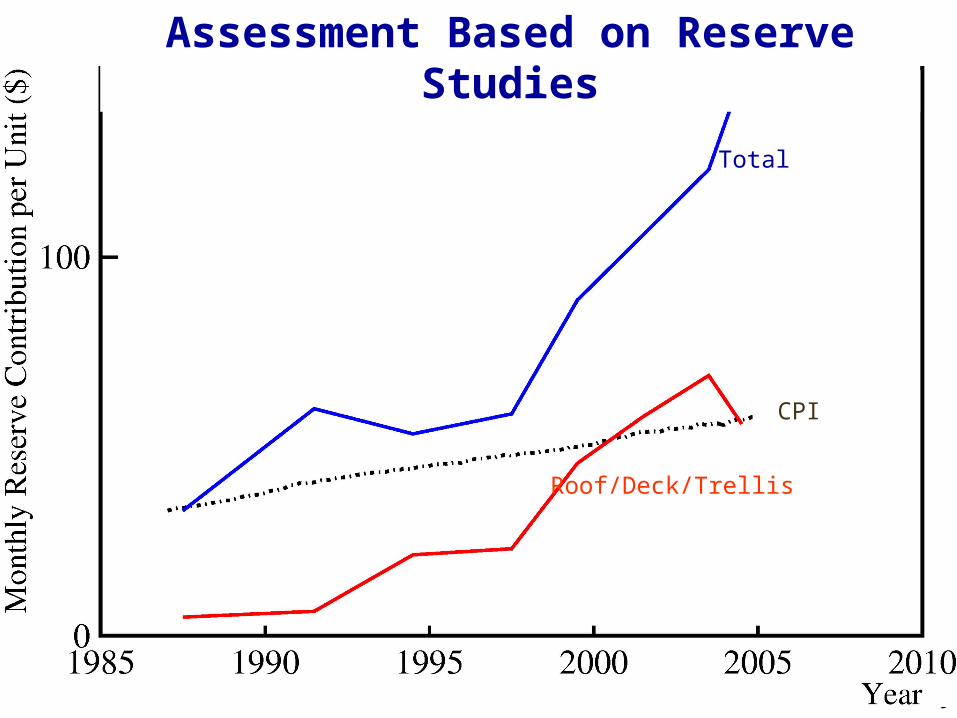
Total
CPI Roof/Deck/Trellis
Sources: WCPHOA Reserve Studies, BLS
CPI
Assessment Based on Reserve Studies

1010
Why Reexamine the WCP “Index” for Why Reexamine the WCP “Index” for AppreciationAppreciation of Units over Time? of Units over Time?
To restore original intent of both the University To restore original intent of both the University and faculty and faculty
To increase the chances that WCP owners would To increase the chances that WCP owners would be able to move out, thus freeing the homes for be able to move out, thus freeing the homes for future recruits.future recruits.
To create a common standard to apply across all To create a common standard to apply across all UCSB faculty housing owners at WCP, North UCSB faculty housing owners at WCP, North Campus, etc. based on current published Campus, etc. based on current published economic information.economic information.
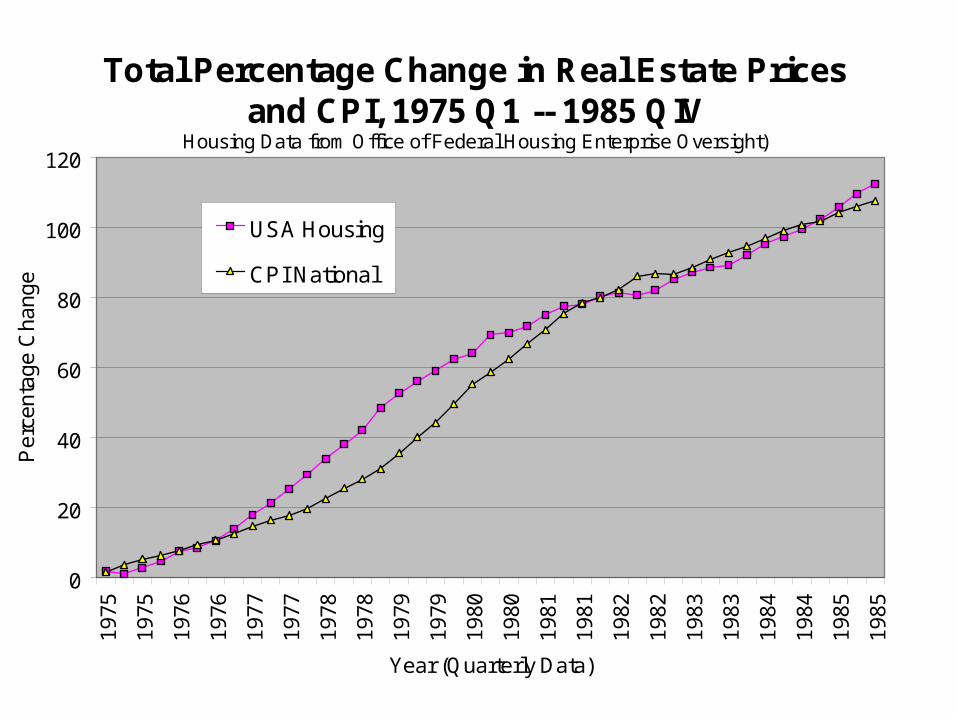
Total Percentage Change in Real Estate Prices and CPI, 1975 Q1 -- 1985 QIV
Housing Data from Office of Federal Housing Enterprise Oversight)
0
20
40
60
80
100
120
1975
1975
1976
1976
1977
1977
1978
1978
1979
1979
1980
1980
1981
1981
1982
1982
1983
1983
1984
1984
1985
1985
Year (Quarterly Data)
Per
cent
age
Cha
nge
USA Housing
CPI National

1212
Total Percentage Change in Real Estate Total Percentage Change in Real Estate Prices and CPI, 1975 QI – 1985 QIVPrices and CPI, 1975 QI – 1985 QIV This graphThis graph
Approximates a graph shown to first buyers to Approximates a graph shown to first buyers to justify using CPI as index.justify using CPI as index.
Shows that CPI and real estate prices rose at Shows that CPI and real estate prices rose at similar rates, on average, in base period.similar rates, on average, in base period.
http://www.ofheo.gov/HPI.asp
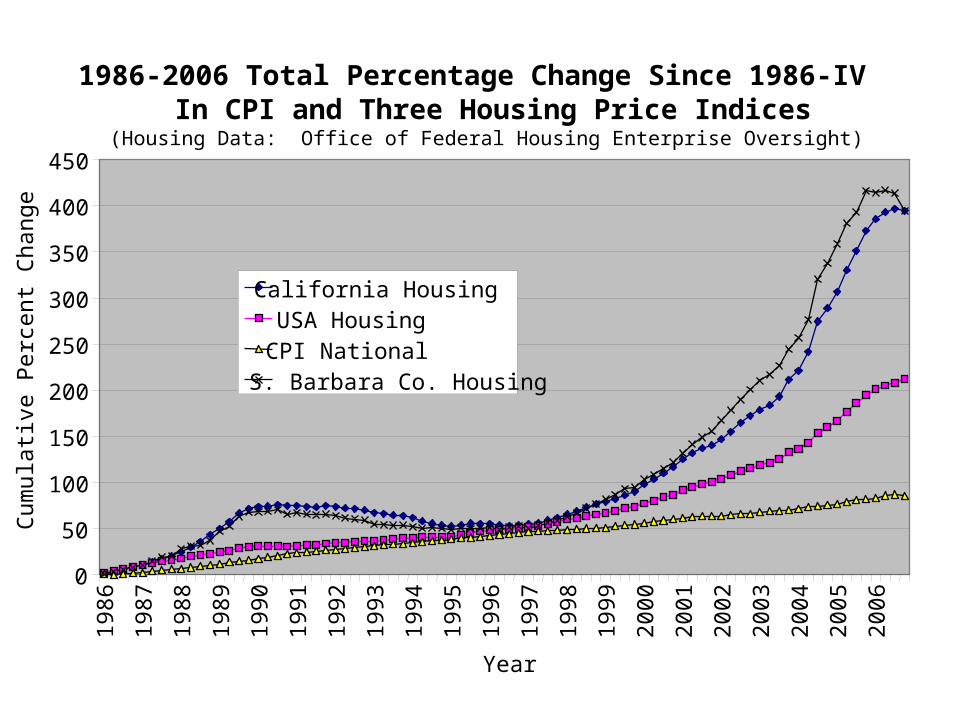
1986-2006 Total Percentage Change Since 1986-IV In CPI and Three Housing Price Indices
(Housing Data: Office of Federal Housing Enterprise Oversight)
0
50
100
150
200
250
300
350
400
450
1986
1987
1988
1989
1990
1991
1992
1993
1994
1995
1996
1997
1998
1999
2000
2001
2002
2003
2004
2005
2006
Year
Cum
ulat
ive
Pe
rce
nt C
han
ge
California HousingUSA HousingCPI NationalS. Barbara Co. Housing

1414
1986-2006 Total Percentage Change 1986-2006 Total Percentage Change Since 1986-QIV in CPI and Three Since 1986-QIV in CPI and Three
Housing Price IndexesHousing Price Indexes Inflation in housing prices has far outstripped the CPI in the last Inflation in housing prices has far outstripped the CPI in the last
decadedecade
““Santa Barbara Co.” trend data are for the “Santa Barbara-Santa Santa Barbara Co.” trend data are for the “Santa Barbara-Santa Maria Metropolitan Statistical Area”Maria Metropolitan Statistical Area”
OFHEO data coverOFHEO data cover Single family homes Single family homes Repeat sales of same properties: “constant quality”Repeat sales of same properties: “constant quality” Conforming mortgages only, up to $417KConforming mortgages only, up to $417K Readily available dataReadily available data
(End of Part 4)


