College of Education and Human SciencesUniversity of Nebraska–Lincoln
EVALUATING THE IMPACTof Nebraska’s School Improvement Grants
GREG W. WELCH, PH.D.BENJAMIN BAUMFALK, M.A.University of Nebraska–LincolnNebraska Center for Research on Children, Youth, Families and Schools
SHAVONNA HOLMAN, ED.D.University of Nebraska–LincolnDepartment of Educational Administration FOR TECHNICAL QUESTIONS AND GENERAL CORRESPONDENCE: 1400 R Street, teac 140, Lincoln, Nebraksa [email protected] | 402.472.4364
2
CONTENTS
Executive Summary 1
Introduction 1
Nebraska Grantee Descriptions 3
Overview of Evaluation Plan 4
Evaluation Questions 5CIPP Model 5Methodology 8Data Analysis Plan 8Reporting and Dissemination Plan 8Timeline 8
ACKNOWLEDGEMENTS We thank the Cohort I school administration and support staff members that were willing to assist us with this project. We appreciate your efforts in gathering the requested data and submitting it for our use.
We express sincere gratitude to Diane Stuehmer, Randy McIntyre and the Federal Programs Team at the Nebraska Department of Education (NDE) for their expertise, suggestions and continued support with this project. We also thank the Data, Research and Evaluation Team at NDE for their assistance with providing us other necessary data needed to complete the project.
We also recognize Jody Isernhagen for her research and contributions in past project evaluation efforts. We offer our appreciation for her willingness to share her previous reports as well as the encouragement she provided.
A special thanks to Marjorie Kostelnik, Dean of the College of Education and Human Sciences at the University of Nebraska–Lincoln, Brent Cejda, Chair of the Department of Educational Administration, and Susan Sheridan, Director for the Nebraska Center for Research on Children, Youth, Families and Schools for their unwavering commitment and lasting support for this project.
4
EXECUTIVE SUMMARYThis white paper summarizes the development of an evaluation plan to measure the educational improvement in Title I schools that have received School Improvement Grants (SIGs). In developing this plan, a baseline study was conducted to provide comparisons of seven schools representing six districts in Nebraska’s Cohort 1 SIGs awarded in 2010. Longitudinal school level data was examined to compare five categories of schools: (1) Title I: Needs Improvement; (2) Title I: Not Needs Improvement; (3) Non-Title I: Needs Improvement; (4) Non-Title I: Not Needs Improvement; and (5) SIG Funded Schools. Each school is a member of one, and only one, of these five categories and their membership throughout all data years examined is based on their status in 2010-2011. The primary outcomes of interest in the baseline study were NeSA Math and Reading proficiency, AYP decisions, student attendance rate, number of discipline incidents, four-year cohort graduation rate and dropout rate.
In preceding evaluations of school improvement programs in Nebraska, qualitative methods were used to examine the implementation of the school improvement plans for improving student achievement. However, as the Cohort 1 SIGs have come to an end, the focus of study has shifted to the effectiveness of the Transformation model in improving student achievement. The proposed evaluation plan contained within this report is designed to represent an innovative mixed methods approach to evaluating the impact of SIG grants on academic outcomes for students in Nebraska schools.
The University of Nebraska-Lincoln’s Educational Administration Department (EDAD) and the Nebraska Center for Research on Children, Youth, Families and Schools (CYFS) worked collaboratively with Nebraska Department of Education (NDE) personnel to accomplish the primary purposes of this evaluation, which were: (1) identify alternative approaches for evaluating the impact of SIG funding on student outcomes; (2) develop an innovative comprehensive evaluation plan for assessing the impact of SIG funding in Nebraska Title I: Needs Improvement schools; and (3) conduct a baseline study consisting of comparisons of SIG funded schools with schools in other pre-determined categories.
INTRODUCTIONAs a condition of receiving federal funds under No Child Left Behind (NCLB), all states are required to define a process for identifying groups of students, schools and districts as being in need of improvement. This requirement, termed Adequate Yearly Progress (AYP), is an annual status check of identified data elements to determine whether or not buildings and districts are meeting state AYP progress goals. If a school with a Title I program does not make AYP progress goals in two consecutive years, the school is designated as “needs improvement.” In the first year of designation, “needs improvement” schools must provide students with the option to transfer to another school within the same district. In the 2nd year of designation, “needs improvement” schools must provide students with supplemental education services (e.g., tutoring) in addition to the option to transfer. Additional sanctions apply the longer a Title I school does not meet AYP requirements (Nebraska Department of Education, 2013).
In an effort to turn around the nation’s lowest performing schools, $3 billion of the American Recovery and Reinvestment Act (ARRA) of 2009 was allocated to the United States Department of Education (U.S. DoE) to provide adequate resources to raise the achievement of students in Title I: Needs Improvement schools in order to meet AYP and exit
“needs improvement” status. The SIGs, authorized under section 1003(g) of Title I of the Elementary and Secondary Education Act of 1965, are competitive grants designed to increase student achievement in the lowest performing schools demonstrating the greatest need. To be considered for SIG funds, during the application process the state education agency (SEA) and the local education agency (LEA) are required to be responsive to the following key areas: (1) demonstrate a substantial need for funding; (2) selection of a SIG model appropriate for improving a specific school; (3) a strong commitment to implement the model with fidelity; (4) a budget supporting and explaining the use for the funds; and (5) specific activities which will take place in order to assist with raising student achievement. The use of SIG funds are expected to improve student proficiency, increase the numbers of schools that make AYP, increase use of data to inform decisions and create a system of continuous
5
feedback and improvement (Nebraska Department of Education, 2013).
School districts awarded funding are required to implement one of four school improvement models: Closure, Restart, Turnaround or Transformation. Each model consists of specific requirements for principals,
Federal guidance requires schools receiving section 1003(g) SIG funds to use one of the following school improvement models:
• Transformation: Implement each of the following strategies: (1) replace the principal and take steps to increase teacher and school leader effectiveness; (2) institute comprehensive instructional reforms; (3) increase learning time and create community-oriented schools; and (4) provide operational flexibility and sustained support.
• Turnaround: Replace the principal and rehire no more than 50% of the staff, and grant the principal
teachers, providers and school operators. These models differ in start-up and ongoing operating costs and vary in how they impact key stakeholders within the community and school. However, all of the models are designed to improve student achievement. A brief description of each model is provided in Box A below.
Nebraska Cohort 1 SIG recipients overwhelmingly opted for the Transformation model. This choice is consistent with findings by O’Brien & Dervarics (2013), which suggest the Transformation model is the most popular among SIG grantees due to the flexibility it offers. The U.S. Department of Education (2011) reported that the Transformation model was chosen by 74% of first-round grantees. Research conducted by the Centers on Education Policy (2012) suggests the Transformation model has a positive impact, with more than half of 45 states implementing this model reporting varying levels of improvement in student achievement. This study also concluded that 25 of the 45 states utilizing this model indicated that replacing the principal is a key element to improving student achievement.
NEBRASKA GRANTEE DESCRIPTIONSIn 2010, over $12 million in SIG funds were allocated to 7 of the 16 Title I: Needs Improvement schools applying for funding. The range of funding for these schools was between $1.2 million to $3.3 million for the duration of three years. The selected schools were located in six districts; with one district having two schools. Six of the schools are located in rural communities and
sufficient operational flexibility (including in staffing, calendars/time and budgeting) to fully implement a comprehensive approach to substantially improve student outcomes.
• Restart: Convert a school or close and reopen it under a charter school operator, a charter management organization, or an education management organization that has been selected through a rigorous review process.
• School closure: Close a school and enroll the students who attended that school in other schools in the district that are higher achieving.
Source: U.S. Department of Education, 2011
BOX A. School Improvment Models
one of the schools is located in an urban community. Tables 1 through 3 provide background descriptive information for Nebraska’s Cohort 1 SIG recipients. Key characteristics of each school include:
Crawford Elementary School is a pre-K through 6 elementary school serving 125 students in the community of Crawford, Nebraska. The community of Crawford consists of approximately 1000 people and is located in the far northwestern corner of the state. Ethnic diversity is very limited with approximately 95% of the student population being White.
Santee Community School is a K-12 public school district serving 149 students. The district is within the confines of the Santee Sioux Nation Reservation in Northeast Nebraska and located in the village of Santee. The village has approximately 500 people. The student population is nearly 90% Native American, the majority of whom are from low socio-economic families. Approximately 50% of Santee students live in a single-parent or grandparent as caregiver home.
Elliott Elementary School belongs to the Lincoln Public School district, the second largest public school district in Nebraska. Elliott’s strength lies in its diversity. The
6
ethnic breakdown does not capture the cultural and linguistic diversity of the school. There is a growing population of children, new to the United States from the Middle East and Europe, reflected in the ethnic code of white. There are 26 first languages spoken by the children at Elliott.
Madison Elementary School is located in the community of Madison, Nebraska. The community of nearly 2400 people is situated in Northeast Nebraska. Madison Elementary School serves a high proportion of Hispanic students.
Minatare Elementary School is a rural school located in the far western Nebraska community of Minatare. The Minatare community has a population just over 800. Approximately 80% of the students are designated with free or reduced lunch status and over 44% are minority students.
Winnebago Public High School is located in northeastern Nebraska in Winnebago, a village of less than 800 residents. The student body is approximately 93% American Indian. The majority of the students are members of the Winnebago Tribe of Nebraska.
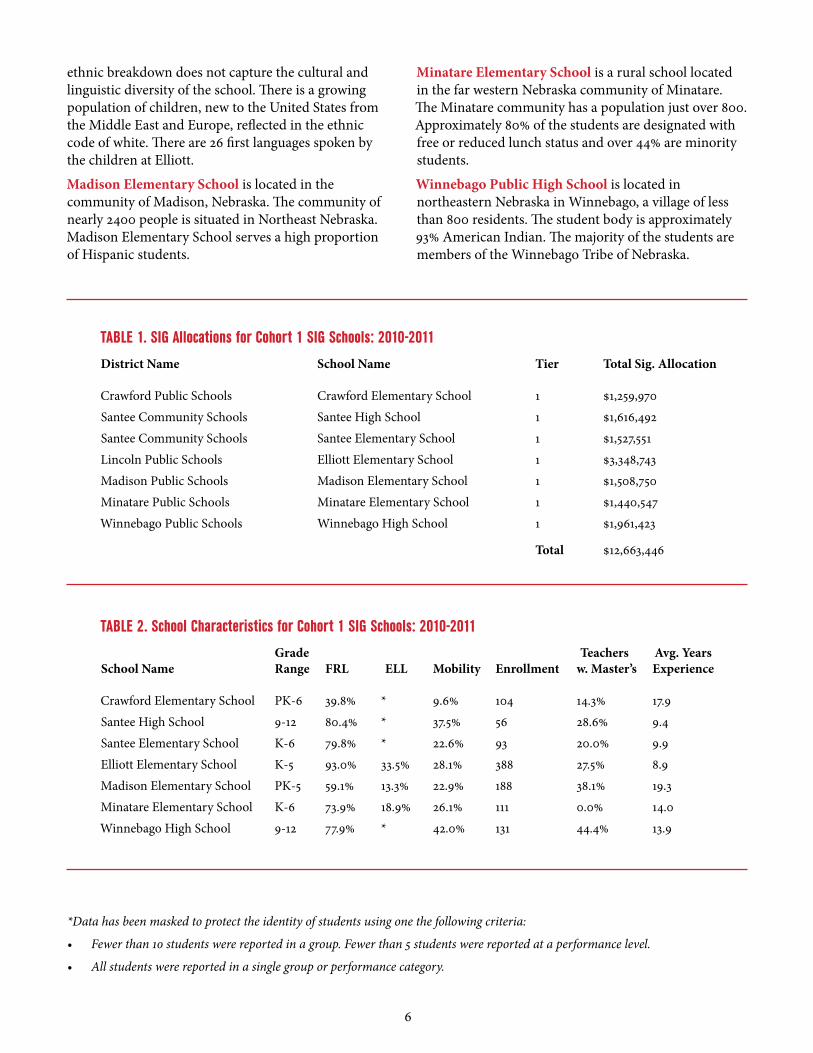
District Name School Name Tier Total Sig. Allocation
Crawford Public Schools Crawford Elementary School 1 $1,259,970Santee Community Schools Santee High School 1 $1,616,492Santee Community Schools Santee Elementary School 1 $1,527,551Lincoln Public Schools Elliott Elementary School 1 $3,348,743Madison Public Schools Madison Elementary School 1 $1,508,750Minatare Public Schools Minatare Elementary School 1 $1,440,547Winnebago Public Schools Winnebago High School 1 $1,961,423
Total $12,663,446
Grade Teachers Avg. Years School Name Range FRL ELL Mobility Enrollment w. Master’s Experience
Crawford Elementary School PK-6 39.8% * 9.6% 104 14.3% 17.9Santee High School 9-12 80.4% * 37.5% 56 28.6% 9.4Santee Elementary School K-6 79.8% * 22.6% 93 20.0% 9.9Elliott Elementary School K-5 93.0% 33.5% 28.1% 388 27.5% 8.9Madison Elementary School PK-5 59.1% 13.3% 22.9% 188 38.1% 19.3Minatare Elementary School K-6 73.9% 18.9% 26.1% 111 0.0% 14.0Winnebago High School 9-12 77.9% * 42.0% 131 44.4% 13.9
TABLE 1. SIG Allocations for Cohort 1 SIG Schools: 2010-2011
TABLE 2. School Characteristics for Cohort 1 SIG Schools: 2010-2011
*Data has been masked to protect the identity of students using one the following criteria:
• Fewer than 10 students were reported in a group. Fewer than 5 students were reported at a performance level.
• All students were reported in a single group or performance category.
7
Native American Hawaiian Indian/ Black or or other Alaskan African Pacific Two or School Name Hispanic Native Asian American Islander White More Races
Crawford Elementary School 1.9% 2.9% 0.0% 0.0% 0.0% 95.2% 0.0%Santee High School 7.1% 92.9% 0.0% 0.0% 0.0% 0.0% 0.0%Santee Elementary School 11.8% 88.2% 0.0% 0.0% 0.0% 0.0% 0.0%Elliott Elementary School 29.9% 3.4% 10.3% 16.2% 0.0% 28.4% 11.9%Madison Elementary School 80.3% 0.5% 0.5% 1.6% 0.0% 17.0% 0.0%Minatare Elementary School 42.3% 2.7% 0.0% 0.0% 0.0% 55.0% 0.0%Winnebago High School 6.1% 93.1% 0.0% 0.0% 0.0% 0.8% 0.0%
TABLE 3. Student Race/Ethnicity for Cohort 1 SIG Schools: 2010-2011
OVERVIEW OF THE EVALUATION PLANPrevious evaluation efforts contracted by NDE have focused primarily on administrator and teacher perceptions of the implementation of school improvement plans in Title I: Needs Improvement, Title I: Not in Need of Improvement and Non-Title I: Needs Improvement schools (Isernhagen & Florendo, 2011, 2012, 2013; Isernhagen, 2010). These studies provided recommendations for the effective implementation of Title I School Improvement plans based on qualitative data collected from administrators and teachers through interviews and surveys (Isernhagen & Florendo, 2011, 2012, 2013; Isernhagen, 2010). The current evaluation builds upon these efforts through the development of a comprehensive evaluation plan using a theoretical evaluation framework to determine the impacts of SIGs on receiving districts and schools. The availability of administrative data from the Nebraska State Longitudinal Data System (SLDS), as well as data from other sources, will be leveraged to implement innovative quantitative methods suitable for a rigorous impact evaluation.
The current evaluation plan was informed through an intensive literature review focused on the impact of SIG funding in schools across the nation. The most comprehensive of the evaluation studies reviewed was conducted in SIG funded schools in Michigan. The evaluation, conducted by WestEd (Coscarella et al., 2012), serves as a model for evaluating the implementation and impact of SIG funding. The methodological rigor used by WestEd represents
an innovative, mixed methods approach sufficient for addressing the impact of SIG funding on student achievement. The proposed evaluation for Nebraska schools builds upon the WestEd evaluation through the use of comparable methodology in the context of the widely utilized and effective Context-Input-Process-Product (CIPP) evaluation model put forth by Stufflebeam (2003). In addition, the Utilization Focused Evaluation (UFE: Patton, 2008) approach will be adopted to facilitate use within each element of the CIPP model.
The use of the CIPP and UFE models requires frequent stakeholder input during each step of the evaluation process, including the development of the evaluation plan. Therefore, the proposed plan will require critical feedback from leaders within NDE prior to being finalized. As a precursor to full implementation of the proposed evaluation plan, a baseline study was conducted to examine the impact on a limited set of outcomes contained in the Nebraska SLDS.
Evaluation Questions. The proposed evaluation plan will focus on three primary questions:
(1) How are the schools and districts implementing the Transformation model?
a. How was the Transformation model intended to be implemented within each school?
b. To what extent are the schools implementing the Transformation models as intended?
(2) What impact does SIG funding have on student and teacher outcomes in Title I: Needs Improvement schools receiving SIGs?
8
a. What impact does SIG funding have on student academic achievement?
b. What impact does SIG funding have on student participation in school (i.e., attendance, behavior, retention, graduation)?
c. What impact does SIG funding have on teacher retention?
3) What is the relationship between the implementation of the Transformation model and outcomes in schools that receive SIG funding?
CIPP Model. The CIPP model consists of evaluation activities focused on context, input, process and product evaluations. The collection of these four types of evaluation data will allow the evaluation team to: (1) determine the impact of the Transformational model on academic achievement; (2) develop a process for measuring fidelity of implementation to the Transformation model; and (3) examine the relationship between implementation fidelity and academic achievement.
The context evaluation will be used to assess needs, assets and problems within the Title I: Needs Improvement schools receiving SIGs. While the Transformation model was adopted for each of these schools, the contextual issues inherent to each school vary to some degree. For instance, schools with a high proportion of American Indian students experience different issues than schools with a high proportion of Hispanic students. The impact of context on the implementation of the Transformation model can be examined during this stage of the evaluation. Likewise, addressing the context of each school is essential for providing important information for the other elements of the CIPP model. An extensive review of documentation related to each school’s application for school improvement funds will be conducted to identify if a particular area of need should be a focus of the evaluation in each school. Structured interview data will be collected from key stakeholders on a biannual basis to supplement the document review. This data will be used in a formative manner to provide feedback to key stakeholders.
The input evaluation will be used to assess the key components of the Transformation model within each school. Various types of data will be collected from stakeholders. Brief, electronic surveys will be administered to select staff members within each school to determine their perception of the various strategies implemented as part of the Transformation model. Staff members will also be asked to participate in focus
groups gauging their experiences implementing different elements of the Transformation model.
The process evaluation will monitor, document, and assess the activities implemented in each school through the Transformation model. This will require an evaluation team member to monitor and observe implementation of model based activities on a regular basis. This individual will work closely with key school staff members to document these activities for the purposes of continuous improvement (i.e., formative feedback) and adherence to the Transformation model components. Structured interviews will be conducted with key personnel and program beneficiaries (i.e., teachers, students, parents) to gauge their perception of the implementation of the Transformation model. The evaluation team member engaged with the schools on a regular basis will also have the opportunity to begin collecting information which can be used to develop a means for measuring implementation fidelity.
The product evaluation will assess the impact of the transformation model on school, teacher and student level outcomes, particularly those directly related to academic achievement. The Nebraska SLDS will be used along with supplemental district level information to address questions related to teacher retention as well as student behavior, attendance, retention and graduation rates along with academic performance on the NeSA in select subject areas. In addition, district specific measures, such as the Northwest Evaluation Association’s (NWEA) Measures of Academic Progress (MAP), will be obtained either through the district.
School level indicator data will also be utilized within each element of the CIPP model. A number of indicators have been identified to monitor the effectiveness of the SIGs in recipient schools. Certain indicators are required to be reported by the LEA as outlined by the U.S. DoE (2012):
An LEA must monitor each Tier I and Tier II school that receives SIG funds to determine whether the school . . .
(1) . . . is meeting annual goals established by the LEA for student achievement on the State’s ESEA assessments in both reading/language arts and mathematics.
(2) . . . is making progress on the leading indicators described in the final requirements.
In addition to the required indicators, Table 4 identifies additional outcome indicators, many of which are currently collected in the Nebraska SLDS. These indicators will also be monitored longitudinally to track improvements in key areas related to SIG funding.
9
CONTEXT
Analysis of school demographics and assessment of achievement gaps by subgroups
Identification of program goals
Examination of stakeholder needs and assets
INPUT
*Which intervention the school used (i.e., turnaround, restart, school closure, or transformation)
Review of planned implementation procedures against evidence-based strategies
PROCESS
Review of LEA grant applications
Interviews with state, district, and school level administrators
Site observations
Teacher surveys
TABLE 4. Core Components and Outcome Indicators of the CIPP Evaluation Framework
The development of the “Accountability for a Quality Education System, Today and Tomorrow” (A QuESTT) framework will require the evaluation team to reconsider the selected indicators. The evaluation team will work collaboratively with NDE leadership and personnel to ensure the SIG evaluation framework, and identified outcome indicators, align with the core tenets of A QuESTT.
Methodology. A longitudinal mixed-methods quasi-experimental design will be utilized to determine the impact of the SIG funding on student outcomes. The inability to implement the gold standard randomized control trial necessitates the use of an innovative approach for creating a comparison group to most accurately gauge the impact of the Transformation model in Nebraska schools. The innovative approach chosen for this evaluation is the propensity score (PS) method (Rosenbaum & Rubin, 1983). The PS method is useful in studies where a treatment is not (or cannot) be randomly assigned, which is the case in this study where SIG schools are systematically chosen based on multiple factors. The PS method will be used to empirically identify a group of comparison schools which are as similar as possible (at baseline) to the Title
I: Needs Improvement schools which have received SIG funding. The group identified via the PS method will be included in futures analyses and compared to groups identified by NDE and the evaluation team to extend the baseline study included in this evaluation plan.
Data Analysis Plan. The relatively small number of schools awarded SIG funds limits the analyses that can be conducted at the school level to non-parametric statistical approaches. While non-parametric approaches provide meaningful information, a more powerful statistical method commonly employed in educational contexts is multi-level modeling (MLM; Snijders & Bosker, 1999). Also known as hierarchical linear modeling (HLM; Raudenbush & Bryk, 2002), this approach takes into account the nesting which naturally occurs in education settings. In the context of the Nebraska SIG evaluation plan, taking into consideration the nesting of students within schools will lead to a stronger understanding of the true impact of SIG funds on student outcomes. Student level data will be sought from districts and NDE in order for the MLM approach to be implemented.
PRODUCT
*Leading Indicators; number of minutes in school year, student participation rate on state assessments, dropout rate, student attendance rate, advanced coursework, discipline incidents, truants, teacher performance, teacher attendance rate.
AYP status and AYP targets met and missed
School improvement status
Percentage of students at or above each proficiency level on state assessments in reading/language arts and mathematics (e.g., Basic, Proficient, Advanced), by grade and by student subgroup.
*Average scale scores on state assessments in reading/language arts and in mathematics, by grade, for the ‘‘all students’’ group, for each achievement quartile, and for each subgroup.
Percentage of limited English proficient students who attain English language proficiency
Graduation rate and college enrollment rates
District specific measures (e.g. local formative assessments)*Required reporting metrics for all SIG schools
10
Reporting, Dissemination Plan and Timeline. The evaluation team will contribute reports and disseminate information consistent with the timeline provided in Table 5. A report will be provided to NDE for each element of the CIPP model. Corresponding to each report, a meeting will be held with NDE personnel to discuss the findings and determine the
appropriateness of disseminating information to other stakeholders (i.e., school and/or district personnel). These reports will be formative so it is essential for the evaluation team and NDE to discuss results in a timely manner. A final summative report and presentation will be provided to NDE and other key stakeholders at the conclusion of the evaluation.
ACTIVITIES DATES
ContextReview school documentation and SIG proposals Nov 14 – Dec 14Meet with NDE – finalize evaluation plan Nov 14Identify/interview key stakeholders Dec 14 – Feb 15Devise a system to monitor school environment Dec 14, Jan 15, Feb 15Prepare/deliver report on school environment Feb 15Engage key stakeholders in feedback workshop Feb 15
InputAssess SIG strategy against school needs Nov 14 – Dec 14 Assess SIG budget to meet school needs Nov 14 – Dec 14Assess SIG work plan/schedule Nov 14 – Dec 14Devise surveys, collect/analyze data from key stakeholders Dec 14 – Feb 15Prepare/deliver report on school environment Feb 2015Engage key stakeholders in feedback workshop Feb 2015
ProcessEngage evaluation team members to continuously monitor SIG implementation Nov 2014 – Mar 2015Collect data pertinent to SIG implementation Dec 2014 – Mar 2015Structured interviews with key stakeholders Dec 2014 – Mar 2015Prepare/deliver report on implementation of SIG Feb 2015 – April 2015Engage key stakeholders in feedback workshop Feb 2015 – April 2015Finalize measure of implementation fidelity Feb 2015 – April 2015
ProductIdentify and record groups served Nov 2014 – Feb 2015Obtain access to key data sources Nov 2014 – April 2015Conduct analyses of extant data sources April 2015 – July 2015Structured interviews/focus groups with key stakeholders Jan 2015 – Mar 2015Prepare/deliver impact evaluation report Aug 2015Engage key stakeholders in feedback workshop Aug 2015Prepare/deliver final summative report Aug 2015 – Oct 2015Present final summative report to key stakeholders Oct 2015
TABLE 5. Timeline for Evaluation Activities
11
School Name 2010-2011 2011-2012 2012-2013
Crawford Elementary School MET MET NOT MET
Santee High School NOT MET NOT MET NOT MET
Santee Elementary School NOT MET NOT MET NOT MET
Elliott Elementary School NOT MET NOT MET NOT MET
Madison Elementary School NOT MET MET NOT MET
Minatare Elementary School MET NOT MET NOT MET
Winnebago High School NOT MET NOT MET NOT MET
TABLE 6. Federal Accountability Rating by Year
BASELINE STUDYFor the baseline analyses, NDE provided the evaluation team with aggregated data collected through the Nebraska Student and Staff Record System (NSSRS) for the academic years, 2010-2011, 2011-2012, and 2012-2013. The following analyses serve as a foundation for the continued monitoring of student and school level outcomes. In particular the pilot analyses below use select leading indicators and academic outcomes as a model for showing the impact of SIG funding on student and school outcomes.
Baseline Evaluation Question. The baseline study will address the following evaluation question:
What impact does the SIG funding have on student outcomes in Title I: Needs Improvement schools which have received SIG funding?
Methodology. A longitudinal quasi-experimental design with pre-determined comparison groups was used in the baseline study. All Nebraska schools were included in the study with groupings based on Title I
and School Improvement status. The groups included: (1) Title I: Needs Improvement; (2) Title I: Not Needs Improvement; (3) Non-Title I: Needs Improvement; (4) Non-Title I: Not Needs Improvement; and (5) SIG Funded Schools.
Data Analytic Approach. Descriptive and non-parametric statistical analyses were used to address the baseline evaluation question. Specifically, the Kruskal-Wallis H test was used to test for group differences on NeSA Mathematics and Reading scores. This test was used as an alternative to traditional Analysis of Variance (ANOVA) techniques given the small number of schools receiving SIG funds.
Results. Tables 6 and 7 display AYP for SIG Cohort 1 schools over three academic years. For an in-depth description of how AYP determinations are made, please refer to the NDE document AYP guidance, diagrams, and instructions (NDE, 2013). In Table 7, “AYP Other” represents the state writing goal for elementary schools and state graduation rate goal for high schools.
12
2010 2011 2012 School -2011 -2012 -2013
Crawford MET MET NOT
Santee NOT NOT NOT
Santee NOT NOT NOT
Elliott MET NOT NOT
Madison MET MET NOT
Minatare MET NOT NOT
Winnebago NOT NOT MET
2010 2011 2012 -2011 -2012 -2013
MET MET MET
NOT NOT NOT
NOT NOT NOT
MET MET NOT
NOT MET NOT
MET MET NOT
NOT NOT NOT
2010 2011 2012 -2011 -2012 -2013
MET MET MET
MET * *
MET MET MET
MET MET MET
MET MET MET
MET MET MET
MET MET MET
2010 2011 2012 -2011 -2012 -2013
MET MET *
* * *
* * *
MET MET MET
MET MET MET
MET MET MET
* NOT MET
TABLE 7. Student Performance Rating by Year
TABLE 8. Attendance Rate and Discipline Incidents by Year
AYP Math AYP Reading AYP AYP Performance Performance Participation Other
Attendance Rate Number of Discipline Incidents
*Data has been masked to protect the identity of students using one the following criteria:
• Fewer than 10 students were reported in a group. Fewer than 5 students were reported at a performance level.
• All students were reported in a single group or performance category.
*Data has been masked to protect the identity of students using one the following criteria:
• Fewer than 10 students were reported in a group. Fewer than 5 students were reported at a performance level.
• All students were reported in a single group or performance category.
Table 8 displays the attendance rate and number of discipline incidents for SIG Cohort 1 schools. The attendance rate shows the ratio of the total number of days students are actually in school compared to the number of days they could have been in school. The
number of discipline incidents is calculated by adding together the number of suspensions and expulsions reported for the school through the Nebraska Department of Education’s Consolidated Data Collection (CDC) system.
School Name 2010-2011 2011-2012 2012-2013 2010-2011 2011-2012 2012-2013
Crawford Elementary School 95.7% 95.8% 95.4% * * *Santee High School 85.9% 81.9% 79.3% * * 16Santee Elementary School 88.9% 90.2% 89.0% * 29 24Elliott Elementary School 94.1% 94.7% 94.4% 30 55 68Madison Elementary School 95.7% 96.1% 95.2% * * *Minatare Elementary School 96.6% 94.0% 95.8% * * *Winnebago High School 91.7% 90.6% 91.1% 11 * 11
*Data has been masked to protect the identity of students using one the following criteria:
• Fewer than 10 students were reported in a group. Fewer than 5 students were reported at a performance level.
• All students were reported in a single group or performance category.
Table 9 displays the four-year cohort graduation rates and dropout rates for SIG Cohort 1 high schools. The Cohort Four-Year Graduation Rate is calculated by dividing the number of students in a cohort who graduate with a regular high school diploma in four years or less by the number of students in the
Tables 10 through 15 and Figures 1 and 2 compare SIG Cohort 1 schools to aggregated groups of schools based on Title I eligibility and School Improvement status. Because these classifications can vary from year to year, the schools’ status in the baseline year of 2010-2011 were used to assign them to the same group for all data years. This allows for a longitudinal examination of the outcome indicators. Schools that opened, closed or underwent a merger during the three data years presented are not included in the analyses. The number of schools that comprise each comparison group is
Graduation Cohort, including students who graduate in the summer of the Expected Graduation Year (NDE, 2013). A district dropout rate is calculated by dividing the total number of 7th-12th grade students who dropped out by the official fall enrollment for grades 7-12 (NDE, 2013).
provided in Table 10. Please note that the sample size for the SIG Funded Schools group is considerably smaller than the other comparison groups. To address this consideration, a nonparametric statistical approach was used for each comparison to determine if differences between the means of a specific group and the means of the SIG Funded group were significantly different. Significant mean differences are indicated with an asterisk and suggest that the there is less than a 5 percent probability that the observed differences are due to chance.
School Name 2010-2011 2011-2012 2012-2013 2010-2011 2011-2012 2012-2013
Santee High School * * * * * * Winnebago High School 88.9% 90.2% 89.0% * * *
Comparison Group Number of Schools
Title 1: Needs Improvement 77Title 1: Not Needs Improvement 401Non-Title 1: Needs Improvement 55Non-Title 1: Not Needs Improvement 380SIG Funded Schools 7
14
TABLE 11. NeSA Math and NeSA Reading Proficiency by Year (All Grades)
TABLE 12. NeSA Math and NeSA Reading Proficiency by year (GRADE 03)
TABLE 14. NeSA Math and NeSA Reading Proficiency by year (GRADE 05)
TABLE 13. NeSA Math and NeSA Reading Proficiency by year (GRADE 04)
TABLE 15. NeSA Math and NeSA Reading Proficiency by year (GRADE 11)
* Indicates group mean is significantly different than SIG Funded group mean at p = 0.05 level.
16
DISCUSSION
The baseline study provides a precursor to future comparisons designed to assess the impact SIG funding has on various student outcomes. Superficially, there is little change observed over time in the indicators with SIG funded schools performing below the comparison groups on most outcomes. These results, however, do little to inform the impact SIGs have on school (or student) outcomes. Two important and necessary components of an impact evaluation are an appropriate experimental or quasi-experimental design preceded by an implementation evaluation providing evidence of sufficient implementation fidelity. The CIPP evaluation framework, outlined above, contains both of these components and can be utilized to determine the impact of SIG funding on recipient schools. The baseline analyses are limited by the small number of SIG Funded Schools and the non-parametric approach. Full implementation of the evaluation plan put forth in this document will provide a rigorous evaluation suitable for identifying the impact of SIGs.
SUMMARYFew evaluation studies have been adequately designed to address the impact of SIGs on student achievement and other important academic outcomes. The SIGs have the potential to positively impact a number of school and student level outcomes but more rigorous evaluation efforts are needed to further inform those interested in the impact of SIGs. This is especially the case in Nebraska, where the majority of schools receiving SIG funds are located in rural communities with ethnically diverse populations. Such situations create unique challenges for evaluation studies and, more importantly, the implementation of strategies the SIGs require. The evaluation plan put forth in this document overcomes many of these challenges through the use of rigorous mixed methodologies. For instance, important contextual effects can be examined in the initial stages of the evaluation. These contextual effects can be used to further inform the later stages of the evaluation, particularly those related to implementation and impact. Tying together the implementation and impact pieces of the evaluation is essential for realizing the full impact SIG funding can have on schools and students with the greatest need for a quality educational environment.
17
REFERENCESCalifornia Department of Education. (2014). School improvement grant (SIG).
Retrieved from http://www.cde.ca.gov/sp/sw/t1/sig09.asp
Coscarella, M., Bojorquez, J. C., Rice, J., Hipps, J., & Li, J. (2012). Evaluation of michigan’s 1003 (g) school improvement grants. Retrieved from http://www.wested.org/resources/evaluation-of-michigans-1003g-school-improvement-grants-implementation-trends-in-the-first-year/
Herman, R., Dawson, P., Dee, T., Greene, J., Maynard, R., Redding, S., & Darwin, M. (2008). Turning around chronically low-performing schools. IES Practice Guide. NCEE 2008-4020. National Center for Education Evaluation and Regional Assistance.
Hurlburt, S., Therriault, S. B., & Le Floch, K. C. (2012). School improvement grants: Analyses of state applications and eligible and awarded schools. National Center for Education Evaluation and Regional Assistance.
Isernhagen, J.C. & Florendo, J. (2013, October). Engaging and purposeful growth: Educator perceptions of progress toward successful school improvement. Nebraska Statewide Title I Accountability Research Project. Nebraska Department of Education.
Isernhagen, J.C. & Florendo, J. (2012, October). Bridging the gap to improve teaching and learning. Nebraska Statewide Title I Accountability Research Project. Nebraska Department of Education.
Isernhagen, J.C. & Florendo, J. (2011, October). Transforming schools to improve student learning. Nebraska Statewide Title I Accountability Research Project. Nebraska Department of Education.
Isernhagen, J.C. (2010, October). Developing a clear focus on school improvement. Nebraska Statewide Title I Accountability Research Project. Nebraska Department of Education.
McMurrer, J. & McIntosh, S. (2012). State implementation and perceptions of title I school improvement grants under the recovery act: one year later. Retrieved from http://www.cep-dc.org/displayDocument.cfm?DocumentID=398
Nebraska Department of Education. (2013). AYP guidance, diagrams, and instructions. Retrieved from http://www.education.ne.gov/federalprograms/Title_1_Part_A_SIG.html#SIG
O’Brien, E. & Dervarics, C.J. (2013). Which way is up? What research says about school Turnaround strategies. Retrieved from http://www.centerforpubliceducation.org/Main-Menu/Policies/Which-Way-Up-At-a-glance#sthash.mdKvJmTs.dpuf
Raudenbush, S. W., & Bryk, A. S. (2002). Hierarchical linear models: Applications and data analysis methods (2nd edition). London, England: Sage.
Rosenbaum, P.R. & Rubin, D. The central role of the propensity score in observational studies of causal effects. Biometrika. 1983;70:41–55
Snijders, T., & Bosker, R. (1999). Multilevel analysis: An introduction to basic and advanced multilevel modeling. London, England: Sage.
Stufflebeam, D. L. (2003). The CIPP model for evaluation. In D. L. Stufflebeam, & T. Kellaghan, (Eds.), The international handbook of educational evaluation (Chapter 2). Boston: Kluwer Academic Publishers.
U.S. Department of Education. (2011). Baseline analyses of SIG applications and SIG-eligible and SIG-awarded schools. Retrieved from http://ies.ed.gov/ncee/pubs/20114019/exhibits/exhibit_18.asp .
U.S. Department of Education. (2012, March 1). Guidance on fiscal year 2010 school improvement grants under section 1003(g) of the Elementary and Secondary Education Act of 1965. Retrieved from http://www2.ed.gov/programs/sif/legislation.html.