92
DRAFT 1 2 UNEP/SETAC Life Cycle Initiative - 3 Flagship Project 3a (Phase 2) 4 5 Hotspots Analysis: 6 an Overarching Methodological Framework 7 Date: 11 October 2016 8 9
DRAFT 1
2
UNEP/SETAC Life Cycle Initiative - 3
Flagship Project 3a (Phase 2) 4
5
Hotspots Analysis: 6
an Overarching Methodological Framework 7
Date: 11 October 2016 8
9

Hotspots Analysis - Overarching Methodological Framework
2
Insert Copyright and Disclaimer 1
2
Hotspots Analysis - Overarching Methodological Framework
3
List of tables and figures 1
2
Figure 1 Application of Hotspots analysis: different data sources and example study outputs .. 13 3
Figure 2 UN Sustainable Development Goals ............................................................................... 15 4
Figure 3 Methodological Framework process steps ..................................................................... 20 5
Figure 4 Defining, clarifying and soliciting agreement of the goal and scope ............................. 21 6
Figure 5 Example System Boundary Diagram – Product category level ....................................... 23 7
Figure 6 Example System Boundary Diagram – Sector level ........................................................ 24 8
Figure 7 common sources of data or information used in hotspots analysis .............................. 28 9
Figure 8 Options for identifying hotspots ..................................................................................... 39 10
Figure 9 Moving From a long list of actions to a short list through participation ........................ 45 11
Figure 10 Correlation between back fat and weight .................................................................... 51 12
Figure 11 Example System Boundary Diagram – Sector activity level ......................................... 60 13
Figure 12 Key elements of the stakeholder engagement process undertaken by AHAM ........... 65 14
Figure 13 What should be measured and against which impact ................................................. 66 15
Figure 14 AHAM’s process for the identification and validation of hotspots .............................. 69 16
Figure 15 The certificate of compliance ....................................................................................... 73 17
Figure 16 Example System Boundary Diagram – Product category level..................................... 75 18
Figure 17. Overview of TSC's development process ..................................................................... 77 19
Figure 18. TSC Source Quality Matrix is used to assign each publication a quality value for use in 20
later decisions............................................................................................................... 79 21
Figure 19. TSC’s Impact Classification is based on a number of sources including the UNEP/SETC 22
Guidelines for Social Life Cycle Assessment of Products ............................................. 80 23
Figure 20 Summary of Findings of the shortlisted HSA Methodologies: ..................................... 89 24
25
Table 1 The split of life cycle stages in 3 different approaches .................................................... 34 26
Table 2 Sustainability issues covered in the APGA on-line survey ............................................... 36 27
Table 3 Validating and prioritizing hotspots ................................................................................. 70 28
29
30

Hotspots Analysis - Overarching Methodological Framework
4
Table of Contents 1
List of tables and figures ................................................................................................................. 3 2
Glossary of terms ............................................................................................................................ 7 3
Executive summary ......................................................................................................................... 9 4
Introduction .................................................................................................................................. 11 5
About the project / study: ......................................................................................................... 11 6
Project Objective: ...................................................................................................................... 11 7
Background and context to hotspots analysis .............................................................................. 12 8
About Hotspots Analysis: .......................................................................................................... 12 9
Distinctions between Hotspots Analysis and Life Cycle Assessment: ....................................... 12 10
Benefits of Hotspots Analysis: ................................................................................................... 13 11
Audience for this Methodological Framework ............................................................................. 13 12
Related techniques and tools for assessment .............................................................................. 14 13
Sustainable Development Goals ............................................................................................... 14 14
Life Cycle Thinking ..................................................................................................................... 16 15
Life Cycle Approaches (e.g. LCA, LCM, Footprinting, Whole Life Costing) ................................ 16 16
Input Output Analysis ................................................................................................................ 17 17
Principles ....................................................................................................................................... 18 18
Hotspots Analysis – Overarching Methodological Framework – General Step-by-step process . 19 19
STEP 1 Define, clarify and solicit agreement of the goal and scope ......................................... 20 20
Why? ...................................................................................................................................... 21 21
What? .................................................................................................................................... 22 22
How? ...................................................................................................................................... 26 23
Who? ...................................................................................................................................... 28 24
Where? .................................................................................................................................. 31 25
When? .................................................................................................................................... 32 26
STEP 2 Gather data, seek expert insight, knowledge building and analysis ............................. 33 27
STEP 3 Identify and validate Hotspots ...................................................................................... 38 28
STEP 4 Responding to data and stakeholder gaps .................................................................... 41 29
STEP 5 Identify and prioritize actions ........................................................................................ 43 30
Hotspots Analysis - Overarching Methodological Framework
5
STEP 6 Review initial findings .................................................................................................... 47 1
STEP 7 Presentation and communication ................................................................................. 49 2
STEP 8 Revisit hotspots and actions identified ......................................................................... 52 3
Hotspot Applications and Limitations ....................................................................................... 55 4
Summary of Stages in Hotspots Analysis .................................................................................. 56 5
Sector Level Supplementary Guidance (Module 3) ...................................................................... 59 6
STEP 1 Define, clarify and solicit agreement of the goal and scope ......................................... 59 7
STEP 2 Gather data, seek expert insight, knowledge building and analysis ............................. 60 8
STEP 4 Responding to data and stakeholder gaps .................................................................... 61 9
STEP 5 Identify and prioritize actions ........................................................................................ 61 10
AHAM Sector Case Study .......................................................................................................... 62 11
Step 1: Define, clarify and solicit agreement of the goal and scope ........................................ 62 12
Why? ...................................................................................................................................... 62 13
Who? ...................................................................................................................................... 63 14
What? .................................................................................................................................... 65 15
How? ...................................................................................................................................... 67 16
Where? .................................................................................................................................. 68 17
When? .................................................................................................................................... 68 18
Step 2: Gather data, seek expert insight, knowledge building and analysis............................. 68 19
Step 3: Identify and Validate Hotspots ..................................................................................... 69 20
Step 4: Responding to data and stakeholder gaps .................................................................... 71 21
Step 5: Identify and prioritize actions ....................................................................................... 72 22
Step 6: Review initial findings ................................................................................................... 72 23
Step 7: Presentation and communication................................................................................. 73 24
Step 8: Revisit hotspots and actions identified ......................................................................... 74 25
Product Level Supplementary Guidance (Module 4) .................................................................... 75 26
STEP 1 Define, clarify and solicit agreement of the goal and scope ......................................... 75 27
STEP 2 Gather data, seek expert insight, knowledge building and analysis ............................. 75 28
STEP 5 Identify and prioritize actions ........................................................................................ 76 29
Hotspots Analysis - Overarching Methodological Framework
6
The Sustainability Consortium Product Case Study .................................................................. 77 1
1. Define the product category (UNEP-SETAC Stage 1) ......................................................... 78 2
2. Review scientific sources (UNEP-SETAC Stage 2) .............................................................. 78 3
3. Research hotspots and 5. Evaluate the evidence (UNEP-SETAC Stages 3 & 4) ................. 80 4
4. Research improvement Opportunities (UNEP-SETAC Stage 5) ......................................... 81 5
6. Key Performance Indicators .............................................................................................. 81 6
7. Multi-Stakeholder Review (UNEP-SETAC Stage 6) ............................................................ 81 7
8. Publish the Toolkit (UNEP-SETAC Stage 7) ........................................................................ 81 8
9. Update and Revise the Toolkit (UNEP-SETAC Stage 8) ...................................................... 81 9
References ................................................................................................................................. 82 10
ANNEXES.................................................................................................................................... 82 11
Annex 1a: List of workshops and webinars organized by the Project Group ....................... 82 12
Annex 1b: List of stakeholders involved through interaction ............................................... 82 13
Annex 2 Methodology used for the Phase 1 study: .............................................................. 83 14
15
16
Hotspots Analysis - Overarching Methodological Framework
7
Glossary of terms 1
2
Characterisation model A model which describes the relationship between individual data 3
points sometimes referred to as “inventory data” (e.g. consumption of resources, emissions, 4
wastes, employment data, economic costs) and an impact or indicator (e.g. climate change, 5
biodiversity, staff training and education, households in poverty). The characterisation model 6
yields characterisation factors that are used as multiplication factors to convert inventory data 7
to a single indicator result. 8
Data Quality Characteristics of data such as age, technological, geographical and temporal 9
representativeness, specificity and comprehensiveness that determine their ability to satisfy 10
stated requirements 11
Functional Unit A measure of the function of the studied system to which inputs and outputs 12
can be related 13
Hotspot A life cycle stage, process or elementary flow which accounts for a significant 14
proportion of the impact of the functional unit. 15
Hotspots Analysis: The rapid assimilation and analysis of a range of information sources, 16
including life cycle based studies, market, and scientific research, expert opinion and 17
stakeholder concerns. The outputs from this analysis can then be used to identify and prioritise 18
potential actions around the most significant economic, environmental and social sustainability 19
impacts or benefits associated with a specific country, city, industry sector, organization, 20
product portfolio, product category or individual product or service. Hotspots analysis is often 21
used as a pre-cursor to developing more detailed or granular sustainability information. 22
Life Cycle Assessment Life Cycle Assessment (LCA) is a tool for the systematic evaluation of the 23
environmental aspects of a product or service system through all stages of its life cycle. 24
Life Cycle Thinking Life Cycle Thinking (LCT) is about going beyond the traditional focus on 25
production site and manufacturing processes to include environmental, social and economic 26
impacts of a product over its entire life cycle. 27
Methodological Framework A Methodological Framework outlines key steps that are common 28
to hotspots analysis at any scale of application (including but not limited to national, city, 29
sectoral, product category, product specific). This framework is aimed at embedding a certain 30
level of consistency of approach to hotspots analysis, despite its application. This framework is 31
also meant to be the basis for more specific guidance that will be developed for various levels 32
of application. 33
Hotspots Analysis - Overarching Methodological Framework
8
Normalisation The process by which impact assessment results are multiplied by factors that 1
represent the overall impact per reference unit (e.g. a country, an average citizen). Normalised 2
results express the relative shares of the impact(s) of the hotspots analysis in terms of the total 3
contributions to each impact category per reference unit. 4
Sensitivity analysis: a technique to determine how different values of an independent variable 5
influence the results of a hotspots analysis. This can be used to provide an assessment of 6
confidence in the results, in this case that a hotspot has / has not been identified. 7
Shall, should and may This Guidance uses precise terminology and distinguishes between 8
requirements and recommendations, (i.e., between the words ‘shall’,‘should’ and ‘may’). 9
Terminology is based on ISO/TS 14072 and ISO 14044/ISO 14040, in that order. ‘Shall’ is only 10
used when this strength of obligation is also required in the aforementioned standard 11
documents, while ‘should’ is used to identify recommended elements that can be disregarded 12
with proper justification. Finally, ‘may’ is used for other allowed elements or alternatives.” 13
Stakeholders: The term stakeholders covers anyone who has a direct or indirect interest in the 14
project or organization in question as they can affect or are affected by the activities that take 15
place. Stakeholders include, amongst others, employees, customers, suppliers, communities, 16
shareholders, governmental and non-governmental organizations. 17
Uncertainty Analysis A systematic procedure to quantify the uncertainty introduced in the 18
results of a life cycle inventory analysis due to the cumulative effects of model imprecision, 19
input uncertainty and data variability (ISO14040:2006) 20
21

Hotspots Analysis - Overarching Methodological Framework
9
Executive summary 1
The information-age has led to a proliferation of content, ranging from the assimilation and 2
analytical challenges associated with 'big data' through to ever-increasing publication lists of 3
research and innovation findings. The major challenge for businesses, policy-makers, academic 4
researchers and consumers is deciding where and how to act to have the maximum impact. For 5
any action a balance must be struck between speed of response and pragmatism and the need 6
to be informed by reliable and trustworthy science-based evidence. 7
A growing number of different analytical disciplines, including Life Cycle Assessment, are using 8
a prioritisation method called 'hotspotting' or ‘hotspots analysis’. It is being used to filter and 9
distil often-large volumes of information to identify and prioritise hotspots for further 10
investigation or action by industry, governments and other stakeholders. This may include 11
piloting or implementing actions on the basis of the findings from the hotspot analysis. 12
There is a rapidly growing number of examples globally of how hotspots analysis is being used 13
to address significant sustainability challenges by helping to provide focus in an era of 14
information overload. Case studies are provided in this document. 15
The benefits of hotspots analysis include ensuring: 16
Focus on priority issues (e.g., waste, water, materials of concern) 17
Focus on the right life cycle stage (e.g., material acquisition, manufacturing, 18 use, end of life) 19
Focus on the right actors (e.g. producers, manufactures, suppliers, retailers, 20 customers) to evaluate, influence and implement solutions 21
Implications of trade-offs are understood 22
Resources (e.g. time, money) can be effectively allocated to actions. 23 24
However, there is not currently a common global approach to hotspots analysis; nor has there 25
been any effort to bring together or share best practice amongst those organisations or 26
initiatives currently developing and using these methods. Nor is there any accepted guidance 27
on how to translate and apply the results of hotspots analysis into meaningful sustainability 28
information and insight for use by industry, governments and other stakeholders. 29
Recognising that this situation may result in a range of negative impacts, including a lack of 30
consistency in methodological approach, difficulties in comparing the results of hotspots 31
studies and the potential for conflicting sustainability information in the marketplace; the UNEP 32
SETAC Life Cycle Initiative established a new Flagship Project to address these and other issues. 33
The objectives of this Flagship Project is to produce: 34
Hotspots Analysis - Overarching Methodological Framework
10
1. A common methodological framework and global guidance for sustainability hotspots 1 analysis; 2
2. A protocol for the appropriate use and communication of sustainability information 3 derived from hotspots analysis; and, 4
3. To evaluate and, if possible, implement a range of options to bring together the findings 5 from existing hotspots studies to provide a richer, global picture of sustainability 6 hotspots in the economy and society. 7
8
This document has been drafted in response to the first of these objectives. It is presented as a 9
document for discussion and review during the consultation phase of the project. 10
Contributions on all aspects of the document are warmly welcomed. 11
The specific directions given for different situations (e.g. assessment of hotspots for products, 12
sectors) underscore that there is no ‘one-size-fits-all’ application of hotspot analysis. However, 13
there are principles that are equally applicable to a range of situations. 14
15
Hotspots Analysis - Overarching Methodological Framework
11
Introduction 1
About the project / study: 2
This second phase of the UNEP/SETAC Life Cycle Initiative Flagship Project 3a - ‘Hotspots 3
Analysis and Sustainability Information’, supported through the International Climate Initiative 4
(IKI), seeks to develop a flexible methodological framework for product and sector level 5
hotspots analysis, to support 10YFP stakeholders in their prioritization efforts to accelerate a 6
shift towards Sustainable Consumption and Production. It builds on the first phase of the 7
project1 in which global hotspots analysis methodologies were mapped and analysed to identify 8
and understand their commonalities and differences and their applicability at three different 9
scales of application: national, sector and product category-level. Ultimately the outcome of 10
this study will be used to produce: 11
A common methodological framework and global guidance for sustainability hotspots 12 analysis; 13
A protocol (guidance) for the appropriate use and communication of sustainability 14 information derived from hotspots analysis; and 15
To evaluate and, if possible, implement a range of options to bring together the findings 16 from existing hotspots studies to provide a richer, global picture of sustainability 17 hotspots in the economy and society. 18
19
Project Objective: 20
Phase 1 of the project, which occurred between May and December 2014, involved the 21
identification and mapping of existing hotspots studies, initiatives, methodologies and tools 22
from around the world. 23
Phase 2 of the project, which began in March 2016, builds on the research undertaken during 24
Phase 1 and seeks to create an overarching methodological framework for hotspots analysis 25
with more detailed guidance on how to conduct sector and product category hotspots analysis; 26
and on the appropriate use and communication of sustainability information derived from 27
these two levels of application. It should also be noted that Phase 2 started with an assessment 28
of a further six hotspots analysis methodologies that came to light after Phase 1 was 29
completed. 30
1 http://www.lifecycleinitiative.org/wp-content/uploads/2014/12/UNEP-Hotspots-Mapping-Project-Final-Report-
Phase-1.pdf
Hotspots Analysis - Overarching Methodological Framework
12
Background and context to hotspots analysis 1
About Hotspots Analysis: 2
Hotspots analysis allows for the rapid assimilation and analysis of a range of information 3
sources, including life cycle based studies, market, and scientific research, expert opinion and 4
stakeholder concerns. The outputs from this analysis can then be used to identify potential 5
solutions and prioritize actions around the most significant economic, environmental, 6
governance, ethical and social sustainability impacts or benefits associated with a specific 7
country, industry sector, organization, product portfolio, product category or individual product 8
or service. Hotspots analysis is often used as a pre-cursor to developing more detailed 9
sustainability information. 10
Distinctions between Hotspots Analysis and Life Cycle Assessment: 11
A key aspect is that hotspots analysis is action-oriented. Unlike Life Cycle Assessment, it may 12
not require detailed understanding of all life cycle stages. Hotspots Analysis is not a tool for 13
comparison of products, sectors, cities or other issues. Rather, it is designed to help identify 14
and prioritise actions based on their potential impact. Communications are likely to focus on 15
how issues are being addressed rather than the magnitude of an environmental footprint. 16
Hotspots Analysis can incorporate qualitative as well as quantitative information to identify 17
issues and prioritise action, therefore allowing it to be used for issues which cannot readily be 18
incorporated into Life Cycle Assessment (e.g. noise, biodiversity, ethical issues). 19
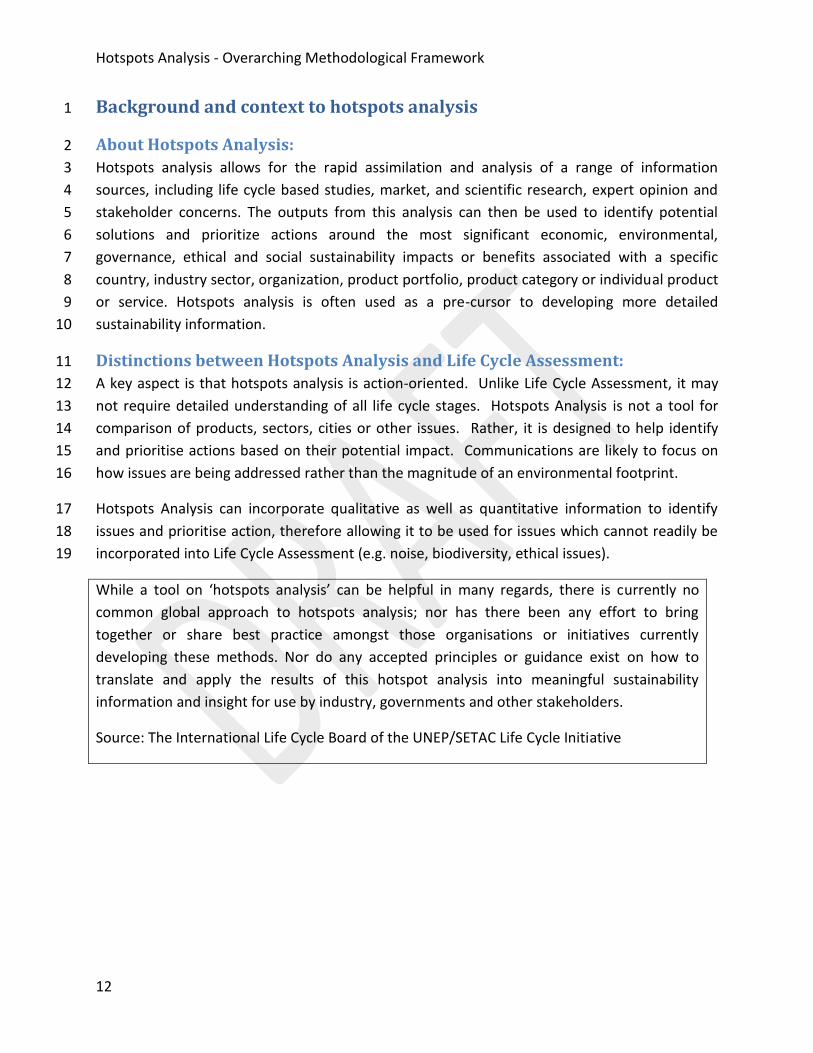
While a tool on ‘hotspots analysis’ can be helpful in many regards, there is currently no
common global approach to hotspots analysis; nor has there been any effort to bring
together or share best practice amongst those organisations or initiatives currently
developing these methods. Nor do any accepted principles or guidance exist on how to
translate and apply the results of this hotspot analysis into meaningful sustainability
information and insight for use by industry, governments and other stakeholders.
Source: The International Life Cycle Board of the UNEP/SETAC Life Cycle Initiative
Hotspots Analysis - Overarching Methodological Framework
13
1
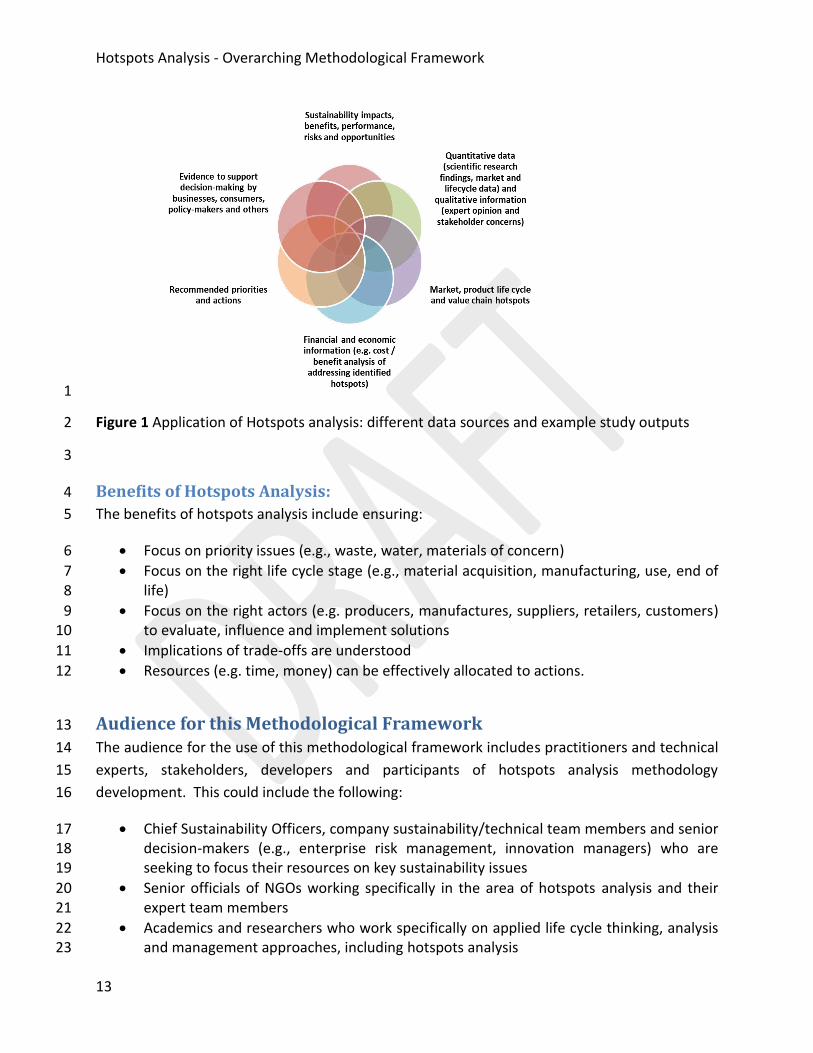
Figure 1 Application of Hotspots analysis: different data sources and example study outputs 2
3
Benefits of Hotspots Analysis: 4
The benefits of hotspots analysis include ensuring: 5
Focus on priority issues (e.g., waste, water, materials of concern) 6
Focus on the right life cycle stage (e.g., material acquisition, manufacturing, use, end of 7 life) 8
Focus on the right actors (e.g. producers, manufactures, suppliers, retailers, customers) 9 to evaluate, influence and implement solutions 10
Implications of trade-offs are understood 11
Resources (e.g. time, money) can be effectively allocated to actions. 12
Audience for this Methodological Framework 13
The audience for the use of this methodological framework includes practitioners and technical 14
experts, stakeholders, developers and participants of hotspots analysis methodology 15
development. This could include the following: 16
Chief Sustainability Officers, company sustainability/technical team members and senior 17 decision-makers (e.g., enterprise risk management, innovation managers) who are 18 seeking to focus their resources on key sustainability issues 19
Senior officials of NGOs working specifically in the area of hotspots analysis and their 20 expert team members 21
Academics and researchers who work specifically on applied life cycle thinking, analysis 22 and management approaches, including hotspots analysis 23
Hotspots Analysis - Overarching Methodological Framework
14
Policy-makers and government officials who are seeking to use hotspots analysis in 1 evidence-based policy development and implementation as a way of prioritising their 2 activities and resources 3
Civil society bodies, professional institutes and Industry trade associations who want to 4 use hotspots analysis to build consensus around an agreed set of priority hotspots and 5 the actions required to address them 6
Subject matter experts and consultants who want to use hotspots analysis to support 7 relevant stakeholders and clients 8
9
Skill Set: 10
The skill set of the users of this methodological framework would vary depending on their role 11
and type of expertise they bring to the hotspots analysis identification process. However, it is 12
expected that the users have: 13
Some familiarity with life cycle thinking and/or value chain thinking and methods; 14
A reasonable understanding of the quantitative and/or qualitative impacts relevant to 15 the scope of the hotspots analysis (for all or some of the life cycle or value chain 16 phases; key activities or processes relevant to the sector or product category in 17 question) 18
Some knowledge of some of the interventions being considered or taking place in 19 relation to the hotspots identified in the study, in order to help identify and prioritise 20 any interventions or actions to address the hotspots identified during the study; 21
Some experience of systems thinking and the ability to make linkages (lateral/holistic 22 thinking) 23
The ability to interpret and understand the findings from a hotspots analysis study and 24 use this information to make well-informed decisions about the actions to be taken 25
26
For those less familiar with these issues the Methodological Framework provides the 27
information, terminology and insights required to engage specialists or external experts as 28
appropriate. 29
Related techniques and tools for assessment 30
Sustainable Development Goals 31
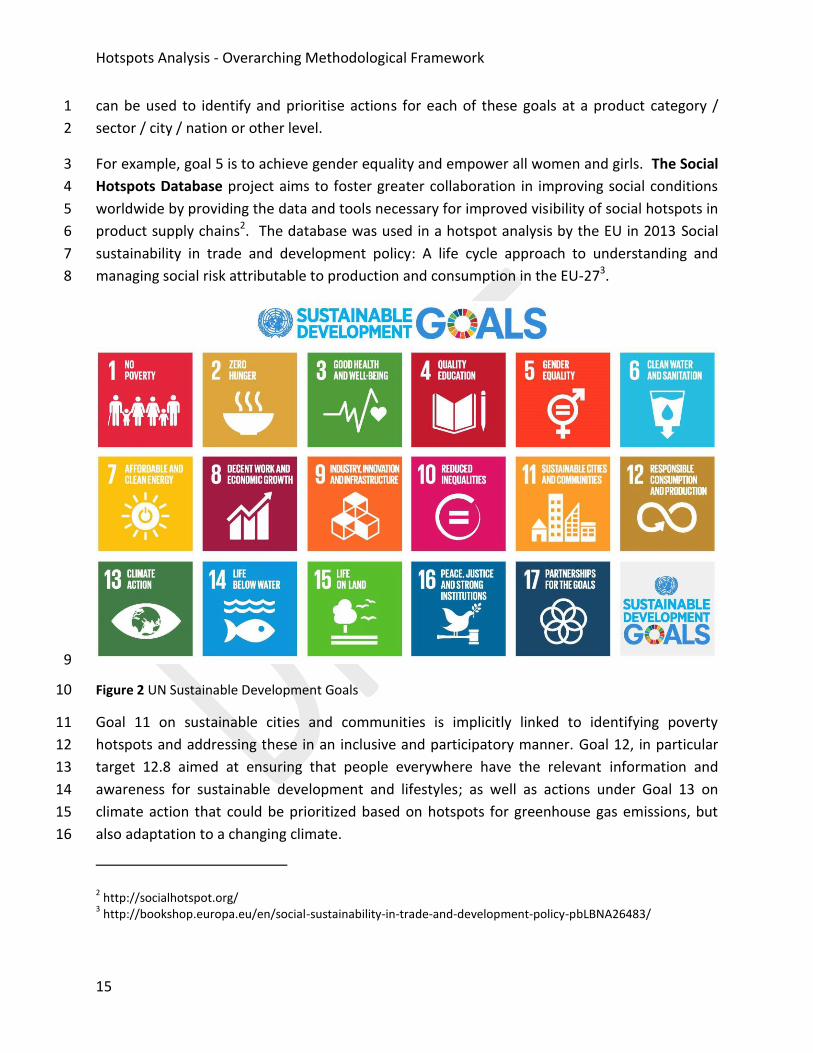
At the United Nations Sustainable Development Summit on 25th September 2015, world leaders 32
adopted the 2030 Agenda for Sustainable Development, which includes a set of 17 Sustainable 33
Development Goals (SDGs) with 169 supporting targets to end poverty, fight inequality and 34
injustice, and tackle climate change by 2030. These are shown in figure 2. Hotspots Analysis 35
Hotspots Analysis - Overarching Methodological Framework
15
can be used to identify and prioritise actions for each of these goals at a product category / 1
sector / city / nation or other level. 2
For example, goal 5 is to achieve gender equality and empower all women and girls. The Social 3
Hotspots Database project aims to foster greater collaboration in improving social conditions 4
worldwide by providing the data and tools necessary for improved visibility of social hotspots in 5
product supply chains2. The database was used in a hotspot analysis by the EU in 2013 Social 6
sustainability in trade and development policy: A life cycle approach to understanding and 7
managing social risk attributable to production and consumption in the EU-273. 8
9
Figure 2 UN Sustainable Development Goals 10
Goal 11 on sustainable cities and communities is implicitly linked to identifying poverty 11
hotspots and addressing these in an inclusive and participatory manner. Goal 12, in particular 12
target 12.8 aimed at ensuring that people everywhere have the relevant information and 13
awareness for sustainable development and lifestyles; as well as actions under Goal 13 on 14
climate action that could be prioritized based on hotspots for greenhouse gas emissions, but 15
also adaptation to a changing climate. 16
2 http://socialhotspot.org/
3 http://bookshop.europa.eu/en/social-sustainability-in-trade-and-development-policy-pbLBNA26483/

Hotspots Analysis - Overarching Methodological Framework
16
Life Cycle Thinking 1
The Life Cycle Initiative identifies Life Cycle Thinking as going beyond a site or process based 2
approach to consider the environmental, social and economic impacts of a product (or sector) 3
over its entire life cycle. 4
The main goals of Life Cycle Thinking are to reduce a sector’s or product’s resource use and 5
emissions to the environment as well as improve its socio-economic performance through its 6
life cycle. This may facilitate links between the economic, social and environmental dimensions 7
within a sector, an organization and through its entire value chain. 8
Life Cycle Thinking is a principle rather than a detailed methodological framework, and 9
Hotspots Analysis aligns with the principles of Life Cycle Thinking to consider impacts at a 10
number of different scales (e.g. product, sector, city and nation) and identify where the 11
greatest impacts and opportunities exist. 12
For further information please see: 13
UNEP/SETAC Life Cycle Initiative (2012) Greening The Economy Through Life Cycle Thinking4 14
Life Cycle Approaches (e.g. LCA, LCM, Footprinting, Whole Life Costing) 15
Life Cycle approaches encompass a wide range of methodologies and tools for the evaluation of 16
various stages of the life of a product or organization, from raw material acquisition to final 17
disposal. This covers simplified methodologies from qualitative screening tools via footprint 18
analysis (ISO 14046 and 14067), hotspots analysis; and finally detailed life cycle assessment 19
(LCA), such as environment or social LCA or life cycle (‘whole life’) costing, based on the ISO 20
standards of the ISO 14040 series and ISO 14072. 21
Life Cycle approaches can cover one or more impact categories (e.g. water use, climate change 22
and land use). The information may be used to support a range of activities, such as 23
Sustainable Public Procurement, Eco or Sustainable Design and Eco-labels (based on the ISO 24
14020 series of Standards). 25
Hotspots Analysis is a life cycle approach that can be used to identify the most significant 26
impacts at different scales of application (e.g., product category, sector, national levels, etc.). 27
The findings from hotspots analysis are used to identify impact improvement opportunities and 28
to prioritize impact reduction actions. 29
4 http://www.lifecycleinitiative.org/wp-content/uploads/2013/03/2012_LCI_10_years_28.3.13.pdf
Hotspots Analysis - Overarching Methodological Framework
17
For further information please see: 1
ISO standards on life cycle assessment 2
http://www.iso.org/iso/home/store/catalogue_tc/catalogue_tc_browse.htm?commid=54854 3
ISO standards on environmental labelling 4
http://www.iso.org/iso/home/store/catalogue_tc/catalogue_tc_browse.htm?commid=54836 5
Input Output Analysis 6
Input-output analysis allows for an understanding of the interconnection between different 7
sectors of an economy. The framework for modern input-output analysis was developed by 8
Wassily Leontief in the 1950s. Traditionally, input-output tables are constructed for national 9
economies to show the flow of money between sectors, from primary extraction to final 10
consumption. This is represented in a table that shows how the product of one industry is 11
consumed by a range of sectors (e.g. another industry, final consumption by households). Very 12
quickly, this approach was applied to environmental issues (Leontief 1970). 13
The international nature of production and consumption means that multi-regional input-14
output tables (MRIO) have become increasingly relevant in understanding the economic 15
impacts of production and consumption patterns. MRIO analysis is also used to analyse and 16
allocate environmental pressures caused by economic activities, an approach called 17
Environmentally Extended multi-regional input-output analysis (EE-MRIO) and can also be 18
applied to social issues. 19
EE-MRIO can be used to identify hotspots in production and consumption of specific products 20
at a national, regional, or multi-regional level. The phases in an EE-MRIO align well with life 21
cycle based approaches and as they cover an entire economy, they ensure that all 22
environmental pressures are allocated (i.e. there is no double counting or omission of shared 23
impacts). 24
For further information please see: 25
The Environmental Footprints Explorer (http://www.environmentalfootprints.org/) an open 26
access forum for multi-regional input-output (MRIO) data, focussing on environmental 27
footprints. 28
The One Planet Economy Network (OPEN:EU) (http://www.oneplaneteconomynetwork.org/), a 29
two year EU funded project to develop a set of EU consumption indicators and interactive 30
software tool 31
Hotspots Analysis - Overarching Methodological Framework
18
Leontief, W. 1970. Environmental Repercussions and the Economic Structure: An Input-Output 1
Approach. The Review of Economics and Statistics 52(3): 262-271. 2 http://www.jstor.org/stable/1926294 3
Principles 4
The design and application of the above “overarching” Methodological Framework for 5
conducting hotspots analysis shall be guided by the principles outlined below. 6
This Methodological framework shall provide guidance enabling hotspot analysis to be: 7
Usable: The emphasis of hotspots analysis is providing information that can be acted 8 upon. 9
Transparent: It must be clear what the purpose of the analysis is, what the data sources 10 are, how the analysis was undertaken and how the conclusions were reached. 11 Confidentiality requirements and any gaps in the evidence should be identified. 12
Suitably/appropriately robust: The analysis must be sufficiently robust to support the 13 decisions which will be made based upon it. 14
Inclusive: The analysis should ensure an open, participatory consultation with all 15 interested stakeholders at relevant phases and shall be responsive to stakeholders 16 needs (including cultural and geographical relevance; level of technical understanding 17 and ability to make decisions and take action) 18
Comprehensive: (range of metrics) covering all relevant aspects of the life cycle relevant 19 to the level of application (e.g., sector, product) for a range of indicators which may or 20 may not be considered in traditional LCA approaches (e.g. biodiversity, ethical concerns) 21
22
Whilst analysis of changes over time and updates to hotspots analyses shall be self-23
consistent, the methodological framework does not require consistency between studies 24
carried out by different organisations, as comparison is not one of the purposes of hotspots 25
analysis. 26
27
28
29
30
Hotspots Analysis - Overarching Methodological Framework
19
Hotspots Analysis – Overarching Methodological Framework – General 1
Step-by-step process 2
3
This Methodological Framework is illustrated in figure 3 below which outlines key steps that are 4
common to hotspots analysis at any scale of application (including but not limited to national, 5
city, sectoral, organisational, product category, product specific, etc.). It reinforces the fact that 6
the approach is in line with existing standards, which follow the Deming Cycle (Plan, Do, Check, 7
Act). It is important to note from the outset that hotspots analysis is an iterative approach. 8
Though steps naturally form a sequence, there will be a need to revisit steps in the process to 9
refine the analysis as it develops. 10
The Framework uses precise terminology and distinguishes between requirements and 11
recommendations, (i.e., between the words ‘shall’, ‘should’ and ‘may’). Terminology is based on 12
ISO/TS 14072 and ISO 14044/ISO 14040, in that order. ‘Shall’ is only used when this strength of 13
obligation is also required in the aforementioned standard documents, while ‘should’ is used to 14
identify recommended elements that can be disregarded with proper justification. Finally, ‘may’ 15
is used for other allowed elements or alternatives. As a framework, ‘may’ is used where options 16
are presented for completing each step. It forms the basis for more specific guidance that will 17
be developed for various levels of application. 18
Hotspots Analysis - Overarching Methodological Framework
20
1
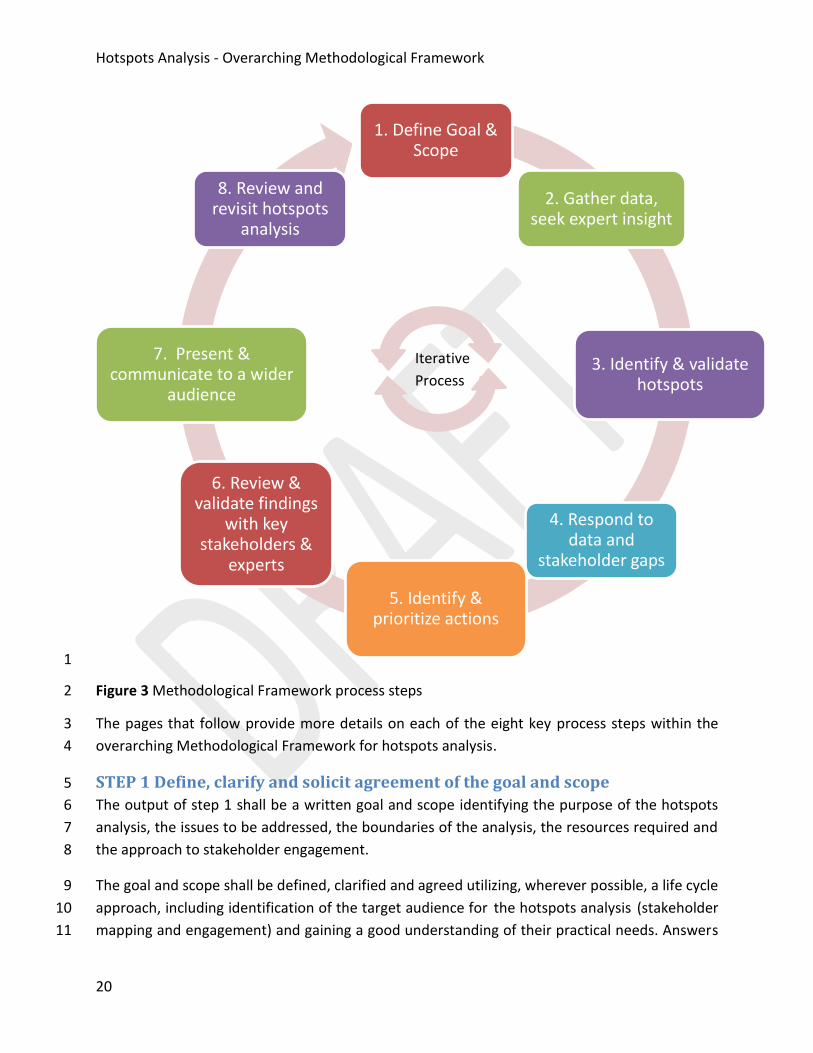
Figure 3 Methodological Framework process steps 2
The pages that follow provide more details on each of the eight key process steps within the 3
overarching Methodological Framework for hotspots analysis. 4
STEP 1 Define, clarify and solicit agreement of the goal and scope 5
The output of step 1 shall be a written goal and scope identifying the purpose of the hotspots 6
analysis, the issues to be addressed, the boundaries of the analysis, the resources required and 7
the approach to stakeholder engagement. 8
The goal and scope shall be defined, clarified and agreed utilizing, wherever possible, a life cycle 9
approach, including identification of the target audience for the hotspots analysis (stakeholder 10
mapping and engagement) and gaining a good understanding of their practical needs. Answers 11
1. Define Goal & Scope
2. Gather data, seek expert insight
3. Identify & validate hotspots
4. Respond to data and
stakeholder gaps
5. Identify & prioritize actions
6. Review & validate findings
with key stakeholders &
experts
7. Present & communicate to a wider
audience
8. Review and revisit hotspots
analysis
Iterative
Process

Hotspots Analysis - Overarching Methodological Framework
21
to the following questions shall be included within the recorded goal and scope. These should 1
be considered in an iterative, parallel manner rather than sequentially. 2
3
4
Figure 4 Defining, clarifying and soliciting agreement of the goal and scope 5
6
Why? 7
A clear goal and scope is required to ensure that from the outset all participants are clear on 8
the purpose of the hotspot analysis. Why is the study being undertaken? What is the intended 9
use and how will it be communicated to stakeholders? Do different stakeholders have different 10
information and communications needs? For example, does the goal include: making 11
subsequent improvements; informing product design; purchasing practices; road testing 12
solutions; providing the customer with guidance on how to use or dispose of a product 13
responsibly; developing a sector improvement roadmap or standard, or; helping to narrow the 14
scope of a more detailed subsequent study? 15
16
17
Goal and
Scope Why?
Who?
What? How?
Where?
When?
Hotspots Analysis - Overarching Methodological Framework
22
Case Study: Product Sustainability Forum WRAP works with the food and drink sector via Courtauld 2025, a voluntary agreement to cut the resources needed to provide our food and drink by one-fifth over ten years. Signatories and Governments of the UK have expressed a desire to reduce the environmental impact of products in the grocery sector. In order to better understand where the greatest impacts occurred the
Product Sustainability Forum, a collaboration of organisations made up of grocery retailers and suppliers, academics, NGOs and UK Government representatives, was established. In 2013 they published ‘An initial assessment of the environmental impact of grocery products’ This met the requirement to identify and prioritise products and life cycle stages which contributed the most to greenhouse gas emissions, energy consumption, water use and waste. A range of practical materials to help the sector implement changes were subsequently produced in response to these. Reference: http://www.wrap.org.uk/content/product-sustainability-forum
1
What? 2
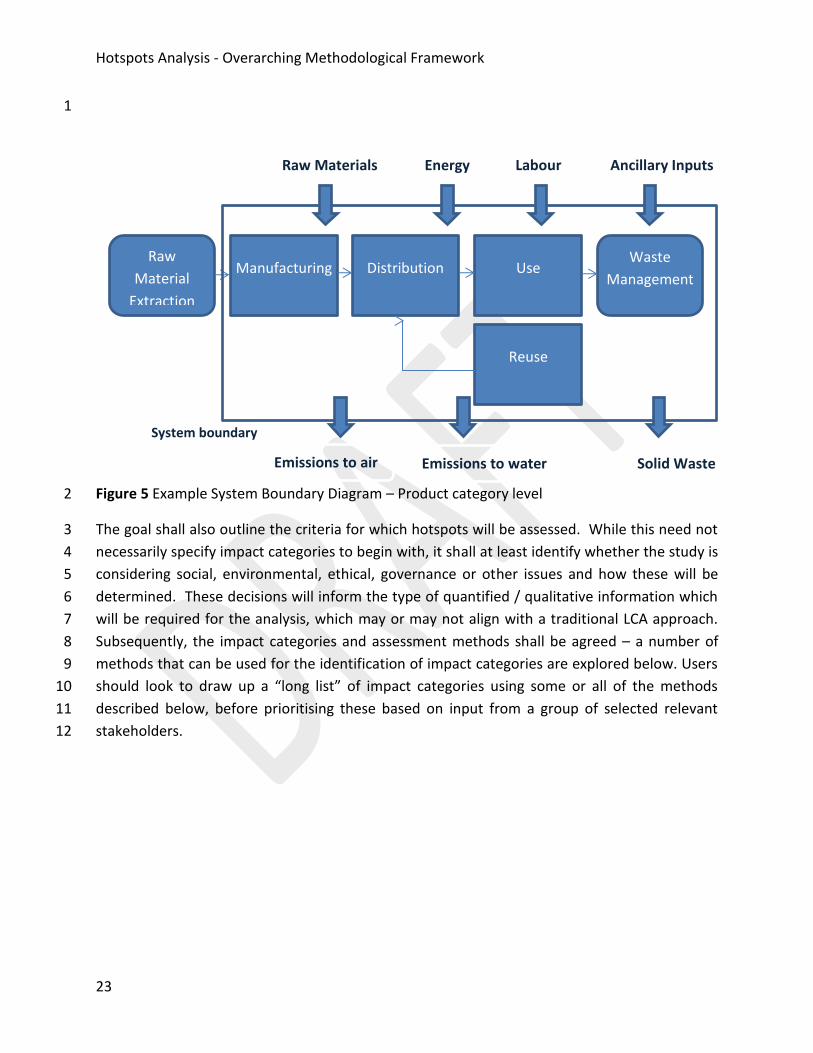
Having obtained the information, clarity is then required on the boundaries of the assessment. 3
Clear boundaries are essential to ensure that appropriate information is obtained and used 4
within the analysis, and a system boundary diagram should be included as a clear way of 5
communicating the boundaries. Example system boundary diagrams for the product and sector 6
level are provided in figure 5 and figure 6 respectively. 7
A life cycle approach should be taken where the hotspots analysis covers issues from raw 8
material acquisition to the impact of the final consumer. This is to ensure that hotspots are not 9
overlooked through omission. The level of analysis required will depend upon the goals of the 10
study. For example, is the goal to get an approximate understanding of where significant 11
impacts occur across the life cycle of a product, or to obtain accurate data specific to a 12
particular supply chain? Is it to identify the organisations with the greatest impact or ability to 13
affect change in a sector? 14
15
16
17
18
Hotspots Analysis - Overarching Methodological Framework
23
1
Figure 5 Example System Boundary Diagram – Product category level 2
The goal shall also outline the criteria for which hotspots will be assessed. While this need not 3
necessarily specify impact categories to begin with, it shall at least identify whether the study is 4
considering social, environmental, ethical, governance or other issues and how these will be 5
determined. These decisions will inform the type of quantified / qualitative information which 6
will be required for the analysis, which may or may not align with a traditional LCA approach. 7
Subsequently, the impact categories and assessment methods shall be agreed – a number of 8
methods that can be used for the identification of impact categories are explored below. Users 9
should look to draw up a “long list” of impact categories using some or all of the methods 10
described below, before prioritising these based on input from a group of selected relevant 11
stakeholders. 12
Raw
Material
Extraction
Manufacturing Distribution Use Waste
Management
Reuse
Raw Materials Energy Labour Ancillary Inputs
System boundary
Emissions to air Emissions to water Solid Waste
Hotspots Analysis - Overarching Methodological Framework
24
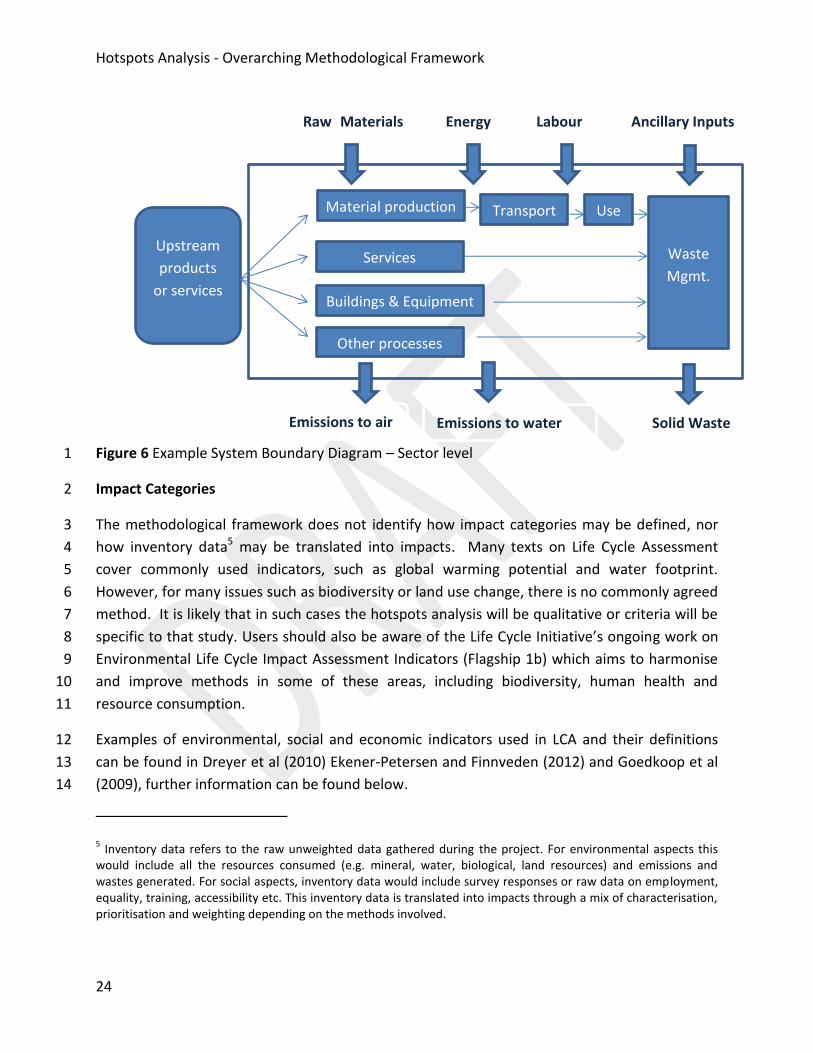
Figure 6 Example System Boundary Diagram – Sector level 1
Impact Categories 2
The methodological framework does not identify how impact categories may be defined, nor 3
how inventory data5 may be translated into impacts. Many texts on Life Cycle Assessment 4
cover commonly used indicators, such as global warming potential and water footprint. 5
However, for many issues such as biodiversity or land use change, there is no commonly agreed 6
method. It is likely that in such cases the hotspots analysis will be qualitative or criteria will be 7
specific to that study. Users should also be aware of the Life Cycle Initiative’s ongoing work on 8
Environmental Life Cycle Impact Assessment Indicators (Flagship 1b) which aims to harmonise 9
and improve methods in some of these areas, including biodiversity, human health and 10
resource consumption. 11
Examples of environmental, social and economic indicators used in LCA and their definitions 12
can be found in Dreyer et al (2010) Ekener-Petersen and Finnveden (2012) and Goedkoop et al 13
(2009), further information can be found below. 14
5 Inventory data refers to the raw unweighted data gathered during the project. For environmental aspects this
would include all the resources consumed (e.g. mineral, water, biological, land resources) and emissions and wastes generated. For social aspects, inventory data would include survey responses or raw data on employment, equality, training, accessibility etc. This inventory data is translated into impacts through a mix of characterisation, prioritisation and weighting depending on the methods involved.
Upstream
products
or services
Material production
Services
Buildings & Equipment
Other processes
Use Transport
Waste
Mgmt.
Raw Materials
and upsteream
Energy Labour Ancillary Inputs
Emissions to air Emissions to water Solid Waste
Hotspots Analysis - Overarching Methodological Framework
25
For social, economic or governance indicators not commonly included in LCA or where no single 1
accepted methodology or indicator exists for a particular aspect, users may consider taking 2
inspiration from methodologies identified in phase 1 of this project. These are summarised in 3
Annex 4, figure 2, with many of these methodologies covering a range of environmental, social, 4
economic and governance impacts. At the sector level, the Sustainability Index for North 5
American Public Gardens and the FAO’s Sustainability Assessment of Food and Agriculture 6
Systems include indicators across all four areas. For products a number of methodologies 7
identified include with social, economic or governance indicators in addition to environmental 8
indicators. Users can also consider using existing reporting standards such as GRI to identify 9
potentially relevant impacts. 10
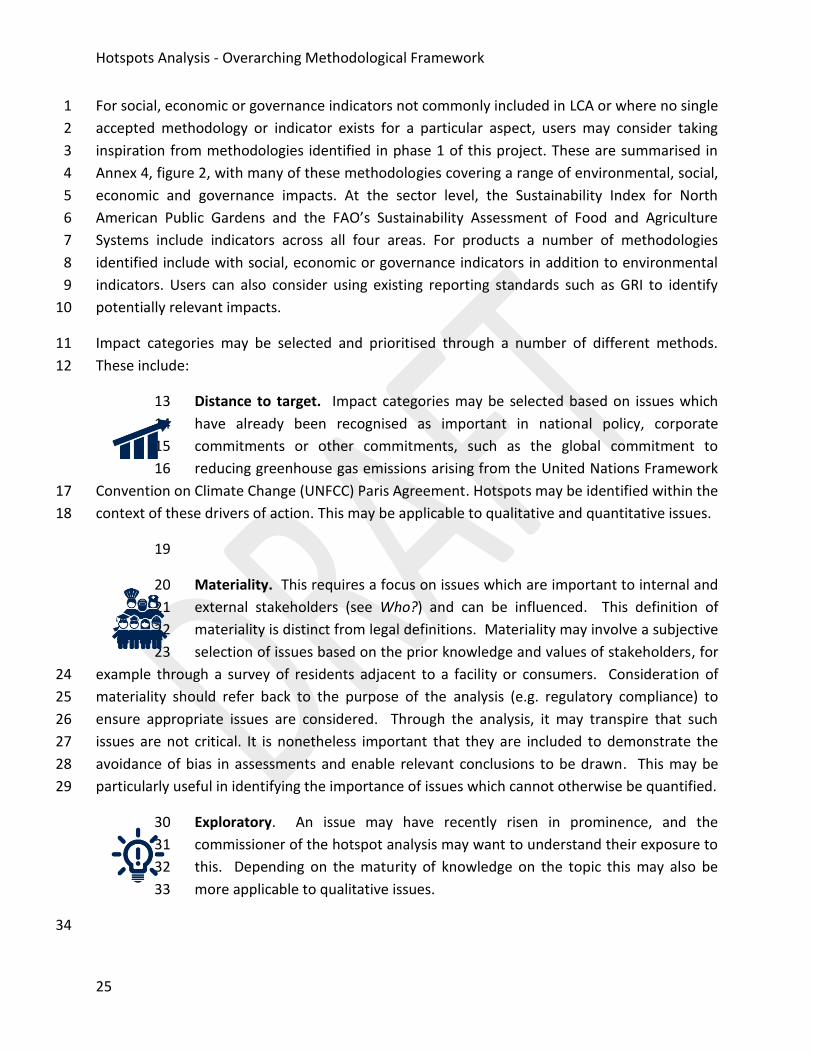
Impact categories may be selected and prioritised through a number of different methods. 11
These include: 12
Distance to target. Impact categories may be selected based on issues which 13
have already been recognised as important in national policy, corporate 14
commitments or other commitments, such as the global commitment to 15
reducing greenhouse gas emissions arising from the United Nations Framework 16
Convention on Climate Change (UNFCC) Paris Agreement. Hotspots may be identified within the 17
context of these drivers of action. This may be applicable to qualitative and quantitative issues. 18
19
Materiality. This requires a focus on issues which are important to internal and 20
external stakeholders (see Who?) and can be influenced. This definition of 21
materiality is distinct from legal definitions. Materiality may involve a subjective 22
selection of issues based on the prior knowledge and values of stakeholders, for 23
example through a survey of residents adjacent to a facility or consumers. Consideration of 24
materiality should refer back to the purpose of the analysis (e.g. regulatory compliance) to 25
ensure appropriate issues are considered. Through the analysis, it may transpire that such 26
issues are not critical. It is nonetheless important that they are included to demonstrate the 27
avoidance of bias in assessments and enable relevant conclusions to be drawn. This may be 28
particularly useful in identifying the importance of issues which cannot otherwise be quantified. 29
Exploratory. An issue may have recently risen in prominence, and the 30
commissioner of the hotspot analysis may want to understand their exposure to 31
this. Depending on the maturity of knowledge on the topic this may also be 32
more applicable to qualitative issues. 33
34
Hotspots Analysis - Overarching Methodological Framework
26
For further information please see: 1
Dreyer, L. C., Hauschild, M. Z., Schierbeck, J. (2010) Characterisation of social impacts in LCA 2
Part 1: Development of indicators for labour rights. The International Journal of Life Cycle 3
Assessment 15:247–259. 4
Ekener-Petersen E., Finnveden G. (2012) Potential hotspots identified by social LCA–Part 1: A 5
case study of a laptop computer. The International Journal of Life Cycle Assessment. 6
Goedkoop M.J., Heijungs R, Huijbregts M., De Schryver A.;Struijs J., Van Zelm R, (2009) ReCiPe 7
2008, A life cycle impact assessment method which comprises harmonised category indicators 8
at the midpoint and the endpoint level; First edition Report I: Characterisation 6 January 2009, 9
http://www.lcia-recipe.net 10
11
How? 12
At this stage the level of robustness should be agreed. The level of robustness will inform how 13
the data is gathered, used and communicated; and any quality thresholds that must be passed 14
to meet the goal of the study. Considerations in setting the level of “robustness for the study 15
include: 16
Level of primary data collection required: For example a screening study to identify 17 major hotspots might be based on publically available information. Conversely, a study 18 aiming to track improvement in a company’s products over time would be more likely to 19 require more detailed primary information. 20
Assumptions / simplifications to be made: What assumptions are being made and how 21 might these affect the level of detail in the results e.g. using data for one product as a 22 proxy for another 23
What will be the approach where gaps exist: Could proxy data be used or should 24 primary research be commissioned? 25
Scoping this out will then allow you to consider whether you have the appropriate skills to 26
define these criteria and if not how these may be obtained (e.g. training, partnerships, 27
outreach). The user should engage with key technical stakeholders to establish the level of 28
robustness required in the study as understanding these requirements will inform the best way 29
of carrying out the analysis. This will then link to the discussion of “Who?” needs to be involved 30
in the study. 31
To meet the objectives of the hotspots analysis, data quality criteria should be agreed for the 32
assessment. 33
Hotspots Analysis - Overarching Methodological Framework
27
A data collection hierarchy should be established to prioritise efforts (e.g. start with primary 1
data, then literature review, then personal communication, then unpublished corporate or 2
government data). This will be informed by the goal and scope of the study. For example, if 3
the objective is rapid screening then a literature review may be a starting point. However, if 4
the objective is to understand a specific value chain primary data may be the starting point. It is 5
sometimes worth questioning existing data structures and classifications as breakthrough 6
insights often come from unpicking the established norms or thinking laterally. New data 7
classifications or content introduced from different disciplines or sources can reveal valuable 8
new perspectives. For example, it may become apparent that what at first appear to be very 9
different consumer goods product categories are all dependent on a specific raw material or 10
ingredient (e.g. palm oil, timber, soy, beef), raising the profile of the raw material to a potential 11
hotspot by virtue of the fact that it is being used across multiple products. 12
Depending on the defined goal of the study, the types of information required may vary 13
significantly. For example, market/sales data can be helpful in establishing where the greatest 14
focus should be when gathering data for a product category assessment. At a sector level, it 15
may be necessary to gather national or regional data on the contribution of a sector to the 16
economy. Where qualitative data sources are being used, the goal and scope should establish 17
how this qualitative data is to be used – will some form of ranking or points system be used to 18
convert the qualitative information into a quantitative metric and why has the suggested 19
method been chosen? 20
In some cases, data or information on key aspects may be missing. This is most frequently the 21
case with “beyond LCA” impacts, including socio-economic impacts, governance impacts or 22
environmental impacts that are not driven by either mineral resource consumption or 23
emissions (e.g. biodiversity, land use). Potential data black-spots should be identified as early as 24
possible, allowing for stakeholder outreach, surveys or additional research to be conducted to 25
gather high-quality qualitative data. A further discussion on establishing a data hierarchy and 26
managing data sources is presented below. 27
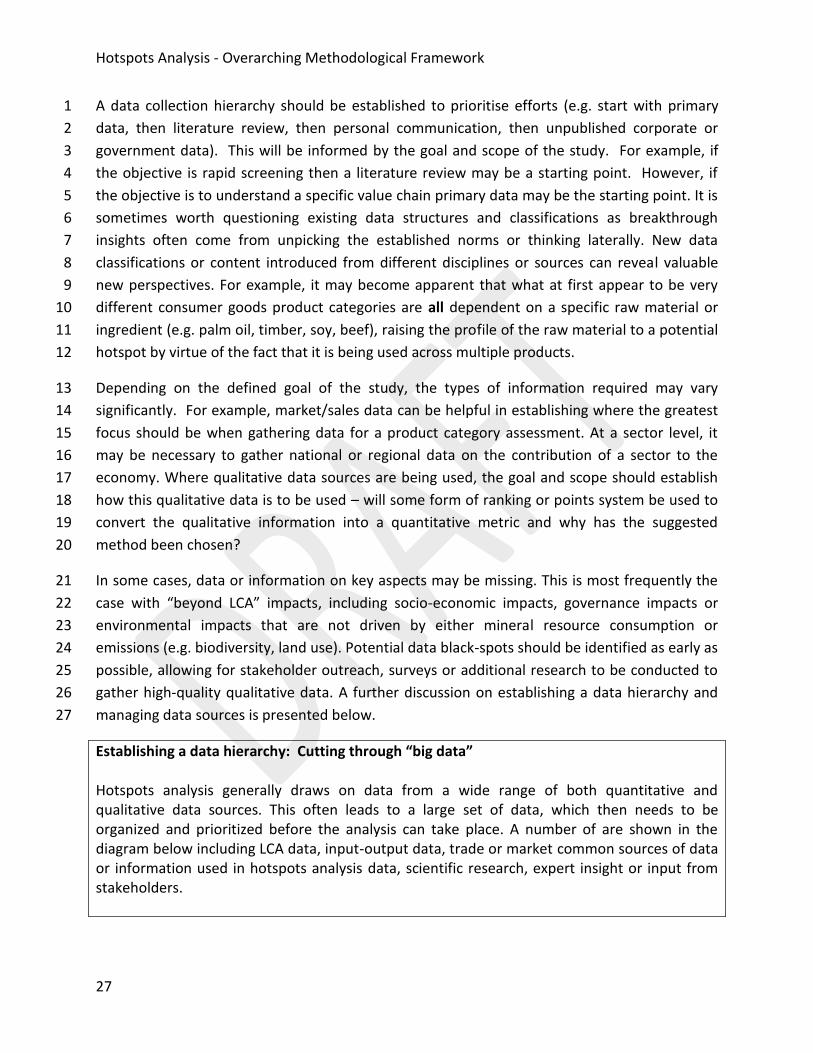
Establishing a data hierarchy: Cutting through “big data”
Hotspots analysis generally draws on data from a wide range of both quantitative and qualitative data sources. This often leads to a large set of data, which then needs to be organized and prioritized before the analysis can take place. A number of are shown in the diagram below including LCA data, input-output data, trade or market common sources of data or information used in hotspots analysis data, scientific research, expert insight or input from stakeholders.

Hotspots Analysis - Overarching Methodological Framework
28
Figure 7 common sources of data or information used in hotspots analysis
1
Who? 2
Roles in the hotspot analysis, including the intended audience, should be agreed at during the 3
goal and scope face. For each of the tasks within the hotspots analysis, the most relevant team 4
member should be identified and assigned to that role. In many cases, multiple roles may be 5
taken on by a single team member. However, the process of assigning roles within the project 6
team helps to define the project structure and identify potential skills gaps within the project 7
team. 8
Each project team should have a single person with oversight of the project who will be 9
involved from beginning to end. This ensures continuity and adherence to the aims of the 10
project and the methodology. They also act as a central contact point for other team members 11
and stakeholders, giving background to those team members or stakeholders not involved at 12
every stage and allowing questions on various aspects of the project to be directed to the 13
relevant person. 14
Other roles to be defined within the project team include: 15
Stakeholder lead: Responsible for identifying stakeholders and ensuring their 16 involvement at the relevant stage or stages based on their capabilities, influence etc. 17
Hotspots Analysis - Overarching Methodological Framework
29
Technical lead: At the start of the project the technical lead ensures that the aims of the 1 project, the study boundaries and the data requirements are consistent and relevant for 2 the product category or sector under study. The technical lead’s main role is in 3 developing, prioritising and implementing a list of actions arising from the results of the 4 hotspots analysis. 5
Indicators and Prioritisation lead: Responsible for leading work on the identification 6 and prioritisation of hotspots. This team member has responsibility for producing the 7 final list of indicators taking into account all of the input from project team members 8 and relevant stakeholders. 9
Communication lead: Responsible for overseeing all forms of communication arising 10 from the hotspots analysis. The communication lead will be responsible for ensuring 11 that these are consistent with the aims of the project, are suitable for the audience and 12 are appropriate for the level of robustness of the study. The communication lead should 13 be involved at project kick-off as this is where the audience should be identified. 14 Hotspots analyses that are not intended for public communication should still have a 15 team member responsible for communicating the results to the project team and a 16 closed group of relevant stakeholders. 17
18
When involving stakeholders it is important to consider which stakeholders should be engaged 19
at which stage. This could include, for example, stakeholders who understand hotspots analysis 20
and the system being studied (e.g. a product, sector) participating in scoping the study, and 21
customers being involved in prioritising impacts for assessment and action. One suggested 22
method is to create a table listing all stakeholders highlighting which stakeholders should be 23
engaged at which stages and the desired level of engagement at each stage (e.g. involved in 24
prioritising indicators vs providing feedback on social indicators selected). 25
Relevant stakeholders should be consulted on, but not limited to, the following issues: 26
The primary and secondary goals of the study; 27
The scale or level at which the study is to be conducted (e.g., national, city, sectoral, 28 product, etc.); 29
The study boundary (e.g. geographical scope / location; production and consumption; 30 industry sector / product categories / individual products to be covered; whole life cycle 31 or a collaborative gate to gate approach; temporal boundary; etc.); 32
The issues and impact categories / sub-categories to be covered by the study (i.e., a 33 materiality assessment to identify the importance of issues to stakeholders, including 34 environment, social, economic, governance, or mix of these) and associated 35 characterisation models (where required/necessary); 36
The type and nature of the outputs or deliverables for the study, including how the 37 findings are likely to be used (e.g. to inform a sector standard, to provide the evidence 38 for a voluntary agreement or industry collaboration); 39
Other relevant businesses, organizations or key stakeholders that should be consulted 40 or engaged during the course of the study. Stakeholders should be identified and 41
Hotspots Analysis - Overarching Methodological Framework
30
prioritised using a systematic approach to yield a comprehensive and representative 1 group. Stakeholders should represent a range of geographies, interests, communities 2 and types of organisation. As such, stakeholder engagement should be accessible to 3 both expert and non-expert participants (see further guidance on stakeholder 4 identification and prioritisation in the glossary); 5
Any other existing initiatives that are relevant to the study, including potential 6 collaborators, topic or sector / product category experts; 7
Any potential sources of data or information for use in the study; and 8
Their willingness to participate in a multi-stakeholder steering group and working 9 groups (e.g. methodology development; peer review; product category-specific 10 activities; tool and resource development; communications, piloting / road-testing of 11 solutions to address hotspots). 12 13
Case Study: Stakeholder identification within ISO14001: 2015 and the International Finance Corporation (IFC) The 2015 revision to the standard for Environmental Management Systems introduces life cycle thinking for the first time, shifting the focus of compliance with the standard from site based activity to considering the whole value chain. An early step in developing and implementing an Environmental Management System is to understand the context of the organisation. This involves understanding internal and external issues which are relevant to the organisation and affect its ability to achieve the intended outcomes of the Environmental Management System. The needs and expectations of interested parties should be determined and reviewed. Interested parties are identified as a “person or organization that can affect, be affected by, or perceive itself to be affected by a decision or activity”. Some expectations will become compliance obligations (i.e. the organisation commits to meeting these expectations). In hotspot analysis, these would then be included in the goal and scope of the analysis. There are a number of methods for stakeholder identification and prioritization, including those outlined for the ZOPP6 (Zeroing in On People and Processes) project planning method and those outlined by IFC in their stakeholder engagement handbook. In the IFC’s approach, the stakeholder identification and analysis stage, begins with the following three steps:
1. Identify those stakeholders directly and indirectly affected by the project: This
step establishes the project’s area of influence, with the focus on the areas potentially impacted by the project or organisation. This analysis should include
6 http://gametlibrary.worldbank.org/FILES/194_Guidelines%20for%20Project%20Planning%20using%20ZOPP%20-
%20GTZ.pdf

Hotspots Analysis - Overarching Methodological Framework
31
all geographies impacted directly and indirectly throughout the supply chain. From a hotspots analysis perspective, this means that the scope of the stakeholder engagement process should not be restricted to the primary geography of the organisation conducting the analysis. This process will begin to reveal the groups most likely to be affected by the project/organisation.
2. Identify those whose “interests” determine them as stakeholders: This step aims to capture any remaining stakeholders not captured in the previous step. These will generally be stakeholders who are not directly affected, but whose interests make them stakeholders. Examples here may include NGOs or other associations whose area of interest and activity may be influenced by the project/organisation.
3. Be strategic and prioritize: The first two stages of this process will likely yield a long list of stakeholders that can’t all be engaged with. These stakeholders should therefore be prioritised to yield a group that is representative and comprehensive, but also manageable. These stakeholders should be prioritised based on a number of relevant factors such as how adversely they might be affected, how vulnerable they may be, their interests and how these may influence the project. Areas of influence could include a stakeholders potential to enhance the project or contribute to identifying and scoping issues or which stakeholders might have detrimental effect on the project should they oppose it.
References:
ISO14001:2015 Environmental management systems -- Requirements with guidance for use https://committee.iso.org/sites/tc207sc1/home/projects/published/iso-14001---environmental-manage.html
Deutsche Gesellschaft für Technische Zusammenarbeit (1997) ZOPP Objectives-oriented Project Planning http://gametlibrary.worldbank.org/FILES/194_Guidelines%20for%20Project%20Planning%20using%20ZOPP%20-%20GTZ.pdf
IFC (2007) Stakeholder Engagement: A Good Practice Handbook for Companies Doing Business in Emerging Markets http://www.ifc.org/hb-stakeholderengagement
1
Where? 2
Hotspots analysis shall consider all the geographies in which impacts occur. This may require 3
additional research or engagement with suppliers or expert stakeholders to establish which 4
geographies are affected by the product category or sector being studied. This process helps to 5
minimise the risk of failing to identify a potential geographical hotspot e.g. products passing 6
Hotspots Analysis - Overarching Methodological Framework
32
through intermediate suppliers or a transport company whose employment practices could be 1
classed under the Modern Slavery act. 2
Common criticisms of some existing studies are a narrow focus on the local geography of the 3
study commissioner or the omission of potentially significant impacts in emerging economies 4
due to a lack of data. A comprehensive assessment of the relevant geographies will help to 5
establish the broader socio-political context in which the hotspots analysis is being conducted. 6
For sectoral assessments it may be necessary to gain insight into the economic and social 7
development role that sector has in the various geographies under study. For example, 8
mechanisation of a traditionally manual industrial sector may reduce some environmental 9
impacts, but may also result in significant unemployment within a sector. 10
Geography also informs which stakeholders should be engaged (see “Who?”) and what the 11
appropriate forms of engagement will be. Practitioners should be aware that methods 12
commonly used to gather qualitative data in their home geography may not be appropriate for 13
all cultures and geographies. Is a multiple choice Likert scale7 likely to be understood and will 14
stakeholders feel confident to answer honestly? Is the method being used likely to exclude 15
stakeholders without internet access? Contacts in the local geography, such as Universities 16
(particularly social science departments), local NGOs or government departments can help to 17
ensure that the methods being used to gather data are culturally appropriate. 18
19
When? 20
Is the study a snapshot of a moment in time, or does it take a longer period of time into 21
account? All information collected for the hotspots analysis should relate to the time period in 22
question, for example the lifetime of a product. The goal and scope should also suggest a 23
timeline and methodology for review of the study (see section 8 for further details on 24
conducting reviews of hotspots analysis). The time period relevant for the study will be 25
informed by a number of factors including: 26
Representativeness of individual years: If there have been significant technological 27 changes in recent times data from previous years may not be representative. 28 Conversely, if a sector has experienced significant market fluctuations a single year of 29 data may not be representative 30
7 A Likert scale asks users to rate the extent to which they agree or disagree with a statement. A five point Likert
for example would generally include the following responses “strongly agree, agree, neutral, disagree and strongly disagree”.
Hotspots Analysis - Overarching Methodological Framework
33
Development timescales: What are the product development timescales and how do 1 these inform the study period both in terms of data gathering and potential future 2 reviews? At both a product and sector level, what is the market outlook or what are the 3 timescales for current initiatives that may influence product/sectoral development. 4
5
STEP 2 Gather data, seek expert insight, knowledge building and analysis 6
The output of step 2 is agreement on how to collect, organize and analyse data in line with the 7
goal and scope of the study. 8
This will be an iterative process and may involve refinement to the goal and scope of the study. 9
As determined in the goal and scope (How?) data gathering may include literature review (e.g. 10
national or sectoral data-sets, existing footprinting studies and scientific research); expert 11
insight (e.g. face-to-face meetings, online questionnaires) collecting primary data (e.g. market 12
or sales data) or making assumptions / extrapolations (e.g. based on proxy data). 13
Analyses should use a combination of filters to cut through often large data sets to arrive at a 14
prioritised set of data and information that highlights the key issues, aspects and impacts that 15
the study ultimately focuses on. These filters include whether the data collected meets the goal 16
and scope of the study, satisfies the data quality parameters, and provides useful insights. 17
The goal and scope should establish the data quality parameters for the study. These should 18
also be taken into account when interpreting the results of the analysis, as data quality and 19
uncertainty will determine what are the most appropriate communication mechanisms for the 20
analysis. Validation of data with expert stakeholders will ensure that the data used are 21
appropriate for the goals of the study. Data not included in the final analysis may still be listed 22
in any more detailed report or output as this can help the audience understand how the final 23
dataset was derived and which data sources were considered. 24
Using the filters listed above can lead to a number of important insights. Firstly, quantitative 25
life cycle data is not the most appropriate data source in all cases, particularly where “beyond 26
LCA” impacts are being considered or where the boundaries of existing LCA/LCI datasets are not 27
appropriately matched with those of the hotspot analysis being conducted. Secondly it may 28
identify data quality issues for resolution, and thirdly it may identify data is available with 29
inconsistent boundaries. 30
Data shall be organised and structured in a logical and consistent manner, and shall relate 31
clearly to the unit of analysis. The recommendation is that this should be initially organised 32
based on life cycle stages. The number of life cycle stages defined will determine how many 33
hotspots are identified and may influence how hotspots are defined (see step 3 for guidance on 34
Hotspots Analysis - Overarching Methodological Framework
34
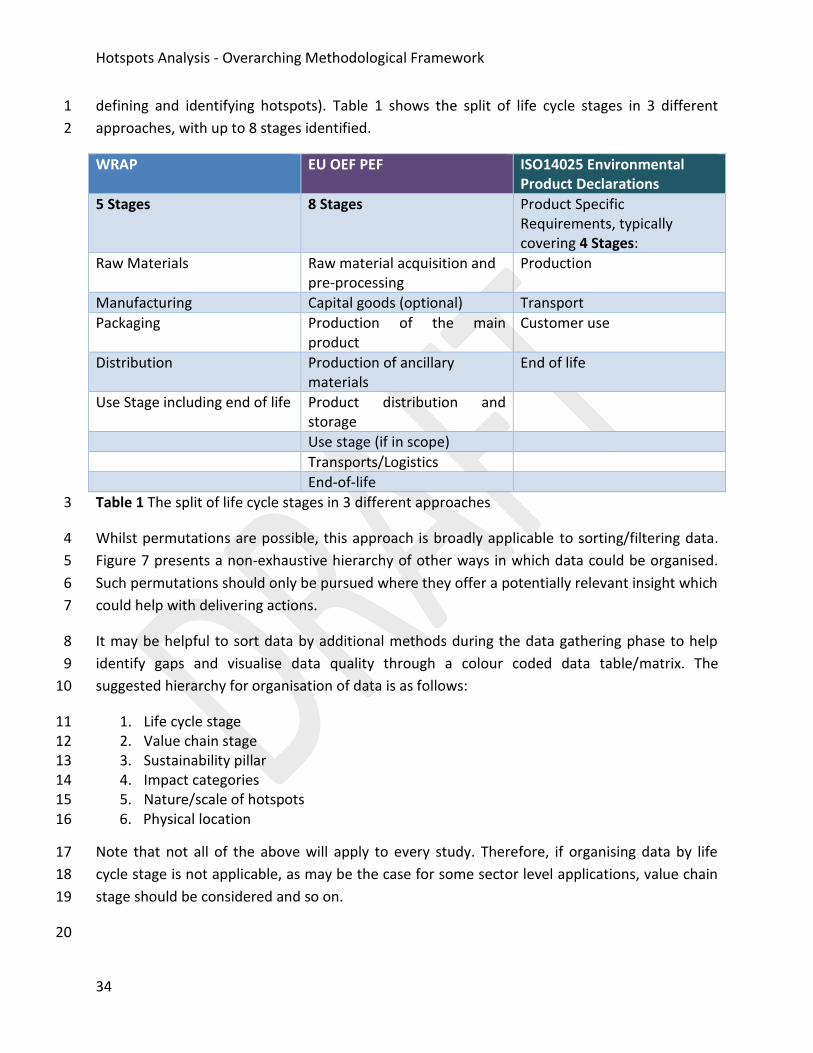
defining and identifying hotspots). Table 1 shows the split of life cycle stages in 3 different 1
approaches, with up to 8 stages identified. 2
WRAP EU OEF PEF ISO14025 Environmental Product Declarations
5 Stages 8 Stages Product Specific Requirements, typically covering 4 Stages:
Raw Materials Raw material acquisition and pre-processing
Production
Manufacturing Capital goods (optional) Transport
Packaging Production of the main product
Customer use
Distribution Production of ancillary materials
End of life
Use Stage including end of life Product distribution and storage
Use stage (if in scope)
Transports/Logistics
End-of-life
Table 1 The split of life cycle stages in 3 different approaches 3
Whilst permutations are possible, this approach is broadly applicable to sorting/filtering data. 4
Figure 7 presents a non-exhaustive hierarchy of other ways in which data could be organised. 5
Such permutations should only be pursued where they offer a potentially relevant insight which 6
could help with delivering actions. 7
It may be helpful to sort data by additional methods during the data gathering phase to help 8
identify gaps and visualise data quality through a colour coded data table/matrix. The 9
suggested hierarchy for organisation of data is as follows: 10
1. Life cycle stage 11 2. Value chain stage 12 3. Sustainability pillar 13 4. Impact categories 14 5. Nature/scale of hotspots 15 6. Physical location 16
Note that not all of the above will apply to every study. Therefore, if organising data by life 17
cycle stage is not applicable, as may be the case for some sector level applications, value chain 18
stage should be considered and so on. 19
20
Hotspots Analysis - Overarching Methodological Framework
35
Keeping everything in context 1
The interpretation and summarising of the body of research produced during a hotspots 2
analysis study can often provide the greatest insights. Whilst ‘systems thinking’ is often easier 3
said than done, taking the time to step back and consider the full picture can prove invaluable 4
and a useful precursor to identifying which aspects and impacts are likely to be significant 5
enough to be classified as hotspots. 6
Uncertainty testing or mapping should be used as appropriate to understand the reasons 7
behind different impact values or factors for the same products categories or sub-sectors. 8
Uncertainty testing generally involves testing the range around key variables or looking at the 9
potential extremes within a set of data. 10
Where no variables or ranges are available, uncertainty mapping may be used to qualitatively 11
explore what potential uncertainties or quality issues may affect a dataset. This may take the 12
form of a rating system or a series of yes/no questions that can be used to classify critical 13
quality/coverage aspects of a dataset. Uncertainty testing/mapping leads to a better 14
understanding of the key variables driving or mitigating impacts or the impact of gaps in 15
evidence on the goals of the study. It also provides useful insight on areas requiring further 16
research and improved data. 17
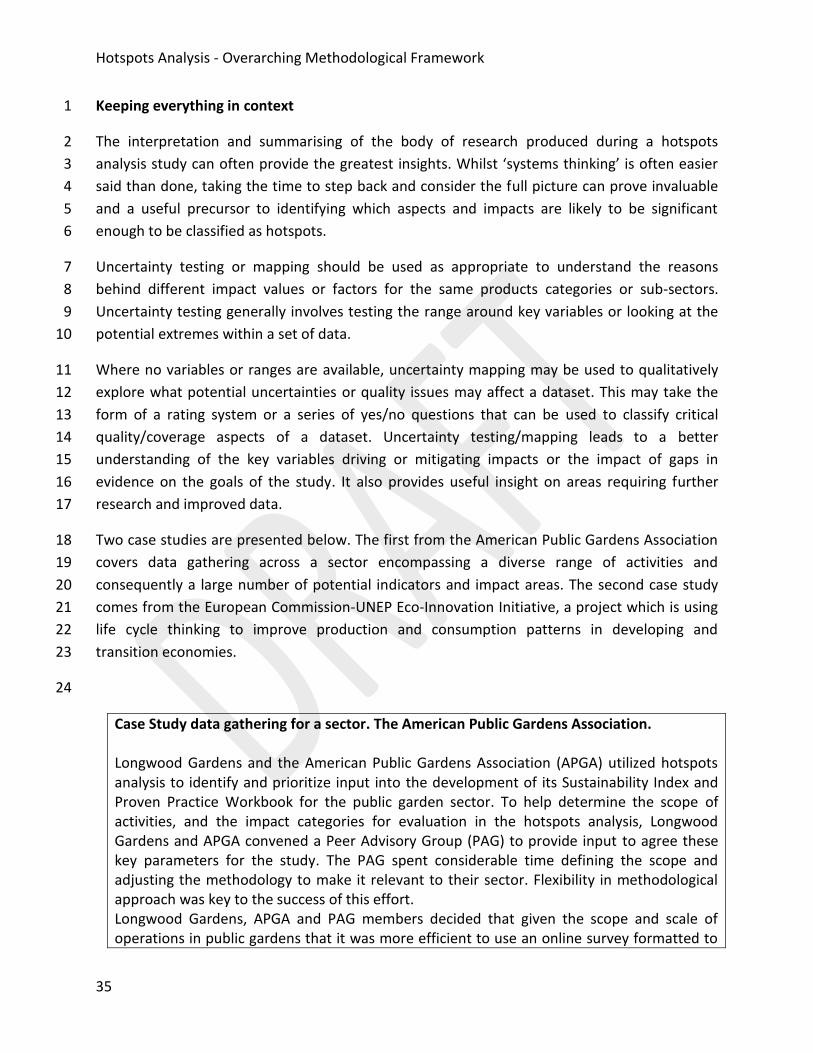
Two case studies are presented below. The first from the American Public Gardens Association 18
covers data gathering across a sector encompassing a diverse range of activities and 19
consequently a large number of potential indicators and impact areas. The second case study 20
comes from the European Commission-UNEP Eco-Innovation Initiative, a project which is using 21
life cycle thinking to improve production and consumption patterns in developing and 22
transition economies. 23
24
Case Study data gathering for a sector. The American Public Gardens Association. Longwood Gardens and the American Public Gardens Association (APGA) utilized hotspots analysis to identify and prioritize input into the development of its Sustainability Index and Proven Practice Workbook for the public garden sector. To help determine the scope of activities, and the impact categories for evaluation in the hotspots analysis, Longwood Gardens and APGA convened a Peer Advisory Group (PAG) to provide input to agree these key parameters for the study. The PAG spent considerable time defining the scope and adjusting the methodology to make it relevant to their sector. Flexibility in methodological approach was key to the success of this effort. Longwood Gardens, APGA and PAG members decided that given the scope and scale of operations in public gardens that it was more efficient to use an online survey formatted to
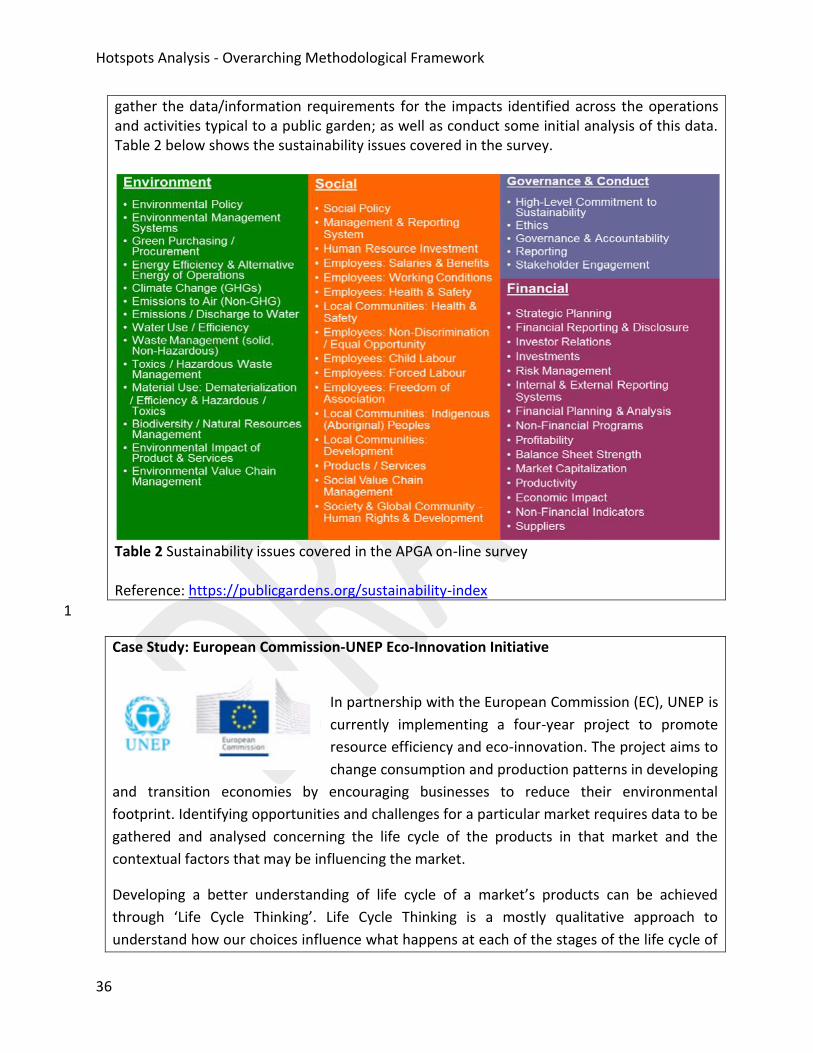
Hotspots Analysis - Overarching Methodological Framework
36
gather the data/information requirements for the impacts identified across the operations and activities typical to a public garden; as well as conduct some initial analysis of this data. Table 2 below shows the sustainability issues covered in the survey.
Table 2 Sustainability issues covered in the APGA on-line survey Reference: https://publicgardens.org/sustainability-index
1
Case Study: European Commission-UNEP Eco-Innovation Initiative
In partnership with the European Commission (EC), UNEP is
currently implementing a four-year project to promote
resource efficiency and eco-innovation. The project aims to
change consumption and production patterns in developing
and transition economies by encouraging businesses to reduce their environmental
footprint. Identifying opportunities and challenges for a particular market requires data to be
gathered and analysed concerning the life cycle of the products in that market and the
contextual factors that may be influencing the market.
Developing a better understanding of life cycle of a market’s products can be achieved
through ‘Life Cycle Thinking’. Life Cycle Thinking is a mostly qualitative approach to
understand how our choices influence what happens at each of the stages of the life cycle of

Hotspots Analysis - Overarching Methodological Framework
37
a product or service. Questions to consider include:
Where and when are the most significant costs incurred across the life cycle of the product?
What are the most significant resources (energy, materials and water) consumed throughout the product life cycle?
Where are resources being wasted or underutilized?
Where are there toxic chemicals used and how are they prevented from impacting the environment or human health?
How does the product value chain impact on local stakeholders?
Which stakeholders benefit from the product, and which are negatively impacted?
How could greater value be derived from the product life cycle? Reference: UNEP (2014) Eco-Innovation Manual http://www.unep.org/resourceefficiency/Business/Eco-Innovation/TheEco-InnovationProject/Eco-innovationManual/tabid/1059803/Default.aspx
1
2
3
Hotspots Analysis - Overarching Methodological Framework
38
STEP 3 Identify and validate Hotspots 1
The output of step 3 shall be the identification of hotspots associated with the unit of analysis. 2
The evidence collected in step 2 shall be used to build a picture of the likely issues and impact 3
hotspots that will need to be addressed. Having identified and allocated impacts to each life 4
cycle stage, there is then a need to either normalise the results or agree that each impact 5
category will be assessed in isolation. 6
Normalisation 7 ISO 14044 (ISO 2006) advises that normalisation allows results to be expressed 8 using a common reference impact. This supports the comparison between 9 alternatives using reference numerical scores. The normalisation factors express 10
the total impact occurring in a reference region for a certain impact category 11 (e.g. climate change, eutrophication, etc.) within a reference year. For guidance in a 12 European context, please see Benini et al (2014) Normalisation method and data for 13 Environmental Footprints 14
15 Weighting and Materiality 16
Weighting is a more subjective step and involves multiplying the (normalised) 17 results of each of the impact categories with a weighting factor that expresses 18 the relative importance of the impact category. This may be based on the 19 importance ascribed to an issue by stakeholders as part of establishing the 20 goal and scope of the study. For example, stakeholders may be asked to 21
prioritise the issues important to them. This prioritisation could be used to inform the 22
weighting of different issues. 23 Where a hotspots analysis is based on qualitative information, materiality may be the only 24 way to rank the relative importance of different issues. 25 26
Monetary Valuation 27 Monetary Valuation is a specific form of weighting. The environmental impacts 28 identified in the hotspot analysis are dependent on natural resources and 29 ecosystem services. These have associated costs and benefits. Some of these 30 are reflected in market prices, such as the cost of energy or water use, but 31 many are not. Quantifying these environmental costs and benefits financially is 32
another way of prioritising hotspots, and could be used internally to inform capital allocation 33 decisions or externally, for example as part of sustainability reporting. The Natural Capital 34
Protocol, The Monetisation Club and draft ISO 14008 standard provides further guidance on 35 this issue. 36
37 Having attributed impacts to each life cycle stage and normalised / weighted the impacts to 38 allow them to be prioritised, hotspots can be defined. Two approaches may be used. These are 39 illustrated in figure 8. 40 41

Hotspots Analysis - Overarching Methodological Framework
39
Hotspot
A life cycle stage whose contribution to the impact category is greater than even distribution of that impact across the life cycle stages.
Warmspot
A life cycle stage whose contribution is approximately equivalent to an even distribution of the impact across the life cycle stages.
Cold Spot
A life cycle stage whose contribution to any impact category is less than even distribution of that impact across the life cycle stages
Hotspot All life cycle stages collectively contributing more than 50% to any impact category.
Cold Spot All life cycle stages collectively contributing less than 50% to any impact
category.
Figure 8 Options for identifying hotspots 1
2 In the first approach a hotspot shall always be a percentage greater than if the impacts were 3 evenly distributed across life cycle stages. So, if there are 5 life cycle stages, a hotspot should 4 not be defined lower than 20% of the impact category, and if there are 7 stages, it should not 5 be lower than 14%. 6 7 Where the hotspot has been identified based on qualitative information, it will not be possible 8 to identify a hotspot with quantitative precision. To ensure that hotspots are covered, the 9 analysis should therefore be confident that the majority of impacts (i.e. over 50%) are covered. 10
11 Depending upon the number of impact categories selected, the number of hotspots may vary. 12 In step 5 the ability to address these will be considered, but whilst they may not all be 13 addressed, this does not mean that their status as hotspots is affected. 14
15 Consideration should be given to how these can be most effectively communicated with 16 stakeholders identified in step 1. This should include graphical representation alongside 17 interpretation and narration on the findings. The preparation and refinement of videos, 18 presentations, info-graphics or sector / product ‘heat maps’ should provide an overview of the 19 hotspots identified in the study, the issues or impact categories associated with them and their 20 location in the economy, sector, product lifecycle or value chain. 21
22
Case study: Identifying and Validating Hotspots through the EU Environmental Footprint Initiative and WRAP Courtauld 2025
As part of the EU Environmental Footprint Pilot Process, hotspot identification serves the purpose of "warning" an organisation about the areas where they should focus their attention
Hotspots Analysis - Overarching Methodological Framework
40
in order to improve the environmental performance of a product8 or an organisation9. Hotspot identification may be used as an internal eco-design tool or for public communication. Where the process is internal, hotspots can be defined based on the inventory analysis. However, where the results are for public communication a more detailed approach is employed. A hotspot can be identified at different levels of granularity: life cycle stage, process or elementary flow. In the context of PEF/OEF pilot phase methods a hotspot is defined as: (1) all life cycle stages, (2) all processes and (3) all elementary flows contributing at least 50% to any impact category before normalisation and weighting. The most relevant impact categories are also identified. In addition to hotspots, most relevant stages, processes and flows are identified based on coverage of total impact. Eight life cycle stages are specified for a hotspot analysis.
Worked examples are provided which guide users of the Environmental Footprint methodology in how to identify hotspots at each level of detail. WRAP and Courtauld 2025
Courtauld 2025 is a voluntary agreement to cut the resource needed to provide our food and drink by one-fifth over ten years. In understanding the impact of products, five life cycle stages have been identified and used consistently across all products. The top 50 products have been prioritised based on their contribution to materials flows in the sector, greenhouse gas emissions, energy use, water footprint and waste arising across their whole life cycle. For
each product, a hotspot is considered to be any stage which contributes 25% or more to one of these environmental impacts. A secondary hotspot has also been identified where this contributes 15-25% of the overall impact of the product.
References: European Commission (2016) Guidance for the implementation of the EU Product Environmental Footprint (PEF) during the Environmental Footprint (EF) pilot phase Version 5.2 – February 2016 http://ec.europa.eu/environment/eussd/smgp/ European Commission (2016) Guidance for the implementation of the EU Organisation Environmental Footprint (OEF) during the Environmental Footprint (EF) Pilot Phase Version 4.0 – February 2016 http://ec.europa.eu/environment/eussd/smgp/ http://www.wrap.org.uk/psf
8 Product Environmental Footprint (PEF)
9 Organisation Environmental Footprint (OEF)

Hotspots Analysis - Overarching Methodological Framework
41
STEP 4 Responding to data and stakeholder gaps 1
The output of step 4 shall be a consideration of the impact of gaps in data and stakeholders, 2 and recommendations of whether these should be tolerated or acted upon.. 3
Step 4 is part of an iterative process, reviewing steps 2 and 3. It is important to 4
consider the significance of any data gaps, specifically whether hotspots have 5
been misidentified due to a lack of data, or data of insufficient quality. There 6
are three choices when faced with a gap: 7
1. Agree that the gap is not significant and can be tolerated. 8 2. Agree that the gap is significant and could affect the outcomes of the analysis and any 9
subsequent action plan. A plan should be developed to bridge the gap. This may 10 involve engaging with additional stakeholders, gathering further data, using proxy data 11 or extrapolating from data. 12
3. Agree to disagree. Where a gap exists through lack of participation from other 13 organisations, it may be that it can only be acknowledged, even though it is potentially 14 significant. 15
16
The degree of activity required for this step should be informed by the goal and scope; and by 17
the resources (money, personnel and time) available. In the first instance, consideration should 18
be given to filling data gaps. This may include, for example, supplementing secondary with 19
primary data or vice-versa, or utilising data that did not meet the initial quality criteria if it is 20
considered indicative of the likely magnitude of impacts. Where data is not available, 21
consideration may then be given to expert judgement to assess the significance of the gap and 22
potential implication on the hotspots identified. The identification of experts should refer back 23
to step 1. 24
When using proxy data or expert judgment to provide a quantitative input, the sensitivity of the 25
conclusions to this shall be tested. This shall be through sensitivity analysis, which involves 26
applying differing values in place of the missing data and sense checking the level at which this 27
affects the outcome of the analysis. For example, if the proxy data does not affect the outcome 28
until it is varied by 50%, this may give more confidence that even though the proxy data did not 29
meet initial quality criteria, this is unlikely to be a significant influence on the results. However, 30
if the variation is small, it may be considered a significant gap which requires further action. 31
This approach is distinct from uncertainty analysis, which seeks to quantify the level of 32
uncertainty around data points. 33
Where expert judgement is used for a qualitative input, this shall be clearly communicated 34
through the hotspots analysis. Consideration should be given to how bias towards the status 35
quo can be avoided. 36
Hotspots Analysis - Overarching Methodological Framework
42
Where gaps remain, it may be that no action is taken to fill these, where they are deemed 1
insignificant or unfeasible to fill. All gaps and their implications shall be clearly communicated 2
to relevant stakeholders, as well as recommendations associated with the gap (i.e. whether 3
further action is required to fill this – e.g. commissioning a new study to fill significant data 4
gaps). 5
Where a gap is considered relevant to a hotspot, this may be flagged as a potential hotspot. 6
The distinction between a hotspot identified through quantitative and qualitative means should 7
be clearly made. 8
It is also essential to review the representation of stakeholders. Does the project team include 9
stakeholders representing different sub-sectors within a sector, or different life cycle or value 10
chain stages which are emerging as hotspots? Step 1 should be revisited and the best way of 11
identifying and engaging with these groups identified. Whilst efforts should be made to engage 12
with all appropriate stakeholders, it is acknowledged that this may be challenging for a variety 13
of reasons. Where participation is not gained, this shall be recorded. 14
Case Studies: Food and Drink Products In an attempt to bridge data gaps for bio-based products, LCA practitioners can use either proxy data sets existing environmental data for apples to represent pears) or extrapolated data (e.g., derive new data for pears by modifying data for apples considering pear-specific production characteristics). Milà i Canals et al (2011) present a number of case studies which explore the challenges and consequences of using these two approaches. The use of proxy data sets is the quickest and easiest solution for bridging data gaps but also has the highest uncertainty. In contrast, data extrapolation methods may require extensive expert knowledge and are thus harder to use but give more robust results in bridging data gaps. They can also provide a sound basis for understanding variability in bio-based product data. If resources (time, budget, and expertise) are limited, the use of averaged proxy data may be an acceptable compromise for initial or screening assessments.
WRAP’s 2013 publication ‘An initial assessment of the environmental impact of grocery products’ sought data on 230 food and drink, personal care and household products sold in the UK. However, cradle-to-retail data of sufficient quality were only available for 174 products. Data gaps were filled where possible through the use of proxy data (e.g. shampoo as a proxy for hair
conditioner). Further gaps were filled in by using a worst-case estimation of 5 kg CO2e/kg for products sold in quantities less than 30 million kg per year. This threshold was chosen as 30 million kg per year represented less than 0.1% of total mass of grocery products sold (around 46,000 million kg per year). Therefore it was thought acceptable to use an estimated GHG emission factor in the absence of suitable data or proxy data. This left 13 products for which no suitable proxy data or worst-case estimation could be made. These products were clearly
Hotspots Analysis - Overarching Methodological Framework
43
identified in the study report. Bienge et al (2010) utilised Sustainability Hot Spot Analysis (SHSA) as qualitative approach based on stakeholder involvement to integrate social and environmental dimensions along the entire value chain and to identify relevant aspects for a product specific sustainability management. The paper illustrates single steps and results of the SHSA for a case study application to the strawberry value chain. Data availability for ecological and social impact analysis at product level differs. Whereas the ecological assessment can usually be based on relatively well available scientific literature and LCA studies, social LCA results and scientific literature about social implications of products are rare. The SHSA therefore includes stakeholder evaluation and verification to ensure the robust, i.e. safe in terms of direction, sustainability assessment of products based on the experiences of the stakeholders and experts. A range of quantified and qualitative indicators were identified and scored based upon their relevance and weighted, following the methodology developed by Wallbaum and Kummer (2006) External stakeholders and experts were consulted to critically review the results in terms of weighting and completion. As a result nine environmental and 13 social hot spots are identified. References: Katrin Bienge, Justus von Geibler and Michael Lettenmeier ‘Sustainability Hot Spot Analysis: A streamlined lifecycle assessment towards sustainable food chains’, Paper presented at the 9th European IFSA Symposium,4–7 July 2010, Vienna (Austria) http://ifsa.boku.ac.at/cms/fileadmin/Proceeding2010/2010_WS4.4_Bienge.pdf Milà i Canals, L., Azapagic, A., Doka, G., Jefferies, D., King, H., Mutel, C., Nemecek, T., Roches, A., Sim, S., Stichnothe, H., Thoma, G. and Williams, A. (2011), Approaches for Addressing Life Cycle Assessment Data Gaps for Bio-based Products. Journal of Industrial Ecology, 15: 707–725. doi:10.1111/j.1530-9290.2011.00369.x Wallbaum, H. and N. Kummer (2006) Entwicklung einer Hot-Spot-Analyse zur Identifizierung der Ressourcenintensitäten in Produktketten und ihre exemplarische Anwendung, Wuppertal Institut für Klima, Umwelt und Energie and triple innova. WRAP (2013) An initial assessment of the environmental impact of grocery products http://www.wrap.org.uk/priorityproducts
1
STEP 5 Identify and prioritize actions 2
The output of step 5 shall be a shortlist of prioritised actions based on their impact and 3
feasibility 4
Hotspots Analysis - Overarching Methodological Framework
44
Having identified the hotspots and reviewed the stakeholders required to address them, the 1
next step is to identify and prioritise actions to eliminate or reduce the impact of the hotspots. 2
There are two important issues to recognise at this point. The first is that there may not be 3
feasible options to address every hotspot. The second is that even after action has been taken, 4
a hotspot may still be a hotspot. For example, in considering the water footprint of the food 5
supply chain, use in agriculture is likely to be a clear hotspot. However, it may be that the 6
opportunity to reduce the water footprint is greater and more cost effective at another stage in 7
the life cycle. 8
This does not devalue the process of identifying hotspots in any way. Rather, it allows life cycle 9
stages to be prioritised for review and identification of actions, which may relate to other 10
hotspots, or may even be stages not identified as hotspots. The hotspots should be further 11
explored to identify the activities, processes or flows that drive them. Potential actions may be 12
identified through a number of approaches. 13
Greater Depth of Analysis 14
To better understand a hotspot, and therefore the potential actions which could be 15
taken, it may be necessary to further collect / disaggregate data by processes within 16
the life cycle stage, and then by elementary flows (e.g. by manufacturing activity 17
and then by material or energy entering or leaving the system). Where primary data has been 18
used in the hotspot analysis, this may already be available. 19
Benchmarking 20
Benchmarking may be possible based on the unit of analysis or an element of it (e.g. 21
impact of similar organisations of a sector) and best-in-class performance identified. 22
Lessons can then be learned from this. Discourse with relevant stakeholders, 23
including suppliers, retailers, technology providers, local communities and customers, may help 24
to identify further options. 25
Scale of Activity 26
Potential actions may also exist at different scales. For example, some may be 27
available to individual organisations, whilst others may require collaborative action 28
across a sector, along a value chain or across sectors (e.g. bringing together 29
government, academia business and individuals). Changes may be incremental in nature (e.g. 30
an efficiency gain) or step changes (e.g. a different business model or a breakthrough 31
technology). 32
Figure 9 summarises the process for identifying and refining actions. 33
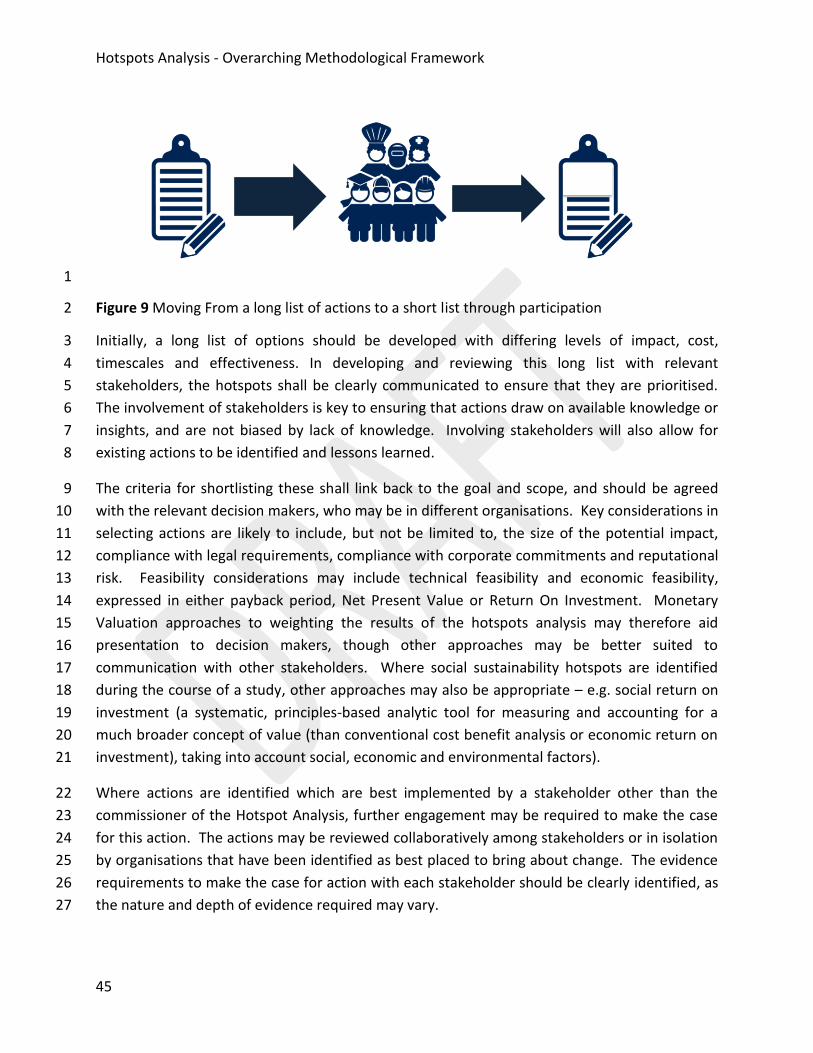
Hotspots Analysis - Overarching Methodological Framework
45
1
Figure 9 Moving From a long list of actions to a short list through participation 2
Initially, a long list of options should be developed with differing levels of impact, cost, 3
timescales and effectiveness. In developing and reviewing this long list with relevant 4
stakeholders, the hotspots shall be clearly communicated to ensure that they are prioritised. 5
The involvement of stakeholders is key to ensuring that actions draw on available knowledge or 6
insights, and are not biased by lack of knowledge. Involving stakeholders will also allow for 7
existing actions to be identified and lessons learned. 8
The criteria for shortlisting these shall link back to the goal and scope, and should be agreed 9
with the relevant decision makers, who may be in different organisations. Key considerations in 10
selecting actions are likely to include, but not be limited to, the size of the potential impact, 11
compliance with legal requirements, compliance with corporate commitments and reputational 12
risk. Feasibility considerations may include technical feasibility and economic feasibility, 13
expressed in either payback period, Net Present Value or Return On Investment. Monetary 14
Valuation approaches to weighting the results of the hotspots analysis may therefore aid 15
presentation to decision makers, though other approaches may be better suited to 16
communication with other stakeholders. Where social sustainability hotspots are identified 17
during the course of a study, other approaches may also be appropriate – e.g. social return on 18
investment (a systematic, principles-based analytic tool for measuring and accounting for a 19
much broader concept of value (than conventional cost benefit analysis or economic return on 20
investment), taking into account social, economic and environmental factors). 21
Where actions are identified which are best implemented by a stakeholder other than the 22
commissioner of the Hotspot Analysis, further engagement may be required to make the case 23
for this action. The actions may be reviewed collaboratively among stakeholders or in isolation 24
by organisations that have been identified as best placed to bring about change. The evidence 25
requirements to make the case for action with each stakeholder should be clearly identified, as 26
the nature and depth of evidence required may vary. 27
Hotspots Analysis - Overarching Methodological Framework
46
As well as incurring costs, actions to address hotspots may yield savings, and also potentially 1
offer a market opportunity. This should be part of the decision making process where relevant. 2
In some cases, collaboration and the principle of creating shared value (co-investment in 3
solutions and sharing of the benefits/returns on investment) will be essential, as the costs of 4
taking action may fall to one part of the value chain whilst the benefits, in whole or part, accrue 5
elsewhere. 6
The identified opportunities to address hotspots shall be reviewed and prioritised for action. 7
The process for agreeing actions should be documented and the justification recorded. Actions 8
identified may be trialled or applied at a large scale. Where actions are collaborative in nature, 9
a shared action plan or guidance materials may be required to ensure broad participation. 10
Plans for monitoring and reporting should also be put in place. 11
The organisations involved should agree with whom the progress will be communicated, and 12
how. The separate hotspots analysis communications guidance developed alongside this 13
methodological framework provides the fundamental principles for communication and 14
visualisation that can be applied to any communications required throughout and following the 15
completion of a study. At this stage, a well-documented and agreed upon process, reasons and 16
triggers for shortlisting hotspots and actions allows for clarity in choosing actors to implement 17
actions, and acts as a basis for revisiting hotspots and actions at a later stage (step 8). This step, 18
when developed in a robust manner, acts as the basis for actions to be identified, prioritised 19
and agreed with those best placed to affect change; and saves the time required to obtain 20
consensus/agreement on revisiting/ changing hotspots, actions and those responsible for 21
implementing them. 22
23
Case Study: Prioritising actions through ISO14001: 2015 Significant environmental aspects represent where an organisation interacts with the environment, and can be seen as equivalent to hotspots, in that they are used to identify and prioritise a range of activities for improvement based upon their environmental impacts. Having identified the significant environmental aspects of an organisation, the ISO 14001 standard then requires organisations to assess the risk associated with threats and opportunities and to take action to address these risks. Objectives should be set in the context of the organisations environmental policy, and based upon the organisations significant environmental aspects, compliance obligations and risks associated with threats and opportunities. Before committing to action, the feasibility of objectives should be assessed. Feasibility may be informed by resource availability, including
Hotspots Analysis - Overarching Methodological Framework
47
finance, technology and other issues. The focus is on objectives that can be measured where possible.
1
Case Study: Prioritizing Value Chain Interventions
Development organisations are often tasked with selecting from a wide array of value chains
to meet their objectives and must have a strategy for doing so, including the selection criteria
to be used and the actors and project partners involved. An initial step in value chain
development is to assess various potential sectors or value chains to determine which ones
the project might have the greatest impact through interventions according to specific
development needs.
GIZ have developed guidelines for value chain selection that combine four different
dimensions of value chains/sustainable development: economic, environmental, social and
institutional goals and project mandates. Hotspots Analysis is used as a qualitative tool to
identify environmental hotspots along the value chain and is often done through stakeholder
consultation. A hotspot indicates critical problems related to inefficient resource use, high
Greenhouse Gas (GHG) emissions and other environmental problems that may occur
throughout the value chain.
Reference
Schneeman, J., and Vredeveld,T., (2015) Guidelines for Value Chain Selection Deutsche
Gesellschaft für Internationale Zusammenarbeit (GIZ)
https://www.giz.de/fachexpertise/downloads/giz2015-en-guidelines-value-chain-selection.pdf
2
STEP 6 Review initial findings 3
Having identified hotspots, potential actions, gaps in data and activity, the analysis and initial 4
findings should be reviewed with experts and key stakeholders. The purpose of the review 5
should be to ensure that the analysis is fit for purpose. This means that: it is consistent with the 6
goal and scope; that the impact categories have been assessed appropriately; and that 7
appropriate actions – and those that are able to undertake them - have been identified. 8
Review and revision should be an on-going process throughout the hotspots analysis, which is 9
itself likely to be an iterative process. After reviewing the initial findings it may be necessary to 10
return to an earlier stage to refine the goal and scope, improve data quality or re-engage with 11
Hotspots Analysis - Overarching Methodological Framework
48
stakeholders. This more formal review step precedes final communication of the results, and 1
so is an opportunity for correction / clarification. 2
The initial findings should be reviewed to ensure that they are understood by those 3
stakeholders who either affect or are affected by a hotspot. 4
Consideration should be given to the need for an independent third-party review panel. To 5
ensure that the panel are able to comment authoritatively it should comprise individuals with 6
experience in Hotspots Analysis or a related approach such as Life Cycle Assessment, 7
experience of the specific product or sector under review, and understanding of prioritised 8
impact categories. The need for a panel will depend on the goal and scope of the hotspot 9
analysis and whether public communication would be considered more robust following the 10
use of a review panel. 11
The review should not validate the original goal and scope, but should consider whether 12
recommended actions are commensurate with the goal and scope. Review criteria should be 13
established and followed, either by a review panel or the analysis authors and clients. These 14
should consider compliance with the goal and scope, the suitability of quantitative and 15
qualitative inputs and their interpretation, the appropriate identification of hotspots and 16
whether the actions proposed are commensurate with the hotspot. The communication of the 17
results from hotspots analysis is likely to provide validation, which could act as an input to the 18
review process. The hotspots analysis communications guidance identifies communication and 19
visualisation principles, and the types of validation that may be obtained from different 20
stakeholders and target audiences. 21
A review report should be prepared and discussed with the authors and clients. Amendments / 22
responses should be agreed and responses to the review recorded. Further guidance on critical 23
review is contained within ISO14040: 2006. 24
Case Study Association of Home Appliance Manufacturers (AHAM) and the Water Quality Association (WQA)
Industry associations such as the Association of Home Appliance Manufacturers (AHAM) and the Water Quality Association (WQA) convened a core working group or task force to provide input at each phase of their respective hotspots analyses. The goal of the working group was to identify the hotspots for which
criteria would be incorporated into sustainability standards for appliance products. In these examples, stakeholders were product manufacturers with an array of technical expertise and considerable depth of technical and commercial experience. AHAM and WQA
Hotspots Analysis - Overarching Methodological Framework
49
developed a scoping document, which summarized the hotspots analysis methodology, results and proposed actions. This document was then circulated among key stakeholders external to the working groups and task forces, along with a feedback template to document their feedback in a consistent format to help their Working Groups to simplify review of comments and to address these effectively. Additionally, WQA convened individual webinars with each key stakeholder external to its Working Group, to engage on the project, to describe initial findings, to answer questions from stakeholders, to provide guidance and request written feedback on the initial findings and proposed corrective actions for impacts identified. Further information in this case study is provided in Module 3: Sector Level Supplementary Guidance.
1
STEP 7 Presentation and communication 2
Presentation and communication of findings to a wider audience allows for validation of 3
hotspots analysis (HSA) results, initiating actions and collaboration, designing pilots and 4
reviewing progress over time. The hotspots analysis communication guidance document 5
provides guidance on the principles of communication and visualisation of the results from a 6
hotspots analysis study. The communications guidance will help you to determine the most 7
appropriate messages (based on the evidence from the study), the most effective 8
communications vehicles to use and the calls to action for different audiences based on the 9
goal, scope and objectives of the study and the stakeholders involved. They will also help you to 10
set the objectives and agree the desired outcomes for each communication. 11
The format of the material produced at the end of hotspots analysis project will be highly 12
dependent on a number of factors including the initial goal and scope of the study, the 13
specification of deliverables, the outcomes of the final study, the audience (and whether they 14
are technical or non-technical) and the desired outcomes from communicating with a wider 15
audience. 16
Prior to producing any final communication, it is important to take note of any changes in the 17
study objectives, as hotspots analysis projects can be dynamic in nature. Documenting and 18
commenting on these changes can help frame the project for the audience and ensure that 19
stakeholders understand that any changes from the original goal and scope have been made 20
with careful consideration, consultation and analysis. 21
Consideration shall be given to what the objectives of communication are. Examples of 22
objectives from final communication would include: 23
Hotspots Analysis - Overarching Methodological Framework
50
Gaining support internally or externally for further work (e.g. pilot projects to address 1 identified hotspots); 2
Establishing collaborations with other organisations or groups; 3
Feeding in to on-going initiatives; 4
Initiating dialogue on actions with policy makers; or 5
Gaining feedback to validate results. 6 7
The balance of what is being communicated must also be considered when establishing the 8
most appropriate form(s) of communication. Is the focus of the communication on the results 9
from the hotspots analysis, the methodology used or the improvement opportunities and 10
future actions? 11
Establishing clear objectives will also help identify the target audience for communication. In 12
some cases, multiple audiences and objectives might be identified, which will, in turn, 13
determine the style of communication. Engaging with relevant stakeholders in an iterative 14
manner across all of the steps of conducting a hotspots analysis, allows you to: 15
Build a clear picture of your target audiences, what you need from them and what they 16 need from you; 17
Identify the best ways to reach them (directly or indirectly, through channels that they 18 trust); Use the right communications vehicles for each of your audiences; 19
Gain a better understanding of the tone of voice to use to ensure that the information 20 you provide is actionable and actions are agreed and implemented. 21 22
In many cases, a range of different communication styles should be adopted from presentations 23 and one-page summaries to detailed technical reports or online tools. Ensuring a clear objective 24 and target audience for each communications output is likely to significantly enhance its 25 effectiveness. It also allows for validation of results from hotspots analysis and provides basis 26 to revisit and review the hotspots analysis at a later stage. 27 28 The hotspots analysis communication guidance presents information on the different types of 29 validation, from technical validation that ensures that your communications match the 30 evidence from your study; to the validation of the right communications vehicle to use and the 31 impact of your communications (i.e. how your audiences have used and responded to the 32 information you have provided them with). 33
34 The case study below explains the process and results of communication and validation through 35 collaboration between co-operative food and its pork supplier, supported by WRAP. This case 36 study was selected to showcase how the results from hotspots analysis was communicated and 37 validated to enable action. 38
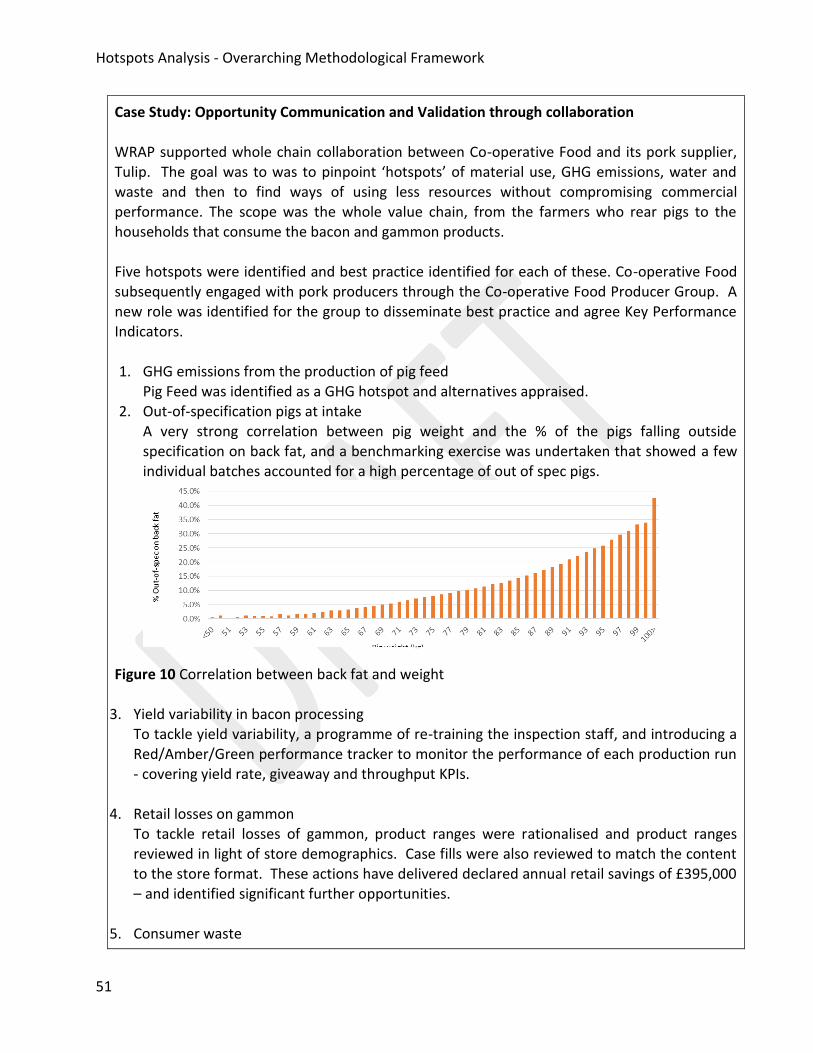
Hotspots Analysis - Overarching Methodological Framework
51
Case Study: Opportunity Communication and Validation through collaboration
WRAP supported whole chain collaboration between Co-operative Food and its pork supplier, Tulip. The goal was to was to pinpoint ‘hotspots’ of material use, GHG emissions, water and waste and then to find ways of using less resources without compromising commercial performance. The scope was the whole value chain, from the farmers who rear pigs to the households that consume the bacon and gammon products. Five hotspots were identified and best practice identified for each of these. Co-operative Food subsequently engaged with pork producers through the Co-operative Food Producer Group. A new role was identified for the group to disseminate best practice and agree Key Performance Indicators.
1. GHG emissions from the production of pig feed
Pig Feed was identified as a GHG hotspot and alternatives appraised. 2. Out-of-specification pigs at intake
A very strong correlation between pig weight and the % of the pigs falling outside specification on back fat, and a benchmarking exercise was undertaken that showed a few individual batches accounted for a high percentage of out of spec pigs.
Figure 10 Correlation between back fat and weight
3. Yield variability in bacon processing
To tackle yield variability, a programme of re-training the inspection staff, and introducing a Red/Amber/Green performance tracker to monitor the performance of each production run - covering yield rate, giveaway and throughput KPIs.
4. Retail losses on gammon
To tackle retail losses of gammon, product ranges were rationalised and product ranges reviewed in light of store demographics. Case fills were also reviewed to match the content to the store format. These actions have delivered declared annual retail savings of £395,000 – and identified significant further opportunities.
5. Consumer waste

Hotspots Analysis - Overarching Methodological Framework
52
Finally to tackle consumer food waste, Tulip and Co-operative Food have both been taking a number of actions to help reduce consumer waste. For example, offering a range of different pack sizes to cater for the varying size of households; and introducing a re-sealable packaging system. The Co-operative Food has also been going through a process of retesting the product life for all their protein products and has found that it is possible to add 1-3 days without compromising product safety or quality. The protocols for testing the product lives of meat and fish are historic and a review of labelling on mince, necessitated because of changes in EU labelling regulations, led The Co-operative Food to review these protocols. This approach is now being extended to cover all protein categories – and is anticipated to save over £1 million.
Reference:
WRAP (2016) Collaboration in the pork supply chain saves £395,000 and identifies further opportunities http://www.wrap.org.uk/content/whole-chain-resource-efficiency
1
STEP 8 Revisit hotspots and actions identified 2
A method should be established to ensure that hotspots are revisited after a specified period or 3
when certain trigger points occur (e.g. where the impact of a prioritised hotpot has been 4
reduced to an acceptable level and resources become available to tackle the next hotspots on a 5
rolling list). This is likely to depend on the goal, scope, objective and timeframe of the hotspots 6
analysis; and the time required for agreed actions to be undertaken. 7
Revisiting hotspots and actions may take place after an agreed upon time by the relevant 8
stakeholders involved in the hotspots analysis, in order to incorporate the results of the actions 9
taken and to validate their impact; to review any factors that may change the ranking of 10
hotspots or key stakeholders ability to address them; and to agree and action plan next steps. 11
Revisiting hotspots allows the study to be re-evaluated against new life cycle/technical data, 12
scientific research, national, sector, market or sales trends, changes to stakeholder perceptions, 13
the emergence of new solutions, innovations or technologies that allow hotspots to be 14
addressed more effectively, new issues arising and progress made/challenges encountered in 15
managing previously identified hotspots. 16
When undertaking hotspots analysis, these intervals or triggers should be identified to ensure 17
that a review will take place in a systematic manner. When identifying these potential intervals 18
or triggers practitioners should consider how and why hotspots may evolve. These anticipated 19
trends will then inform the criteria used to set a review in motion. 20
Hotspots Analysis - Overarching Methodological Framework
53
1
When conducting a review of the hotspots, a number of approaches may be used. One 2
approach is to examine the evolution of key hotspots or data points, to see if any significant re-3
ordering of hotspots has occurred or needs to occur. This approach can be used to identify 4
progress against recommendations identified from previous analyses or give an indication that 5
a broader, more detailed review of hotspots is required. 6
A periodic review of the step-by-step process can help to ensure that the goal, scope and 7
requirements of the study remain relevant. Where changes are identified, e.g. as a result of 8
feedback from stakeholders or a change of focus due to a new application of a product or new 9
sectoral trends, the step-by-step process should be reviewed to ensure that it remains relevant 10
and comprehensive. 11
Reviews are also a significant opportunity to revisit any data gaps that were previously 12
identified and to incorporate improved data or methods. Filling in gaps as data becomes more 13
readily available or comprehensive may lead to a re-ordering or re-prioritisation of hotspots 14
that may require (re)engagement with stakeholders to ensure that previously identified actions 15
and recommendations remain relevant; or to determine whether new actions are required. 16
Hotspots and actions can be revisited on a “rolling basis” (as the triggers/ selection
criteria already defined by the stakeholders become applicable) or at a certain
“defined period/ periodic basis” (such as every 6 months or 1 year, as agreed by
stakeholders at the start of the hotspots analysis process) or on a “hybrid basis” (i.e. a
combination of rolling and periodic basis, where the hotspots and actions are
revisited as the triggers/ selection criteria become viable or at the defined time
period expires, whichever comes first). Examples of such triggers/ selection criteria
include:
Financial viability: improved access to resources, technological solution becomes cost-effective, or changes to cost-benefit ratios allows action to be taken
Regulatory viability: changes in legislation or regulation place a new emphasis on identified hotspots creating a new imperative for action
Changes in policy that support action: e.g. new economic, environmental, social or industry policies; new funding or research opportunities; tax breaks for investments in environment technologies; increased openness to public/private partnerships
Access to new/improved data: that fills previous data gaps, improves data quality and reduces uncertainty, allowing existing hotspots or actions to be validated and taken forward; or for new ones to be identified
Technological availability or viability: enabling action to be taken as access to new technology improves
Hotspots Analysis - Overarching Methodological Framework
54
Practitioners should also examine how improvement opportunities have evolved since the last 1
review. As actions previously deemed unviable, untested or uneconomical become more 2
accessible, the overall prioritisation of hotspots and recommendations can change. 3
Documentation of potential improvement opportunities that may become viable in the future 4
can serve both as a trigger to revisit a hotspots analysis and as a reminder to practitioners of 5
opportunities to be followed up during a review. The outcome from the communication of the 6
hotspots analysis is likely to provide inputs to the review process. The hotspots analysis 7
communication guidance identifies the possible validation that can be obtained from the target 8
audience- direct, indirect, technical and non-technical. Such validation, along with the actions 9
taken on various hotspots should act as an input to the review process. 10
The case study below on the International Aluminium Institute elaborates the process of 11
revisiting hotspots analysis over a period of time including deeper collaboration with the 12
stakeholders in order to find and address sustainability related challenges of the Aluminium 13
sector. 14
Case Study: International Aluminium Institute The International Aluminium Institute’s “Alumina Technology Roadmap” provides an outlook on the sustainability challenges of alumina industry up to 2030 and how these should be addressed. The first report was published in 2001, and identified six focus
themes for research and development in areas including resource efficiency, process and knowledge management and safety/human exposure. An update in 2006 built on the experience of the previous five years and took the previous six themes and linked them to 12 priority R&D needs many of which were applicable to multiple themes. This report also introduced a ranking for these R&D needs to identify high, medium and low priority R&D needs. The group also identified that more structured organisation might be required to move projects forward and ensure cross-party collaboration. This resulted in the formation of a Bauxite & Alumina Committee (BAC) within IAI and greater input from the Alumina Technical Panel, comprised of the R&D managers from major alumina producers. An update in 2010 was undertaken to ensure greater industry coverage, with particular focus on gaining input from Chinese alumina producers. It was decided that with a significant increase in participation, a full re-prioritisation should be undertaken, with the questionnaire developed in collaboration with the technical panel and then sent out to all BAC members and members of the Chinese industry. Further input was also sought from other stakeholders to understand how their priorities and challenges might differ from those of the industry. These stakeholders included research institutions, engineering companies, equipment and reagent suppliers, and government agencies. The 2010 revision also developed a more specific vision and strategic
Hotspots Analysis - Overarching Methodological Framework
55
goals for the industry up to 2030, which can be used to communicate what the future of the industry is to a broad range of stakeholders. Reference: http://www.world-aluminium.org/
1
Hotspot Applications and Limitations 2
Hotspots analysis can be applied at different scales including product, product category, sector, 3
city and national. This methodological framework is developed with a sustainability mind set. 4
Hotspots analysis methodologies typically use life cycle thinking approach, while providing the 5
flexibility of taking into consideration quantitative and qualitative data/ information from 6
various stakeholders. This allows for the results of the hotspots analysis to be comprehensive 7
and collaborative with considerable dialogue and deliberation keeping actions to reduce the 8
impacts in mind. Figure 1 Application of Hotspots analysis: different data sources and example 9
study outputs of this methodological framework provides a visual representation of the various 10
applications of hotspots analysis. 11
The limitations of hotspots analysis would include the lack of a single method and databases to 12
conduct all HSA studies, like in the case of LCA studies. This makes comparison between two 13
hotspots analysis results difficult unless they are identical. Further, depending on the goal and 14
scope of the study, HSA requires deeper planning, collaboration and iteration to achieve results 15
and action. However, this limitation is not related to the primary objective of hotspots analysis; 16
to identify and act to address hotspots. Comparability is not required in order to identify and 17
prioritise opportunities for intervention. 18
19
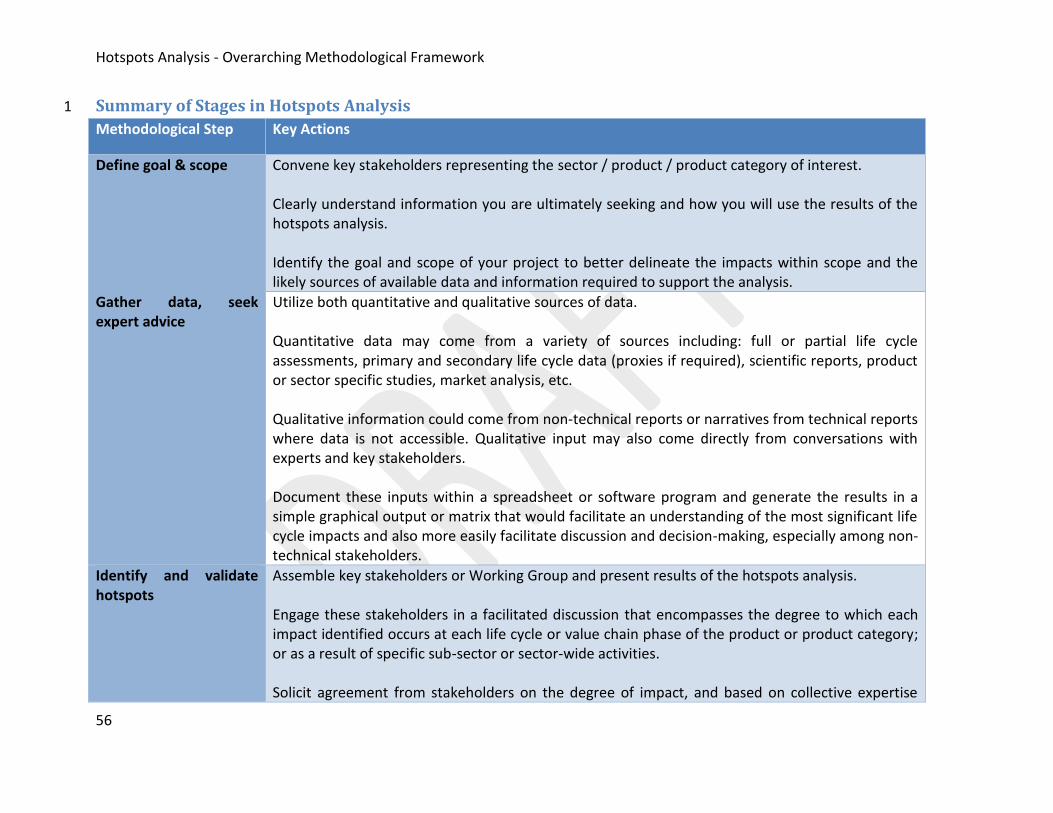
Hotspots Analysis - Overarching Methodological Framework
56
Summary of Stages in Hotspots Analysis 1
Methodological Step Key Actions
Define goal & scope Convene key stakeholders representing the sector / product / product category of interest. Clearly understand information you are ultimately seeking and how you will use the results of the hotspots analysis. Identify the goal and scope of your project to better delineate the impacts within scope and the likely sources of available data and information required to support the analysis.
Gather data, seek expert advice
Utilize both quantitative and qualitative sources of data. Quantitative data may come from a variety of sources including: full or partial life cycle assessments, primary and secondary life cycle data (proxies if required), scientific reports, product or sector specific studies, market analysis, etc. Qualitative information could come from non-technical reports or narratives from technical reports where data is not accessible. Qualitative input may also come directly from conversations with experts and key stakeholders. Document these inputs within a spreadsheet or software program and generate the results in a simple graphical output or matrix that would facilitate an understanding of the most significant life cycle impacts and also more easily facilitate discussion and decision-making, especially among non-technical stakeholders.
Identify and validate hotspots
Assemble key stakeholders or Working Group and present results of the hotspots analysis. Engage these stakeholders in a facilitated discussion that encompasses the degree to which each impact identified occurs at each life cycle or value chain phase of the product or product category; or as a result of specific sub-sector or sector-wide activities. Solicit agreement from stakeholders on the degree of impact, and based on collective expertise
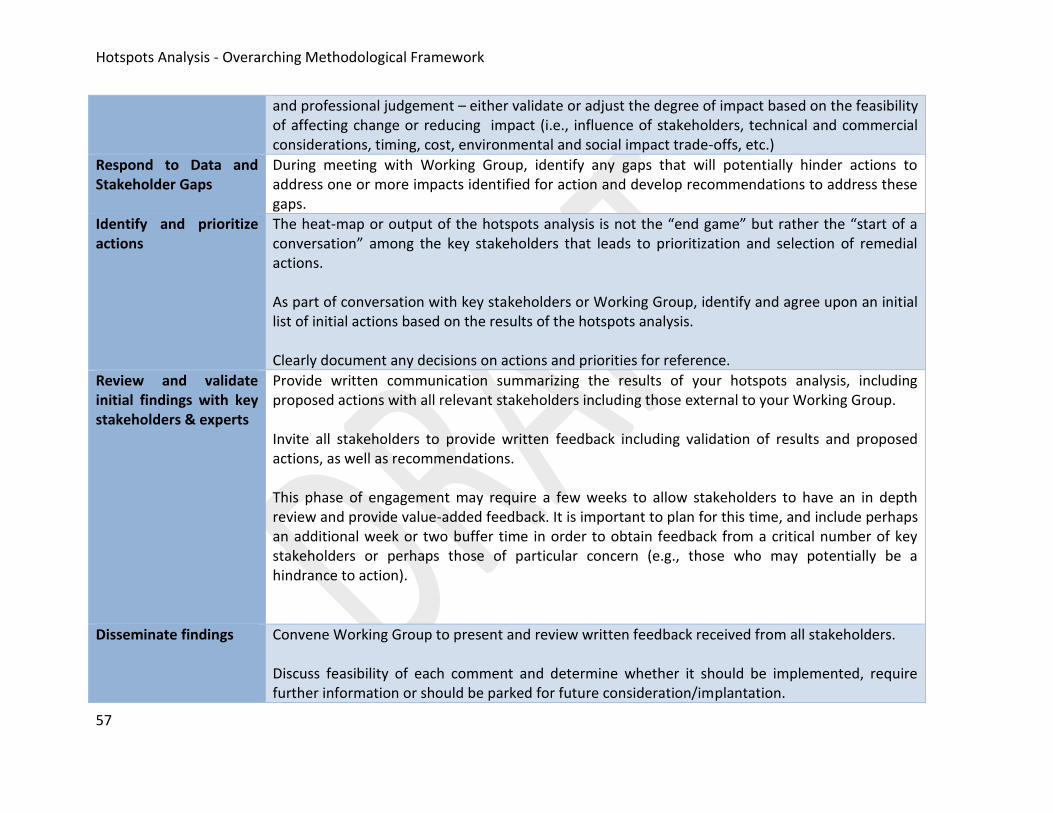
Hotspots Analysis - Overarching Methodological Framework
57
and professional judgement – either validate or adjust the degree of impact based on the feasibility of affecting change or reducing impact (i.e., influence of stakeholders, technical and commercial considerations, timing, cost, environmental and social impact trade-offs, etc.)
Respond to Data and Stakeholder Gaps
During meeting with Working Group, identify any gaps that will potentially hinder actions to address one or more impacts identified for action and develop recommendations to address these gaps.
Identify and prioritize actions
The heat-map or output of the hotspots analysis is not the “end game” but rather the “start of a conversation” among the key stakeholders that leads to prioritization and selection of remedial actions. As part of conversation with key stakeholders or Working Group, identify and agree upon an initial list of initial actions based on the results of the hotspots analysis. Clearly document any decisions on actions and priorities for reference.
Review and validate initial findings with key stakeholders & experts
Provide written communication summarizing the results of your hotspots analysis, including proposed actions with all relevant stakeholders including those external to your Working Group. Invite all stakeholders to provide written feedback including validation of results and proposed actions, as well as recommendations. This phase of engagement may require a few weeks to allow stakeholders to have an in depth review and provide value-added feedback. It is important to plan for this time, and include perhaps an additional week or two buffer time in order to obtain feedback from a critical number of key stakeholders or perhaps those of particular concern (e.g., those who may potentially be a hindrance to action).
Disseminate findings Convene Working Group to present and review written feedback received from all stakeholders. Discuss feasibility of each comment and determine whether it should be implemented, require further information or should be parked for future consideration/implantation.

Hotspots Analysis - Overarching Methodological Framework
58
Document agreed actions for each comment.
Review and revisit hotspots analysis
Periodically review with Working Group or key stakeholders, the hotspots analysis, utilizing new information or data to validate previously identified hotspots and actions. This review may also be used to identify new life cycle hotspots. Any changes to hotspots analysis methodology, engagement of additional stakeholders, etc. should be evaluated and implemented.
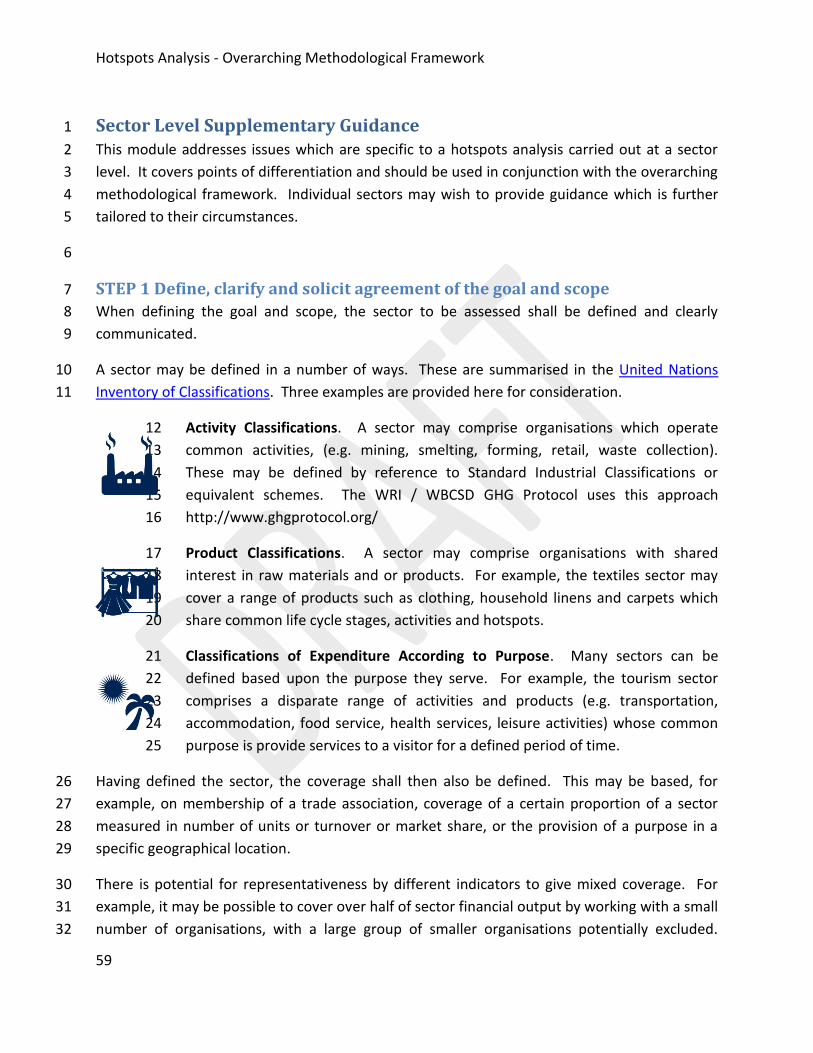
Hotspots Analysis - Overarching Methodological Framework
59
Sector Level Supplementary Guidance 1
This module addresses issues which are specific to a hotspots analysis carried out at a sector 2
level. It covers points of differentiation and should be used in conjunction with the overarching 3
methodological framework. Individual sectors may wish to provide guidance which is further 4
tailored to their circumstances. 5
6
STEP 1 Define, clarify and solicit agreement of the goal and scope 7
When defining the goal and scope, the sector to be assessed shall be defined and clearly 8
communicated. 9
A sector may be defined in a number of ways. These are summarised in the United Nations 10
Inventory of Classifications. Three examples are provided here for consideration. 11
Activity Classifications. A sector may comprise organisations which operate 12
common activities, (e.g. mining, smelting, forming, retail, waste collection). 13
These may be defined by reference to Standard Industrial Classifications or 14
equivalent schemes. The WRI / WBCSD GHG Protocol uses this approach 15
http://www.ghgprotocol.org/ 16
Product Classifications. A sector may comprise organisations with shared 17
interest in raw materials and or products. For example, the textiles sector may 18
cover a range of products such as clothing, household linens and carpets which 19
share common life cycle stages, activities and hotspots. 20
Classifications of Expenditure According to Purpose. Many sectors can be 21
defined based upon the purpose they serve. For example, the tourism sector 22
comprises a disparate range of activities and products (e.g. transportation, 23
accommodation, food service, health services, leisure activities) whose common 24
purpose is provide services to a visitor for a defined period of time. 25
Having defined the sector, the coverage shall then also be defined. This may be based, for 26
example, on membership of a trade association, coverage of a certain proportion of a sector 27
measured in number of units or turnover or market share, or the provision of a purpose in a 28
specific geographical location. 29
There is potential for representativeness by different indicators to give mixed coverage. For 30
example, it may be possible to cover over half of sector financial output by working with a small 31
number of organisations, with a large group of smaller organisations potentially excluded. 32
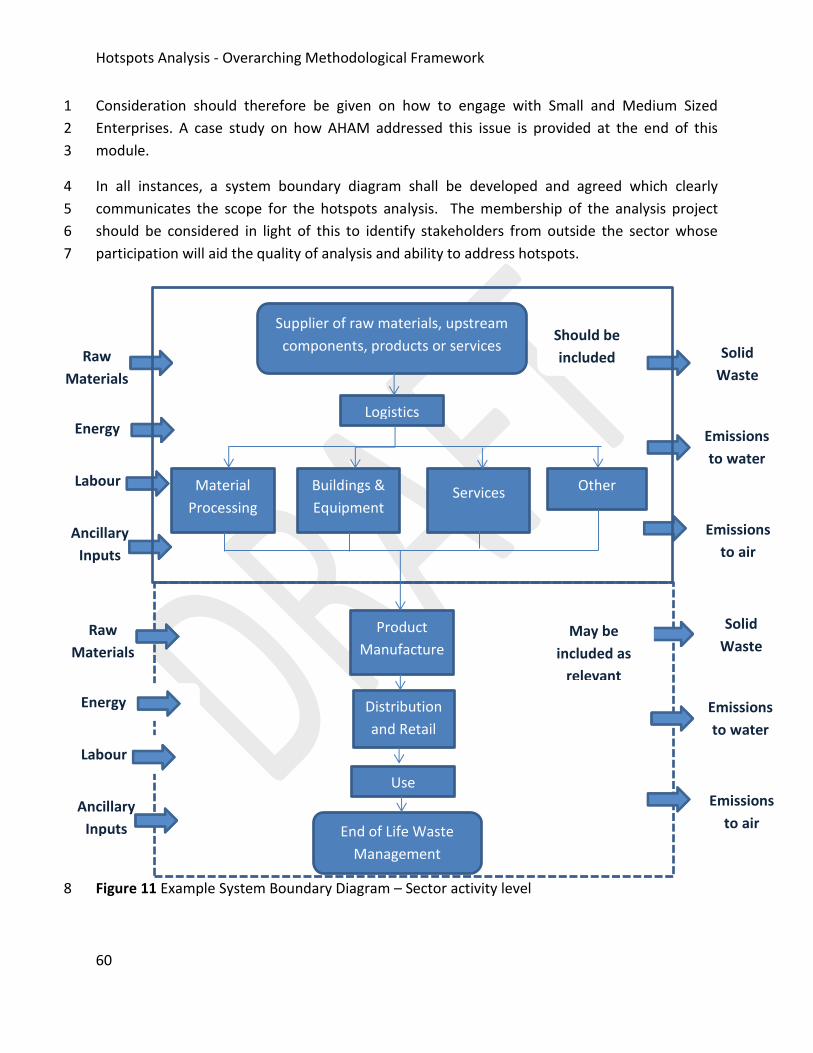
Hotspots Analysis - Overarching Methodological Framework
60
Consideration should therefore be given on how to engage with Small and Medium Sized 1
Enterprises. A case study on how AHAM addressed this issue is provided at the end of this 2
module. 3
In all instances, a system boundary diagram shall be developed and agreed which clearly 4
communicates the scope for the hotspots analysis. The membership of the analysis project 5
should be considered in light of this to identify stakeholders from outside the sector whose 6
participation will aid the quality of analysis and ability to address hotspots. 7
Figure 11 Example System Boundary Diagram – Sector activity level 8
Ancillary
Inputs
Labour
Raw
Materials
and
Energy
Solid
Waste
Emissions
to water
Emissions
to air
Supplier of raw materials, upstream
components, products or services
Logistics
Material
Processing
Product
Manufacture
Buildings &
Equipment
Other
processes Services
Distribution
and Retail
Use
End of Life Waste
Management
Solid
Waste
Emissions
to water
Emissions
to air Ancillary
Inputs
Labour
Raw
Materials
and
Energy
Should be
included
May be
included as
relevant
Hotspots Analysis - Overarching Methodological Framework
61
STEP 2 Gather data, seek expert insight, knowledge building and analysis 1
A sector hotspots analysis shall consider impacts which are controlled and influenced by the 2
sector. This means that it is essential that a life cycle approach is taken into account for 3
resources and energy which are supplied to the sector, and supplied by the sector. This may 4
involve working with stakeholders outside the sector to gather information. 5
STEP 4 Responding to data and stakeholder gaps 6
Where data gaps and / or hotspots identified sit outside of the sector, the composition of the 7
project team and steering group should be reconsidered. Do additional partners need to be 8
introduced into the process? How could they be involved? Depending on the nature of 9
relationships, formal or informal routes to filling gaps in data and stakeholders may be pursued. 10
Responses to hotspots are addressed in step 5. 11
STEP 5 Identify and prioritize actions 12
Through any definition, a sector hotspots analysis is likely to identify hotspots which are shared 13
horizontally by similar organisations and vertically by their value chains. In considering actions, 14
the impact of collaborative and stand-alone actions should be considered. For example, it may 15
be that a sector adopting common buying / sourcing standards can have a greater impact on a 16
hotspot in the supply chain than individual action. 17
18
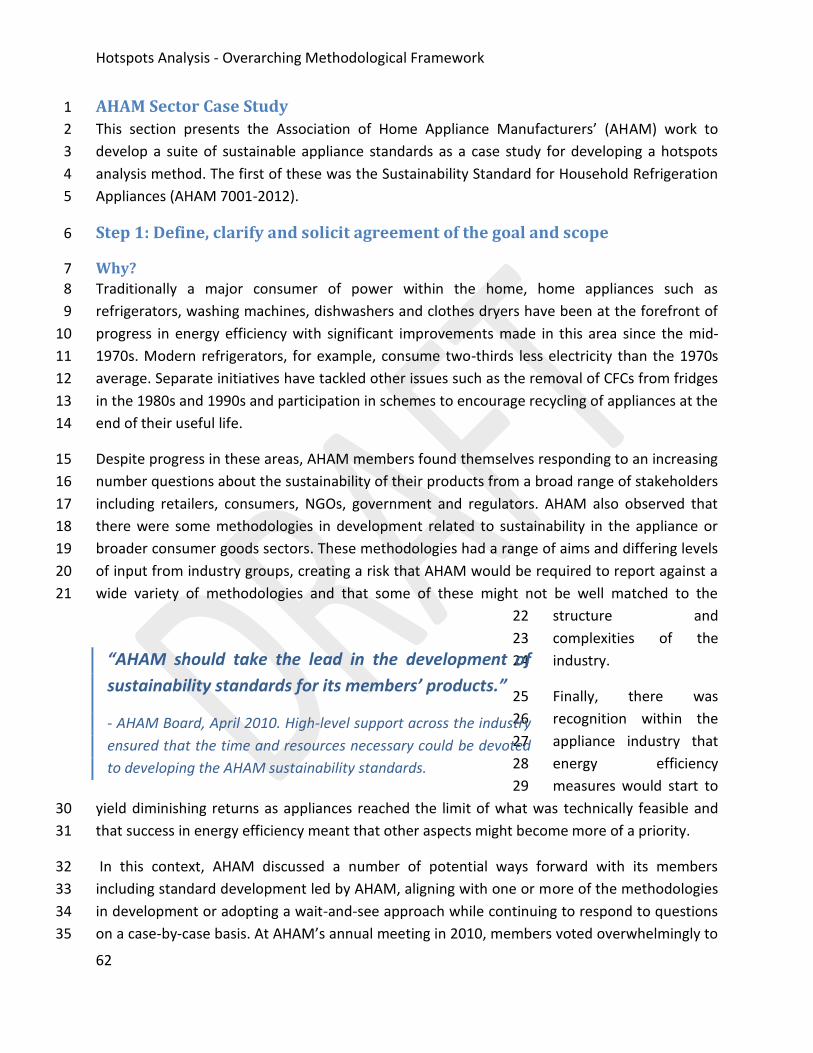
Hotspots Analysis - Overarching Methodological Framework
62
AHAM Sector Case Study 1
This section presents the Association of Home Appliance Manufacturers’ (AHAM) work to 2
develop a suite of sustainable appliance standards as a case study for developing a hotspots 3
analysis method. The first of these was the Sustainability Standard for Household Refrigeration 4
Appliances (AHAM 7001-2012). 5
Step 1: Define, clarify and solicit agreement of the goal and scope 6
Why? 7
Traditionally a major consumer of power within the home, home appliances such as 8
refrigerators, washing machines, dishwashers and clothes dryers have been at the forefront of 9
progress in energy efficiency with significant improvements made in this area since the mid-10
1970s. Modern refrigerators, for example, consume two-thirds less electricity than the 1970s 11
average. Separate initiatives have tackled other issues such as the removal of CFCs from fridges 12
in the 1980s and 1990s and participation in schemes to encourage recycling of appliances at the 13
end of their useful life. 14
Despite progress in these areas, AHAM members found themselves responding to an increasing 15
number questions about the sustainability of their products from a broad range of stakeholders 16
including retailers, consumers, NGOs, government and regulators. AHAM also observed that 17
there were some methodologies in development related to sustainability in the appliance or 18
broader consumer goods sectors. These methodologies had a range of aims and differing levels 19
of input from industry groups, creating a risk that AHAM would be required to report against a 20
wide variety of methodologies and that some of these might not be well matched to the 21
structure and 22
complexities of the 23
industry. 24
Finally, there was 25
recognition within the 26
appliance industry that 27
energy efficiency 28
measures would start to 29
yield diminishing returns as appliances reached the limit of what was technically feasible and 30
that success in energy efficiency meant that other aspects might become more of a priority. 31
In this context, AHAM discussed a number of potential ways forward with its members 32
including standard development led by AHAM, aligning with one or more of the methodologies 33
in development or adopting a wait-and-see approach while continuing to respond to questions 34
on a case-by-case basis. At AHAM’s annual meeting in 2010, members voted overwhelmingly to 35
“AHAM should take the lead in the development of
sustainability standards for its members’ products.”
- AHAM Board, April 2010. High-level support across the industry
ensured that the time and resources necessary could be devoted
to developing the AHAM sustainability standards.
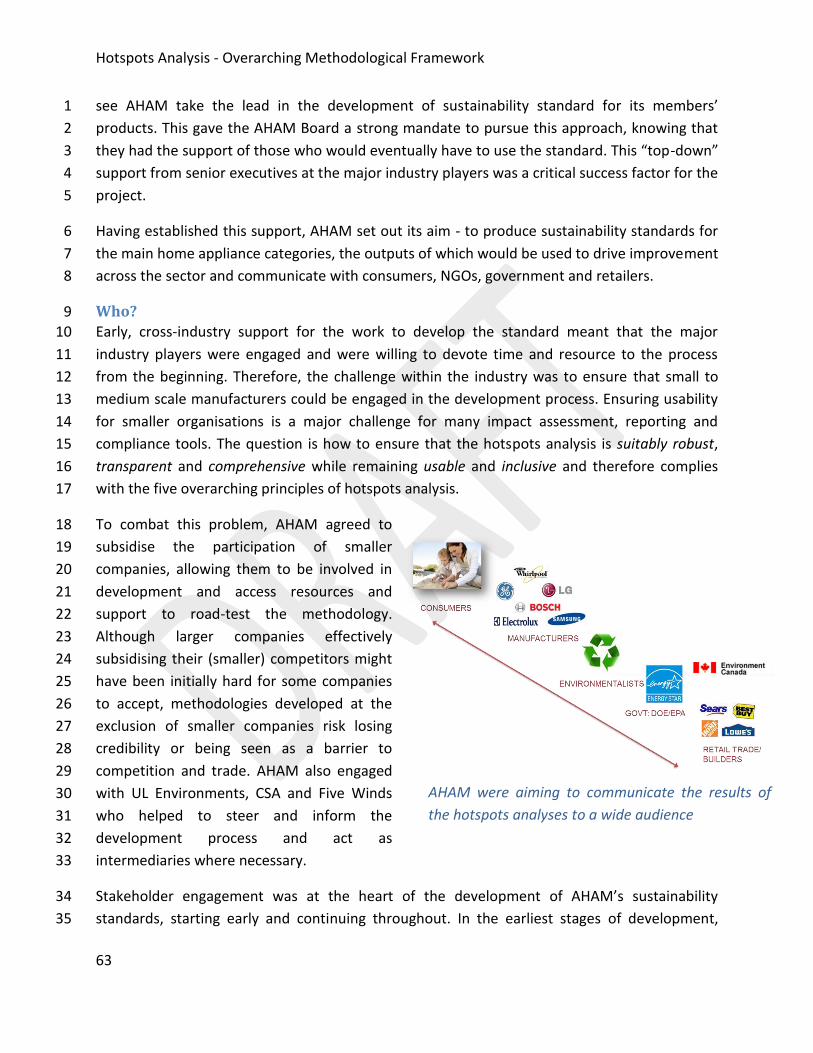
Hotspots Analysis - Overarching Methodological Framework
63
see AHAM take the lead in the development of sustainability standard for its members’ 1
products. This gave the AHAM Board a strong mandate to pursue this approach, knowing that 2
they had the support of those who would eventually have to use the standard. This “top-down” 3
support from senior executives at the major industry players was a critical success factor for the 4
project. 5
Having established this support, AHAM set out its aim - to produce sustainability standards for 6
the main home appliance categories, the outputs of which would be used to drive improvement 7
across the sector and communicate with consumers, NGOs, government and retailers. 8
Who? 9
Early, cross-industry support for the work to develop the standard meant that the major 10
industry players were engaged and were willing to devote time and resource to the process 11
from the beginning. Therefore, the challenge within the industry was to ensure that small to 12
medium scale manufacturers could be engaged in the development process. Ensuring usability 13
for smaller organisations is a major challenge for many impact assessment, reporting and 14
compliance tools. The question is how to ensure that the hotspots analysis is suitably robust, 15
transparent and comprehensive while remaining usable and inclusive and therefore complies 16
with the five overarching principles of hotspots analysis. 17
To combat this problem, AHAM agreed to 18
subsidise the participation of smaller 19
companies, allowing them to be involved in 20
development and access resources and 21
support to road-test the methodology. 22
Although larger companies effectively 23
subsidising their (smaller) competitors might 24
have been initially hard for some companies 25
to accept, methodologies developed at the 26
exclusion of smaller companies risk losing 27
credibility or being seen as a barrier to 28
competition and trade. AHAM also engaged 29
with UL Environments, CSA and Five Winds 30
who helped to steer and inform the 31
development process and act as 32
intermediaries where necessary. 33
Stakeholder engagement was at the heart of the development of AHAM’s sustainability 34
standards, starting early and continuing throughout. In the earliest stages of development, 35
AHAM were aiming to communicate the results of
the hotspots analyses to a wide audience
Hotspots Analysis - Overarching Methodological Framework
64
AHAM sought to have one-on-one discussions with a cross-section of stakeholders including the 1
US EPA, Environmental Defence Fund and the retailers association RILA to inform them of what 2
was being done by AHAM and why. 3
The early dialogue helped to establish what various stakeholders wanted the standard to 4
achieve and how that aligned with the initial goals of AHAM and its members. This in turn 5
helped to inform what might need to be included for the methodology to be viewed as a 6
success to different stakeholders. 7
AHAM also found that engagement “early and often” with stakeholders provided a sense of 8
ownership over what was being developed. This increased the pool of potential promoters and 9
users of the standard and also helped to limit the number of parallel developments, a key 10
concern for AHAM member companies who were responding to an ever-increasing number of 11
scorecards and requests for information. 12
AHAM went through a process of identifying the stakeholders and mapping these against the 13
standard development process to define key checkpoints for stakeholder input. Broadly, 14
AHAM’s key stakeholders fell into four groups - retailers, government, NGOs and a broad group 15
of other stakeholders. Another finding from AHAM was that there is value in engaging with 16
stakeholders which may not historically have a good relationship with the sector or that are 17
seen as hostile. These stakeholders may well not be persuaded to the sector’s viewpoint, but 18
including them creates awareness that different perspectives exist and demonstrates that these 19
have been considered during development. Ultimately, it is impossible to take on board all 20
stakeholder viewpoints so the key is to demonstrate which issues there is consensus on and to 21
transparently communicate where those developing the methodology have “agreed to 22
disagree” with stakeholders. Key elements of the stakeholder engagement process undertaken 23
by AHAM are shown in the diagram below. 24
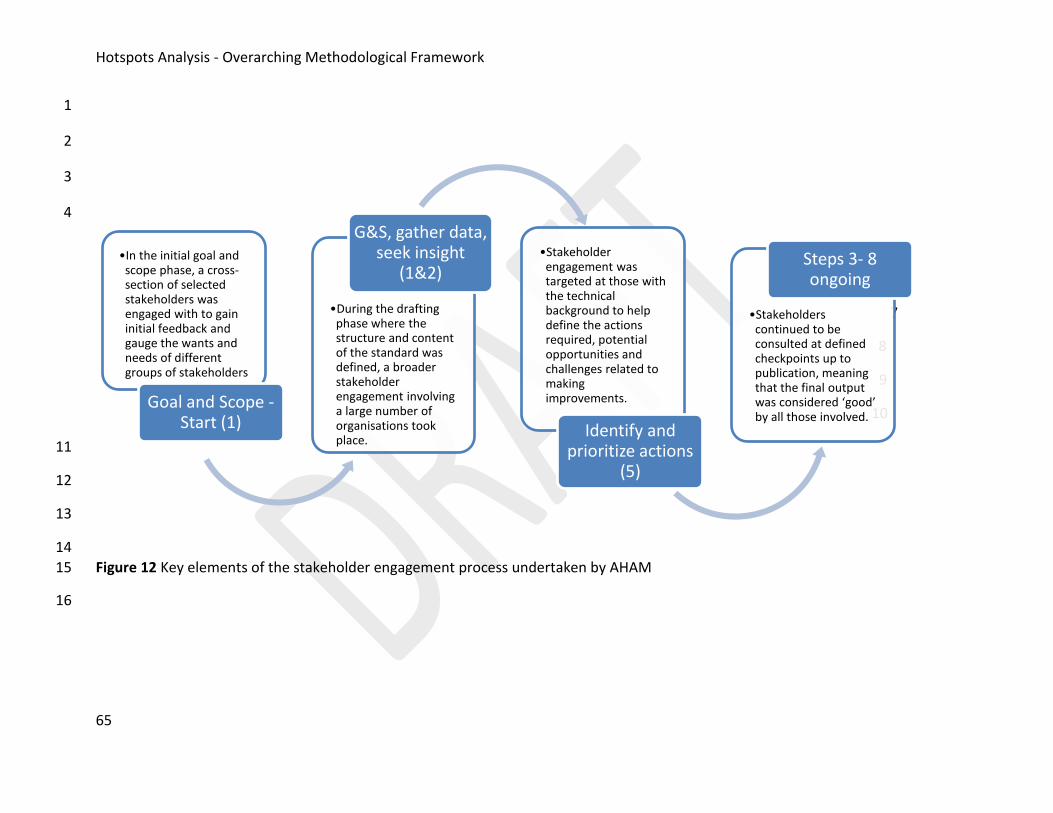
Hotspots Analysis - Overarching Methodological Framework
65
1
2
3
4
5
6
7
8
9
10
11
12
13
14
Figure 12 Key elements of the stakeholder engagement process undertaken by AHAM 15
16
•In the initial goal and scope phase, a cross-section of selected stakeholders was engaged with to gain initial feedback and gauge the wants and needs of different groups of stakeholders
Goal and Scope - Start (1)
•During the drafting phase where the structure and content of the standard was defined, a broader stakeholder engagement involving a large number of organisations took place.
G&S, gather data, seek insight
(1&2) •Stakeholder
engagement was targeted at those with the technical background to help define the actions required, potential opportunities and challenges related to making improvements.
Identify and prioritize actions
(5)
•Stakeholders continued to be consulted at defined checkpoints up to publication, meaning that the final output was considered ‘good’ by all those involved.
Steps 3- 8 ongoing
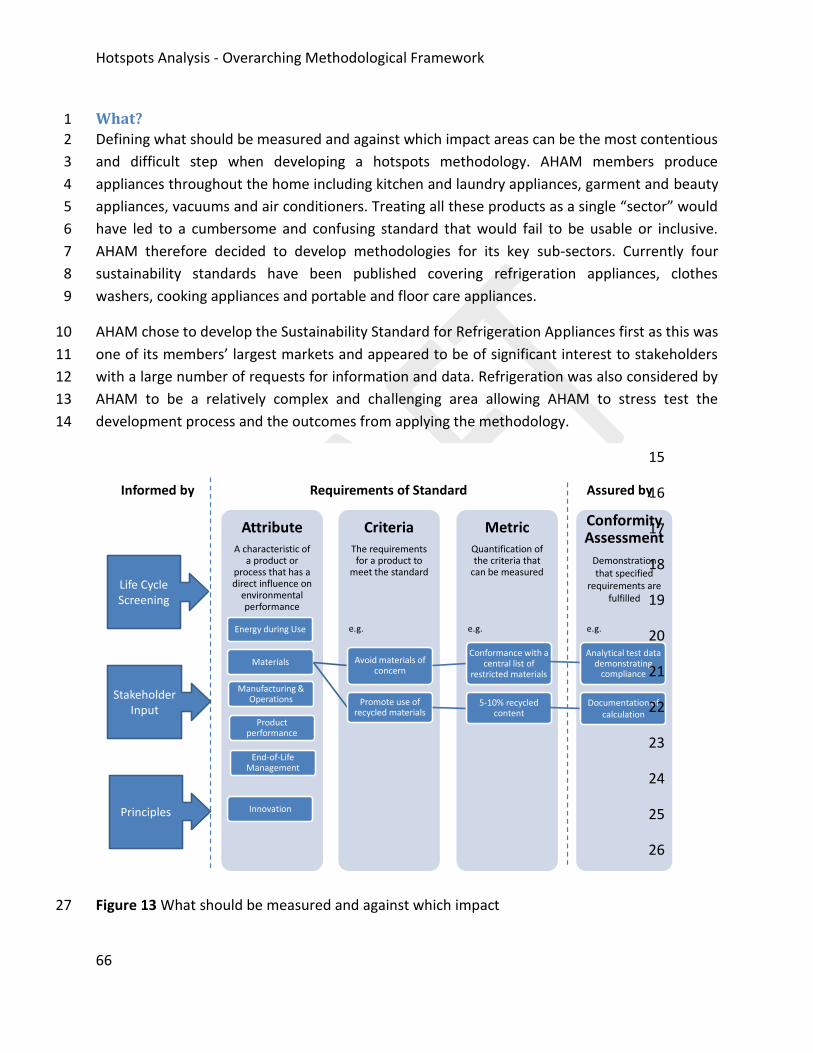
Hotspots Analysis - Overarching Methodological Framework
66
MetricQuantification of the criteria that
can be measured
CriteriaThe requirements for a product to
meet the standard
AttributeA characteristic of
a product or process that has a direct influence on
environmental performance
Materials Avoid materials of concern
Conformance with a central list of
restricted materials
Promote use of recycled materials
5-10% recycled content
Requirements of StandardInformed by Assured by
Conformity Assessment
Energy during Use
Manufacturing & Operations
End-of-Life Management
Innovation
e.g. e.g. e.g.
Demonstration that specified
requirements are fulfilled
Analytical test data demonstrating
compliance
Documentation of calculation
Stakeholder Input
Principles
Life Cycle Screening
Product performance
What? 1
Defining what should be measured and against which impact areas can be the most contentious 2
and difficult step when developing a hotspots methodology. AHAM members produce 3
appliances throughout the home including kitchen and laundry appliances, garment and beauty 4
appliances, vacuums and air conditioners. Treating all these products as a single “sector” would 5
have led to a cumbersome and confusing standard that would fail to be usable or inclusive. 6
AHAM therefore decided to develop methodologies for its key sub-sectors. Currently four 7
sustainability standards have been published covering refrigeration appliances, clothes 8
washers, cooking appliances and portable and floor care appliances. 9
AHAM chose to develop the Sustainability Standard for Refrigeration Appliances first as this was 10
one of its members’ largest markets and appeared to be of significant interest to stakeholders 11
with a large number of requests for information and data. Refrigeration was also considered by 12
AHAM to be a relatively complex and challenging area allowing AHAM to stress test the 13
development process and the outcomes from applying the methodology. 14
15
16
17
18
19
20
21
22
23
24
25
26
Figure 13 What should be measured and against which impact 27
Hotspots Analysis - Overarching Methodological Framework
67
During this phase, it is also important to define the scope of the assessment, for AHAM, this 1 meant including refrigerators, freezers and beverage/wine chillers, but excluding refrigerators 2 for the commercial market. The scope for the assessment was cradle-to-grave with the life cycle 3 of products divided into five stages: Raw Materials, Manufacturing, Packaging & Distribution, 4 Use and End-of-Life. 5
To decide which impact areas should be included AHAM looked to gather together a list of the 6
questions and requests for information various members had received about their refrigeration 7
appliances, using this to gauge which issues were material to their stakeholders. 8
In doing this AHAM recognised that although members had received hundreds of different 9
questions structured in different ways, these could be grouped into a relatively small set of key 10
areas, termed “attributes” covering materials, energy during use, manufacturing and 11
operations, product performance and end-of-life management. Within each of these areas, 12
AHAM then defined the individual impacts or “criteria” that it would be seeking to measure 13
against. For example, for materials the criteria were materials of concern, refrigerant and foam 14
blowing agents, product recycled content, packaging recycled content and the efficient use of 15
raw material resources. Each criteria was measured or quantified using a metric e.g. percentage 16
recycled content. The key attributes and criteria were validated with industry and external 17
stakeholders to ensure that these matched expectations and allowing for additional impacts to 18
be proposed (including emerging or exploratory impacts). 19
At the start of the project, AHAM had decided that they wanted their sustainability 20
methodologies to drive improvement in multiple impact areas, across the sector through the 21
use of the standard. This had a strong influence on the identification of impact areas as it 22
meant that AHAM was not interested in simply “rubber stamping” existing work on energy 23
efficiency, which was already covered by the existing Energy Star or CEE programs. 24
How? 25
Setting out to drive sector-wide improvement as described above did create a challenge in 26
building consensus between different industry players as to what “good” should look like and 27
where the bar for progress should be set. On one side, industry leaders advocated cutting-edge 28
targets, while on the other companies with less developed sustainability programs advocated a 29
more compliance-based approach. AHAM tackled this problem in two ways: 30
Defining prerequisites for criteria to establish a minimum requirement. For example, 31
establishing that a product’s refrigerant/blowing agent had to have a total GWP less 32
than 1835 kgCO2e or demonstrating compliance with all regulatory requirements for 33
water at manufacturing sites. Essentially these areas represented the minimum 34
standard in key areas. Without these, it was felt that any claims or progress 35
Hotspots Analysis - Overarching Methodological Framework
68
demonstrated in other areas would potentially be meaningless and the outputs of the 1
analyses might not be credible 2
Agreeing to allow different performance levels. This is a more unusual step in hotspots 3
methodologies as it suggests comparison, which is not generally the goal of a hotspots 4
analysis. For AHAM, however, it allowed different groups to use the standard at 5
different levels and ensured that manufacturers with less of a background in 6
sustainability were still engaged in the process and were able to demonstrate their 7
progress. 8
Metrics (the quantifiable indicators used to measure criteria or impacts) were informed by 9
literature, stakeholder input and input from Five Winds, UL and CSA who were all experienced 10
in the identification and use of sustainability metrics. 11
Where? 12
AHAM’s North American focus defined the geographical scope of the standard and meant that 13
North American-specific methods and indicators were generally most relevant. AHAM explored 14
methods outside of the North American to ensure that the best and most relevant approaches 15
were included in the standard, with for example the EU’s RoHS directive used when considering 16
hazardous substances. AHAM also considered potential supply chain issues that could have 17
occurred outside North America, particularly with regards to safe disassembly and responsible 18
disposal of products at end-of-life. 19
When? 20
For AHAM timeframes for conducting a review of an analysis were strongly influenced by 21
product design lifecycles and the timeframe for actions. New products influenced by 22
improvement actions might only reach the market several years later depending on the product 23
type, meaning that a total review on a yearly basis would not provide any information on the 24
effectiveness of the actions taken. AHAM also considered that some actions or improvements 25
might not occur within the first revision. This would particularly be the case for “binary” or 26
absolute improvements such as the complete removal of a substance from products, whereas 27
other areas would yield continuous improvement (e.g. reducing GHG emissions). A third aspect 28
was considering the timeframes of regulations or standards linked into the methodology and 29
how these might influence the hotspots and actions. Timeframes for update are also described 30
in step 8. 31
Step 2: Gather data, seek expert insight, knowledge building and analysis 32
AHAM’s smaller manufacturers faced the greatest challenges in data collection, often lacking 33
the systems and human resources possessed by the larger manufacturers. As described earlier, 34
AHAM agreed to subsidise the participation of smaller companies to ensure inclusivity within 35
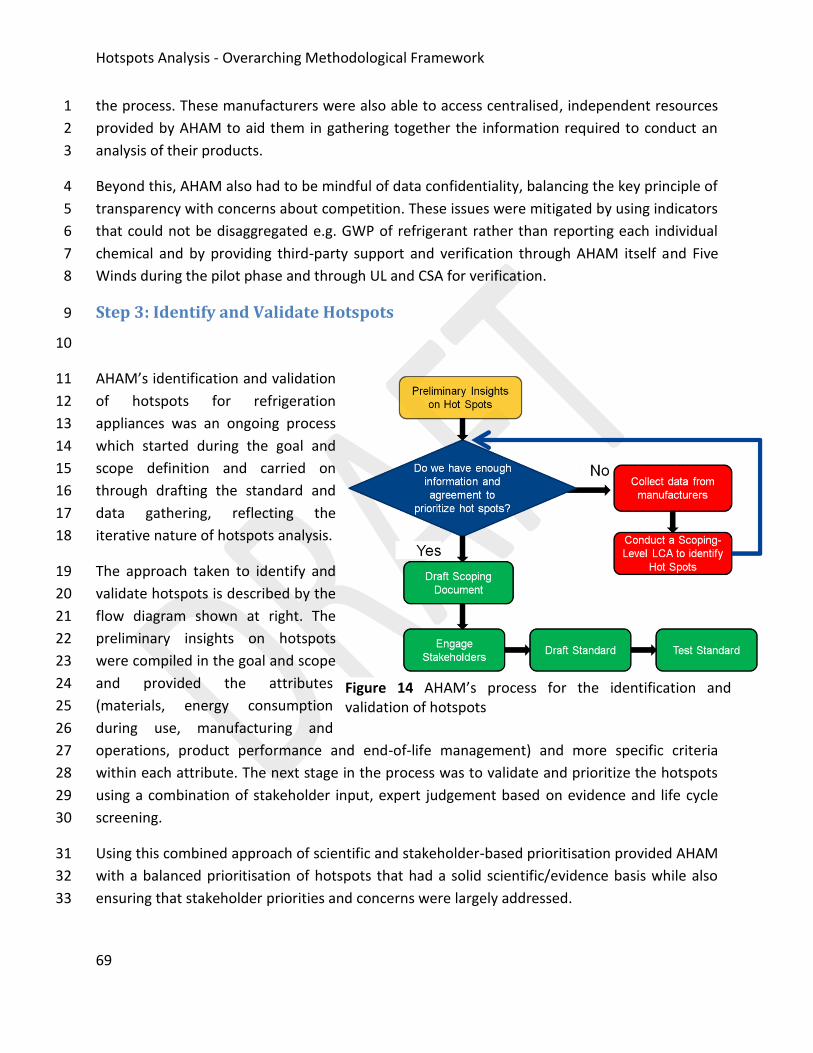
Hotspots Analysis - Overarching Methodological Framework
69
the process. These manufacturers were also able to access centralised, independent resources 1
provided by AHAM to aid them in gathering together the information required to conduct an 2
analysis of their products. 3
Beyond this, AHAM also had to be mindful of data confidentiality, balancing the key principle of 4
transparency with concerns about competition. These issues were mitigated by using indicators 5
that could not be disaggregated e.g. GWP of refrigerant rather than reporting each individual 6
chemical and by providing third-party support and verification through AHAM itself and Five 7
Winds during the pilot phase and through UL and CSA for verification. 8
Step 3: Identify and Validate Hotspots 9
10
AHAM’s identification and validation 11
of hotspots for refrigeration 12
appliances was an ongoing process 13
which started during the goal and 14
scope definition and carried on 15
through drafting the standard and 16
data gathering, reflecting the 17
iterative nature of hotspots analysis. 18
The approach taken to identify and 19
validate hotspots is described by the 20
flow diagram shown at right. The 21
preliminary insights on hotspots 22
were compiled in the goal and scope 23
and provided the attributes 24
(materials, energy consumption 25
during use, manufacturing and 26
operations, product performance and end-of-life management) and more specific criteria 27
within each attribute. The next stage in the process was to validate and prioritize the hotspots 28
using a combination of stakeholder input, expert judgement based on evidence and life cycle 29
screening. 30
Using this combined approach of scientific and stakeholder-based prioritisation provided AHAM 31
with a balanced prioritisation of hotspots that had a solid scientific/evidence basis while also 32
ensuring that stakeholder priorities and concerns were largely addressed. 33
Figure 14 AHAM’s process for the identification and validation of hotspots
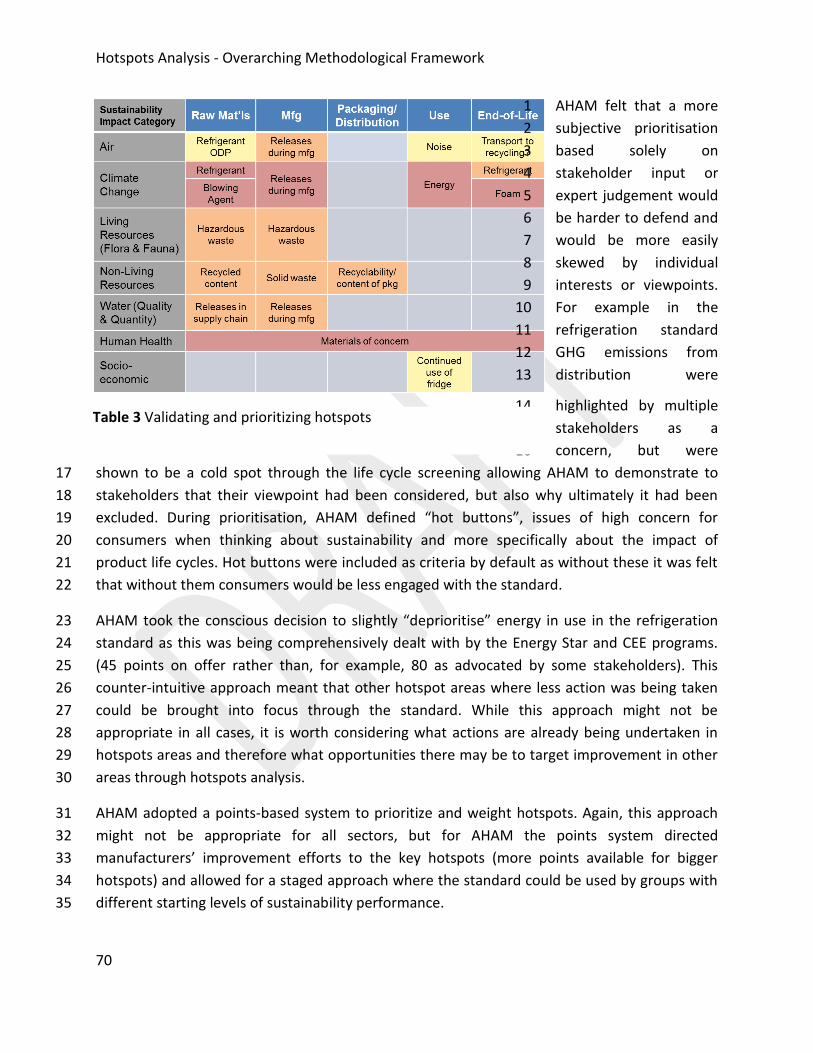
Hotspots Analysis - Overarching Methodological Framework
70
AHAM felt that a more 1
subjective prioritisation 2
based solely on 3
stakeholder input or 4
expert judgement would 5
be harder to defend and 6
would be more easily 7
skewed by individual 8
interests or viewpoints. 9
For example in the 10
refrigeration standard 11
GHG emissions from 12
distribution were 13
highlighted by multiple 14
stakeholders as a 15
concern, but were 16
shown to be a cold spot through the life cycle screening allowing AHAM to demonstrate to 17
stakeholders that their viewpoint had been considered, but also why ultimately it had been 18
excluded. During prioritisation, AHAM defined “hot buttons”, issues of high concern for 19
consumers when thinking about sustainability and more specifically about the impact of 20
product life cycles. Hot buttons were included as criteria by default as without these it was felt 21
that without them consumers would be less engaged with the standard. 22
AHAM took the conscious decision to slightly “deprioritise” energy in use in the refrigeration 23
standard as this was being comprehensively dealt with by the Energy Star and CEE programs. 24
(45 points on offer rather than, for example, 80 as advocated by some stakeholders). This 25
counter-intuitive approach meant that other hotspot areas where less action was being taken 26
could be brought into focus through the standard. While this approach might not be 27
appropriate in all cases, it is worth considering what actions are already being undertaken in 28
hotspots areas and therefore what opportunities there may be to target improvement in other 29
areas through hotspots analysis. 30
AHAM adopted a points-based system to prioritize and weight hotspots. Again, this approach 31
might not be appropriate for all sectors, but for AHAM the points system directed 32
manufacturers’ improvement efforts to the key hotspots (more points available for bigger 33
hotspots) and allowed for a staged approach where the standard could be used by groups with 34
different starting levels of sustainability performance. 35
Table 3 Validating and prioritizing hotspots
Hotspots Analysis - Overarching Methodological Framework
71
In any methodology, not all impacts or indicators proposed by stakeholders can be included. To 1
help mitigate these concerns, AHAM allowed for an additional “innovation” attribute for 2
manufacturers who could “…demonstrate innovation in product features and manufacturer 3
programs and policies that demonstrate environmental performance improvement that is 4
exceptional, measurable, and beyond the requirements and criteria covered within this 5
Standard”. These had to be validated through third party verification to ensure that they were 6
defensible and in the spirit of the standard. Allowing a level of flexibility in a hotspots 7
methodology can increase the usability of the methodology while still respecting its core aims 8
and values. 9
Step 4: Responding to data and stakeholder gaps 10
As with step 3, data and stakeholder gaps were dealt with on an ongoing basis during the 11
development process. Data gaps were tackled using a range of measures including the use of 12
life cycle screening studies and by working collaboratively between AHAM, its members and 13
stakeholders involved in the process such as retailers to help identify and collect data in new 14
areas or from new organisations. 15
Stakeholder identification had taken place from early on in the development process, with 16
additional potentially valuable stakeholders added during the process. Key additional 17
stakeholders included later in the process included blowing agent and refrigerant 18
manufacturers who were able to help AHAM and its members understand the technical aspects 19
of these chemicals and the potential pathways for maintaining product performance while 20
reducing impacts. 21
AHAM also accepted that the final methodology would still not be able to include everything 22
and that some impacts might have to be considered for inclusion in future versions of the 23
standard. For example, despite long and detailed discussions about social impacts, AHAM did 24
not include any quantitative social impacts as they did not feel that the metrics/indicators were 25
sufficiently well developed and there was no consensus across stakeholders as to what should 26
be included and how it should be measured. Social impacts including human rights, labour 27
practices and consumer health and safety were included through criteria related to corporate 28
policies and governance, with the potential to expand these criteria in future versions. 29
AHAM’s approach to identifying criteria for inclusion in the standard was characterised by three 30
steps: 31
Seek consensus where possible on criteria; 32
“Agree to disagree” where no consensus is reached and communicate 33
evidence/reasoning for proposed approach; 34
Hotspots Analysis - Overarching Methodological Framework
72
For areas where no approach can be found, communicate the exclusion transparently to 1
stakeholders and record as a potential future inclusion. 2
Step 5: Identify and prioritize actions 3
Actions based on the identified hotspots (characterised by attributes and criteria) were 4
developed between AHAM, its members and key technical stakeholders. Prioritisation in the 5
form of weighting was provided by the points system described previously. The structure of the 6
standard was designed to encourage improvement in all the key attributes from one generation 7
of products to the next. Actions and requirements included in the standard fell into two broad 8
categories: 9
Binary actions such as implementing a policy or providing proof of an existing program; 10
Actions resulting in continuous improvements, such as demonstrating year-on-year 11
progress on GHG emissions at manufacturing sites or improving energy efficiency of the 12
product as recorded through the Energy Star program. 13
When identifying the potential actions and measures of progress AHAM sought detailed 14
technical input from manufacturers and actors in the supply chain to understand the potential 15
opportunities and limitations, ensuring that the actions proposed were ambitious, but 16
remained feasible. This was particularly the case when targeting improvements in blowing 17
agents and refrigerants or in manufacturing processes. Technical experts were also able to 18
provide guidance on the timescales for potential improvements, which in turn informed the 19
timescales for revision and review of the analysis. 20
Step 6: Review initial findings 21
Having identified hotspots, potential actions, gaps in data and activity, the analysis and initial 22
findings should be reviewed with experts and key stakeholders. The purpose of the review 23
should be to ensure that the analysis is fit for purpose. This means that: it is consistent with the 24
goal and scope; that the impact categories have been assessed appropriately; and that 25
appropriate actions – and those that are able to undertake them - have been identified. 26
AHAM road tested the methodology across the refrigeration sector with analyses of several 27
different product types being conducted by a range of manufacturers. This helped to identify 28
common data gaps and helped to understand any practical challenges in applying the 29
methodology. AHAM received valuable feedback on the actions suggested, ensuring that these 30
could be understood and applied in the real world. AHAM circulated the document to a wide 31
group of external stakeholders allowing for open and comprehensive feedback on the draft 32
methodology. Webinars were organised with key stakeholders (such as those engaged with at 33

Hotspots Analysis - Overarching Methodological Framework
73
the start of the goal and scope phase) to describe the initial findings, answer questions and 1
collect detailed feedback. 2
Step 7: Presentation and communication 3
AHAM wanted to create 4
an action-oriented 5
methodology the 6
outputs of which could 7
be used to communicate 8
progress to its 9
stakeholders across a 10
diverse range of 11
attributes. AHAM 12
defined this aim during 13
the goal and scope 14
phase, meaning that the 15
methodology was developed with a clear communications goal from the beginning. 16
AHAM’s focus was on ensuring that the final output was relevant and understandable to 17
retailers and consumers. AHAM decided not to use an EPD-style list of indicators, which was 18
considered inaccessible to non-experts. Instead, AHAM favoured a certification approach, 19
complemented by communication of progress in individual areas appropriate to the target 20
audience. 21
Manufacturers conducting assessments of their products using the methodology are awarded a 22
multi-attribute sustainability certification through independent third-party verification. The 23
verification process requires proof of documentation and an annual refresh of key elements of 24
the assessment such as the numbers used in modelling and compliance documentation, with a 25
full re-certification down to a factory level 26
every three years. The verification process 27
ensures that any claims of progress are robust 28
and verifiable. AHAM has worked with UL to 29
produce an environmentally preferred logo 30
which is being trailled with freezers to 31
communicate to consumers which products 32
have been produced following the standard. 33
Beyond this, the detailed nature of the 34
methodology allows manufacturers to 35
Figure 15 The certificate of compliance
Hotspots Analysis - Overarching Methodological Framework
74
communicate outputs from the analysis with a level of detail appropriate to the target 1
audience. For example, when communicating to retailers with highly developed sustainability 2
programs AHAM members can give detailed figures and show multi-attribute heat maps. 3
Conversely, when communicating with groups less engaged in sustainability, AHAM members 4
might choose to show percentage improvement in one or two key areas or an increase in the 5
number of “points” from one generation to the next. 6
Step 8: Revisit hotspots and actions identified 7
AHAM recognised that criteria would be improved at different rates, with some areas showing 8
continuous improvement and others taking longer to improve. This was reflected in the 9
requirements for verification with aspects such as model values for calculating GHG emissions 10
refreshed annually, while factory-level data which is more stable, re-submitted every three 11
years. 12
Moving forward AHAM have put together an action plan outlining how the standard and 13
methods of communication should respond to various scenarios (such as changing demands 14
from retailers or regulatory changes). These “triggers to action” offer AHAM and its members a 15
clear vision for the future of the standard and the communication of its outputs as the 16
marketplace evolves. 17
18
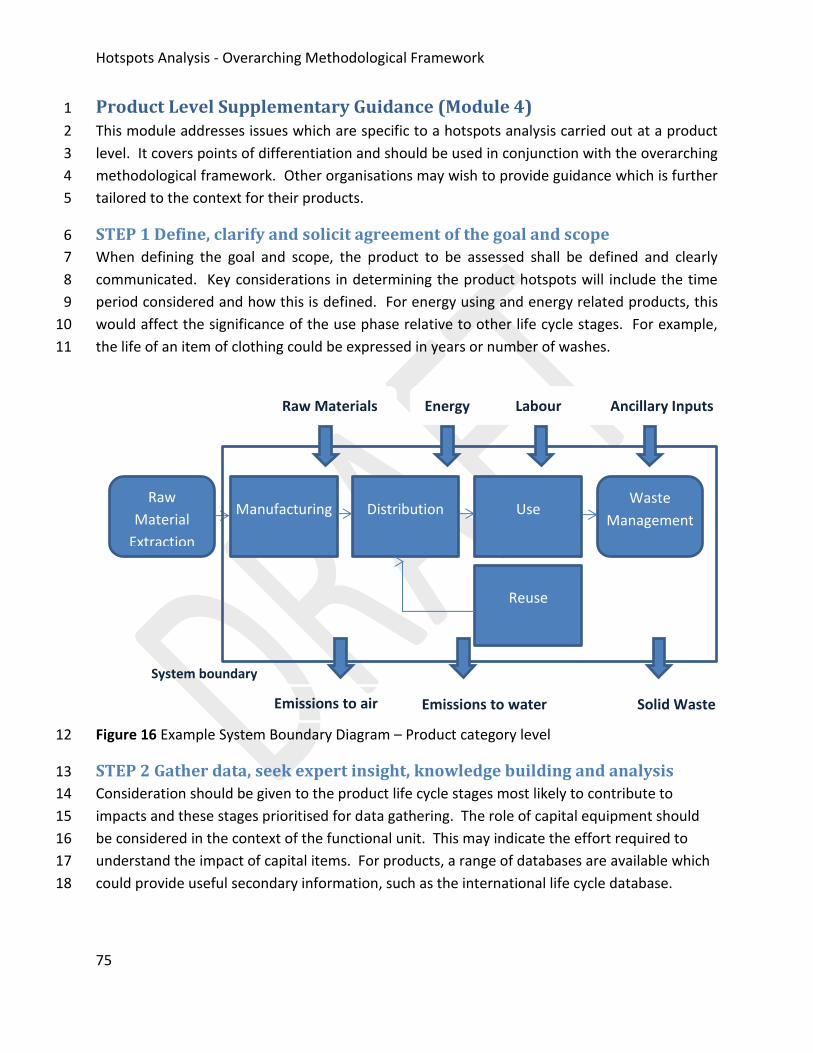
Hotspots Analysis - Overarching Methodological Framework
75
Product Level Supplementary Guidance (Module 4) 1
This module addresses issues which are specific to a hotspots analysis carried out at a product 2
level. It covers points of differentiation and should be used in conjunction with the overarching 3
methodological framework. Other organisations may wish to provide guidance which is further 4
tailored to the context for their products. 5
STEP 1 Define, clarify and solicit agreement of the goal and scope 6
When defining the goal and scope, the product to be assessed shall be defined and clearly 7
communicated. Key considerations in determining the product hotspots will include the time 8
period considered and how this is defined. For energy using and energy related products, this 9
would affect the significance of the use phase relative to other life cycle stages. For example, 10
the life of an item of clothing could be expressed in years or number of washes. 11
Figure 16 Example System Boundary Diagram – Product category level 12
STEP 2 Gather data, seek expert insight, knowledge building and analysis 13
Consideration should be given to the product life cycle stages most likely to contribute to 14
impacts and these stages prioritised for data gathering. The role of capital equipment should 15
be considered in the context of the functional unit. This may indicate the effort required to 16
understand the impact of capital items. For products, a range of databases are available which 17
could provide useful secondary information, such as the international life cycle database. 18
Raw
Material
Extraction
Manufacturing Distribution Use Waste
Management
Reuse
Raw Materials Energy Labour Ancillary Inputs
System boundary
Emissions to air Emissions to water Solid Waste

Hotspots Analysis - Overarching Methodological Framework
76
STEP 5 Identify and prioritize actions 1
Product hotspots analysis is likely to identify hotspots which are shared by different 2
stakeholders along value chains. In considering actions, the impact of collaborative and stand-3
alone actions should be considered. For example, it may be that a hotspot occurs during the 4
use phase of a product. This may be outside of the control of organisations involved in the 5
hotspot analysis, but could be within their influence. A range of means of influence should be 6
considered. These could include options around design, instructions, public communications 7
campaigns and managing product waste at end of life. 8
9
. 10
11
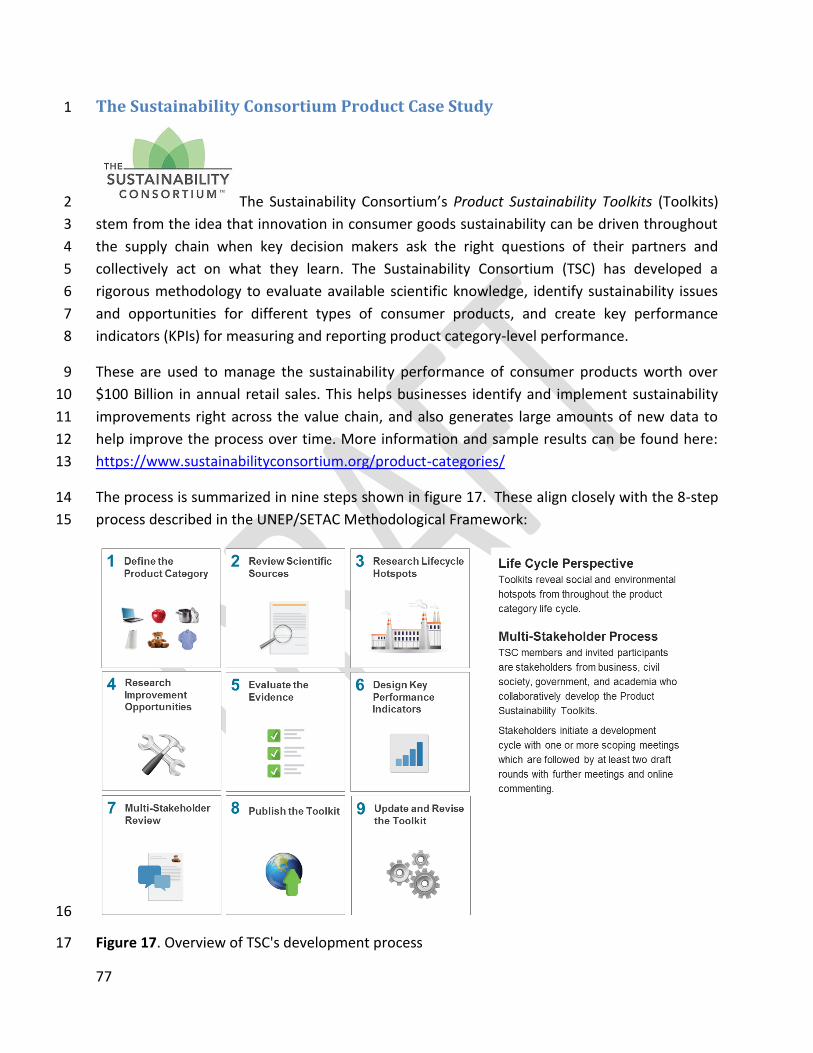
77
The Sustainability Consortium Product Case Study 1
The Sustainability Consortium’s Product Sustainability Toolkits (Toolkits) 2
stem from the idea that innovation in consumer goods sustainability can be driven throughout 3
the supply chain when key decision makers ask the right questions of their partners and 4
collectively act on what they learn. The Sustainability Consortium (TSC) has developed a 5
rigorous methodology to evaluate available scientific knowledge, identify sustainability issues 6
and opportunities for different types of consumer products, and create key performance 7
indicators (KPIs) for measuring and reporting product category-level performance. 8
These are used to manage the sustainability performance of consumer products worth over 9
$100 Billion in annual retail sales. This helps businesses identify and implement sustainability 10
improvements right across the value chain, and also generates large amounts of new data to 11
help improve the process over time. More information and sample results can be found here: 12
https://www.sustainabilityconsortium.org/product-categories/ 13
The process is summarized in nine steps shown in figure 17. These align closely with the 8-step 14
process described in the UNEP/SETAC Methodological Framework: 15
16
Figure 17. Overview of TSC's development process 17
78
1
1. Define the product category (UNEP-SETAC Stage 1) 2
Each Toolkit addresses a unique product category, e.g., computers, tomatoes, or plush toys. In 3
this sense TSC’s work is different from other initiatives that may focus at an organizational or 4
individual product level sustainability. This level of specificity allows the methodology to be 5
replicable and scalable across a large portion of the consumer goods industry and produce 6
useful and meaningful metrics. The scope of a particular product category is determined by 7
industry norms, the similarity of supply chains, and feedback from stakeholders. 8
2. Review scientific sources (UNEP-SETAC Stage 2) 9
After a product category is defined, information on its sustainability throughout its life cycle is 10
collected from scientific publications and other sources through staff research and consultation 11
with members and other experts. Only sources that are transparent (i.e., available to all at 12
reasonable cost and effort) can be used to support the Toolkits. Life cycle assessments (LCAs) 13
are particularly sought after because they can directly compare impacts across the product 14
category life cycle 15
Each individual source is assessed for its source quality based on how its review process and the 16
type of data (primary, secondary) used to draw its conclusions. TSC uses its custom-built Error! 17
eference source not found. to organize all of the information captured or created in the 18
research process starting with the scientific sources being referenced. 19
20

79
1
Review Type
Independent
Reviewed by a third
party of three or more
people not involved in
the execution of the
study and without a
conflict of interest
resulting from their
position. (ISO 14025-
2006)
Editorial
One or two
independent
reviewers
have assessed
the work.
Internal
One or more
non-
independent
reviewers
have assessed
the work.
None
Review type is
not
independent,
editorial, or
internal. Data Type
Primary
Collected by the
researcher or
group that also
analyzes the
data.
High Medium Medium Low
Secondary
Collected by one
party and then
analyzed by a
different party.
High Medium Medium Low
None
No primary or
secondary data
are used.
Medium Low Low Low
Figure 18. TSC Source Quality Matrix is used to assign each publication a quality value for use in 2
later decisions 3
4
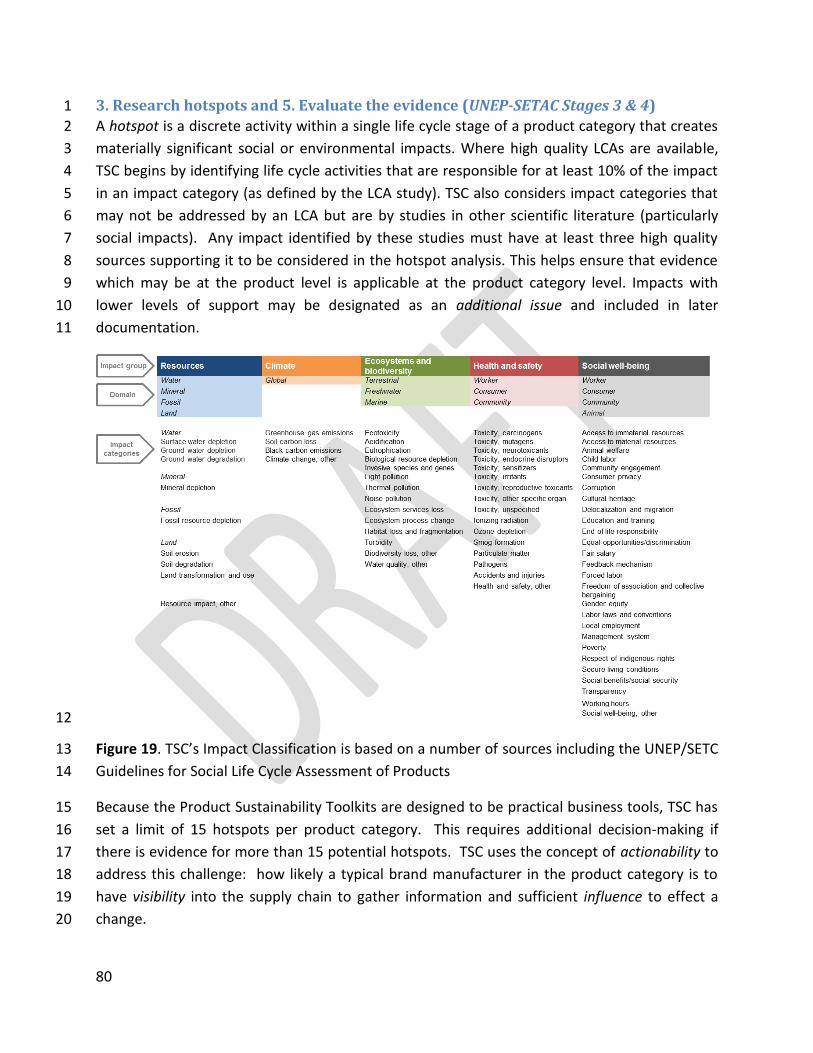
80
3. Research hotspots and 5. Evaluate the evidence (UNEP-SETAC Stages 3 & 4) 1
A hotspot is a discrete activity within a single life cycle stage of a product category that creates 2
materially significant social or environmental impacts. Where high quality LCAs are available, 3
TSC begins by identifying life cycle activities that are responsible for at least 10% of the impact 4
in an impact category (as defined by the LCA study). TSC also considers impact categories that 5
may not be addressed by an LCA but are by studies in other scientific literature (particularly 6
social impacts). Any impact identified by these studies must have at least three high quality 7
sources supporting it to be considered in the hotspot analysis. This helps ensure that evidence 8
which may be at the product level is applicable at the product category level. Impacts with 9
lower levels of support may be designated as an additional issue and included in later 10
documentation. 11
12
Figure 19. TSC’s Impact Classification is based on a number of sources including the UNEP/SETC 13
Guidelines for Social Life Cycle Assessment of Products 14
Because the Product Sustainability Toolkits are designed to be practical business tools, TSC has 15
set a limit of 15 hotspots per product category. This requires additional decision-making if 16
there is evidence for more than 15 potential hotspots. TSC uses the concept of actionability to 17
address this challenge: how likely a typical brand manufacturer in the product category is to 18
have visibility into the supply chain to gather information and sufficient influence to effect a 19
change. 20
81
The most basic requirement of actionability is that there are one or more improvement 1
opportunities documented in published literature (Step 4 in Figure 17) that demonstrate brand 2
manufacturers can take meaningful action on the hotspot. Actionability is further assessed 3
through stakeholder input. In an iterative process with the creation of the Key Performance 4
Indicators, potential hotspots that are highly correlated or would addressed through a single 5
action or metric can be combined. 6
4. Research improvement Opportunities (UNEP-SETAC Stage 5) 7
Improvement opportunities are specific actions that manufacturers can take to address the 8
hotspots. These are identified from the same scientific literature as the hotspots. 9
6. Key Performance Indicators 10
The creation of KPIs is the primary driver for TSC’s hotspot analysis. Each of the 15 KPIs in a 11
Toolkit allows manufacturers to report their performance against one or more of the life cycle 12
hotspots. A variety of metric types are used, including some direct impact metrics such as 13
greenhouse gas emissions intensity, the percentage of certified materials purchased, and 14
occasionally qualitative response option scales 15
7. Multi-Stakeholder Review (UNEP-SETAC Stage 6) 16
Members of The Sustainability Consortium are stakeholders from business, civil society, 17
government, and academia who collaboratively develop the Product Sustainability Toolkits. 18
The process for developing high quality Toolkits relies heavily on regular workshops, 19
discussions, and commenting in which all TSC members and a wide selection of other external 20
stakeholders can participate. 21
22
8. Publish the Toolkit (UNEP-SETAC Stage 7) 23
The Toolkit is published and the Key Performance Indicators are available for manufacturer to 24
customer reporting 25
9. Update and Revise the Toolkit (UNEP-SETAC Stage 8) 26
At least every two years, each Toolkit undergoes a review by TSC researchers and Members to 27
assess whether an update is required. New information often becomes available from new 28
research, feedback from users, or analysis of reported results. TSC aims to balance the need for 29
continual improvement with the value of having static questions and consistent reporting over 30
time. 31
More information and sample results can be found here: 32
https://www.sustainabilityconsortium.org/product-categories/ 33
34
82
References 1
2
ANNEXES 3
Annex 1a: Workshops and webinars organized by the Project Group 4
Two, one day interactive workshops were undertaken on the 16th and 17th of June 2016, for 5
each of the product and sector level of hotspots analysis, to review, discuss and receive 6
stakeholder inputs and feedback on the draft methodological framework, as well as the draft 7
guidelines on the appropriate use and communication of sustainability information derived 8
from hotspots analysis. 20 participants attended on the 16th and 21 on the 17th June. 9
Following on from the workshops three, three hour webinars were held in July (14, 18 and 21 10
July 2016) to solicit additional input and feedback from key experts and stakeholders unable to 11
attend the Paris workshops: 12
Sign up to webinars was as follows: 13
• 14 July: 20 sign-ups 14
• 18 July: 18 sign-ups 15
• 21 July: 19 sign-ups 16
17
Annex 1b: List of stakeholders involved through interaction 18
TO BE COMPLETED AT THE END OF THE CONSULTATION 19
20
83
Annex 2 Methodology used for the Phase 1 study: 1
Phase 1 of the project, which occurred between May and December 2014, involved the 2
identification and mapping of existing hotspots studies, initiatives and methodologies from 3
around the world in order to better understand the: 4
Range and diversity of approaches to hotspots analysis in existence and how they 5 are being applied; 6
Suitability of different hotspots analysis methodologies for use at different scales or 7 levels of granularity (e.g., at the national-, sector- or product category-level); 8
Commonalities and differences among these different methodologies and the 9 reasons behind them, including key methodological components and process steps; 10
Body of best practice that already exists around methodology development and 11 application; 12
Who is developing and using these methodologies and the business models behind 13 them; 14
Topics, sectors of the economy and product categories they are being applied to; 15
The range of outputs, findings, outcomes and impacts that result from these studies, 16 initiatives and methodologies – and their impact; and 17
Opportunities to develop a common global approach to hotspots analysis that is 18 flexible enough to be applied at a range of different scales and levels of granularity 19 and accuracy based on user needs and budget. 20
21
In order to achieve these objectives the following research methodology and process has been 22
used to identify, short-list and analyse hotspots analysis methodologies: 23
Step 1: Shortlisting and screening of existing hotspots analysis methodologies for preliminary 24
selection: 25
This included the development of selection criteria, desktop research and an online survey of 26
methodology developers and users to help identify, validate and shortlist existing hotspots 27
analysis methodologies. 28
Step 2: Further review of selected methodologies for secondary selection: 29
This step included the application of the selection criteria to the preliminary list of hotspots 30
analysis to shortlist the 44 methodologies identified to meet the project sponsors quota to 31
include 3 national, 5 sector level and 10 product category-level methodologies for more 32
detailed analysis. Further, a review of the popularity of different hotspots analysis approaches 33
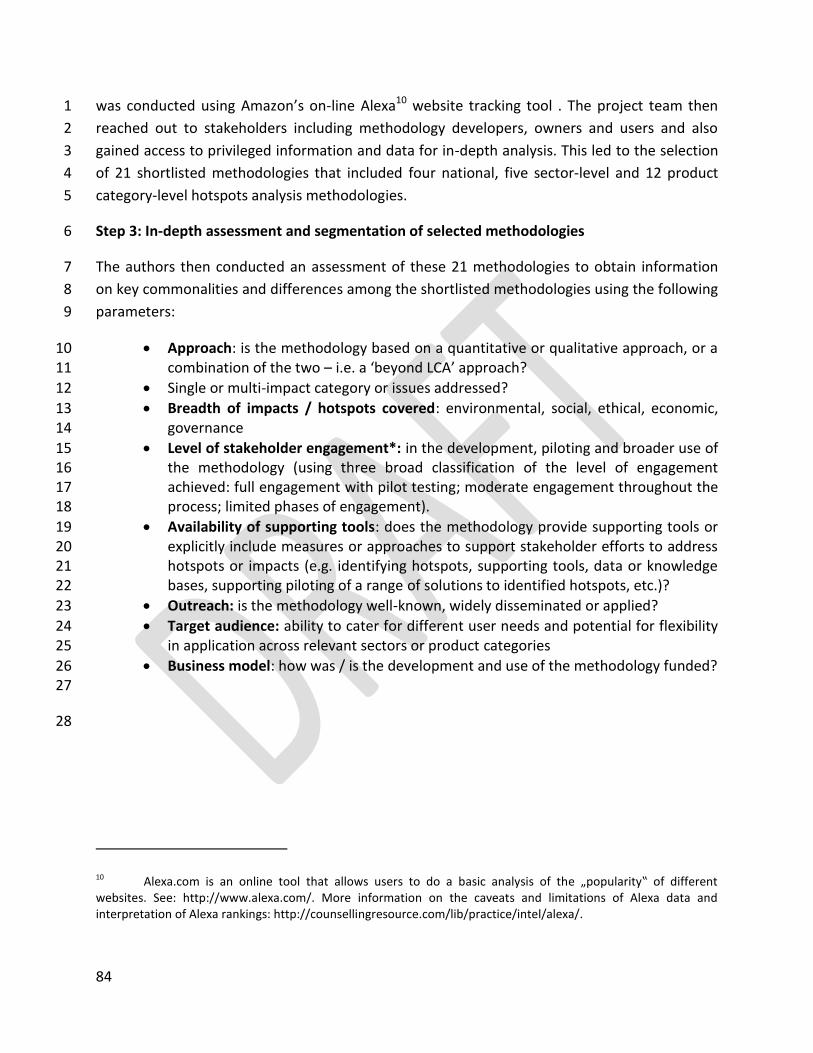
84
was conducted using Amazon’s on-line Alexa10 website tracking tool . The project team then 1
reached out to stakeholders including methodology developers, owners and users and also 2
gained access to privileged information and data for in-depth analysis. This led to the selection 3
of 21 shortlisted methodologies that included four national, five sector-level and 12 product 4
category-level hotspots analysis methodologies. 5
Step 3: In-depth assessment and segmentation of selected methodologies 6
The authors then conducted an assessment of these 21 methodologies to obtain information 7
on key commonalities and differences among the shortlisted methodologies using the following 8
parameters: 9
Approach: is the methodology based on a quantitative or qualitative approach, or a 10 combination of the two – i.e. a ‘beyond LCA’ approach? 11
Single or multi-impact category or issues addressed? 12
Breadth of impacts / hotspots covered: environmental, social, ethical, economic, 13 governance 14
Level of stakeholder engagement*: in the development, piloting and broader use of 15 the methodology (using three broad classification of the level of engagement 16 achieved: full engagement with pilot testing; moderate engagement throughout the 17 process; limited phases of engagement). 18
Availability of supporting tools: does the methodology provide supporting tools or 19 explicitly include measures or approaches to support stakeholder efforts to address 20 hotspots or impacts (e.g. identifying hotspots, supporting tools, data or knowledge 21 bases, supporting piloting of a range of solutions to identified hotspots, etc.)? 22
Outreach: is the methodology well-known, widely disseminated or applied? 23
Target audience: ability to cater for different user needs and potential for flexibility 24 in application across relevant sectors or product categories 25
Business model: how was / is the development and use of the methodology funded? 26 27
28
10 Alexa.com is an online tool that allows users to do a basic analysis of the „popularity‟ of different websites. See: http://www.alexa.com/. More information on the caveats and limitations of Alexa data and interpretation of Alexa rankings: http://counsellingresource.com/lib/practice/intel/alexa/.
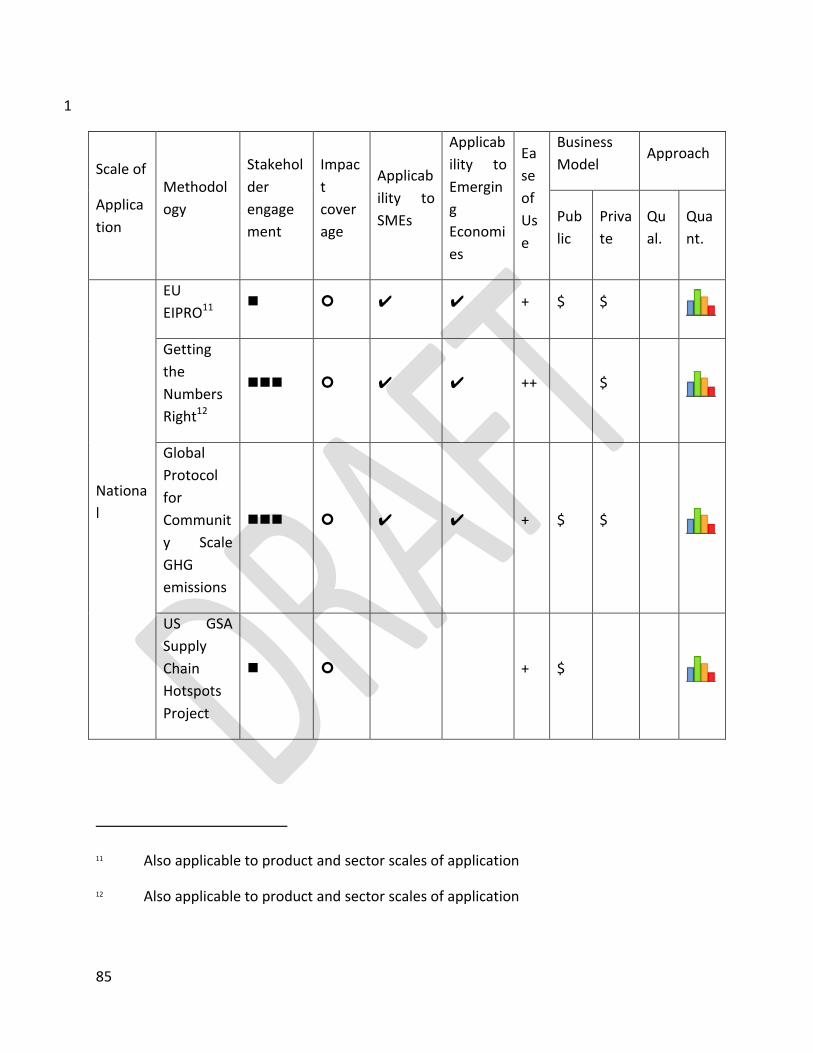
85
1
Scale of
Applica
tion
Methodol
ogy
Stakehol
der
engage
ment
Impac
t
cover
age
Applicab
ility to
SMEs
Applicab
ility to
Emergin
g
Economi
es
Ea
se
of
Us
e
Business
Model Approach
Pub
lic
Priva
te
Qu
al.
Qua
nt.
Nationa
l
EU
EIPRO11 ✔ ✔ + $ $
Getting
the
Numbers
Right12
✔ ✔ ++ $
Global
Protocol
for
Communit
y Scale
GHG
emissions
✔ ✔ + $ $
US GSA
Supply
Chain
Hotspots
Project
+ $
11 Also applicable to product and sector scales of application
12 Also applicable to product and sector scales of application
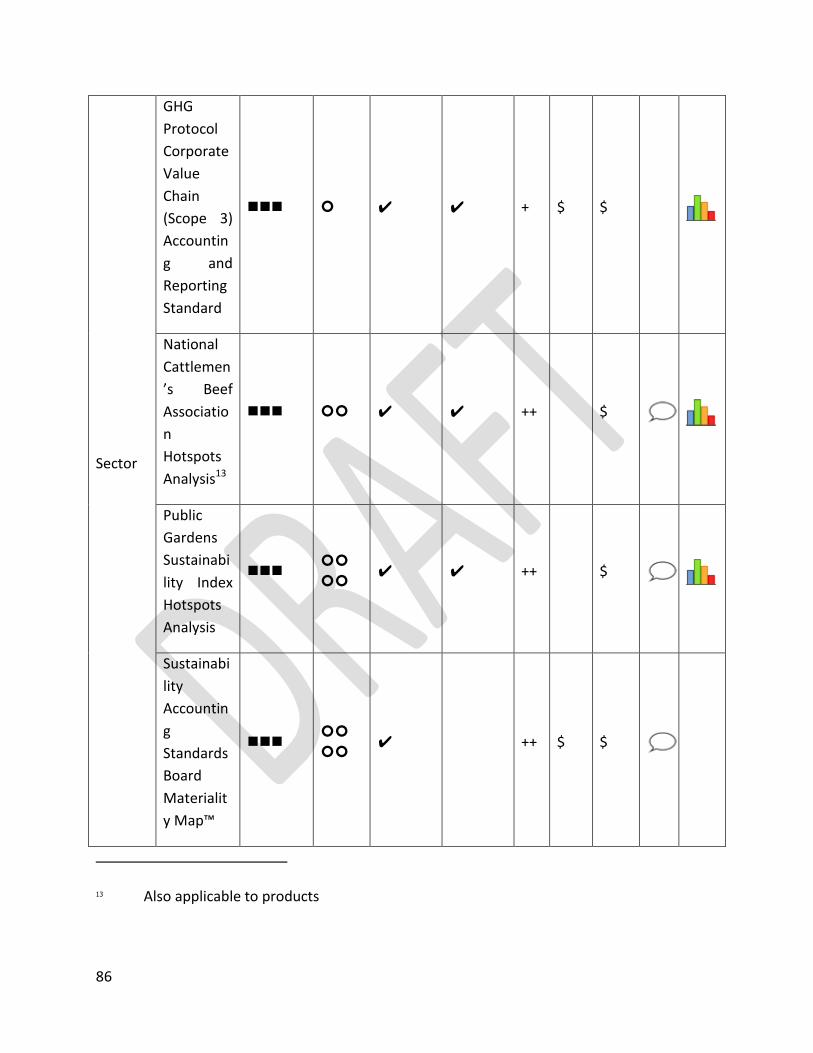
86
Sector
GHG
Protocol
Corporate
Value
Chain
(Scope 3)
Accountin
g and
Reporting
Standard
✔ ✔ + $ $
National
Cattlemen
’s Beef
Associatio
n
Hotspots
Analysis13
✔ ✔ ++ $
Public
Gardens
Sustainabi
lity Index
Hotspots
Analysis
✔ ✔ ++ $
Sustainabi
lity
Accountin
g
Standards
Board
Materialit
y Map™
✔ ++ $ $
13 Also applicable to products
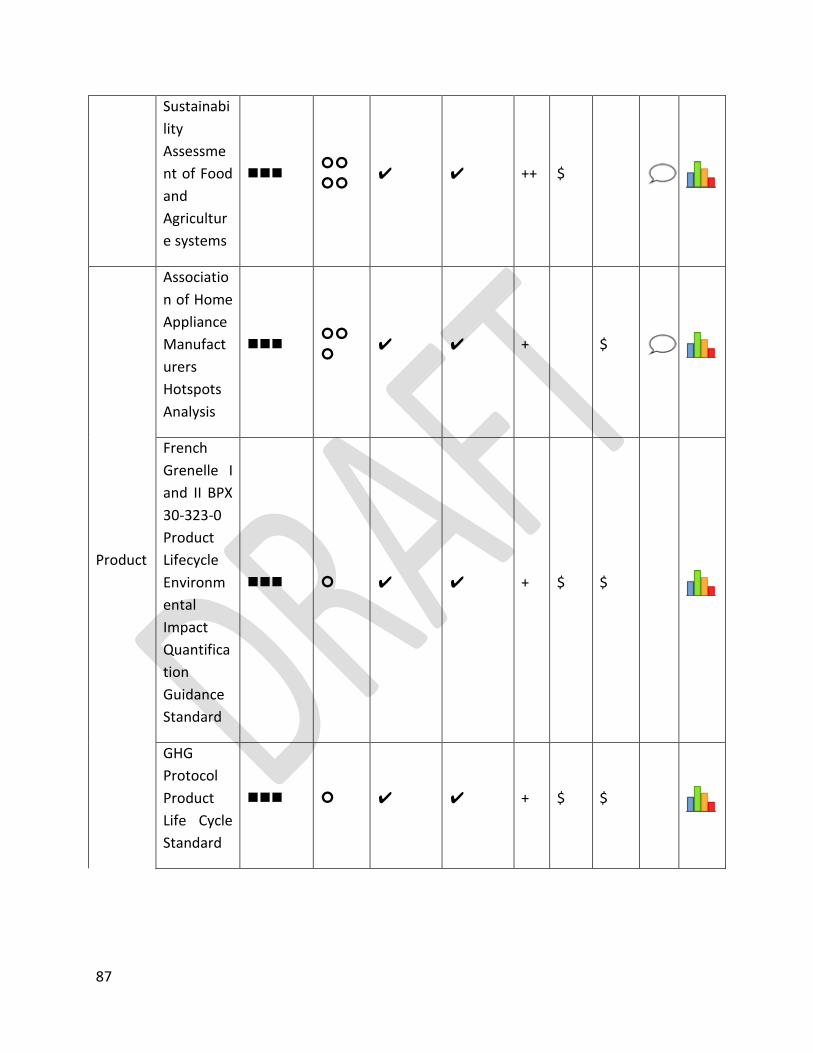
87
Sustainabi
lity
Assessme
nt of Food
and
Agricultur
e systems
✔ ✔ ++ $
Product
Associatio
n of Home
Appliance
Manufact
urers
Hotspots
Analysis
✔ ✔ + $
French
Grenelle I
and II BPX
30-323-0
Product
Lifecycle
Environm
ental
Impact
Quantifica
tion
Guidance
Standard
✔ ✔ + $ $
GHG
Protocol
Product
Life Cycle
Standard
✔ ✔ + $ $
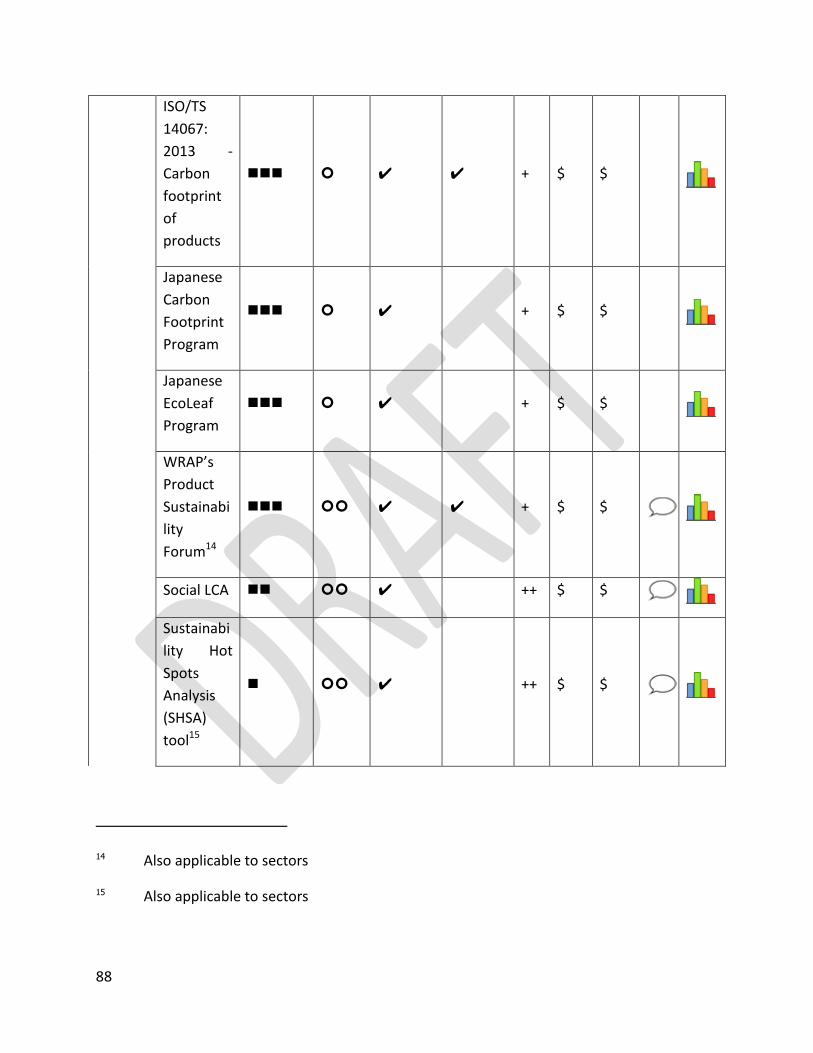
88
ISO/TS
14067:
2013 -
Carbon
footprint
of
products
✔ ✔ + $ $
Japanese
Carbon
Footprint
Program
✔ + $ $
Japanese
EcoLeaf
Program
✔ + $ $
WRAP’s
Product
Sustainabi
lity
Forum14
✔ ✔ + $ $
Social LCA ✔ ++ $ $
Sustainabi
lity Hot
Spots
Analysis
(SHSA)
tool15
✔ ++ $ $
14 Also applicable to sectors
15 Also applicable to sectors
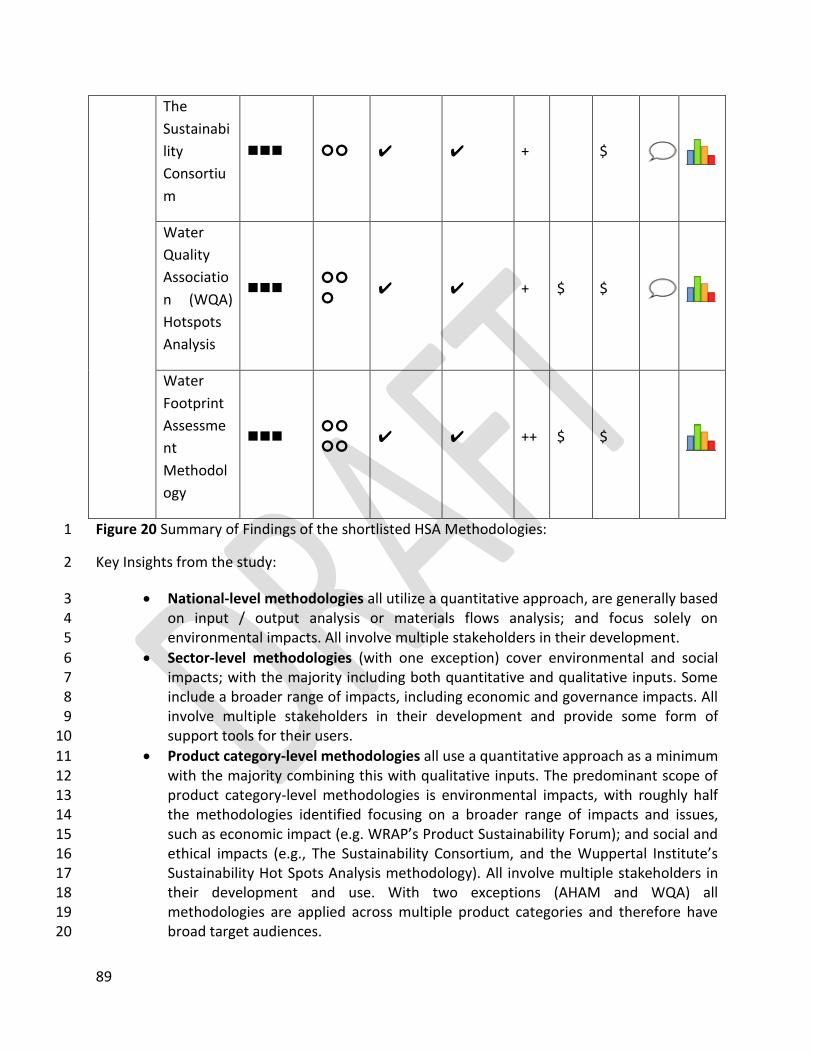
89
The
Sustainabi
lity
Consortiu
m
✔ ✔ + $
Water
Quality
Associatio
n (WQA)
Hotspots
Analysis
✔ ✔ + $ $
Water
Footprint
Assessme
nt
Methodol
ogy
✔ ✔ ++ $ $
Figure 20 Summary of Findings of the shortlisted HSA Methodologies: 1
Key Insights from the study: 2
National-level methodologies all utilize a quantitative approach, are generally based 3 on input / output analysis or materials flows analysis; and focus solely on 4 environmental impacts. All involve multiple stakeholders in their development. 5
Sector-level methodologies (with one exception) cover environmental and social 6 impacts; with the majority including both quantitative and qualitative inputs. Some 7 include a broader range of impacts, including economic and governance impacts. All 8 involve multiple stakeholders in their development and provide some form of 9 support tools for their users. 10
Product category-level methodologies all use a quantitative approach as a minimum 11 with the majority combining this with qualitative inputs. The predominant scope of 12 product category-level methodologies is environmental impacts, with roughly half 13 the methodologies identified focusing on a broader range of impacts and issues, 14 such as economic impact (e.g. WRAP’s Product Sustainability Forum); and social and 15 ethical impacts (e.g., The Sustainability Consortium, and the Wuppertal Institute’s 16 Sustainability Hot Spots Analysis methodology). All involve multiple stakeholders in 17 their development and use. With two exceptions (AHAM and WQA) all 18 methodologies are applied across multiple product categories and therefore have 19 broad target audiences. 20
90
Key stakeholder feedback 1
Feedback from survey respondents, telephone interviews and e-mail exchanges with 2
methodology developers / owners and users has highlighted some key learning points and 3
observations from their experience of existing hotspots methodologies that should be 4
considered in the development of global guidance: 5
‘Beyond LCA’: Most stakeholders were in favour of hotspots analysis methodologies 6 that utilize a mix of quantitative and qualitative analysis to make the analysis more 7 well-rounded, market relevant and able to overcome some of the limitations of 8 traditional LCA approaches 9
Goal and scope clarity: was considered to be critically important to the successful 10 application of any hotspots analysis methodology, including early engagement with 11 key stakeholders. 12
Stakeholder credibility and a phased approach: to the development and application 13 of any hotspots analysis methodology is seen as another important factor; building 14 internal capability, engaging critical friends to review the approach and highlighting 15 quick wins and successes all help to achieve a successful outcome. 16
Keep it actionable and manageable: Stakeholders suggested that it is really 17 important to identify how many hotspots can be practically dealt with at one time. 18 This has implications for how thresholds or materiality criteria are set – i.e., when 19 does an aspect or impact become a hotspot? Clarity of actions required to address 20 the hotspot is also seen as an important component in the development of any 21 methodology. 22
Prioritization and the ‘addressability’ of hotspots: Many stakeholders called for 23 clarity around the nature, scale and location of the hotspot in the sector, product 24 lifecycle or value chain; and how ‘addressable’ they are in the current infrastructure, 25 market, operational or economic context (e.g. ability of the company to influence 26 the hotspot, ease and cost of implementation of solutions to address the hotspot, 27 complexity of the sector or value chain, etc.). In some cases, stakeholders 28 mentioned that it is likely that some form of pre-competitive collaboration would be 29 required to tackle a hotspot – i.e. to share the cost of implementation; agree a 30 common targeted approach; or build and share expertise and capacity and capability 31 to respond.. 32
Make it visual: A number of stakeholders commented on the fact that the clear and 33 intuitive visualisation of hotspots analysis findings is really important to them and 34 particularly to their non-technical colleagues who are faced with making a decision 35 on the actions that they need to take or mandate to address a hotspot. Sector heat 36 maps and product hotspot matrices, synthesized findings in slide deck form, short 37 digestible action plans and searchable libraries of solutions are all considered 38 helpful. 39
Periodic review and revision of hotspots: Stakeholders suggested that hotspot 40 analysis should be revisited and updated periodically to capture any changes that 41
91
take place over time, which could affect the applicability, usability or purpose of the 1 hotspot analysis. 2
Clear communication of uncertainty: A number of stakeholders called for clearer 3 statements of uncertainty in the findings from hotspots analysis; and for the 4 inclusion within hotspots analysis methodology of clear guidance and tools to 5 support the development of data quality, management and analysis protocols, 6 methods for uncertainty testing; clear rules for the communication of assumptions, 7 proxy products or processes and any models used in the analysis. 8
Case studies: Several stakeholders stated that case studies and examples that 9 showed how to apply a methodology were incredibly helpful, particularly when 10 applying the methodology for the first time. One specific example was given for the 11 GHG Protocol Product Standard, which is peppered with case studies from road-12 testing companies to support users of the Standard. 13
14
Versatility and flexibility of hotspots analysis 15
The findings from Phase 1 of this project suggest that hotspots analysis is highly adaptable and 16
flexible, and can be used at a number of different scales or levels (e.g. countries, cities, industry 17
sectors, product portfolios, product categories or individual products) to overcome some of the 18
challenges around managing and applying ‘big data’ and the ever increasing volumes of 19
research findings available to decision-makers. The findings suggest that existing sector-level 20
hotspots analysis have the potential to be applied across multiple sectors of an economy. 21
Similarly, product category-level hotspots analysis methodologies also exhibit the potential to 22
be applied across a range of different product categories. Examples of the sectors that existing 23
hotspots analysis methodologies cover include: food and grocery products, DIY (home 24
improvement) products, textiles and clothing, electrical and electronic products, household 25
appliances, toys and leisure (public gardens). 26
Some hotspots methodologies have been deliberately developed to be iterative in nature, 27
starting by conducting an analysis of the hotspots in a national economy, then selecting priority 28
sectors or cross-cutting hotspots for further analysis; and then identifying and taking action on 29
the priority products and hotspots in product categories (e.g. bakery products) or for groups of 30
similar products within a broader product category (e.g. white bread). Other methodologies can 31
accommodate or be adapted to operate at more than one scale or level of detail. Examples of 32
this approach can be found in the methodologies from WRAPs Product Sustainability Forum 33
(PSF), EU Environmental Impact of Products (EIPRO), Getting the Numbers Right, Social LCA and 34
the Water Footprint Network. 35
Similarly, existing hotspots analysis methodologies are being developed with a number of 36
audiences and sustainability-based applications in mind. Some studies are being used to help 37
government policy-makers to focus voluntary agreements or action plans with industry in areas 38
92
where sustainability hotspots have been identified. For example, as is the case with WRAP‟s 1
Product Sustainability Forum’s work in the UK food chain; the French Government’s work to 2
provide more sustainability information to consumers; or the Water Footprint Network’s 3
analysis of water scarcity hotspots in major river catchments. 4
Businesses are using hotspots analysis to focus their resources, drawing up action plans and 5
practical programmes of work to eliminate, reduce or mitigate hotspots in their global value 6
chains; and tackling major societal and commercial issues like food waste, food and resource 7
security (future supply risk and resilience issues); and water use in agriculture. For example, the 8
work of UK grocery retailer, Tesco, to tackle the food losses and food waste associated with the 9
international sourcing of its products and their use by consumers; and the work of The 10
Sustainability Consortium in building consensus around the key sustainability hotspots to 11
address in consumer goods value chains. 12
In some cases, the scope of hotspots analysis methodologies and studies are broadening 13
beyond consideration of one or more environmental impact categories and including ‘beyond 14
LCA’ approaches and wider sustainability topics like biodiversity management, animal welfare, 15
fair trading arrangements, land use and land use change and governance issues around raw 16
materials (e.g. conflict minerals) or water resources. This development would suggest that both 17
methodology developers and users see the value in securing a more holistic view of hotspots, 18
allowing them to identify where trade-offs may need to be considered (e.g. between traditional 19
intensive agricultural practices and the potential impact on the agri-ecosystems that support 20
them). 21
22


