16
1 Ecological and Economic Considerations in Management of the U.S. Pacific sardine Fishery Samuel F. Herrick Jr NOAA Fisheries Southwest Fisheries Science Center
| Date post: | 16-Dec-2015 |
| Category: |
Documents |
| Upload: | briana-tillotson |
| View: | 218 times |
| Download: | 0 times |
1
Ecological and Economic Considerations in Management of the U.S. Pacific sardine
Fishery
Samuel F. Herrick JrNOAA Fisheries
Southwest Fisheries Science Center

• Report on ongoing work in collaboration with Rognvaldur Hannesson, Norwegian School of Economics and Business Administration and John Field, NOAA Fisheries, Southwest Fisheries Science Center
• Publications:– Hannesson, R., S. Herrick and J. Field. 2009. Ecological and
economic considerations in the conservation and management of the Pacific sardine (Sardinops sagax). Ca. J. Fish. Aquat. Sci. 66: 859-868.
– Hannesson, R. and S.F. Herrick Jr. 2010. The value of Pacific sardine as forage fish. Marine Policy 34: 935–942
2

3
• Account for the total value sardines provide in terms of their function in the California Current Ecosystem
• Basically a matter of balancing the economic benefits from harvesting sardines against the economic benefits from leaving sardines in the water
• At this point – Present the analytical framework for evaluating
the tradeoffs– Show what has been done with existing data– Draw some conclusions
4
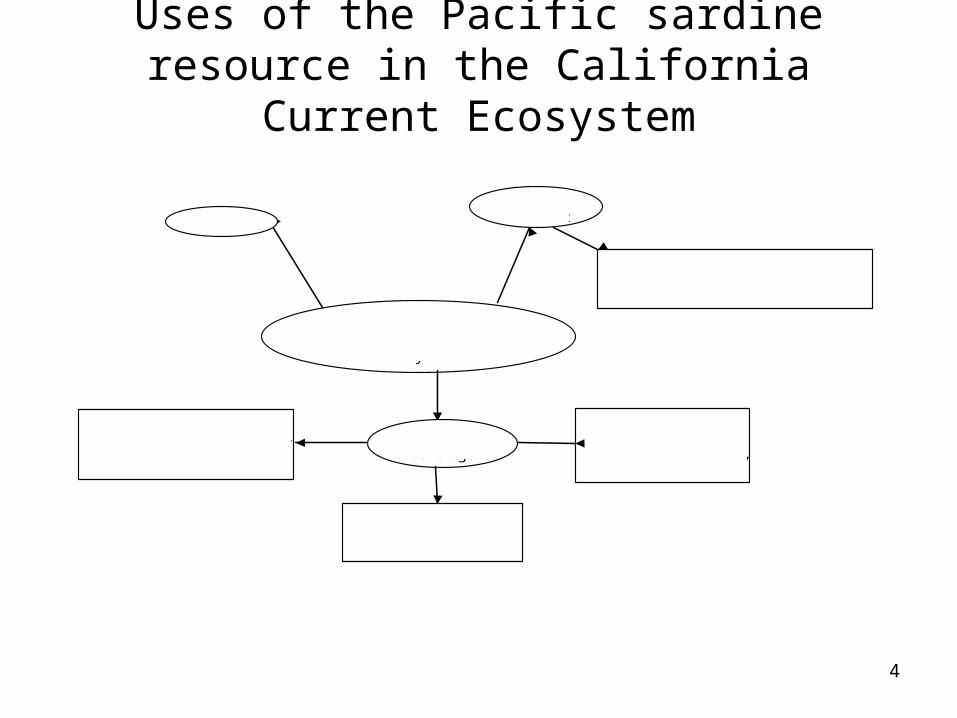
Uses of the Pacific sardine resource in the California Current Ecosystem
Sardine Ecosystem Sevices in the California Current
Ecosystem
- Human Consumption- Bait: commercial, recreational- Aquafeed: fresh/frozen, meal/oil
Forage for commercial predators: salmon, albacore, coastal sharks, whiting
Direct use as harvest
Indirect Use as forage
Forage for recreational predators:salmon, albacore, coastal sharks
Forage for ecologically important species: gulls, orcas, toothed whales, sea lions, fur seals, baleen whales
Other ?

5
• Summarize as follows
Marginal Net Benefit from Harvest
Marginal Net Benefit from Forage
Quantity of Harvest Quantity of Forage
H'
$
$*
6
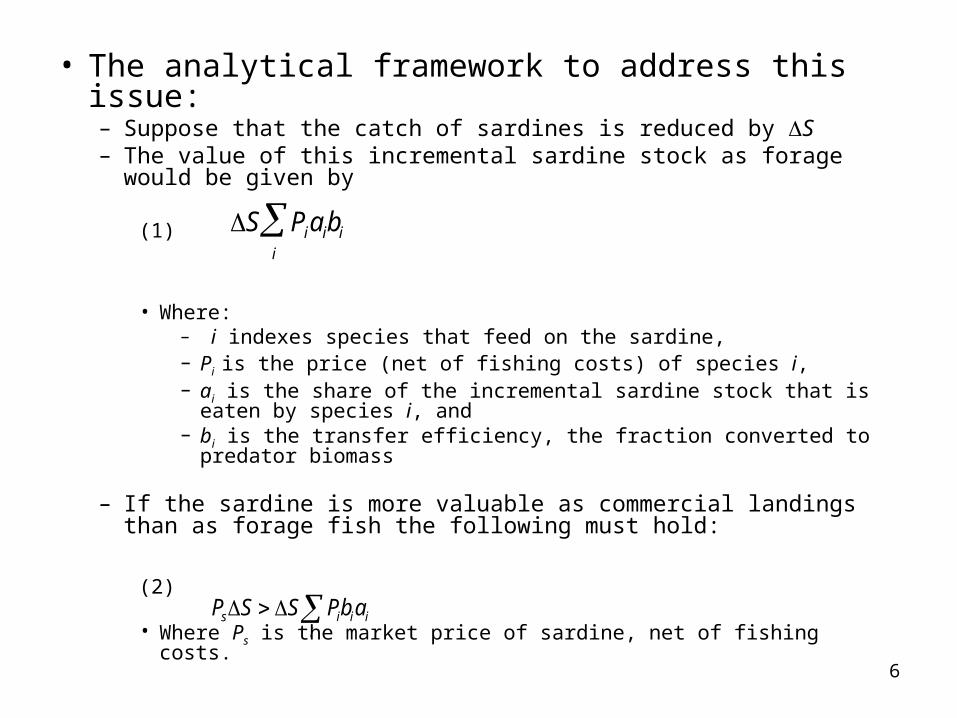
• The analytical framework to address this issue:– Suppose that the catch of sardines is reduced by S– The value of this incremental sardine stock as forage would be
given by
(1)
• Where:– i indexes species that feed on the sardine, – Pi is the price (net of fishing costs) of species i, – ai is the share of the incremental sardine stock that is eaten by
species i, and – bi is the transfer efficiency, the fraction converted to predator
biomass
– If the sardine is more valuable as commercial landings than as forage fish the following must hold:
(2)
• Where Ps is the market price of sardine, net of fishing costs.
s i i ii
P S S Pb a
S Pii
aibi
7
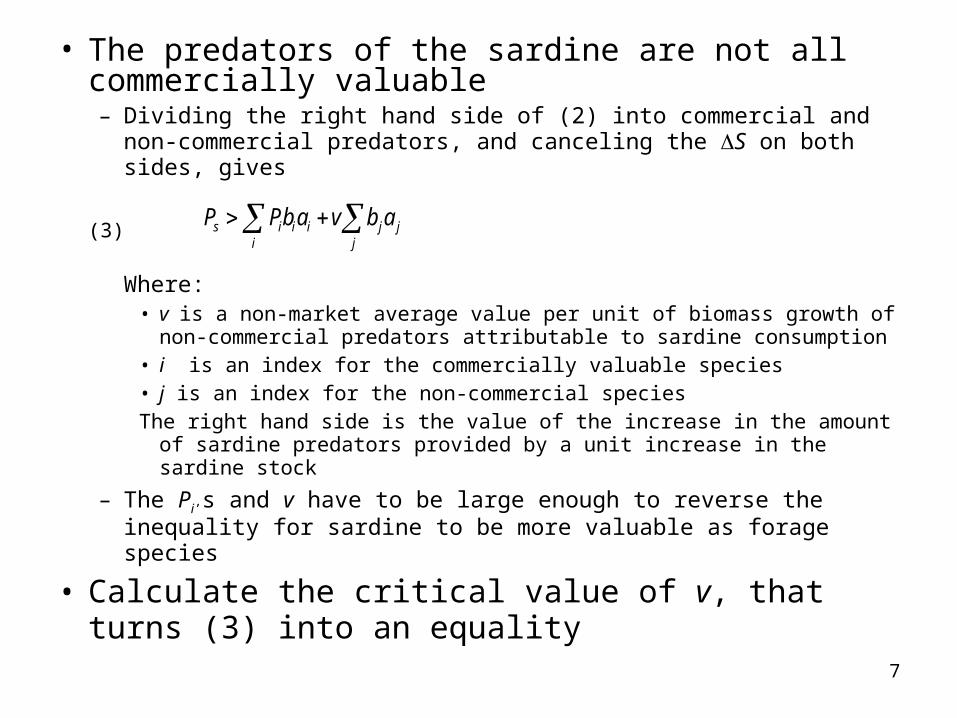
• The predators of the sardine are not all commercially valuable– Dividing the right hand side of (2) into commercial and non-
commercial predators, and canceling the S on both sides, gives
(3)
Where:• v is a non-market average value per unit of biomass growth of non-
commercial predators attributable to sardine consumption• i is an index for the commercially valuable species• j is an index for the non-commercial species The right hand side is the value of the increase in the amount of
sardine predators provided by a unit increase in the sardine stock
– The Pi’s and v have to be large enough to reverse the inequality for sardine to be more valuable as forage species
• Calculate the critical value of v, that turns (3) into an equality
s i i i j ji j
P Pb a v b a

8
• We used the data published in Field et al. (2006) to identify sardine predators and to calculate values for the parameters a and b for each predator k
• Prices, P, are real average exvessel prices over the 1998-2006 period

9
• Critical value of v under different pricing scenarios:1. Base case, v = $6.78/kg
• The annual net benefit of a one kg increase in the biomass of all non-commercial predators induced by the incremental supply of sardines as forage.
2. Five-fold increase in the price of sharks to reflect their potential recreational value: from $1.73 to $8.47/kg, v = $0.0/kg
• The increase in the value of sharks would suffice to make the sardine more valuable as forage.
3. 20% increase in salmon and albacore prices with a 20% decrease in price of sardines, v < $0.0/kg
• These price differences are within the range of prices for the 1998-2002 period, indicating that the value of sardine as forage is quite sensitive to realistic changes in its own price and those of commercially relevant predators.

10
• Critical value of v under different biological/ecological parameter scenarios:
1. Increase the transfer efficiency, b, to .02 for salmon, albacore and coastal sharks, v = $3.81/kg
• A higher transfer efficiency by itself would not make sardine sufficiently valuable as forage for the commercial predators alone at the assumed baseline biological parameter values and exvessel prices.
2. Increase the share of sardines in the diets of salmon, albacore and coastal sharks by 40%,
v < $0.0• If increased consumption of sardines by commercial
predators is realistic, it would imply that the sardine stock is more valuable as forage fish than as commercial catches.

11
• Conclusions:– The total value of forage species is derived from their commercial
harvest value and their value as prey for commercially, recreationally and ecologically important stocks
– To quantitatively model this situation requires a great deal of detailed economic and ecological data
• On the economic side – Market values
» the net benefits of harvesting sardines and their commercial predators rely on market prices and costs associated with their harvest
– Non-market values» recreational catches are not sold» ecologically important species are public goods
• On the ecological side– Identify sardine predators
» the proportion of the sardine biomass that is consumed by each predator» transfer efficiencies
– The relationships that have been modeled here are likely to be non-linear and dependent on the relative abundance of sardines and their predators
– Management strategy likely to vary with the composition of the forage base
• Composition of forage base determined by environment

12

• Species by trophic level and trophic category.
13

14
Regression of the average trophic level of California commercial fishery landings on forage stock biomass, 1932-2009. Stock Coefficient P-value| N P. sardine -1.52e-07 0.000 78 P. mackerel 2.04e-07 0.030 78 N. anchovy 2.08e-07 0.022 46

15
• Ecological data:– Field, J.C., R.C. Francis and K. Aydin. 2006. Top-down modeling
and bottom-up dynamics: Linking a fisheries-based ecosystem model with climate hypotheses in the California Current. Progress in Oceanography 68:238-270.

Predators, ecological parameters, shares of sardine eaten by predators (a), and prices of sardine and its predators.
Predator d S/km2 g b aPrice ($/kg)
Salmon 0.010 0.367 0.930
0.1600
0.13168
3.50
Albacore 0.050 0.014 0.360
0.0500
0.03111
1.76
Coastal sharks 0.050 0.050 0.180
0.0600
0.04630
1.73
Common murres
0.001 0.009 0.100
0.0008
0.00694
Gulls 0.001 0.002 0.120
0.0010
0.00148
Orcas 0.005 0.001 0.020
0.0020
0.00031
Toothed whales
0.050 0.052 0.070
0.0025
0.44939
Sea lions 0.010 0.012 0.074
0.0050
0.01096
Fur seals 0.010 0.006 0.091
0.0025
0.01348
Baleen whales 0.090 0.075 0.037
0.0050
0.30834
Sardine 0.663 0.10


